


The prevalence of child obesity is increasing rapidly worldwide(Reference Dehghan, Akhtar-Danesh and Merchant1). With the recent economic development and lifestyle changes in China, childhood obesity is becoming a major public health concern(Reference Ji2–Reference Ji and Chen4). BMI values are often used to define overweight and obesity in children(Reference Cole, Bellizzi and Flegal5–Reference Must, Dallal and Dietz7). The International Obesity Task Force (IOTF) has established a standard definition of child overweight and obesity worldwide(Reference Cole, Bellizzi and Flegal5), while the Working Group on Obesity in China (WGOC) has proposed the national BMI cut-off values for screening overweight and obesity in Chinese school-age children(Reference Ji6). The 85th and 95th percentiles of BMI are frequently used as cut-off points to define overweight and obesity(Reference Ji6, Reference Must, Dallal and Dietz7). Because China is in a phase of nutritional and lifestyle transition, the BMI percentiles in Chinese children are likely to shift upward and this trend will continue. Therefore, it is vital to establish an updated BMI reference for Chinese children. As the Chinese National Survey on Students' Constitution and Health (CNSSCH) has been conducted on a regular basis once every 5 years, with large nationally representative samples, the updated BMI references are useful for monitoring the whole spectrum change of BMI distribution in Chinese children.
Recently, the WHO released the newly constructed growth references for school-age children, the WHO 2007 references(Reference de Onis, Onyango and Borghi8), while the US Centers for Disease Control and Prevention (US CDC) released updated growth charts – the US CDC growth charts(Reference Kuczmarski, Ogden and Grummer-Strawn9, Reference Kuczmarski, Ogden and Guo10). Both include BMI percentiles for school-age children. These percentiles reflect BMI distributions in the reference populations. Understanding the differences in BMI distributions between Chinese and reference populations is important for interpreting the prevalence of obesity among Chinese children calculated using different references. The extreme values of BMI in either direction (obese or underweight) are of major public interest in both developed and developing countries. Therefore, comparing BMI distributions between Chinese children and their counterparts in the reference populations provides evidence on relative proportions of extreme BMI values. The data are useful for prioritising major public health issues and for developing school nutrition programmes in China. The findings are also relevant to other developing countries undergoing a similar rapid nutritional and lifestyle transition.
The aims of the present study were to establish BMI percentile curves for Chinese children aged 7–18 years, and to compare BMI percentiles of Chinese children with those in two reference populations: the WHO references(Reference de Onis, Onyango and Borghi8) and the CDC charts(Reference Kuczmarski, Ogden and Grummer-Strawn9, Reference Kuczmarski, Ogden and Guo10).
Materials and methods
The CNSSCH was conducted between September and November 2005 with a nationally representative sample(Reference Ji and Cheng3). The detailed sampling procedures of this survey have been described previously by Ji and Cheng(Reference Ji and Cheng11). The present study included 232 140 participants who were school students aged 7–18 years randomly selected in thirty provinces, municipalities and autonomous regions in China. The participants were free from overt physical or mental illness. Table 1 shows the number of participants by age and sex.
Table 1 Number of study participants by age and sex
Measurements
Standard procedures were followed to measure body height and weight, with participants wearing light clothes only and no shoes(Reference Ji and Cheng11, Reference Cameron12). All field workers at all centres had been trained according to the uniform protocols for anthropometric measurements before data collection. Weight was measured to the nearest 0·1 kg with a standardised scale and height to the nearest 0·1 cm with a portable stadiometer. The stadiometers were calibarated before the commencement of the survey and the scales were calibarated on a daily basis. One stable reading was recorded for each anthropometric measurement. BMI was calculated as body weight (kg) divided by height (m) squared (kg/m2).
Statistical analysis
Sex-specific percentile curves for BMI were constructed by using the LMS method developed by Cole and Green(Reference Cole and Green13). Details of this method and its application have been described in the literature(Reference Cole, Bellizzi and Flegal5, Reference Cole and Green13–Reference Cole15). We calculated and presented the smoothed M (μ for the median), S (σ for the coefficient of variation) and L (λ for the power in the Box–Cox transformation) values for each age- and sex-specific point. The BMI percentile for a specific age and sex group was calculated as M(1 + LSZ)1/L(Reference Cole, Freeman and Preece16), where Z is the Z-score that corresponds to the percentile. We presented the following BMI percentile curves for Chinese children: 3rd, 5th, 10th, 15th, 25th, 50th, 75th, 85th, 90th, 95th and 97th. For the purpose of comparison, we plotted the 5th, 50th and 95th percentiles of Chinese children against the corresponding values in the US CDC and the WHO references. The CDC and the WHO BMI percentile values were obtained from the CDC website (http://www.cdc.gov/growthcharts/percentile_data_files.htm) and the WHO website (http://www.who.int/growthref/en/), respectively. All analyses were conducted by using Stata 10(17).
Results
Among 232 140 participants, 50·3 % (116 676) were boys and 49·7 % (115 464) were girls. Figure 1 shows the smoothed BMI percentile curves for Chinese girls and boys aged 7–18 years. The 3rd, 5th, 10th, 15th, 25th, 50th, 75th, 85th, 90th, 95th and 97th percentiles were included. Any other percentile values that are not presented in Fig. 1 can be derived using the smoothed L, M and S values shown in Tables 2 and 3.

Fig. 1 BMI percentiles for Chinese (a) girls and (b) boys aged 7–18 years
Table 2 BMI-for-age charts, LMS parameters and selected smoothed BMI percentiles (girls)

Table 3 BMI-for-age charts, LMS parameters and selected smoothed BMI percentiles (boys)
Figure 2 compares the BMI curves for boys and those for girls. The shapes of the two curves are different. Before 12 years of age, all percentile values were higher for boys than for girls. After 12 years of age, the upper percentiles for boys remained above those for girls, while the lower percentiles overlapped.

Fig. 2 Comparison of the BMI percentile curves for boys (––)and girls (—)
Figure 3 compares BMI percentile curves of Chinese children with those of the US CDC reference. Percentile curves in the two populations are dramatically different. All BMI percentiles for Chinese girls are substantially and consistently lower than the corresponding values in the CDC reference throughout the age range, particularly the higher percentiles for those older than 14 years of age. The largest disparities between the two populations were 0·85, 1·2 and 5·6 kg/m2 for the 5th, 50th and 95th percentiles, respectively. For boys, there was little difference in the 50th percentile between the two populations before 12 years of age. After 12 years of age, Chinese boys had a lower 50th percentile and the difference increased with increasing age (1·8 kg/m2 at 18 years). Importantly, in the younger age groups (<12 years), the high (95th) percentile values for Chinese boys were higher than those for the CDC reference, with the largest disparity of 0·76 kg/m2. Simultaneously, the same age group of Chinese boys had lower values for the low (5th) percentile, with the largest difference of 1·44 kg/m2. In other words, the younger Chinese boys had more extreme BMI values in both directions than their counterparts in the US CDC reference population.
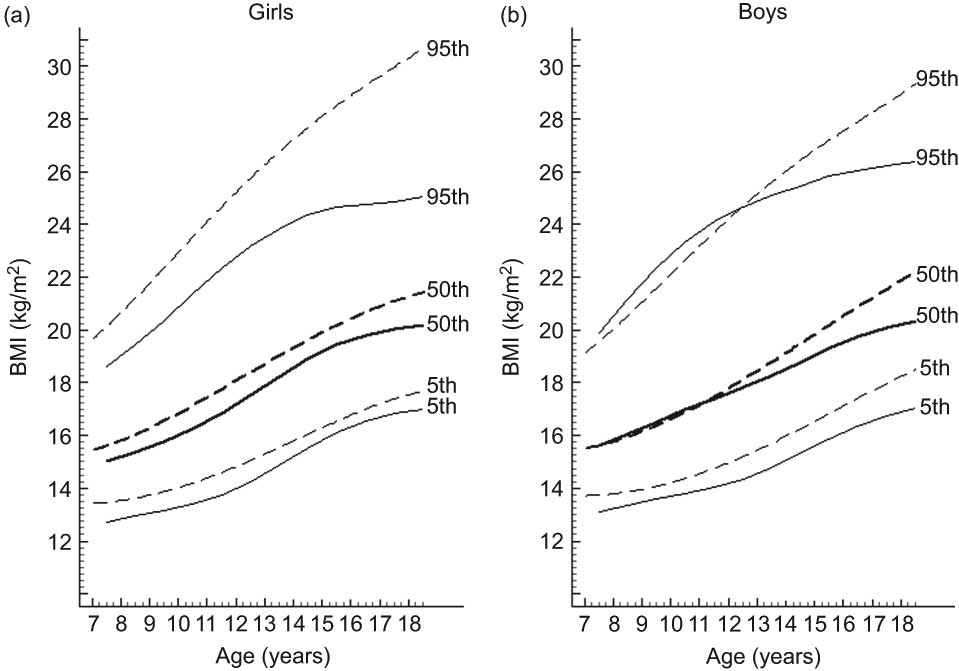
Fig. 3 Comparison of the Chinese (—) and the US CDC 2000 (– –)(Reference Kuczmarski, Ogden and Grummer-Strawn9) BMI percentiles for (a) girls and (b) boys aged 7–18 years; US CDC, US Centers for Disease Control and Prevention
Figure 4 compares the Chinese and the WHO BMI percentile curves. Similar to the comparison with the US CDC reference, Chinese girls had lower values in all percentiles, whereas younger Chinese boys had more extreme BMI values in both directions. Younger Chinese boys (13 years or younger) had higher values for the 95th percentile, with the largest disparity of 2·7 kg/m2, and they had lower values for the 5th percentile with the largest disparity of 0·81 kg/m2. In older age groups (>14 years), Chinese boys had lower values of all percentiles.
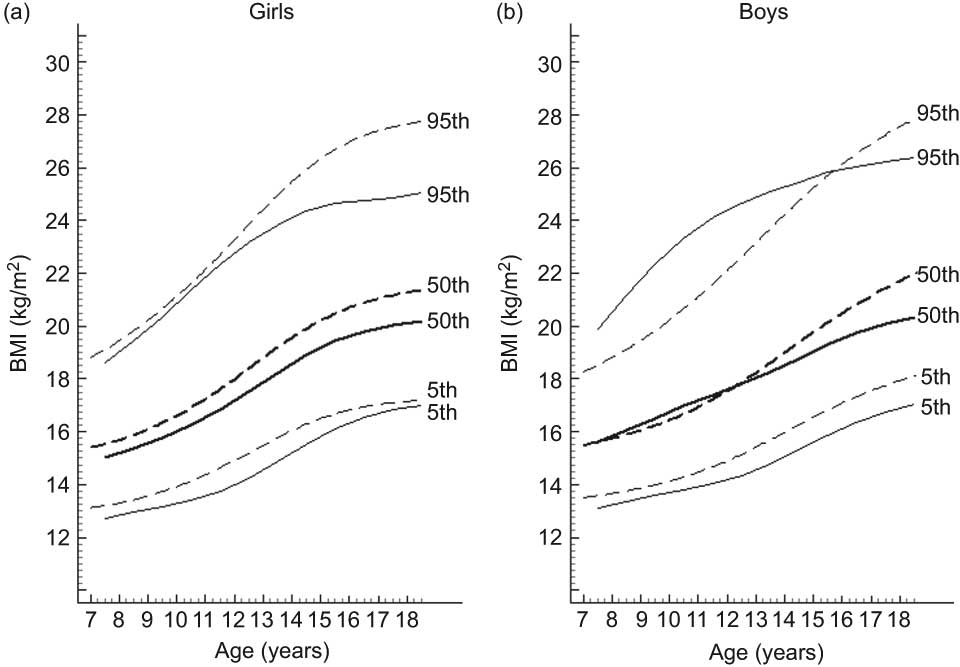
Fig. 4 Comparison of the Chinese (—) and the WHO (– –)(Reference de Onis, Onyango and Borghi8) BMI percentiles for (a) girls and (b) boys aged 7–18 years
Discussion
The current paper presents BMI percentile curves for Chinese children aged 7–18 years based on a large nationally representative sample. These curves represent the current overall BMI distribution in China at the national level, and are useful as a reference for regional comparisons and for monitoring BMI changes over time. Importantly, we found that the current BMI distributions in China are substantially different from those of the WHO and the US CDC references. All BMI percentiles in Chinese girls are lower than those in the WHO and the US CDC references. Younger Chinese boys had higher proportions of extreme BMI values in both directions than the two international reference populations. This implies that Chinese children are currently facing the coexistence of high prevalences of underweight and obesity simultaneously. Therefore, public health strategies need to tackle both undernutrition and obesity issues in China.
As China is in a phase of nutritional transition, the average rates of consumption of all animal foods and the proportions of animal protein and fat as a percentage of energy have increased in recent years(Reference Zhai, Wang and Du18, Reference Du, Lu and Zhai19). Accompanied by increased energy intake and decreased physical activity among Chinese children(Reference Cheng20), the prevalence of overweight and obesity has also increased rapidly in the past two decades(Reference Ji2, Reference Ji and Cheng3, Reference Ma and Wu21). Overweight and obesity in childhood have been found to be associated with metabolic syndrome(Reference Li, Yang and Zhai22). However, defining obesity for children is still a difficult task. Applying different definitions of the WHO(Reference de Onis, Onyango and Borghi8), the IOTF(Reference Cole, Bellizzi and Flegal5) and the WGOC(Reference Ji6) to Chinese children aged 7–17 years, Li et al.(Reference Li, Hu and Jing23) found that the prevalence of obesity varies using different definitions. They suggest that the WGOC definition is preferred ‘since the appropriateness of the WGOC reference was verified by the disease risks in the 2002 survey’(Reference Li, Hu and Jing23). Other studies in China also support the use of the WGOC reference(Reference Ma, Li and Hu24, Reference Xu and Ji25).
The WGOC overweight and obesity cut-off points were established according to modified age- and sex-specific 85th and 95th percentile values(Reference Ji6). The 85th and 95th percentiles in our study for older age (16–18 years) groups are lower than those in the WGOC reference. A possible explanation for this disparity is that the WGOC reference was based on data from large cities in China(Reference Ji6). BMI levels are generally higher in large cities than in other regions(Reference Ji and Cheng3, Reference Ji and Cheng11) and are therefore likely to be higher than the national levels. As the BMI distribution is currently shifting upward in China, the 85th and 95th percentiles are expected to increase with time. This has raised a question about the appropriateness of using the 85th and 95th percentiles of BMI to define overweight and obesity in children. We do not propose to lift BMI cut-off values for defining overweight and obesity in children according to the currently increased BMI levels. Ideally, BMI cut-offs for overweight and obesity should be determined according to the association between BMI and health outcomes. Therefore, we consider the percentile curves in this paper as a reference and not standards. Due to the inconsistency in overweight and obesity definitions for children, it is critical to present BMI distributions in addition to the prevalence of overweight and obesity when comparing the nutrition status among different regions and monitoring the changes over time. The BMI percentiles presented in the current study provide useful baseline data for observing future changes in nutritional status among Chinese children.
Our data show that the BMI growth patterns in Chinese children are dramatically different from those of the US CDC and WHO references. At the national level, larger proportions of younger Chinese children have extreme BMI values in both directions. Although the prevalence of obesity is increasing rapidly, undernutrition remains a major public health issue. A recent study of younger Chinese children (<5 years) in the mid-west provinces of China shows a high prevalence of underweight and stunting using the WHO standards(Reference Wang, Hojer and Guo26). The coexistence of both undernutrition and obesity in Chinese children at the country level has important public health implications. Similar coexistence of undernutrition and obesity has been reported in the literature in some subpopulations in developed countries(Reference Armstrong, Dorosty and Reilly27), as well as in other developing countries(28). It is interesting that this phenomenon is apparent in younger boys in our study. Although further research is required to understand the causes, the huge regional variation in nutritional status in China may be a contributing factor. The regional variations in BMI levels and the prevalence of obesity are well documented in both Chinese adults(Reference Zhuo, Wang and Piao29) and children(Reference Ji and Cheng3, Reference Ji and Cheng11). China is a large country with different levels of economic development(Reference Zhuo, Wang and Piao29). Although economic status is strongly associated with the prevalence of obesity, the geographic variations cannot be fully explained by the differences in economic status in adults(Reference Zhuo, Wang and Piao29). Other contributing factors include differences in climate, diet, physical activity and possibly genetic composition.
As the percentile curves were established using cross-sectional data, the pattern may not truly reflect how BMI change with age. This is a major limitation of the present study. The observed pattern could be due to a cohort effect. For example, the current 18-year-old boys might have had lower BMI when they were 10 years old than the current 10-year-old boys. In addition, the current 10-year-old boys may have higher BMI levels when they reach 18 years of age than the current 18-year-old boys. This can only be assessed using prospective cohort data.
In conclusion, our analysis provides BMI percentile curves for Chinese children aged 7–18 years. These curves are dramatically different from those in the WHO and US CDC references. It was found that Chinese girls had lower BMI percentiles. Young Chinese boys had higher proportions of extreme values in both directions, whereas older boys had lower BMI percentiles than their counterparts in the WHO and the US CDC reference populations.
Acknowledgements
The present study was supported by a grant from the National Health and Medical Research Council of Australia (NHMRC, 511013) to Z.W. The authors have no conflict of interest. J.M., Y.S., P.H. and B.Z. conducted the research. J.M. and Z.W. conceived and designed the paper, analysed the data and prepared the draft. All authors read and approved the final paper. The authors thank W.K. Liao, W.H. Xing, X. Zhang and the members of the Chinese National Survey on Students’ Constitution and Health for providing access to the survey data.


