


Accurate assessment of dietary intake is essential in nutritional research. While the doubly labelled water method is recognized as the gold standard for studies of energy intake (EI)(Reference Hill and Davies1), feasibility and financial restraints often prevent its implementation. Most dietary intake studies rely on 24 h dietary recalls, diet diaries or FFQ. All these methods are prone to misreporting of EI with under-reporting being particularly frequent(Reference Black and Cole2). Moreover, the level and direction of misreporting vary by data collection tool and the population under observation(Reference Scagliusi, Ferriolli and Pfrimer3, Reference Tooze, Vitolins and Smith4). Misreporting can be approximated with acceptable sensitivity using a method developed by Goldberg et al.(Reference Goldberg, Black and Jebb5), which uses the level of discrepancy between (i) the ratio of EI to BMR (EI:BMR) and (ii) physical activity level (PAL) as a proxy for likely under-, acceptable or over-reporting of EI. The sensitivity of this method depends on the accuracy of PAL. Specifically, lack of adjustment for a non-sedentary lifestyle decreases sensitivity and may result in misclassification of up to 50 % of the study population(Reference Black6).
BMI, sociodemographic and psychosocial determinants have an impact on the accuracy of EI reporting. Under-reporting is more prevalent among individuals who are overweight/obese, older, lower educated and depressed(Reference Bedard, Shatenstein and Nadon7–Reference McGowan, Harrington and Kiely13). Furthermore, certain food groups, in particular ‘socially undesirable’ foods high in fats and sugars, are often misreported(Reference Johansson, Wikman and Ahren12, Reference Scagliusi, Ferriolli and Pfrimer14–Reference Herbert, Clemow and Pbert16). Under-reporting also tends to be associated with higher micronutrient intake densities(Reference Livingstone and Black17, Reference Voss, Kroke and Klipstein-Grobusch18). There is limited research addressing factors associated with over-reporting(Reference Tooze, Vitolins and Smith4, Reference Ferrari, Slimani and Ciampi8, Reference Livingstone and Black17, Reference Mendez, Wynter and Wilks19–Reference Mattisson, Wirfalt and Aronsson22), though this may be the product of over-reporting being less prevalent or lack of information on physical activity. Over-reporting has been shown to be associated with younger age, low BMI scores, the desire to gain weight and smoking(Reference Johansson, Solvoll and Bjorneboe20, Reference Mattisson, Wirfalt and Aronsson22). Most studies, however, specifically focus on associations with under-reporting only.
The objectives of the present study were: (i) to estimate the extent of both under- and over-reporting in the Irish adult population; (ii) to examine associations with sociodemographic and lifestyle characteristics and mental health status; and (iii) to identify differential reporting of micro- and macronutrient intake and quality of diet.
Methods
Participants
The Survey of Lifestyle, Attitudes and Nutrition is a nationally representative survey of Irish adults that was completed in 2007. The objective was to collect nationally representative data on overall well-being, social and behavioural health and health service utilization. Details of the methodology have been presented elsewhere(Reference Morgan, McGee and Watson23, Reference Harrington, Perry and Lutomski24). In brief, non-institutionalized adults aged 18 years and above were recruited using multi-stage probability sampling. Overall, 10 364 participants (62 % total response) completed the main lifestyle questionnaire, of whom 9223 (89 %) also completed a semi-quantitative FFQ. For the purposes of the present study, participants who did not complete an FFQ or were missing vital information, including sex, age, physical activity and self-reported anthropometric measurements, were excluded from the study. This resulted in a final sample size of 7521, whose distribution of characteristics reflected the overall study population.
Measurement of misreporting
Misreporting was determined using Goldberg’s method, which uses the level of discrepancy between the ratio of EI to BMR and PAL to broadly classify participants as being likely under-, accurate or over-reporters(Reference Goldberg, Black and Jebb5). This method is widely used to identify the extent of misreporting from dietary surveys with reasonable accuracy. Meta-analysis comparing the accuracy of Goldberg’s estimates to doubly labelled water results determined a sensitivity of 0·74 and 0·67 and a specificity of 0·97 and 0·98 for men and women, respectively(Reference Black25).
In the present study, participants whose mean reported EI:BMR ratio fell below the minimum or above the maximum thresholds derived using Goldberg’s method were labelled as under-reporters or over-reporters, respectively. To determine these thresholds, the following formulas were applied.

where sdmax and sdmin represent the upper and lower sd cut-off limits of the EI:BMR distribution and may equal 2 sd (95 % CI) or 3 sd (99·7 % CI). It is statistically improbable that EI:BMR values above or below these limits are due to chance alone. Analyses were performed with both cut-off limits. For individual assessments, n equals 1, while for population-level assessments n equals the sample size; in the present analysis, individual-level assessment was performed. The constant 17·24 was proposed by Black(Reference Black6). This derivation accounts for the number of days of diet assessment (∞ in the case of an FFQ), the within-subject variation in EI (23 %), BMR (8·5 %) and the total between-subject variation in PAL (15 %); EI, BMR and PAL are calculated as described below.
Energy intake
EI was assessed by a self-administered Willett FFQ composed of 150 food items, which was adapted from the EPIC study(Reference Riboli and Kaaks26) and validated on the Irish population(Reference Harrington27). Participants were asked how frequently they consumed a standard serving of each food item during the past year and were provided with eight mutually exclusive options ranging from ‘never or less than once per month’ up to ‘>6 per day’. Standard serving sizes were based on McCance and Widdowson(Reference McCance and Widdowson28). Reported dietary intake was converted into nutrient values using the FFQ Software version 1·0(29) developed by the Irish National Nutrition Surveillance Centre.
BMR
Schofield’s equations were used to estimate BMR based on gender, age and self-reported weight(Reference Schofield30).
Physical activity level
PAL is defined as the ratio of total energy expenditure to BMR(Reference Goldberg, Black and Jebb5). PAL values proposed by the FAO/WHO/UN University were inserted in the formula(31). These values are sex-specific and divided into three categories of energy expenditure: light, moderate or heavy (men: 1·55, 1·78 and 2·10; women: 1·56, 1·64 and 1·82, respectively). To determine which PAL category was most accurate for an individual, self-reported physical activity was determined using the International Physical Activity Questionnaire score(Reference Booth32). Light energy requirement was defined as <5000 steps per day, moderate as 5000–10 000 steps per day and heavy as >10 000 steps per day.
Determinant variables
Misreporting of EI was examined by several lifestyle, sociodemographic and psychological characteristics. BMI scores from self-reported height and weight measurements were calculated, and participants were categorized as underweight, normal, overweight and obese (<18·5, 18·5–24·9, 25·0–29·9 and ≥30·0 kg/m2, respectively). Self-perceived weight status was also examined, where participants identified themselves as ‘too light’, ‘just about right’, ‘too heavy’ or ‘not sure’ given their height and age. Social class was determined using the European Socio-economic Classification system, which is based on occupational status and was designed to ensure comparability across European countries(Reference Harrison and Rose33). Social class was condensed into four class categories: upper, upper-middle, lower-middle and lower. Probable diagnosis of depression and generalized anxiety disorder was determined using the Composite International Diagnostic Interview Short Form version 1·1 developed by WHO(34). Full details on mental health and social well-being within this population have been presented elsewhere(Reference Barry, Van Lente and Molcho35). Weight management, smoking status and alcohol use were also analysed.
Dietary habits, nutrient consumption and quality of diet
Data on dietary habits (frequency of fast-food consumption, salt use and snacking) were examined across levels of misreporting. Macronutrients were shown as a percentage of total EI. Differences in micronutrient densities were expressed by the ratio of intake per MJ of energy among participants who likely under- or over-reported to those with accurate EI. To determine the quality of diet among under-, accurate and over-reporters, a dietary score was constructed based on the Dietary Approaches to Stop Hypertension (DASH) diet. This type of diet promotes consumption of whole grains, fruits, vegetables, lean meats and low-fat dairy products and limited consumption of fats and sugars. The DASH diet has been shown to be a protective against elevated blood pressure and LDL cholesterol levels and thus ultimately CVD(Reference Appel, Moore and Obarzanek36). A DASH score was constructed according to methods developed by Fung et al.(Reference Obarzanek, Sacks and Vollmer37). For each food group, reported consumption was divided into quintiles and participants were ranked according to their intake on a scale of one to five. Frequent consumption of healthy food items received a higher score, while frequent consumption of unhealthy food items received a lower score. The sum of scores resulted in an overall DASH score, which was divided into three categories for this analysis.
Analysis and statistical methods
Statistical analyses were conducted using the Statistical Package for Social Sciences statistical software package version 15·0 (SPSS Inc., Chicago, IL, USA). To determine the national prevalence of misreporting, the sample was weighted by sex, age, marital status, education, occupation, region, household size and ethnicity based on figures from the 2006 Irish Census. For all other analyses, weighting was not applied. Significant differences in the means for continuous variables were evaluated using one-way ANOVA with a Bonferroni correction. For categorical variables, χ 2 tests were applied. Differences in DASH scores by reporting level were identified with a Kruskal–Wallis test. Unadjusted OR were calculated to assess associations between individual determinants and misreporting and compared the odds of under-reporting (or over-reporting) v. accurate reporting. Collinearity between self-perceived weight status and self-reported BMI was examined using Kendall’s τ test and the two variables were not highly correlated (τ = 0·58). Logistic regression was performed to assess multivariate associations for all determinants under review. All results are stratified by gender due to significant differences (P < 0·001) in the distribution of under- and over-reporting.
Results
Prevalence of likely under- and over-reporting
The distribution of sociodemographic, physiological and psychosocial characteristics by sex is shown in Table 1. Using 95 % CI, one-third (33·2 %) were classified as under-reporters, and 11·9 % were classified as over-reporters; using 99 % CI, these values decreased to 18·3 % and 6·3 %, respectively. Misreporting identified using 99 % CI displayed similar patterns to those based on 95 % CI (results not shown); therefore, subsequent results are only shown for the latter. Men were significantly (P < 0·001) more likely to be under-reporters than women (45·0 % v. 21·9 %), while women were more likely (P < 0·001) to be over-reporters (17·3 % v. 6·3 %).
Table 1 General characteristics of study participants, SLÁN 2007
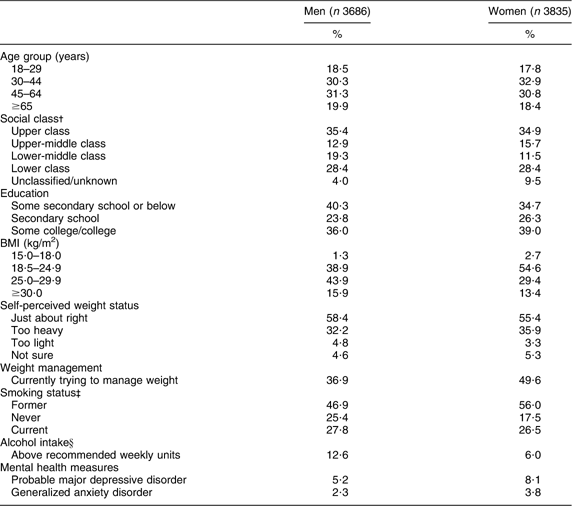
SLÁN, Survey of Lifestyle, Attitudes and Nutrition.
†Social class determined by the European Socio-economic Classification system. Upper class: large employers, professional, managers; upper-middle class: intermediate, lower supervisory occupations and technicians; lower-middle class: self-employed and small employers; lower class: lower sales/service, lower technical and routine occupations.
‡Former smoker reported smoking at least 100 cigarettes. Smokers were identified as individuals smoking some days or every day.
§Standard unit of alcohol is equivalent to a half pint of beer, a single measure of spirits or a single glass of wine, sherry or port. Recommended weekly units are ≤21 for men and ≤14 for women.
Associations between sociodemographic and lifestyle characteristics, mental health status and misreporting
Unadjusted and adjusted OR are shown in Tables 2 and 3. In Table 3, only variables that maintained a significant outcome are presented. Among men, the odds of under-reporting were highest among those aged 45–64 years and over-reporting was most prevalent within the youngest age group. Among women, both under- and over-reporting were associated with the youngest age group. In general, under-reporters were more likely to have a higher social class standing while the converse was true for over-reporters. However, none of the associations remained significant in the adjusted model. Low educational attainment decreased the odds of under-reporting and increased the odds of over-reporting among men in both the univariate and multivariate analysis, although the results varied for women. The odds of under-reporting were greatest among the obese and participants who perceived themselves to be ‘too heavy’. Over-reporting was most common among participants with a normal BMI and women who were underweight. Participants who were ‘unsure’ of their weight status and women who perceived themselves as ‘too light’ had greater odds of over-reporting. Participants who reported that they were currently trying to manage their weight had greater odds of under-reporting and lesser odds of over-reporting. Female current smokers had the greatest odds of being an over-reporter; smoking was not significant in the adjusted model. There were no significant differences of reporting levels by alcohol consumption. As an individual determinant, probable major depressive disorder increased the odds of under-reporting among women, though this finding was no longer significant after adjustment. There were no clear patterns in differences of reporting levels by generalized anxiety disorder. Mental health outcomes did not appear to influence over-reporting.
Table 2 Unadjusted OR by select determinants for under- or over-reporting v. accurate reporting, SLÁN 2007
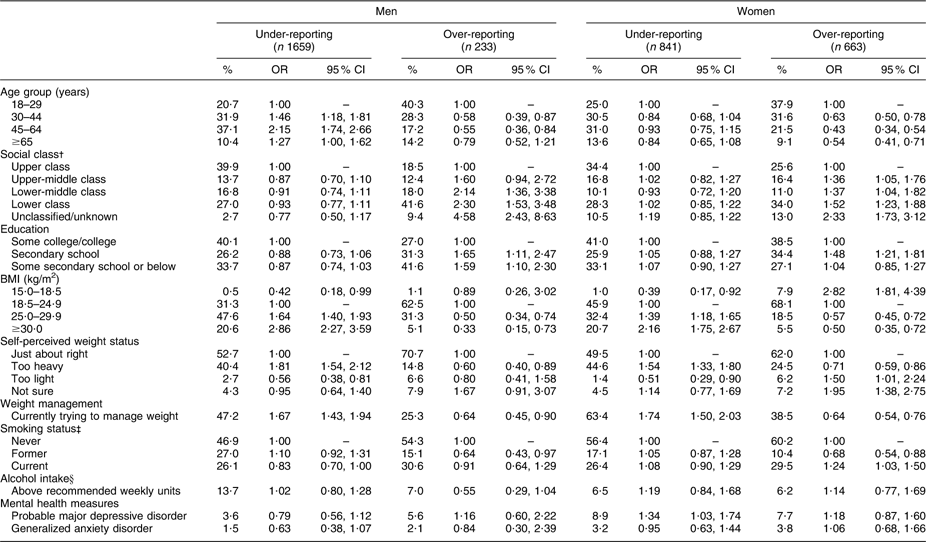
SLÁN, Survey of Lifestyle, Attitudes and Nutrition.
†Social class determined by the European Socio-economic Classification system. Upper class: large employers, professional, managers; upper-middle class: intermediate, lower supervisory occupations and technicians; lower-middle class: self-employed and small employers; lower class: lower sales/service, lower technical and routine occupations.
‡Former smoker reported smoking at least 100 cigarettes. Smokers were identified as individuals smoking some days or every day.
§Standard unit of alcohol is equivalent to a half pint of beer, a single measure of spirits or a single glass of wine, sherry or port. Recommended weekly units are ≤21 for men and ≤14 for women.
Table 3 Adjusted OR by select determinants for under- or over-reporting v. accurate reporting, SLÁN 2007Footnote †
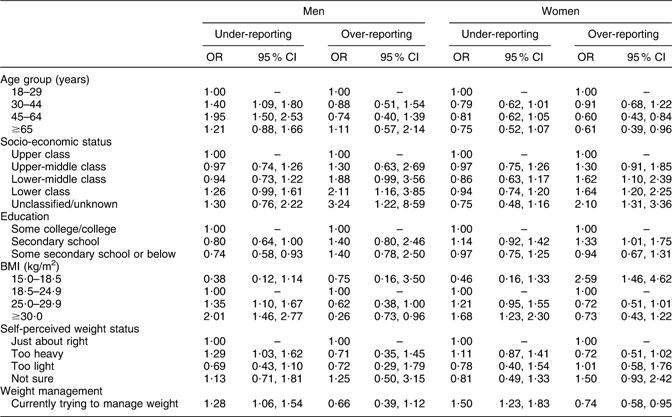
SLÁN, Survey of Lifestyle, Attitudes and Nutrition.
† Adjusted for all variables listed in Table 2; results are shown only for significant outcomes.
Differential reporting of dietary habits, nutrient consumption and quality of diet
The average EI was 9·9 (sd 3·9) MJ for men and 9·2 (sd 3·7) MJ for women. Greater differences in mean BMR were seen across reporting levels among men. The mean EI:BMR ratio was similar across reporting levels for both sexes. Two-thirds of the men (67·8 %) and half of the women (51·7 %) had an EI:BMR ratio less than the standard PAL reference of 1·55, which corresponds to a sedentary lifestyle, involving little to no heavy leisure activity. Furthermore, 34·5 % of participants (men: 48·6 %; women: 31·5 %) had a ratio below 1·27, the accepted minimum value for survival.
Men and women displayed highly similar patterns of disparity in nutrient consumption by misreporting levels. The percentages of total EI from carbohydrates and alcohol were fairly similar across reporting levels (see Table 4 – results shown for men only). The percentage of EI from fat was lower among under-reporters and higher among over-reporters; the opposite pattern was seen for protein intake. Although under-reporters had lower intakes of fibre and other micronutrients in absolute terms, their diet was more nutritionally dense per MJ of energy compared to accurate reporters. The diet of over-reporters was less nutritionally dense; however, most differences were not significant. The overall DASH score ranged from 9 to 42 and there was a significant difference in the ranking across reporting levels among men and women (P < 0·001). Dietary habits varied by reporting levels, with under-reporters being the least likely to report snacking between meals, adding salt to their food at the table or consuming fried food at least four times per week. The converse was true for over-reporters.
Table 4 Nutritional intake and dietary habits of men by likely under-, accurate and over-reported energy intake, SLÁN 2007
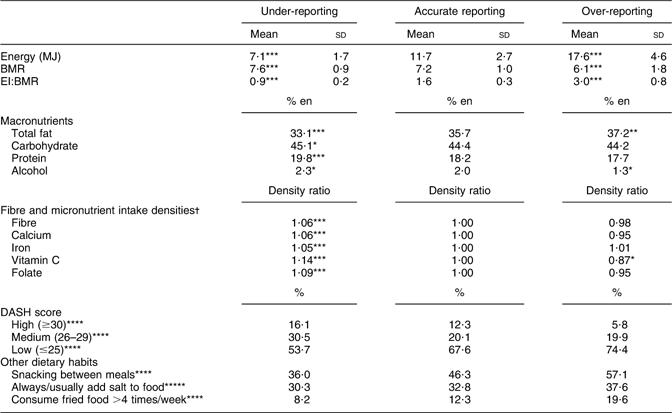
SLÁN, Survey of Lifestyle, Attitudes and Nutrition; EI, energy intake; % en, percentage of total energy intake; DASH, Dietary Approaches to Stop Hypertension.
*P < 0·05; **P < 0·01; ***P < 0·001 using ANOVA with Bonferroni correction (compared to accurate reporters); ****P < 0·001; *****P < 0·01 using χ 2 test.
†Ratio of absolute intake per MJ among misreporters to absolute intake per MJ among accurate reporters.
Discussion
The present study has found that nearly half of the population was misreporting EI. While the prevalence of low reported EI (33·2 %) is similar to findings in other developed countries, the prevalence of high reported EI (11·9 %) is greater in comparison. Other studies of general population samples have identified between 0 % and 7 % of participants as over-reporters(Reference Tooze, Vitolins and Smith4, Reference Ferrari, Slimani and Ciampi8, Reference Johansson, Solvoll and Bjorneboe20, Reference Mattisson, Wirfalt and Aronsson22). To the knowledge of the authors, the proportion of over-reporters was higher only within developing countries(Reference Mendez, Wynter and Wilks19) or specific subgroups(Reference Klingberg, Hallenberg and Lorentzon38).
Obesity was strongly associated with low EI reporting, even more so than self-perceived weight status. In the literature, BMI is the most consistent correlate when analysing misreporting, whether analysing BMI based on self-reported(Reference Johansson, Solvoll and Bjorneboe20, Reference Okubo and Sasaki39) or measured(Reference Maurer, Taren and Teixeira9, Reference Braam, Ocke and Bueno-de-Mesquita11–Reference McGowan, Harrington and Kiely13, Reference Mendez, Wynter and Wilks19, Reference Johnson, Goran and Poehlman21, Reference Mattisson, Wirfalt and Aronsson22, Reference Klingberg, Hallenberg and Lorentzon38, Reference Bailey, Mitchell and Miller40, Reference Bothwell, Ayala and Conway41) height and weight data. However, associations between misreporting and BMI based on self-reported measurements, as in the case of the present study, may be subject to bias, as individuals tend to under-report weight and over-report height(Reference Yun, Zhu and Black42). Given the likely direction of this bias, the strength of association presented in the current study may be an underestimation. As noted in other studies, a considerable proportion of under-reporters were within the normal BMI range, and thus the need to identify other influential factors remains(Reference Okubo and Sasaki39, Reference Asbeck, Mast and Bierwag43).
Men were more likely to be under-reporters than women, though this finding is less common in studies of misreporting(Reference Bedard, Shatenstein and Nadon7). A greater proportion of women were over-reporters, which appears unique to the Irish population(Reference Tooze, Vitolins and Smith4, Reference Mendez, Wynter and Wilks19, Reference Johansson, Solvoll and Bjorneboe20, Reference Mattisson, Wirfalt and Aronsson22). Low educational attainment did not significantly increase the odds of under-reporting, which is in contrast to multiple studies(Reference Bedard, Shatenstein and Nadon7, Reference Johansson, Solvoll and Bjorneboe20, Reference Bailey, Mitchell and Miller40, Reference Price, Paul and Cole44). However, low educational attainment increased the odds of over-reporting among women, though it is not clear why this pattern emerged. There has been a growing body of literature to support the association between psychological outcomes and EI misreporting(Reference Maurer, Taren and Teixeira9). The present study supports that a probable case of major depression increases the odds of women under-reporting as an independent predictor, but not in conjunction with other possible predictors of misreporting. Assessment of generalized anxiety disorder did not yield any significant findings, though lack of association between psychological outcomes and misreporting may be a result of the data collection tool used for psychological assessment.
Nevertheless, although differences in the levels of misreporting and associations were found, these may be artefacts of the methods used to ascertain EI (i.e. FFQ(Reference Bedard, Shatenstein and Nadon7, Reference Braam, Ocke and Bueno-de-Mesquita11, Reference Mendez, Wynter and Wilks19, Reference Johansson, Solvoll and Bjorneboe20) or 24 h recall(Reference Ferrari, Slimani and Ciampi8, Reference Johansson, Wikman and Ahren12, Reference Bailey, Mitchell and Miller40)), energy expenditure (i.e. doubly labelled water method(Reference Hill and Davies1, Reference Scagliusi, Ferriolli and Pfrimer3, Reference Goris, Westerterp-Plantenga and Westerterp10, Reference Scagliusi, Ferriolli and Pfrimer14)) or estimated BMR (i.e. Schofield equations(Reference Bedard, Shatenstein and Nadon7, Reference McGowan, Harrington and Kiely13, Reference Mendez, Wynter and Wilks19, Reference Mattisson, Wirfalt and Aronsson22, Reference Klingberg, Hallenberg and Lorentzon38) or Mifflin equations(Reference Tooze, Vitolins and Smith4, Reference Olendzki, Ma and Herbert45)). Differences may also be influenced by the methods used to identify misreporting. Few studies used the original Goldberg method(Reference Johansson, Solvoll and Bjorneboe20, Reference Price, Paul and Cole44). Among those applying the revised Goldberg method, most studies did not account for variation in PAL values(Reference Tooze, Vitolins and Smith4, Reference Ferrari, Slimani and Ciampi8, Reference Maurer, Taren and Teixeira9, Reference Mendez, Wynter and Wilks19, Reference Klingberg, Hallenberg and Lorentzon38), though this was not the case for all(Reference Bedard, Shatenstein and Nadon7, Reference Bothwell, Ayala and Conway41). Various alternative methods to identify misreporting were also conducted(Reference Braam, Ocke and Bueno-de-Mesquita11, Reference McGowan, Harrington and Kiely13, Reference Johnson, Goran and Poehlman21, Reference Okubo and Sasaki39, Reference Bailey, Mitchell and Miller40, Reference Olendzki, Ma and Herbert45). As a result, while general patterns between studies have been described, they must be interpreted within the context of these differences.
The findings from the present study allude to a social desirability bias. Under-reporters were more likely to have a nutritionally dense diet, have a lower percentage of EI from fat and a better quality diet based on the DASH score. These findings correspond with cluster analyses, which identified healthier dietary patterns among under-reporters(Reference Scagliusi, Ferriolli and Pfrimer14). A lower DASH score and opposite patterns in nutrient intake and dietary habits were found among over-reporters, which suggests that social desirability is not a strong form of bias within this subset of the population. Thus, differential patterns in reporting of nutrients and dietary quality suggest that the FFQ should be re-evaluated in the Irish population. In particular, food items contributing to fat and protein intake must be critically reviewed as misreporting was more evident in these areas. Furthermore, ‘undesirable’ dietary behaviours, such as the regular use of salt, frequency of snacking and fried food consumption, varied significantly by reporting level, suggesting that there is a ‘healthy eating consciousness’ that not only affects EI but dietary habits as well. Future research should explore why social desirability is not as influential among over-reporters compared to other reporters. As a cautionary note, though it is likely that differences in distributions are due to bias, this analysis is unable to confirm if dietary quality truly varies by the level of misreporting as results are based on self-reported EI.
The Goldberg equation applied in the present study is widely used to identify misreporting. However, studies continue to rely on a conservative PAL value of 1·55, often due to a lack of information regarding the PAL within the population. Thus, a strength of the present study is that it accounted for sex-specific differences in PAL, thereby minimizing misclassification. Yet, even after adjustment, other potential sources of bias remain. Estimated BMR may have resulted in misclassification of participants. Differences between estimated and measured BMR based on the Schofield equations have been documented(Reference Black6), and differences were significant among women who had a BMI score >35 kg/m2. Within this sample, 3·6 % of women met this criterion, and thus it is reasonable to conclude that the potential for misclassification was greater within this subset. Although numerous other algorithms to determine BMR have been derived, Schofield’s equations are supported by a large body of evidence and continue to be widely used in dietary research(Reference Black6). However, all BMR estimations impose bias, as their accuracies may be impacted by population characteristics, including age, weight, race and health of the individual(Reference Ramirez-Zea46–Reference Frankenfield, Roth-Yousey and Compher48).
Furthermore, although the Goldberg method has high specificity, in general it has limited sensitivity at the individual level(Reference Black6). The sensitivity of the formula is dependent on the use of appropriate PAL, and although the present study relied on values established by the FAO/WHO/UN University, these figures may need to be re-evaluated in the light of other recommended PAL classifications(Reference Black, Coward and Cole49). Bias is further compounded by the high proportion of individuals who reported that they were currently trying to manage their weight, as this formula assumes a weight-stable population. It is not likely that this poses a considerable source of error, as it is probable that many individuals who reported such are not actively pursuing weight loss, but rather are conscious of the need to lose weight. Bias associated with self-reported physical activity should be minor as research has shown that individuals are more prone to misreport their EI than their physical activity(Reference Rasmussen, Matthiessen and Biltoft-Jensen50). However, it is possible that misreporting of physical activity may be interpreted as EI misreporting, though we were unable to determine this in the present study.
Due to the numerous assumptions that are inherent in the Goldberg method, sociodemographic associations found in the present study may be attenuated in the presence of more precise assessment methods. However, in the absence of reliable, cost-effective techniques useful for large-scale population studies, the Goldberg method currently serves as the best algorithm to identify and study the determinants of misreporting.
Lastly, non-response and the cross-sectional design of the present study inhibited the interpretability of results. It is likely that participants were healthier and/or more health conscious than those who opted out of the study, though data on non-participation are unavailable for comparative analysis. Follow-up studies of misreporters and how their reporting patterns differ over time would contribute to determining the factors that result in inaccurate dietary reporting. Therefore, although dietary analysis such as this provides a broad insight into misreporting within a population, the directionality and magnitude of bias on population estimates of dietary and nutrient intake should be investigated in greater detail.
In conclusion, it is likely that nearly half of this population misreported dietary intake using an FFQ. Patterns in differential reporting were evident across sociodemographic and physiological characteristics. In the light of this evidence, consideration should be given to how under- and over-reporting affects nutrient analysis to ensure sound nutritional policy.
Acknowledgements
The Survey of Lifestyle, Attitudes and Nutrition (SLÁN) 2007 was funded by the Department of Health and Children and approved by the ethics committee of the Royal College of Surgeons of Ireland. Research relating to the present study was funded by the Health Research Board, Ireland. The authors declare no conflict of interest. J.E.L. was part of the research team for the SLÁN 2007 and had a role in the data analysis and interpretation. She conducted statistical analysis and drafted the paper. J.v.d.B. contributed to the interpretation of results and revision of the paper. J.H. was a senior researcher for SLÁN 2007 and had a major role in the data analysis and interpretation. She made revisions to the paper. F.S. worked as a senior researcher on the 1998 and 2002 SLÁN data. She made revisions to the paper. I.J.P. was a principal investigator on SLÁN 2007 and was a contributor to the study design, data analysis and interpretation for the study. He made revisions to the paper. All authors approved the final version of the paper for publication. The authors thank other SLÁN 2007 Consortium members for their contribution to the present study. SLÁN 2007 Consortium members: Prof. Hannah McGee (Project Director – Royal College of Surgeons in Ireland (RCSI)), Prof. Margaret Barry (Principal Investigator – National University of Ireland, Galway (NUIG)), Dr Dorothy Watson (Principal Investigator – Economic and Social Research Institute (ESRI)), Dr Karen Morgan (Research Manager – RCSI), Dr Emer Shelley (RCSI), Prof. Ronán Conroy (RCSI), Prof. Ruairí Brugha (RCSI), Mr Mark Ward (RCSI), Ms Nuala Tully (RCSI), Dr Michal Molcho (NUIG), Mr Eric Van Lente (NUIG) and Prof. Richard Layte (ESRI).


