- Research
- Open access
- Published:
Environmental and meteorological factors linked to malaria transmission around large dams at three ecological settings in Ethiopia
Malaria Journal volume 18, Article number: 54 (2019)
Abstract
Background
A growing body of evidence suggests that dams intensify malaria transmission in sub-Saharan Africa. However, the environmental characteristics underpinning patterns in malaria transmission around dams are poorly understood. This study investigated local-scale environmental and meteorological variables linked to malaria transmission around three large dams in Ethiopia.
Methods
Monthly malaria incidence data (2010–2014) were collected from health centres around three dams located at lowland, midland and highland elevations in Ethiopia. Environmental (elevation, distance from the reservoir shoreline, Normalized Difference Vegetation Index (NDVI), monthly reservoir water level, monthly changes in water level) and meteorological (precipitation, and minimum and maximum air temperature) data were analysed to determine their relationship with monthly malaria transmission at each dam using correlation and stepwise multiple regression analysis.
Results
Village distance to reservoir shoreline (lagged by 1 and 2 months) and monthly change in water level (lagged by 1 month) were significantly correlated with malaria incidence at all three dams, while NDVI (lagged by 1 and 2 months) and monthly reservoir water level (lagged by 2 months) were found to have a significant influence at only the lowland and midland dams. Precipitation (lagged by 1 and 2 months) was also significantly associated with malaria incidence, but only at the lowland dam, while minimum and maximum air temperatures (lagged by 1 and 2 months) were important factors at only the highland dam.
Conclusion
This study confirmed that reservoir-associated factors (distance from reservoir shoreline, monthly average reservoir water level, monthly water level change) were important predictors of increased malaria incidence in villages around Ethiopian dams in all elevation settings. Reservoir water level management should be considered as an additional malaria vector control tool to help manage malaria transmission around dams.
Background
Malaria is a serious public health challenge in sub-Saharan Africa, with an estimated 200 million cases of malaria in 2017 alone [1]. This region accounts for 92% of the global malaria burden [1]. A number of environmental, climatic, seasonal, and ecological factors determine the occurrence and intensity of malaria transmission. For instance, while rainfall limits the availability of breeding habitats for mosquito vectors, temperature determines the length of mosquito larvae development and the rate of growth of the malaria parasites inside the vector [2, 3]. In addition, environmental modifications, such as the construction of dams and irrigation schemes, also affect the type and distribution of mosquito breeding habitats [4, 5].
In Africa, dams have been demonstrated to enhance rates of malaria transmission in areas of unstable transmission [5, 6]. Increased malaria incidence following dam construction was reported around several African dams [7,8,9,10,11,12,13,14]. Overall, dams have been shown to contribute to over 1 million malaria cases annually in sub-Saharan Africa [15]. However, the extent to which various environmental and climatic factors may have contributed to enhanced rates of malaria transmission around these sites remains poorly understood.
Climatic variables such as precipitation and air temperature are important determinants of the spatial distribution and relative abundance of malaria vector species in Africa [16]. For instance, in Africa, Anopheles gambiae is the predominant species in high rainfall environments, while Anopheles arabiensis is more common in arid areas [17, 18]. However, climatic conditions are also inter-related with elevation. For example, air temperature decreases as elevation increases, and consequently the abundance and species composition of malaria vectors may change significantly with elevation [16].
In Ethiopia, local increases in malaria rates have been blamed on the establishment of new dams [9, 10, 12,13,14]. A new era of dam construction currently underway in Ethiopia [19] has also elevated concerns for the public health impact of these infrastructures. Yet, dams are important contributors to Ethiopia’s economic development and food security. However, a poor understanding of their effects on malaria transmission in different ecological settings represents a critical barrier to the sustainability of water storage infrastructures.
Understanding how different environmental and climatic factors affect rates of malaria transmission is required to develop appropriate disease control tools. A recent review suggested that the relationship between dams and malaria incidence varies across ecological settings [15]. However, the study did not investigate how environmental (other than the presence of dams) and climatic factors vary across these ecological settings and, in turn, affect rates of malaria incidence around dams. The present study aims to investigate relationships among a number of environmental and meteorological factors associated with malaria transmission around Ethiopian dams in three ecological settings: highland, midland and lowland elevations.
Methods
The present study was conducted around three dams in Ethiopia: Kesem Dam [975 m above sea level (asl)], Koka Dam (1551 m asl) and Koga Dam (1980 m asl) (Fig. 1). At each dam, six villages within a 5-km radius of the reservoir shoreline were randomly selected for this study. Only villages located upstream of the dam were included to avoid potentially confounding influences of the downstream river environment. Time series malaria case data as well as environmental and meteorological data were analysed to determine factors linked to malaria transmission at each dam setting.
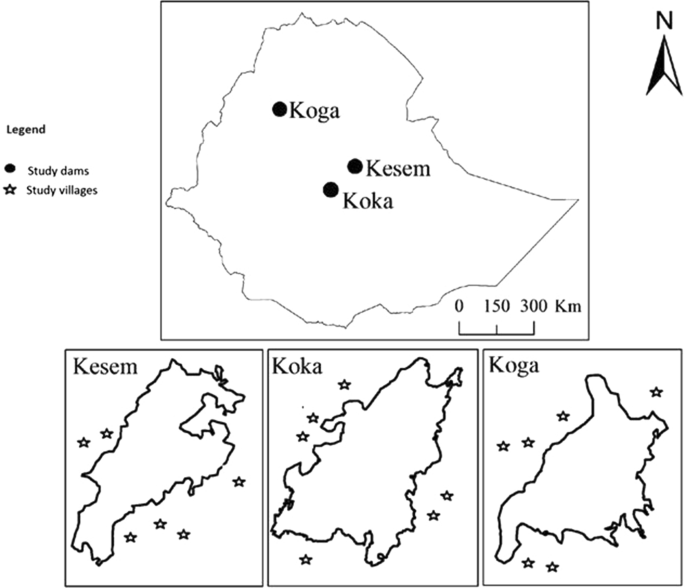
Map of the study area and location of study villages in relation to the reservoir shorelines
Kesem Dam (hereafter referred as the lowland dam) is located on the Awash River in the lowlands of the Ethiopian Rift Valley, 225 km east of Addis Ababa, the capital of Ethiopia. Its crest height of 25 m stores a maximum of 500 million cu m of water, covering an area of 200 sq km. The maximum length of the shoreline at full capacity is 55.4 km. The primary purpose of the dam is to irrigate 20,000 ha of land for sugarcane production downstream. The area is characterized as semi-arid with a mean daily temperature of 27 °C. The hottest month is May (mean daily temperature is 38 °C) and the coldest is December (average daily temperature is 18 °C). The area receives an average annual total rainfall of 600 mm; the main rainy season (June to August) accounts for 80% of the total rainfall. An estimated population of 35,000 lives within a 5-km radius of Kesem reservoir [20].
Koka Dam (hereafter referred as the midland dam) is located in the Ethiopian Rift Valley in Central Ethiopia, 100 km south of Addis Ababa. It has a crest height of 42 m, and a full water storage capacity of 1188 million m3. The surface area of the reservoir at full capacity is 236 sq km and the length of the reservoir at full storage capacity is 86 km. The primary purpose of the dam is to generate 43.2 MW of electricity from three turbines (approximately 6% of the current total grid-based generating capacity of the country). Currently, the Wonji sugarcane irrigation scheme (6000 ha), located approximately 12 km downstream of the dam, is also dependent on releases from Koka Dam. In addition, the dam is used for flood control. The area receives a total annual rainfall of 850 mm and the mean daily temperature is 22 °C (National Meteorological Agency, unpublished report). The hottest month is May (mean daily temperature is 29 °C) and the coldest is December (average daily temperature is 12 °C). An estimated population of 29,000 lives within 5 km of the reservoir [20].
Koga Dam (hereafter referred as the highland dam) is located on the Koga River, one of the major tributaries of the Blue Nile River, 560 km northwest of Addis Ababa. The dam has a storage capacity of 83.1 million m3 and surface area of 175 sq km. It was commissioned in 2009 to irrigate 7000 ha of wheat, corn and teff crops. The rainy season (June to August) generates about 70% of the run-off feeding the Koga River [21]. The length of the reservoir shoreline at full capacity is 120 km. The area is characterized as highland with a mean daily temperature of 19 °C and receives an average annual rainfall of 1500 mm. The hottest month is May (average daily temperature is 26 °C) and the coldest is January (average daily temperature is 10 °C). An estimated 32,680 people live within 5 km of the reservoir [20].
Malaria is the leading public health challenge in all study villages, peaking between September and November following the months of the rainy season (June to August). The inhabitants of the study villages are agrarians, and cattle herding is also common. Plasmodium falciparum is the predominant malaria-causing parasite, accounting for 70–80% of malaria infections (Oromia Health Bureau, unpublished report). The remaining malaria infections are due to Plasmodium vivax. Anopheles arabiensis is the major malaria vector species in the study area while Anopheles pharoensis plays a secondary role [12]. Potential mosquito breeding habitats in the study area include shoreline puddles, irrigation canals, rain pools, and man-made pools [22].
Retrospective malaria case data
Five years (January 2010 to December 2014) of weekly malaria data were obtained from the health facilities at each of the dam sites. Inhabitants of the study area visit these health facilities to receive medical attention. At each health centre, each febrile case was tested by a trained laboratory technician for malaria using microscopic blood screening to distinguish between P. falciparum and P. vivax. Test results were recorded in the laboratory registry, along with data of outpatient name, age, gender, and residency. These data were de-identified and exported to Microsoft Excel and SPSS for analysis. These data were checked for completeness and correctness by cross-referencing the laboratory registry with the outpatient registry at each clinic. The completeness of the registry ranges from 75 to 82% across the health facilities. A recent external quality assessment of the skills of the microscopists in these health facilities identified that 80% of slides were correctly recorded with correct parasite quantification [23]. For quality control, five positive and five negative slides were randomly selected from health facilities each month, and taken to the District Laboratory for re-checking.
Environmental data
The environmental data used for this study comprised village elevation, village distance from reservoir shoreline, Normalized Difference Vegetation Index (NDVI) and reservoir water level. Village elevation was recorded using a handheld Geographical Positioning System receiver (GPSMAP 60CSx, Garmin International Inc., USA). For each study village, data on monthly distance from reservoir shoreline were acquired from the European Space Agency image repository [24]. These images had a resolution of 150 × 150 m, were geo-referenced, and taken in the first week of each month between January 2010 and December 2014. These were then imported to ArcGIS 9.2 to estimate the distance between the centre of each study village and the nearest reservoir shoreline for each month of the study period.
Monthly NDVI data for the study villages were acquired from the US National Oceanic and Atmospheric Administration (NOAA) that documents data of the Moderate Resolution Imaging Spectroradiometer (MODIS) instruments on-board the Terra and Aqua Satellites. These satellites provide a vegetation survey at a 250-m spatial resolution every 16 days [25]. The MODIS NDVI products are computed from atmospherically corrected, bi-directional surface reflectances that have been masked for water, clouds, heavy aerosols, and cloud shadows. NDVI is a measure of vegetation condition, used here as a proxy for mosquito habitat availability [26]. NDVI values vary between + 1.00 and − 1.00; the higher the NDVI value, the denser the green vegetation.
Daily reservoir water level data were obtained for each dam from the Ethiopian Electricity and Power Corporation, and the Ministry of Water Resources for the duration of the study period (January 2010 to December 2014). These were then exported to Microsoft Excel and SPSS for analysis. The data were aggregated to monthly averages and monthly changes in water level (i.e., calculated by subtracting the amount of the reservoir water level (m) at the end of a month from that at the beginning of the month; negative values indicate receding water level while positive values indicate increasing water levels) for each of the three dams. The objective of including monthly changes in water level was to determine how the magnitude of change in water level correlates with malaria incidence as it directly affects the nature of the shoreline for mosquito breeding habitats.
Meteorological data
Five years (January 2010 to December 2014) of daily meteorological data, including total rainfall (mm), and mean daily minimum and maximum air temperature (°C), were obtained from three meteorological stations at each of the three study dam sites. Any missing values were replaced with daily average data from the closest neighbouring station. Data were then aggregated to monthly averages and exported to Microsoft Excel and SPSS for analysis.
Statistical analysis
To satisfy the assumptions of individual statistical analyses, first the normality in the distribution of monthly malaria incidence, environmental and meteorological data sets was tested using SPSS. Temperatures (both minimum and maximum), reservoir water level (and change in water level) and NDVI values were normally distributed and analysed as explanatory variables. Malaria incidence (dependent variable) and precipitation data were found to have a skewed distribution and thus were log-transformed accordingly.
For each village, malaria incidence was calculated as the number of cases per 1000 population. One-way Analysis of Variance (ANOVA), followed by a Tukey’s test, was used to test for the differences in malaria incidence between the three dam sites.
Average monthly meteorological data (precipitation, minimum and maximum air temperature) were calculated and lagged by one and 2 months to allow time for mosquitoes and malaria parasites to complete their life cycle prior to the expression of any malaria incidence. Similarly, monthly NDVI data were also lagged by one and 2 months to allow time for mosquito development. Monthly relative humidity data were not included in the analysis due to there being too many missing values for the duration of the study period. To determine any correlation between meteorological/environmental variables and malaria incidence at each dam site, univariate associations were first examined by regressing single explanatory factors (i.e., environmental and meteorological variables) against malaria incidences for each dam site. Since there might be cross-correlation between independent variables over time, cross-correlation analyses were conducted. When the correlation coefficient for the association between the independent variables was greater than 0.5, these variables were analysed in Autoregressive Integrated Moving Averages (ARIMA) to avoid multicollinearity [27]. After the effect of any auto-correlation had been removed by the ARIMA procedure, stepwise forward multiple regression analyses were used to identify the meteorological/environmental factors that best explained malaria incidence at each dam site. Only those variables with a significant correlation (P < 0.05) with malaria incidence were added in the multiple regression models. Among lagged variables, only those with the highest correlation (r2 > 0.5) were included to these analyses. All analyses were performed using Microsoft Excel and SPSS Version 21 software.
Results
Spatial and temporal variation in malaria incidence
Mean monthly malaria incidence was 1.7- and 5.6-times higher at the lowland dam (mean = 96.3; 95% CI = 81.5–111.0; ANOVA: F = 54.7; P < 0.001) than the midland (mean = 56.7; 95% CI = 45.9–67.4) and highland dam (mean = 17.2; 95% CI = 13.9–20.4) dams, respectively (Table 1). The temporal variation in malaria incidence at the three dams showed a seasonal peak between September and November at all study dams (Fig. 2). Differences in malaria incidence between villages and years at each dam site, however, were not statistically significant (ANOVA, P > 0.05). Malaria incidence was generally strongly correlated with elevation (r2 = 0.97; P < 0.05): malaria incidence decreased as elevation increased (Fig. 3).

Temporal variation in monthly malaria incidence in reservoir communities at the lowland, midland and highland dams in Ethiopia, 2010–2014

Relationship between malaria incidence and village elevation at the lowland, midland and highland dams in Ethiopia
Impact of environmental factors on malaria incidence
Village proximity to a reservoir shoreline was negatively correlated with malaria incidence in all the three dam sites: the shorter a village’s distance to the shoreline, the higher the malaria incidence in the following month (Fig. 4). Indeed, approximately 69% (annual average from 51 to 86%) of annual malaria cases occurred when a village’s distance was less than 2 km from the shoreline. This trend was consistent across the three dam sites.
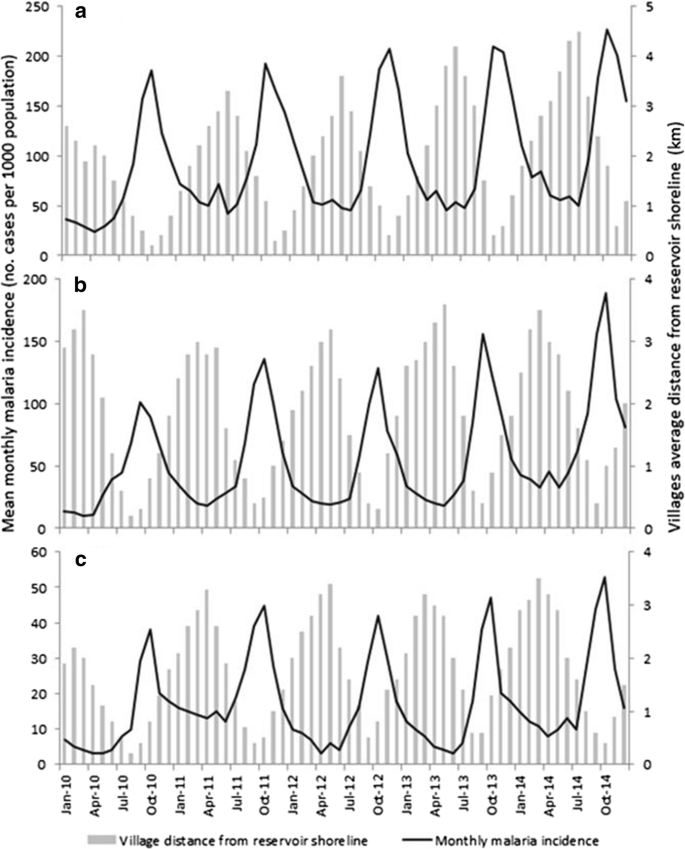
Temporal variation in monthly malaria incidence and villages distance from reservoir shoreline at a lowland, b midland and c highland dams in Ethiopia. NB: Y-axis scales vary between the three plots
Malaria incidence peaked following the months of high reservoir water level (Fig. 5). There was generally a 2-month lag-time between peak water level and peak malaria incidence, which was consistent across the dams. Similarly, malaria peaks also followed peaks in positive water level change at each dam (Fig. 6), with a lag-time ranging from 1 month (highland dam) to 2–3 months (midland and lowland dams). Likewise, high NDVI levels were associated with peaks in malaria incidence either 1–2 (lowland and midland dams) or 3 months (highland dam) later (Fig. 7).
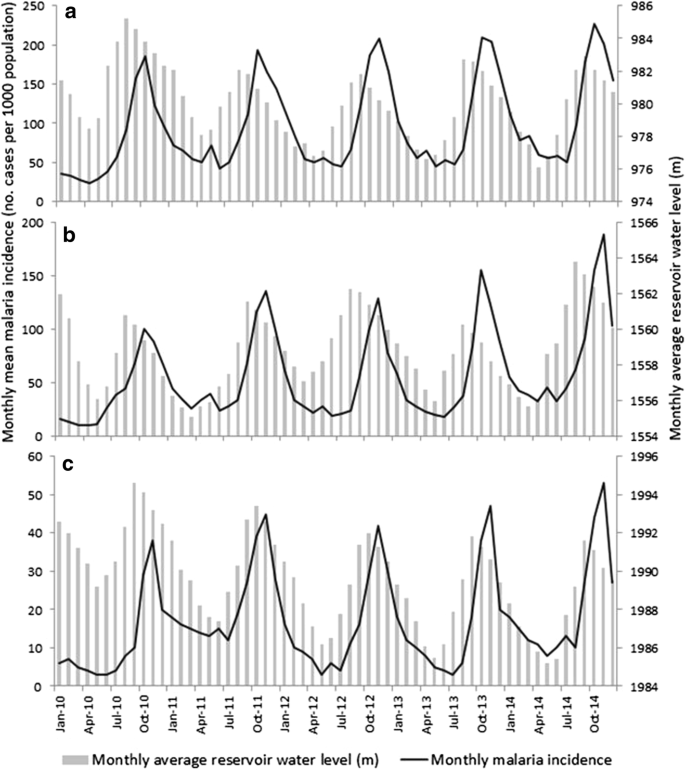
Temporal variation in monthly malaria incidence and monthly average reservoir water level at a the lowland, b midland and c highland study dams in Ethiopia, 2010–2014. NB: Y-axis scales vary between the three plots

Temporal variation in monthly malaria incidence and monthly change in reservoir water level at the a lowland, b midland and c highland study dams, Ethiopia. NB: Y-axis scales vary between the three plots. Negative water level changes refer to receding water levels
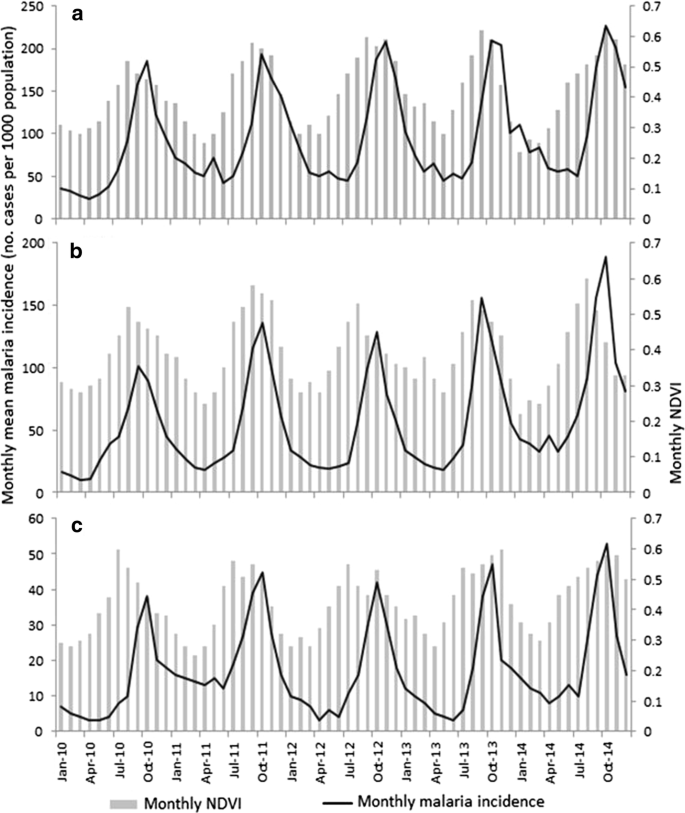
Relationship between monthly malaria incidence and monthly NDVI at a lowland, b midland and c highland dams in Ethiopia. NB: Y-axis scales vary between the three plots
Univariate analysis detected significant relationships between environmental variables and malaria incidence across the three dams (Table 2). NDVI (lagged by 1 and 2 months; r = 0.567 and 0.669, respectively), village distance from the reservoir shoreline (lagged by 1 and 2 months; r = − 0.598 and − 0.441, respectively), monthly average reservoir water level (lagged by 2 months; r = 0.362) and monthly change in reservoir water level (lagged by 1 month; r = − 0.616) were significantly associated with monthly malaria incidence at the lowland dam. At the midland dam, distance from reservoir shoreline (lagged by 1 and 2 months; r = − 0.455 and − 0.368, respectively), NDVI (lagged by 2 months; r = 0.452), monthly average reservoir water level (lagged by 2 month; r = 0.408) and monthly change in reservoir water level (lagged by 1 and 2 months; r = − 0.481 and − 0.366, respectively) were significantly associated with malaria incidence. At the highland dam, a strong correlation was found between monthly malaria incidence and distance from reservoir shoreline (lagged by 1 and 2 months; r = 0.487 and − 0.377, respectively) and monthly changes in reservoir water level (lagged by 1 month; r = − 0.301).
Impact of meteorological variables on malaria incidence
A peak in malaria incidence followed mid-year peaks in rainfall at each of the three dams (Fig. 8). Lag times were relatively consistent between dams, ranging from an average of 2.4 or 2.6 months at the lowland and midland dams to 2.0 months at the highland dam. A peak in malaria incidence tended to occur a month following peaks in minimum air temperature at the lowland and highland dams, but from 1 to 2 months following the same peaks at the midland dam (Fig. 9). However, the relationship between seasonal malaria incidence and variation in maximum air temperature was less clear. At the lowland dam, malaria peaks occurred 2 to 4 months following late-summer troughs in maximum air temperature, but from 0 to 3 months following similar troughs at the midland dam. The same pattern was less consistent at the highland dam, with malaria incidence peaks tending to follow minor September peaks in maximum air temperature.
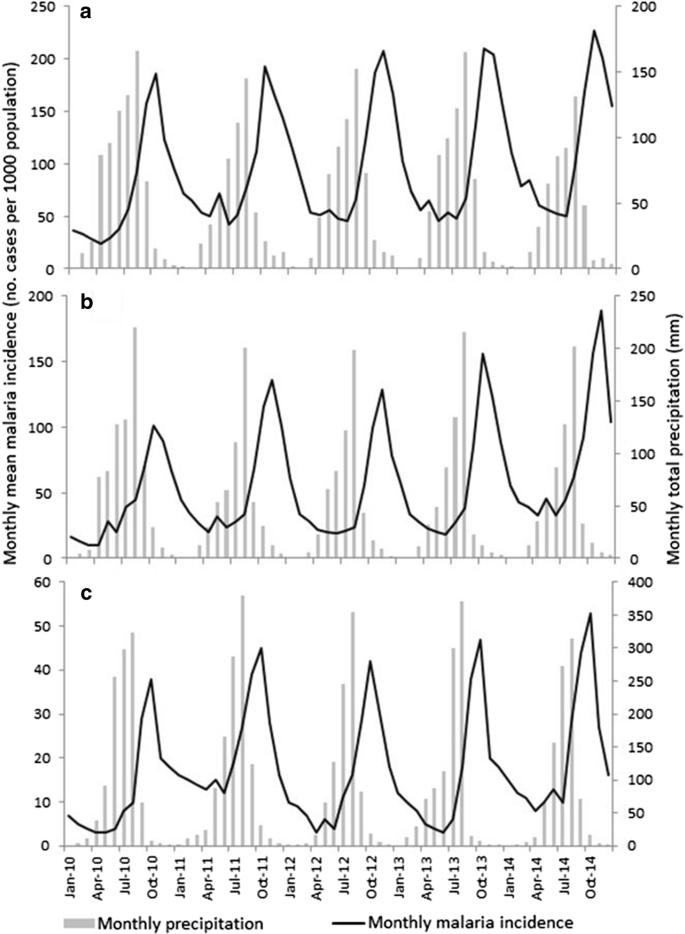
Temporal variation in monthly malaria incidence and monthly total precipitation at the a lowland, b midland and c highland study dams, Ethiopia. NB: Y-axis scales vary between the three plots
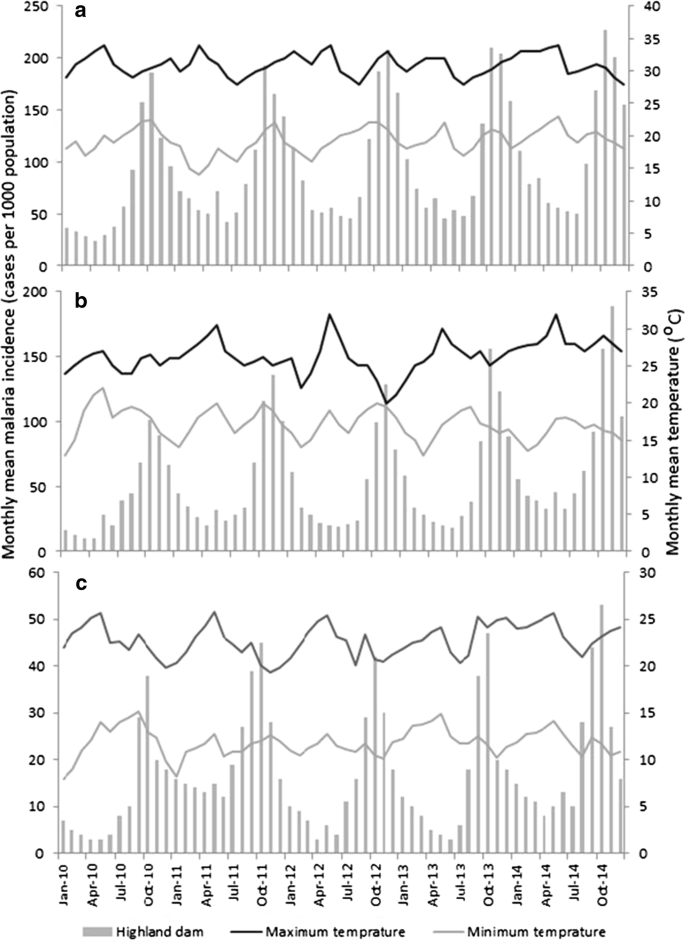
Temporal variation in malaria incidence and minimum and maximum air temperatures at the a lowland, b midland and c highland study dams, Ethiopia. NB: Y-axis scales vary between the three plots
Univariate analysis of the influence of meteorological variables on seasonal malaria incidence indicated differences in variables that were significantly associated with malaria incidence between the three dam sites (Table 3). At the lowland dam, monthly total precipitation lagged by 1 and 2 months (r = 0.414; r = 0.672, respectively) were the only variables with a significant correlation with monthly malaria incidence. At the midland dam, monthly total precipitation lagged by 2 months (r = 0.329) and monthly mean minimum temperature lagged by 1 and 2 months (r = 0.501; r = 0.612, respectively) were significantly correlated with monthly malaria incidence. At the highland dam, monthly mean minimum (r = 0.419; r = 0634) and maximum (r = 0.364; r = 0.451) air temperature lagged by 1 and 2 months were significantly correlated with monthly malaria incidence.
Regression models
Cross-correlation analysis showed that a number of environmental and meteorological variables were significantly correlated with each other (see Additional file 1: Table S1). For instance, maximum temperature was significantly correlated with NDVI, monthly reservoir water level and reservoir water level change at each of the three dams.
Stepwise multiple regression analyses selected few environmental and meteorological variables as factors most explaining malaria incidence across the three study dams (Table 4). At the low land dam, village distance to reservoir shoreline lagged by 1 month (r2 = 0.468; P < 0.001), monthly average change in reservoir water level lagged by 2 months (r2 change = 0.189; P < 0.001) and monthly total precipitation lagged by 1 month (r2 change = 0.156; P < 0.001) together explained 81% of the monthly variability in malaria incidence. At the midland dam, village distance to reservoir shoreline lagged by 1 month (r2 = 0.398; P < 0.001), monthly reservoir water level lagged by 2 months (r2 change = 0.266; P < 0.001) and monthly total precipitation lagged by 2 months (r2 = 0.221; P < 0.001) explained 71.1% of variation in monthly malaria incidence. At the highland dam, village distance to reservoir shoreline lagged by 1 month (r2 = 0.324; P < 0.001), monthly change in reservoir water level lagged by 2 months (r2 change = 0.374; P < 0.001) and monthly mean minimum temperature lagged by 2 months (r2 change = 0.068; P < 0.001) explained 76.5% of variation in monthly malaria incidence. Overall, dam-associated factors, such as distance to shoreline or the magnitude of water level changes, were found to be the most important variables contributing to malaria incidence in nearby villages.
Discussion
This study revealed that dam-associated environmental factors and local meteorological drivers influence malaria transmission around large dams in Ethiopia. The importance of these factors, however, varied across lowland, midland and highland dam sites. Interestingly, a village’s distance from the nearest reservoir shoreline was the most important variable at all three dams, explaining 47, 40 and 32% of the monthly variation in malaria incidence at the lowland, midland and highland dams, respectively. This indicates the role that dams play in malaria transmission by providing favourable breeding habitats for malaria mosquitoes. Previous studies indicated that An. arabiensis, the primary malaria vector mosquito in Ethiopia, breeds along reservoir shorelines [12, 14].
Monthly reservoir water level (lagged by 2 months) was also positively correlated with monthly malaria incidence at the lowland and midland dams. This suggests that during periods of high water level, reservoir shorelines get closer to villages (as shown by distance) and contribute to increased mosquito abundance as the result of mosquito breeding in reservoir shoreline habitats. The present results also indicate that the shorter the distance between villages and reservoir shoreline the higher the malaria incidence. This is in agreement with the findings of a recent study that documented enhanced larval abundance of An. arabiensis and An. pharoensis, the major malaria vectors in Ethiopia, in lowland and midland dam areas [14]. Similar observations were also made around Lake Victoria in Kenya where the abundance of An. gambiae complex (of which An. arabiensis is a member) substantially increased during high water levels [28]. In southwest Ethiopia, Sena et al. [29] found that elevation and distance from reservoir were important factors determining malaria transmission around Gilgel-Gibe. Generally, the significant association between village distance from reservoir shoreline and malaria incidence confirms the role of dams in malaria transmission at all three dam settings.
Whilst precipitation was the most important meteorological factors associated with malaria incidence at the lowland and midland dams, minimum temperature appeared to be a significant driver of malaria incidence around the highland dam. In fact, precipitation is strongly correlated with reservoir water level as periods of high water level follow heavy rains between June and August. Teklehaimanot et al. [30] indicated that precipitation is the most important factor for malaria transmission in the lowlands of Ethiopia as mosquito breeding is largely limited by water availability. Peak malaria transmission often follows the main rainy season in Ethiopia [31]. Precipitation has a direct and indirect effect on malaria transmission around dams: it increases reservoir water level which creates potential mosquito breeding habitats along the shorelines closer to reservoir villages, and forms rain pools that mosquitoes use for breeding.
The effect of minimum temperature on malaria transmission in the highlands has long been recognized [32,33,34,35]. Temperature is a key determinant of the length of mosquito and malaria parasite life cycle [34, 36]. For instance, at 16 °C, larval development may take more than 45 days (reducing the number of mosquito generations and putting the larvae at increased risk of predators), compared to only 10 days at 30 °C [30]. However, temperature increases above 30 °C have been regarded as detrimental to parasite and mosquito development [36]. By affecting the duration of the aquatic stage of the mosquito life cycle, temperature determines the timing and abundance of mosquitoes following adequate rainfall. The feeding frequency of mosquitoes is also affected by temperature—an increase in temperature leads to increased proportions of infective mosquitoes [37]. However, the effect of temperature largely depends on elevation: as elevation increases, temperature decreases, which affects both mosquito and malaria parasite development [38]. The minimum temperature required for the development of P. falciparum and P. vivax is approximately 18 °C and 15 °C, respectively, limiting the spread of malaria at higher altitudes [39]. There is also a relationship between increasing altitude and decreasing mosquito abundance in African highlands [38]. In light of future climate change, higher temperatures could also facilitate faster desiccation of breeding habitats, compromising larval development. These effects of minimum temperature might explain the significance of this factor in determining malaria transmission rates around the highland dam in the present study.
Monthly NDVI (lagged by 1 and 2 months) was significantly correlated with malaria incidence, particularly around the lowland dam. Several studies have shown a positive significant correlation between NDVI in the preceding month and malaria in West, Central and East Africa [40,41,42]. However, it should be noted that temporal variation in NDVI is often highly correlated with rainfall particularly in semi-arid lowlands, as shown in the present study and others [43, 44]. In the Sudanese Savannah region of Mali, Gaudart et al. [42] reported NDVI to be an important predictor of the total surface area of breeding sites, as NDVI values increase with soil moisture. In Eritrea, Graves et al. [45] found that NDVI is a better predictor of malaria incidence than rainfall. In the absence of rainfall data, NDVI can thus be used to predict malaria risk in lowland areas.
Monthly change in reservoir water level (lagged by 2 months) was one of the most important determinants of monthly malaria incidence around the lowland and midland dams. The rate of water level change has previously been shown to determine availability of shoreline habitats for mosquito breeding around [12]. Faster water level drawdown rates, determined by the magnitude in water level change between consecutive months, were associated with low larval mosquito abundance and fewer shoreline puddles [46]. Similarly, the present study showed that a rapidly receding reservoir shoreline was associated with lower malaria incidence rates (Fig. 6). Increasing water levels, which also shorten the distance from villages to shorelines, were positively correlated with increasing malaria incidence. This also explains the seasonality of malaria around dam villages which peaks immediately after the rainy season when reservoirs fill up. Reservoir water level is thus an important factor underpinning the production of shoreline mosquito breeding habitats.
Understanding the various factors that contribute to malaria transmission is crucial in order to forecast malaria risk and devise disease control tools. Although evidence for the general impact of dams on malaria is well documented in sub-Saharan Africa [5, 6, 15], specific factors responsible for increased malaria around dams have been less clear. The present study has for the first time identified environmental and meteorological factors associated with increased malaria transmission around dams at different ecological settings. Its findings underscore the role of reservoir water levels in malaria transmission nearby, and also allow the potential of using reservoir water level management for malaria vector control to be assessed. Reservoir water level management was effectively implemented to disrupt malaria vector breeding in habitats in the Tennessee Valley, USA [47]. A recent study in Ethiopia assessed the efficacy of this approach under field experiments and found that faster drawdown rates suppress larval development [46]. However, this approach has never been applied to African dams. Future research should investigate the potential of using water level management for malaria control in existing African dams.
This study has three main limitations. First, the malaria data used were retrospective data with a 75–82% level of completeness. Active case detection would have improved confidence in the present findings relative to retrospective datasets. Second, the difference in malaria control use (e.g., bed nets) among the study dams was not considered in the modelling. Third, entomological data were not included in the modelling, although these would have contributed to the biological explanation for the lag times observed in the response of malaria infection cases to some environmental variables.
Conclusion
Dams intensify malaria transmission in Ethiopia. The rate of reservoir water level change and village distance from reservoir shorelines were both found to be key malaria determinants around dams. As many dams are currently planned in sub-Saharan Africa, understanding the factors underlying increased malaria transmission is crucial to inform where to locate dams and communities at higher risk of the disease. Health authorities and dam operators should explore mechanisms to optimize dam operation to suppress nearby malaria transmission. Effective water level management, augmented with the existing vector control approaches, could help curb the malaria risk around large dams in Africa.
References
WHO. World Malaria Report 2018. Geneva: World Health Organization; 2018.
Patz JA, Olson SH. Malaria risk and temperature: influences from global climate change and local land use practices. Proc Natl Acad Sci USA. 2006;103:5635–6.
Stern DI, Gething PW, Kabaria CW, Temperley WH, Noor AM, Okiro EA, et al. Temperature and malaria trends in highland East Africa. PLoS ONE. 2011;6:e24524.
Jobin W. Dams and disease: Ecological design and health impacts of large dams, canals and irrigation systems. London: E&FN Spon; 1999.
Keiser J, de Castro MC, Maltese MF, Bos R, Tanner M, Singer BH, et al. Effect of irrigation and large dams on the burden of malaria on a global and regional scale. Am J Trop Med Hyg. 2005;72:392–406.
Kibret S, Wilson GG, Ryder D, Tekie H, Petros B. The influence of dams on malaria transmission in sub-Saharan Africa. EcoHealth. 2015;14:408–19.
Atangana S, Foumbi J, Charlois M, Ambroise-Thomas P, Ripert C. Epidemiological study of onchocerciasis and malaria in Bamendjin dam area (Cameroon). Med Trop (Mars). 1979;39:537–43 (in French).
Freeman T. Investigation into the 1994 malaria outbreak of the Manyuchi Dam area of Mbberengwa and Mwenezi Districts, Zimbabwe. 1994.
Ghebreyesus TA, Haile M, Witten KH, Getachew A, Ambachew M, Yohannes AM, et al. Incidence of malaria among children living near dams in northern Ethiopia: community based incidence survey. BMJ. 1999;319:663–6.
Lautze J, McCartney M, Kirshen P, Olana D, Jayasinghe G, Spielman A. Effect of a large dam on malaria risk: the Koka Reservoir in Ethiopia. Trop Med Int Health. 2007;12:982–9.
Mba CJ, Aboh IK. Prevalence and management of malaria in Ghana: a case study of Volta region. Afr Pop Studies. 2007;22:137–71.
Kibret S, Lautze J, Boelee E, McCartney M. How does an Ethiopian dam increase malaria? Entomological determinants around the Koka reservoir. Trop Med Int Health. 2012;17:1320–8.
Yewhalaw D, Getachew Y, Tushune K, Kassahun W, Duchateau L, Speybroeck N. The effect of dams and seasons on malaria incidence and Anopheles abundance in Ethiopia. BMC Infect Dis. 2013;13:161.
Kibret S, Wilson GG, Ryder D, Tekie H, Petros B. Malaria impact of large dams at different eco-epidemiological settings in Ethiopia. Trop Med Health. 2017;45:4.
Kibret S, Lautze J, McCartney M, Wilson GG, Nhamo L. Malaria impact of large dams in sub-Saharan Africa: maps, estimates and predictions. Malar J. 2015;14:339.
Lindblade KA, Walker ED, Wilson ML. Early warning of malaria epidemics in African highlands using Anopheles (Diptera: Culicidae) indoor resting density. J Med Ent. 2000;37:664–74.
Coetzee M, Craig M, le Sueur D. Distribution of African malaria mosquitoes belonging to the Anopheles gambiae complex. Parasitol Today. 2000;16:74–7.
Sinka ME, Bangs MJ, Manguin S, Coetzee M, Mbogo CM, Hemingway J. The dominant Anopheles vectors of human malaria in Africa, Europe and the Middle East: occurrence data, distribution maps and bionomic précis. Parasit Vectors. 2010;3:117.
National Planning Commission. Growth and transformation plan ii (GTP II) (2015/16-2019/20). Addis Ababa: Federal Democratic Republic of Ethiopia; 2016.
Central Statistical Agency. National population census results. Addis Ababa: Ethiopian Central Statistics Agency; 2007.
Birhanu K, Alamirew T, Dinka MO, Ayalew S, Aklog D. Optimizing reservoir operation policy using chance constraint nonlinear programming for Koga irrigation Dam, Ethiopia. Water Resour Manag. 2014;28:4957–70.
Kibret S, McCartney M, Lautze J, Jayasinghe G. Malaria transmission in the vicinity of impounded water: evidence from the Koka reservoir, Ethiopia. IWMI Research Report 132. Colombo, 2009.
Sori G, Zewdie O, Tadele G, Samuel A. External quality assessment of malaria microscopy diagnosis in selected health facilities in Western Oromia, Ethiopia. Malar J. 2018;17:233.
European Space Agency. European Space Agency image repository. https://www.esa.int/spaceinimages/Images. Accessed 12 May 2016.
United States Geological Survey. 2015. Moderate Resolution Imaging Spectroradiometer (MODIS) dataset. https://www.usgs.gov/products/data-and-tools/real-time-data/remote-land-sensing-and-landsat. Accessed 12 May 2016.
Hay SI, Snow RW, Rogers DJ. Predicting malaria seasons in Kenya using multitemporal meteorological satellite sensor data. Trans R Soc Trop Med Hyg. 1998;92:12–20.
Simonoff JS, Chatterjee S. Handbook of regression analysis. New Jersey: Wiley; 2012.
Minakawa N, Sonye G, Dida GO, Futami K, Kaneko S. Recent reduction in the water level of Lake Victoria has created more habitats for Anopheles funestus. Malar J. 2008;7:119.
Sena L, Deressa W, Ali A. Dynamics of Plasmodium falciparum and Plasmodium vivax in a micro-ecological setting, Southwest Ethiopia: effects of altitude and proximity to a dam. BMC Infect Dis. 2014;14:625.
Teklehaimanot HD, Lipsitch M, Teklehaimanot A, Schwartz J. Weather-based prediction of Plasmodium falciparum malaria in epidemic-prone regions of Ethiopia. I. Patterns of lagged weather effects reflect biological mechanisms. Malar J. 2004;3:41.
Ministry of Health. National Malaria Control Guidelines. Addis Ababa: Ethiopian Ministry of Health; 2012.
Lindsay SW, Martens WJ. Malaria in the African highlands: past, present and future. Bull World Health Organ. 1998;76:33–45.
Craig MH, Snow RW, le Sueur D. A climate-based distribution model of malaria transmission in sub-Saharan Africa. Parasitol Today. 1999;15:105–11.
Blanford JI, Blanford S, Crane RG, Mann ME, Paaijmans KP, Schreiber KV, et al. Implications of temperature variation for malaria parasite development across Africa. Sci Rep. 2013;3:1300.
Mordecai EA, Paaijmans KP, Johnson LR, Balzer C, Ben-Horin T, Moor E, et al. Optimal temperature for malaria transmission is dramatically lower than previously predicted. Ecol Lett. 2013;16:22–30.
Lyons CL, Coetzee M, Chown SL. Stable and fluctuating temperature effects on the development rate and survival of two malaria vectors, Anopheles arabiensis and Anopheles funestus. ParasitVectors. 2013;6:104.
Paaijmans KP, Blanford S, Bell AS, Blanford JI, Read AF, Thomas MB. Influence of climate on malaria transmission depends on daily temperature variation. Proc Natl Acad Sci USA. 2010;107:15135–9.
Bødker R, Akida J, Shayo D, Kisinza W, Msangeni HA, Pedersen EM, et al. Relationship between altitude and intensity of malaria transmission in the Usambara Mountains, Tanzania. J Med Entomol. 2003;40:706–17.
Gosoniu L, Vounatsou P, Sogoba N, Smith T. Bayesian modeling of geostatistical malaria risk data. Geospatial Health. 2006;1:127–39.
Gemperli A, Sogoba N, Fondjo E, Mabaso M, Bagayoko M, Briët OJ, et al. Mapping malaria transmission in West and Central Africa. Trop Med Int Health. 2006;11:1032–46.
Gomez-Elipe A, Otero A, Van Herp M, Aguirre-Jaime A. Forecasting malaria incidence based on monthly case reports and environmental factors in Karuzi, Burundi, 1997–2003. Malar J. 2007;6:129.
Gaudart J, Touré O, Dessay N, Dicko A, Ranque S, Forest L, et al. Modelling malaria incidence with environmental dependency in a locality of Sudanese savannah area, Mali. Malar J. 2009;8:61.
Wayant NM, Maldonado D, de Arias AR, Cousiño B, Goodin DG. Correlation between Normalized Difference Vegetation Index and malaria in a subtropical rain forest undergoing rapid anthropogenic alteration. Geospatial Health. 2010;4:179–90.
Baeza A, Bouma MJ, Dobson AP, Dhiman R, Srivastava HC, Pascual M. Climate forcing and desert malaria: the effect of irrigation. Malar J. 2011;10:190.
Graves PM, Osgood DE, Thomson MC, Sereke K, Araia A, Zerom M, et al. Effectiveness of malaria control during changing climate conditions in Eritrea, 1998–2003. Trop Med Int Health. 2008;13:218–28.
Kibret S, Wilson GG, Ryder D, Tekie H, Petros B. Can water-level management reduce malaria mosquito abundance around large dams in sub-Saharan Africa? PLoS ONE. 2018;13:e0196064.
Hess AD, Kiker CC. Water level management for malaria control on impounded waters. J Natl Malar Soc. 1944;3:181–96.
Authors’ contributions
SK, GGW and DR conceived the study; SK collected and analyzed the data and drafted the manuscript. GGW and DR involved in data interpretation and manuscript preparation. GGW, DR, HT, BP revised the draft for intellectual inputs. All authors read and approved the final manuscript.
Acknowledgements
The authors wish to thank Kefyalew Girma for his support with satellite data analysis.
Competing interests
The authors declare that they have no competing interests.
Availability of data and materials
All data used for this study are presented here. Raw data can be obtained by contacting the corresponding author.
Ethics approval and consent to participate
Not applicable.
Funding
The study was funded by the University of New England, Australia, and the International Foundation for Science (IFS, Grant #W/4752-2).
Consent for publication
Not applicable.
Publisher’s Note
Springer Nature remains neutral with regard to jurisdictional claims in published maps and institutional affiliations.
Author information
Authors and Affiliations
Corresponding author
Additional file
Additional file 1: Table S1.
Cross-correlation of environmental and meteorological variables (values shown are r values).
Rights and permissions
Open Access This article is distributed under the terms of the Creative Commons Attribution 4.0 International License (http://creativecommons.org/licenses/by/4.0/), which permits unrestricted use, distribution, and reproduction in any medium, provided you give appropriate credit to the original author(s) and the source, provide a link to the Creative Commons license, and indicate if changes were made. The Creative Commons Public Domain Dedication waiver (http://creativecommons.org/publicdomain/zero/1.0/) applies to the data made available in this article, unless otherwise stated.
About this article

Cite this article
Kibret, S., Glenn Wilson, G., Ryder, D. et al. Environmental and meteorological factors linked to malaria transmission around large dams at three ecological settings in Ethiopia. Malar J 18, 54 (2019). https://0-doi-org.brum.beds.ac.uk/10.1186/s12936-019-2689-y
Received:
Accepted:
Published:
DOI: https://0-doi-org.brum.beds.ac.uk/10.1186/s12936-019-2689-y