- Research
- Open access
- Published:
Land use/cover spatiotemporal dynamics, driving forces and implications at the Beshillo catchment of the Blue Nile Basin, North Eastern Highlands of Ethiopia
Environmental Systems Research volume 8, Article number: 21 (2019)
Abstract
Background
Land use/cover (LULC) change is a dynamic and complex process that can be caused by many interacting processes ranging from various natural factors to socioeconomic dynamics . It exerts a strong influence on the structure, functions and dynamics of most landscapes. Monitoring and mapping of LULC dynamics are crucial as changes observed reflect the status of the environment and provide input parameters for optimum natural resources management and utilization. The objective of this study was to quantify the spatio-temporal LULC dynamics using satellite image coupled with local perceptions in the Gedalas watershed of the Blue Nile Basin, North Eastern Ethiopia. Maximum likelihood supervised image classification technique were employed to classify LULC categories. After ensuring acceptable accuracy value for each classified image, image differencing approach was used to detect and quantify LULC transitions of the area. Classification results were validated with the aid of field work, topographic maps, and high resolution Google earth images supplemented with other available thematic data sets.
The results
The result demonstrated seven major LULC classes and the overall scenario presented by the study reveals that the watershed has experienced quite visible LULC transitions that seem to be continued in the future due to eternal anthropogenic activities and natural factors. The study ascertain that though there was change in all land use types, the major change detected was a consistent expansion of farmland/settlements area mainly at the expense of Afro/sub Afro alpine vegetation areas. On the contrary, Afro/sub Afro alpine vegetation showed a consistent net loss of over the study of periods. The findings also highlighted that transitions were ultimately driven by the interplay of biophysical, socioeconomic and institutional factors. Perceptions of the local communities on the LULC change substantially agree with data from satellite images. This implies that the ongoing rural land administration and natural resource conservation and management strategies could not effectively address the expansion of agricultural land towards fragile and marginal lands in the study area.
Conclusion
The study concludes that if these trends of crop lands expansion allowed continuing, sooner or later there will be no Afro/sub Afro alpine vegetation will remain. Therefore, local governments should strive to expand SLM activities on such mountain ecosystems and other marginal lands focusing on community livelihood diversification and sustainable intensification strategies.
Background
Land resources, which are an integral component of the watershed ecosystem, are essential natural assets which provide social, economic and ecological functions to sustain livelihood of the inhabitants (Nunes and Auge 1999). It is the platform on which human activities take place and also the source of materials needed for these activities (Briassoulis 2000). However, land is becoming a limited resource subject to competing demands and its various functions and services are seriously compromised by the problem of human induced land degradation (Gessesse et al. 2015).
One of the prime prerequisites for better use and management of land resources is information on existing land use/cover patterns and changes in land use/cover through time (Anderson 1976). Spatial and temporal status of the land use/cover of a given area is an important parameter in understanding the interactions of the human activities with the environment (Anil et al. 2011; Etefa et al. 2018). Land use and land cover patterns change in keeping with demands for natural resources (Anderson 1976). Studies have shown that although the evidences of land use/cover changes dates back many 1000 years, the recent rates, extents and intensities of human pressure on land and its scarce resources is more rapid and extensive than in any comparable period of time (Petit and Lambin 2002; MEA 2005; Ellis and Pontius 2006). This unprecedented human and environment interactions have been verified by LULC changes.
Despite LULC change have social and economic benefits; this dynamic and complex process usually has an unintentional interlocked multidimensional consequence upon essential Earth’s ecosystem functions and services at both the small and large scales (Lambin et al. 2003; Turner et al. 2007; Lambin and Meyfroidt 2011). For instance, changes in LULC has been shown to have negative impacts on biodiversity (Klenner et al. 2009), biogeochemical cycling and environmental degradation mainly due to exposure of soil to erosion forces (MEA 2005; Meshesha et al. 2014; Mwehia 2015; Sewnet 2015), stream water quality (Uriarte et al. 2011); contribution to local and global climate change (Bringezu et al. 2014) and forest fragmentations (Ligdi et al. 2010; Rands et al. 2010) which all have implications on the provisioning capacities of the watersheds. Although LULC change is global phenomenon, its nature and magnitude vary from area to areas. Its consequence is, however, strong particularly in fragile ecosystem and mountainous areas.
Periodic LULC change monitoring is, therefore, an essential requirement for the assessment of ecosystem health and investigate factors responsible for triggering the dynamic processes and assess the environmental consequences of such changes (Lambin and Geist 2007; Fichera et al. 2012). Moreover, information on LULC dynamics assists in monitoring environmental changes and developing effective land management and planning strategies at both national and local levels (Ellis and Pontius 2006; Etefa et al. 2018).
LULC change has become the focus of geographical research and discourse in Ethiopia for the last few decades (see Zeleke and Hurni 2001; Garedew et al. 2009; Kindu et al. 2013; Temesgen et al. 2013; Meshesha et al. 2014; Desalegn et al. 2014; Ariti et al. 2015; Yesuf et al. 2015; Demissie et al. 2017; Etefa et al. 2018), but all of these studies were undertaken far from the relatively little known, sensitive and fragile areas of Beshillo catchments. Hence, accurate and up-to-date spatio-temporal information on LULC dynamics, the driving forces and implications of these changes are urgently needed as an input parameter for planning site-specific sustainable land use and resource management practices in such overlooked place. The objective of this research is, therefore, to detect, quantify and map the LULC dynamics and trends as well as drivers and overall socioeconomic and environmental implications associated with these changes by integrating remote sensing information and the insights of the local communities.
Methods and materials
The geographical context of the study site
The study was conducted in Gedalas watershed; which is located in one of the most degraded highlands and drought prone area of the Upper sub catchment of the Beshillo River (Tributary of Blue Nile), Northeastern Highlands of Ethiopia. Geographically, it lies between 10°56′52″ and 11°13′26″ N, and 39°06′10″ and 39°18′53″ E (Fig. 1). The watershed covers a total land surface area of 23,970 ha (237.9 km2) and forms part of the headwaters of the Blue Nile basin.

Location of Gedalas Watershed in relation to Ethiopia and the Amhara region
Most of the land area of the watershed is characterized by rugged and strongly dissected mountainous landscapes with steep slopes and deep ravines which make the area highly susceptible to soil erosion risks. The elevation of the watershed varies over short distances and ranging between 1919 and 4233 m a.s.l with the mean elevation of 3163 m. The slope of the watershed gradually decreases northeast wards.
The study area falls into three agro-climatic zones: Temperate (Woina Dega), Cool (Dega) and Wurch (Afro alpine) zone (MOA 1998) (Fig. 2). The watershed is characterized by a bimodal pattern of rainfall with a 30 years mean annual rainfall of 930 mm. The highest average monthly rainfall (303 mm) was recorded in July; the lowest (10 mm) in December. The rainfall is variable from year to year, both in terms of intensity and distribution. The coefficient of variation of rainfall was calculated at 14.62% and standardize Rainfall Anomaly index also show variation over the period of observation which implying that there is inter annual rainfall variability in the area. The monthly average minimum temperatures range between 6.4 and 8.6 °C while the maximum stretch between 17.9 and 21 °C. The mean annual temperature of the area is 13.6 °C (Fig. 3).

Agro ecological belts of the Gedalas watershed

Mean monthly maximum and minimum temperature and mean monthly rainfall records 1984–2017, from Ambamariam meteorological station (3000 m), South Wello, Ethiopia
Soil units found in the area are predominantly volcanic in origin. The major soil types of the watershed area are Leptosols, Cambisols, Regosols and Vertisols (Fig. 4). Though the overall vegetation cover of the watershed are very poor, still there are various types of vegetation which range from scattered woodlots to Afro alpine types. Aside from the patches of eucalyptus trees planted by farmers and government initiated programs; there are a few dispersed indigenous tree species, shrubs and afro alpine species unique to extreme highland parts of the watershed.

Dominant soils types of the watershed
At the time of this study, the watershed was occupied by a total population of approximately above thirty-five thousands (Estimation from TWARDO 2016), which makes a rural crude population density of close to 147 persons per square kilometer; considerably higher than the regional average of 111 persons/km2 (CSA 2013). Agriculture is the main economic activity and source of livelihood. The farming system is almost entirely rain-fed and involves the integration of crop cultivation and livestock rearing that is carried on at subsistence level. Soil tillage is carried out with traditional ard plough (locally called Maresha) pulled by a pair of oxen. The frequency of tillage ranges from 1 to 3 per cropping season depending on crop types. The major crops of the area are cereal crops, including sorghum (Sorghum bicolor), Oats (Avena Sativa), teff (Eragrostis tef), maize (Zea mays), barley (Hordeum vulgare), senar/engedo (Avena sativa) and wheat (Triticum vulgare). Barley and senar/engedo are the dominant crops cultivated in the Wurch area of the watershed and sometimes is rotated with wheat.
Other major crops are pulses such as Chickpea (Cicer arietinum), vetch (Vicia sativa), Field Pea (Pisum sativum), and Faba Bean (Vicia faba). Sorghum (Hordeum vulgare) and Maiz (Zea mays) are also produced on the lower reach of the watershed. In addition, some farmers produce oil seeds such as Niger seed (Guizotia abyssinica), Rape seed (Brassica napus), linseed (Linum usitatissimum) and spices and herbs [such as pepper, garlic, etc.), and vegetables and root crops such as onion (Allium cepa), tomato, carrot, cabbage, etc.] on a small scale using traditional irrigation systems around homesteads.
Livestock production is an essential component of the farming system in the watershed though ownership of livestock per household is generally declining with time due to shortage of grazing/browsing lands and subsequent animal feed constraints. The dominant livestock species in the watershed include cattle (Bos indicus), sheep (Ovis aries), goats (Capra hircus), donkey (Equus asinus) and horse (Equus caballus). Though there is an effort to stop free grazing, post harvest stubble grazing is still a common practice in the area.
Data type and sources
Though remotely sensed data are vital in LULC change studies, it cannot provide complete answers for the questions like why and how changes are occurring (Fisher 2011; Sohl and Sleeter 2012). Hence, to fully address the complex trends of LULC dynamics and describe the underlying drivers behind across spatial and temporal scales, it is mandatory to incorporate other biophysical and socio-economic data (Turner et al. 1995; Lambin et al. 2003). This study employed a combination of techniques to evaluate LULC dynamics, the major drivers and implications behind them. First, the trend and level of LULC change over the last four decades was analyzed using satellite image and GIS techniques complemented with field observations (particularly for the current status). Second, socioeconomic surveys were undertaken to examine local experiences and perceptions related to LULC changes and the drivers behind. Third, the overall implications of such changes on biophysical environments and local livelihoods of the watershed were referred and linked from existing literatures.
Four sets of digital satellite imageries such as Landsat MSS, TM, ETM+, and Landsat 8 of the year 1973, 1986, 2001 and 2017, respectively were used to examine spatio-temporal LULC dynamics of the watershed (Fig. 5). The selection of these satellite images was entirely based on the quality (e.g. cloud free) and long time series availability, correspondence with years of major regime/policy changes and/or events in the country, purpose of the question to be answered, and suitability of the seasons for collecting socioeconomic field data. The Landsat MSS 1973 image had a resolution of 79 m; while the Landsat TM 1986, Landsat ETM+ 2001 and landsat 8 images have a resolution of 30 m (Table 1). All these terrain-corrected and radiometrically calibrated Landsat images were freely accessed and downloaded from the online archive of the United State Geological Survey (USGS) Centre for Earth Resources Observation Systems (EROS) available at (http://earthexplorer.usgs.gov/). It would have been better to start with medium resolution images such as Landsat TM images for the study but since there were no such images in the 1970s; a lower resolution Landsat MSS 1973 image was taken as reference year for this study. During the acquisition of satellite image and associated metadata, information pertaining to platform, sensor calibration, projection, coverage, resolution, cloud covers and other relevant information were taken into account. The effects of solar illumination angle induced by the rugged terrain nature of watershed which may cause different reflectance for the same cover type were considered.

Landsat images used for LULC classification and analysis
The acquisition dates of images were made as close each other as possible to minimize troubles related to seasonal variations. Moreover, dry and clear sky months (December to January) were preferred to mitigate the effects of atmospheric conditions that blight the quality of optical remote sensing imagery. Since these months are seasons of harvesting, they are relatively ideal to easily identify each land use/cover types.
All imageries were projected to Universal Transverse Mercator (UTM) zone 37 N using World Geodetic System (WGS) datum (WGS_1984_UTM_Zone_37N) to ensure consistency between datasets during analysis. The are displayed in the table below.
Supplementary data
To validate classified images accuracy and further investigate driving forces and associated impacts of LULC changes, supplementary data, such as DEM, topographical maps and socio-economic data were collected from various sources. The Shuttle Radar Topography Mission (SRTM) DEM (30 m spatial resolution) was obtained from the United State Geological Survey (USGS) (https://earthexplorer.usgs.gov/). A digital elevation model was used for extracting slope properties, prepare topographic map, delineate and identify sub watershed areas, among others. The high-spatial resolution Google Earth was employed to collect the training and testing samples points for land use/cover classification and validation. The 1993 edition three sheets of (1039 A1, 1139 C3 and 1139C4) 1:50,000 scale and 40 m contour interval digital Topographic map were purchased from Ethiopian mapping agency (EMA) and used for geo-referencing of satellite images, preparation of the base maps and for LULC class verification and interpretation.
Socio-economic data were collected from the community through a series of questionnaire, key informant interview, focus group discussions which was facilitated by local development agents with the presence of the author and complemented by onsite field observations. The data type captured from local knowledge/experience were the nature of LULC change over time, perceived drivers of such changes and site-specific management efforts. Additional information supporting the interpretations, including policy documents, proclamations, implementation guidelines and statistical reports were obtained from national and regional government’s offices and official websites. Data analysis was done using SPSS v 22 and MS Excel 2010 Packages while the Satellite image analysis was performed with the help of ArcGIS 10.3 and ERDAS IMAGINE 2014 Softwares.
Data verification and error control
Data verification and error control have been given special attention in this study. To identify and interpret the main LULC types, field visit and observations were carried out at different times in the watershed. During the field survey, data on the historical and present LULC types were collected and localized by using GPS (GARMIN-60). Moreover, these reference areas were documented by photographic images (using digital camera) to strengthen the reliability of the data gathered. The GCPs information for the LULC types of the past were identified from elderly people, author’s prior knowledge and knowledgeable assistants from related government departments, such as agriculture and Natural resource offices of Tenta Woreda.
Digital image processing and land use/cover classifications
After selection and acquisition of appropriate satellite imagery in terms of coverage, resolution and accompanying metadata from the sources, an intensive preprocessing, such as re-sampling and layer stacking of the required bands were performed. To ensure image pixels uniformity, Landsat MSS 1973 image was re-sampled to 30 m pixels using the nearest neighborhood method (Johnson 2015). Then, the study area was extracted from the images using Subset tools in Erdas Imagine 2014. After creating subset images covering the watershed and checking the quality of the image, a classification scheme was developed to derive various LULC classes of the watershed.
To classify LULC categories, more than three hundred randomly distributed training sets of data, varying in size from 20 to 60 based on area coverage, were employed to locate training pixels for each land use/cover category and study periods. The training sites for recent images were generated by GPS reading supported by high resolution Google earth images while the training sites for older historical images were assigned with the aid of raw images visual interpretation, topographic maps, old black and white ground photographs of some sites within the study area, supplemented by local elder’s information and author’s prior knowledge. This approach was used by other researchers in their study of LULC change in Ethiopian highlands (Kindu et al. 2013, Demissie et al. 2017). The training signatures were then evaluated for class separability between LULC classes. In the evaluation stage, signature editions were done by deleting, merging or renaming until the most satisfactory result achieved.
Finally, supervised classification and visual interpretation technique were applied for all the images, following Maximum Likelihood classification algorithm and change detection comparison strategies. Authors prefer to use the Maximum Likelihood algorithm with the assumption that it minimises classification error for classes because this approach incorporates both class covariance matrices and mean vectors as signatures, and merging of constituent spectral class signatures to obtain those for rationalized classes (Jensen and Lulla 1987; Foody 2002; Otukei and Blaschke 2010; Kantakumar and Neelamsetti 2015).
In the process of classifications, some LULC units were misclassified to other classes. For instance, bare lands were misclassified to the farmland/settlements class. This happens due to the fact that some bare land’s spectral properties appeared similar to that of harvested croplands which bring difficulties in distinguishing them during image acquisition. To improve classification accuracy and reduce misclassifications, recoding techniques were applied to clean misclassified ones using ERDAS software through visual inspections.
To simplify and reduce the number of LULC classes, some related LULC classes were merged together into one class. For instance, Croplands and settlements were aggregated as farmlands/Settlements as it was difficult to identify the dispersed rural settlements, where in many cases hamlets are surrounded by farmlands, into separate land use/cover types. Similarly, due to the intermingled nature of shrub and bush lands, it was difficult to distinguish these two categories and hence was labeled as shrub/bush lands to report the LULC study results (Table 2). Nonetheless, the authors realized that combining the different LULC classes could hidden differences among them and may exert its impact on the quality of the outputs (Misana et al. 2012). For nomenclature purpose, LULC classification types commonly used for Ethiopia were referred and adopted for ease comparison of results.
Post classification accuracy assessment
In order to evaluate the accuracy of a classification, more than 300 validation points, which were spatially and temporally distributed in the whole watershed and categorically encompassing all LULC types were generated through stratified random sample strategy (Jensen 2005).
Corresponding high resolution Google Earth images were used as additional sources of information that aided the validation process. However, for the year 1973, quantitative accuracy assessment were not done due to absence of validated map, high resolution Google Earth images and aerial photographs of the watershed for this particular year. Therefore, to ascertain the relative classification accuracy of this year, invariant ground features were employed as validation data and a qualitative comparison of the classified map were compared with these ground features (Sabr et al. 2016). Finally, the poster size colour printout hard copy of the classified map unit of 2017 was taken into the field to check the reality on the ground cover classes and to improve the classification accuracy.
Then, the overall accuracy, Kappa coefficient, producer’s accuracy and user’s accuracy were calculated from the error matrix (Foody 2002; Fan et al. 2007; Congalton and Green 2009). The overall classification accuracy was computed by dividing the number of correct values in the diagonals of the matrix to total number of values taken as a reference point; producer’s accuracy was derived by dividing the number of correct pixels in one class divided by the total number of pixels as derived from reference data; user’s accuracy was calculated by dividing correct classified pixels by the total number of pixels and Kappa coefficient, which measures the agreement between the classification map and the reference data, were calculated as per Bishop and Fienberg (2007) (Eq. 1);
where K is Kappa coefficient, r is the number of rows in the matrix, xii is the number of observations in row i and column i (the diagonal elements), xi+ are the marginal totals of row i, x+i are the marginal totals column i, and N is the total number of observations.
Change detection and analysis
The changes in LULC that had occurred in the watershed over the period of study were detected through post-classification comparison approach (Singh 1989; Fan et al. 2007; Chen et al. 2012). Post classification comparison (map-to-map comparison) methods were preferred in this study for the number of reasons. Firstly, using this method minimizes the problems associated with multi-temporal images recorded under different atmospheric and environmental conditions and by different sensors, (Singh 1989; Yuan et al. 2005). Secondly, this methods provide the extent and nature of ‘from-to’ change information (Jensen 2005). Based on this ground, four LULC maps were compiled to display the type of LULC classes and compare between the classified images. Then the whole study period (1973–2017) was classified into four sub-periods (1973 to 1986; 1986 to 2001; 2001 to 2017; and 1973–2017 which includes the entire 43 years of study periods). Then, paired overlay was performed through spatial analysis in GIS in order to detect, compare, and analyze patterns and directions of changes and to quantify persistence, gains, losses, total change, net change, and swapping of LULC occurred during the time period considered in the watershed (Pontius et al. 2004).
The percentage share of each LULC type in a study area was computed as:
where xi and Y are the area of the i-th LULC type and the study area.
To determine the magnitude, trend and rate of land use/land cover changes in the watershed, the area comparison analysis was made by subtracting the total area of each classes of 1973 from 1986, 1986 from 2001, 2001 from 2017 and 1973 from 2017 which the result could be positive (increasing) or negative (decreasing). The percent and rate of land use/land cover change were computed by the following formula (Kindu et al. 2013; Demissie et al. 2017):
where A is area of LULC (ha) in time 2, B is area of LULC (ha) in time 1; C is Time interval between A and B in years.
Conversion matrix was used to distinguish the changes of each category at the expense of others and its general structure follows the format displayed on Table 3. The rows display the categories of time 1 (initial Time), and the columns display the categories of time 2 (subsequent time). Entries on the diagonal (that is, Pjj) indicate the amount of land use/cover category which remained persistence of class j between the time period and used to calculate the gains and the losses of land use/cover classes while the off-diagonal entries show the size of the area that transitioned from category “i” to a different category “j” during the time interval (Aldwaik and Pontius 2012). For ease of reference, the equations and notation used to compute various components are presented as follows:
The proportion of the watershed Pi + that is occupied by class i in time 1, is given by (Eq. 5):
where n is the total number of LULC classes. Similarly, the proportion of the watershed P+j that is occupied by class j in time 2 is given by (Eq. 6):
Similarly, the gain, loss, persistence, swap and total change were calculated for all the four-classified imagery using the equations outlined below (Pontius et al. 2004; Braimoh 2006).
The Gain (Gij) was calculated through the difference between the total value for time 2 (P+j) and the persistence (Pij), using the Eq. 7:
On the other hand, the Loss (Lij) was the difference between the total values for the time 1 file
(Pj+) and the persistence, using the Eq. 8:
The swapping (Sj) is the exchange between the categories i.e. the proportion of a given class that changes location, while the total surface area remains the same. It denotes concurrent gain (i.e., difference between class i and persistence) and loss (i.e., difference between class j and persistence) of a given land use/cover class. Swap indicates the fact that a lack of net change does not necessarily mean a lack of change in LULC in the watershed.
It was calculated as two times the minimum value of the gains and losses, through the Eq. 9:
The net change indicates the definite change between two periods of time. It was determined by calculating the difference between the Total column and the Total row.
The total change for each category (Cj) was the sum of net change (Dj) and the swapping (Sj), or the sum of gain and loss (Eq. 10):
If the net change is zero (implying gain is equal to loss), then the swap is twice the loss or gain.
The exposure of each land use/cover classes for a change were assessed using the loss to persistence ratio (Lp = loss/persistence) which assesses the vulnerability of a land use/cover classes for a change; gain to persistence ratio (Gp = gain/persistence) which evaluates the gain of a land use/cover in comparison to its time 1 size, net change to persistence ratio (Np = net change/persistence) (Braimoh 2006; Ouedraogo et al. 2010).
Values of Gp and Lp greater than one imply that a given land use/cover class has a higher probability to change to other land use/cover class than to persist in its current condition (Braimoh 2006). If the value of Np was negative, the land use/cover class would have a higher probability to lose area to other land use/cover classes than to gain from them.
Finally, two sorts of data were generated; namely, four land use/cover maps, which illustrates the changes in a spatial context and various tables which exhibit the amount of areas for each LULC categories and a cross-tabulation matrix which demonstrate LULC transition from category to category at different study periods. Moreover, bar graphs and tables were used to display quantitative land use/cover class as a function of topography (i.e. altitude, and slope categories). The overall methodological flow chart showing the sequence of data acquisition, image classification and analysis is depicted in Fig. 6.
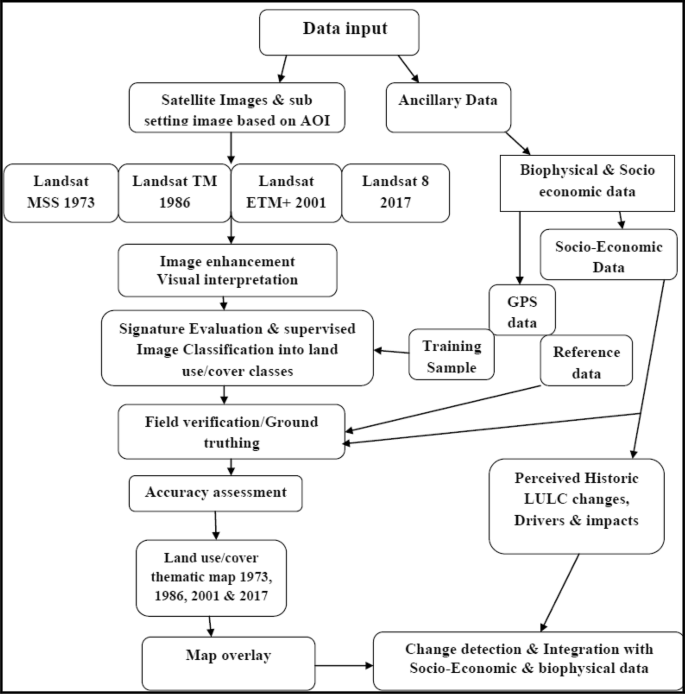
Methodological flow chart showing the sequence of image classification and analysis
Results and discussion
Spatiotemporal distributions of LULC types in Gedalas watershed (1973–2017)
The spatio-temporal quantity of LULC types of each category was analyzed in terms of total area and percentage for each study periods (Table 4, Fig. 7). The result indicated proportion of each LULC classes varied considerably on different dates considered. In 1973, the dominant LULC types in the watershed were farmlands/settlements accounting for more than 50% of the total area followed by Afro/Sub afro alpine vegetation (19.8%), grass lands (16.3%), and shrub/bush lands (10.8%). Bare lands, Woodlands/plantations, and Water courses/beds accounted the smallest proportion of the watershed. Though the extent varied among land use classes, the order of proportion occupied by the LULC types in the study area remained the same in 1986. In 2001, farmlands and settlements were still the dominant category (48.4%), followed by Afro/Sub afro alpine vegetation (19%) but the ranks of shrub/bush lands (14.8%), and grass lands (12.8%) were reversed. These orders continued for 2017 LULC distributions. The results showed that farmlands/settlements were/are remained by far the dominant LULC of the watershed for the last 43 years in the watershed.

Spatial patterns LULC of Gedals Watershed produced from satellite image, 2017
Accuracy assessment of LULC classification
The overall classification accuracy report of 97, 89 and 96% were attained for the 1986, 2001 and 2017 classified images, respectively. Since the values falls above the cut point of the standard overall classification accuracy level of 85% (Anderson 1976; Congalton and Green 2009) with no class less than 70% (Thomlinson et al. 1999), we can conclude that there is an acceptable agreement between the classified image and the ground reality it represents. A kappa coefficient result was found to be 0.96, 0.78, and 0.94, for years 1986, 2001 and 2017 respectively (Table 5). The results showed a strong agreement for each of the three classified images (Lea and Curtis 2010).
Land use/cover changes and its driving forces in Gedalas watershed (1973–2017)
The LUC changes were categorized into four periods 1973–1986 (first period), 1986–2001 (second period), 2001–2017 (third period) and 1973–2017 (whole period). Change detection diagnostics showed that in the first study period (1973–1986), total area of farmlands/settlements decreased from 50.2 percent to 42.7 percent irrespective of gains made from other LULC types, but then it showed an overall increasing trend throughout the whole study period with the highest change rate being observed in the period from 2001 to 2017 (Table 5). The reduction in the first study period was most likely due to abandonment of farmlands by farmers for reasons of massive rural out-migration and resettlement program of the government to mitigate severe land degradation and historic drought episodes of 1984/85 which had a devastating impact on human population and livestock resources of Wello (North Eastern Ethiopia) in general the study area in particular. Such abandoned farmlands were presumably taken over by grass and regenerated into shrub/bush covers hence the observed increase in this two-land use/cover types in this period. For example, the famine of Wello caused by drought of 1984/85 is still remains as tragic memory to the world community.
The following quote taken from the review of Rahmato is a good proof for the recurrent drought problem of the area:
The Wello (where the study area is part of it) highlands are on the leeward side of the main rain-bearing winds and thus receive much less precipitation than the highlands in western Ethiopia on the same latitude. Rainfall is frequently unreliable, and on many occasions the belg rains may fail completely, and the Kiremt rains may be short. This has been the process by which droughts and famines have been triggered for countless generations (Rahmato 2001:6)
The Afro/Sub afro alpine vegetation, which was/is the second dominant cover in its surface area, mostly located on the highest elevation and montane ecoregion and accounted for 19.8, 19.4, 19.0 and 14.7 percents of the watershed in the four consecutive study periods. It should be noted that the Afro/Sub afro alpine vegetation areas exhibited declining tendency in its spatial area coverage in all study periods. However, the greatest reduction occurred between 2001 and 2017 compared to that between 1973 and 2001. This could be ascribed to the continuous expansion of cultivated lands (every available piece of land were used for growing crops), settlements and grazing lands towards higher elevations which was not historically conducive for these purposes due to relatively difficult accessibility, remoteness, and harsh climatic conditions.
As it was noted from the discussions with village elders, some decades ago there was snow covered area in their localities. But, recently it is totally disappeared, suggesting that the influence of local climate change in the area is substantial. Interview with local development agents and the community members also show considerable agreement that the Afro-alpine ecosystems of the watershed (Locally Known as ‘Gaussa’) is under intense pressure from all directions, due to human population growth and associated cropland encroachment, uncontrolled grazing by livestock, unsustainable grass harvesting and recurrent drought which all poses its own contemporary management challenge. Moreover, damaging culture of fuel wood collection practiced to the extent of digging and uprooting of the shrub, has been one the major problems not only affect vegetation cover but also inhibit the regeneration probability of affected plants in the area.
Although Amhara Regional Rural Land Administration and Proclamation No. 46/2000 offers legal framework and supports community roles in conservation natural resource by stating: “Communal lands can be managed and used by customary laws as long as they do not contradict the proclamation”, this has not been translated into management practices on the ground and there is no strong bye-law enforcement to reduce human-associated threats; and ensure the sustainable use and protection of local resources.
Detailed field checks confirmed that the farmlands/settlements and grazing lands are still expaning upward towards the afro/sub afro alpine areas almost in all slope classes in a greater extent. It was also noted from onsite observation that considerable areas of the alpine zone were recently allocated for landless youth to till and sustain their life. This finding is in line with the research report of Simane et al. (2013) who conclude expansion of cultivation to the alpine zone of Choke mountain watershed as the result of population pressure.
By comparison, the proportion of shrub/bush lands showed an increasing trend in the first and second study period, increasing from 2592 ha in 1973 to 2924 ha in 1986 and 3548 ha in 2001. As mentioned above, the increase in shrub/bush land area is presumably attributed to gains from farmlands and grasslands due to devoid of inhabitants for reasons cited above. In contrast to the changes witnessed in the first and second analysis period, the area of shrub/bush land showed decreasing trend after 2001. This could be attributed to farmland/settlement expansions as the result of the reallocation of abundant lands to landless youths and to those who were returned from resettlement (either because of their own initiative or were chased out) and returnee ex-soldiers during and after the dawn fall of the military regime of Ethiopia in 1991. The local communities also cut down young and immature trees and shrubs for firewood, fences and thatching without plant seedling in return to ensure continued survival of vegetation. This is in line with studies carried out in other parts of Wello landscapes (e.g. Amare 2007).
Regarding the woodlands/plantation change, it did not show specific trends in the study periods and its spatial distribution is characterized by a very high fragmentation. The result showed that before 1970s, the woody vegetation cover of the watershed was almost negligible (less than 1%). The watershed experienced increasing trends of woodlands/plantation in the first-time interval (1973–1986) particularly after 1980 which increased more than threefold of its initial cover of the watershed’s area (i.e. from 0.73 percent in 1973 to 4.83 in 1986). The apparent increase of woody biomass in the first study period is likely to be a result of early 1980’s degraded land rehabilitation and massive conservation efforts policy of the Derg regime (backed by significant international support) through exclosure of hillsides, tree-planting campaign and the planting of eucalyptus trees by private farmers. This indicates that, in addition to the national-level continuous endeavor in tree planting, forest protection and conservation, the local government has made enormous efforts in ecological protection.
However, the woodlands/plantation cover declined gradually from its highest level of 4.8% (1157 ha) in 1986 to 2.3% (547 ha) in 2001. The decline in woodland/plantation is attributed to the agricultural land expansion, widespread cutting down of trees for construction purpose, charcoal production and firewood consumption. This period also corresponds to regime change. According to local informants, there was devastation of enclosures especially by free grazing and excessive wood harvesting by the local communities during the civil war (e.g. from 1990 to 1991) since there was no formal government institutions (power vaccum) to control the destruction of natural resources. Even during the transition period (1990–1995), there were no strong government, environmental policies and institutions. Discussions with expert informants and local elders further revealed that the destruction was highest on Government-controlled enclosures during the 1991 government change. This finding was in line with the research report of Amare (2007) and Woldeyohannes et al. (2018) conducted in eastern escarpment of wello and Abaya-Chamo Basin of southern Ethiopia respectively. For instance, Amare (2007), quoting one of the then forest expert of the Woreda, stated that “as the result of power vacuum, community forest of eastern escarpment of wello were ruthlessly exploited and deforested by the community to the extent of uprooting”.
While the overall rate of change is in a monotonic manner, the study finds an increasing tends and an important spatial change was noted in woodlands/plantation after 2001. This encouraging result can be ascribed to the implementation of a nationwide integrated watershed management campaign. The planting of trees on sloppy hillsides, reduction in free grazing and implementation of area closure on degraded hills by the administrative decision might be linked to the gradual increase in woodlands/plantation in the watershed.
As reported by the elderly people and verified in the field, the ongoing community-based integrated watershed management interventions and sustainable land management program seems contributed a lot for the improvements of the vegetation cover of the watershed. The enclosed parts of the watershed also showed rehabilitation tendency most likely due to preclusion from livestock and human interferences.
LULC inter-category transitions in Gedalas watershed (1973–2017)
Though the rate of overall change showed periodic fluctuations; the Gedalas watershed has experienced intricate LULC transitions derived from natural factors and human mismanagement of resources over the last four decades of the study period. The LULC changes were inspected using the post classification transition matrix. For this effect, we overlay the 1973 map with the 1986 map, 1986 map with the 2001 map, 2001 map with the 2017 map and then the 1973 map with the 2017 map to generate four matrixes.
These matrixes were used to compute the area of gains, losses, persistence and swapping between LULC types. The analysis result at different periods revealed that most these changes were dynamic and non linear, that is, the change from one LULC types to the other does not follow a similar pattern. The change rates for each LULC type in the watershed during the periods were not the same. For instance, between 1973 and 1986 grasslands gained the most, followed by woodlands/plantations and shrub/bush lands while substantial decline was observed for farmlands/settlements. In the second-time interval (1986–2001), the major gains were made by woodlands/plantations, farmlands/settlements and shrub/bush lands. The area of farmlands/settlements increased steadily mainly at the expense of grass lands, woodlands/plantations and afro/sub afro alpine vegetation which contradicts with report of Bewket and Abebe (2013) who documented the expansion of open grassland and riparian vegetation cover in Gish Abay watershed in the Blue Nile Basin. Similarly, shrub/bush lands expanded progressively primarily at the expense of woodlands/plantations (Table 6). Likewise, bare lands and stream courses/beds showed relative increase, while the remaining categories showed declines in which the largest decline observed in grass lands followed by woodlands/plantations. The increasing demand for cultivated lands might have contributed to the decline of grasslands. The result agreed with the findings of Bewket (2002) in Chemoga watershed of Northwest Ethiopia and Gebremedhin et al. (2017) in Maybar sub watershed of Northeast Ethiopia. However, it contradicts with the finding of Zeleke and Hurni (2001), who reported an increase in grassland cover in the Anjeni area, Northwest Ethiopia.
In the period 2001–2017, farmlands/settlements, woodlands/plantations and bare lands showed a relative expansion at the expense of afro/sub afro alpine vegetations, shrub/bush lands and whilst the other categories showed relative declines from their initial states; i.e. 2001. The farmlands/settlements showed the rapid expansion as compared to the other land use/cover classes. This is likely because of population pressure and low productivity of the existing lands forced the farmers to further expand to mountainous areas and marginal lands.
The change in the area of afro/sub afro alpine vegetation was negative in all four periods. The decreasing rate of afro/alpine vegetation reached the highest value in the third study period. If we compare LULC change status of the initial and final study years (1973–2017) for each LULC categories, the greatest losses occurred in afro/sub afro alpine vegetation with a net loss of 1528 ha since 1973.
The greatest gains were made by farmlands/settlements and Woodlands/plantations with a net gain of 786 ha and 714 ha respectively over the analysis period. These LULC types were involved in the largest changes in the landscape in part because they accounted for a large part of the landscape. The largest transitions in this period were from afro/sub alpine vegetation to farmlands/settlements (1007 ha), farmlands/settlements to shrub/bush land (880 ha), shrub/bush to plantations/woodlands (733 ha), grasslands to farmlands/settlements (689 ha), Afro/sub afro alpine vegetation to shrub/bush lands (606 ha), grass lands to shrub/bush lands (393 ha) and farmlands to bare lands (200 ha) (Table 6).
This finding is in line with most past and recent land use/cover dynamics research reports conducted within the various watersheds of Blue Nile basin and other parts of the country (e.g. Zeleke and Hurni 2001; Bewket 2002; Amsalu et al. 2007; Alemayehu et al. 2009; Garedew et al. 2009; Teferi et al. 2010; Tsegaye et al. 2010; Fisseha et al. 2011; Abate 2011; Kindu et al. 2013; Ariti et al. 2015; Zewdie and Csaplovics 2015; Gashaw et al. 2017) who documented continued expansion of farmlands/settlements at the expense of other land use/cover types particularly that of natural vegetation. However, there are also other studies which assert the opposite of these study reports. For example, the finding of Tegene (2002), Adugna et al. (2017) and Gebremedhin et al. (2017) confirmed that there was no significant expansion of farmlands in their respective studies in the Ethiopian highland watersheds. Table 6 summarizes the land use/cover transition matrix in which the diagonals of each matrix displays the proportion of land use classes that showed persistence while the off-diagonal entries comprise the area converted from one land use/cover category to the other categories between time 1 and time 2. The sum of each column shows total area in Time 1 for each land cover type. The sum of each row shows total area in time 2.
Persistence, net change and swap of LULC in Gedalas watershed (1973–2017)
As Table 7 resume, analysis of gains, losses, total change, absolute value of net change, persistence, swap, gain to persistent (gp), loss to persistent (lp) and net change to persistent (np) ratio of LULC classes were carried out between two independently classified maps of the initial and last study periods of the watershed.
The gains are the differences between the column totals and persistence. The losses are the differences between row totals and persistence. Total change is the sum of the absolute value of gains and losses for each category. Absolute net change is the absolute value of the difference between percent of LULC categories in 1973 and in 2017 in the watershed. Swapping is the surface area exchanged between land use/cover categories; this corresponds to the difference between total change and net change for each category. For example, equal gains and losses between LULC categories 1 and 2 would provide a net change of 0% but could correspond to a substantial total change and high swapping if significant areas of category 1 were converted to 2 and vice versa (Teferi et al. 2013; Braimoh 2006; Zewdie and Csaplovics 2015; Adugna et al. 2017).
As described above, the largest persistence in the watershed is observed for farmlands/settlements (45.5%) followed by Afro/sub alpine vegetation (12.5%) and grasslands (11.7%) for the period from 1973 to 2017). Similarly, farmlands/settlements, shrubland and woodlands/plantations experienced relatively more gains than losses (Table 6). Among these, farmlands/settlements showed the highest values for gain and losses as compared to the rest of LULC types and underwent the greatest total change within the watershed, even though its initial surface area was the largest. It also exhibited the highest rate of swapping, demonstrating extensive exchanges with other land cover types, losing surface area to other categories and gaining at the same time area from other categories. This implies, of the seven-land use/cover types, farmlands/settlements were the most dynamic category in the watershed, experiencing the swapping change dynamic during the study period. In contrast, the highest loss was recorded in Afro/sub afro alpine vegetation followed by grasslands. The former category has also the highest value for swapping next to farmlands/settlements and grasslands during the period.
The value of net change also shows some differences among the areas between categories. The highest net change value was observed in Afro/sub afro alpine vegetation. During the period, its losses were quite higher than its gain. Meanwhile, grasslands, with higher loss than gain, have the second highest net change value for the period. It had the third higher value for losses in the period.
Persistence and vulnerability of LULC dynamics in Gedalas watershed
The magnitude of the ratio indicates in all cases the gains to persistence ratio (indicates the chance to gain compared to their persistence), loss to persistence ratio (specify the exposure of the land cover for transition) and the net change to persistence ratio (indicates how much times the LULC types gain/loss than its persistence) (Braimoh 2006; Teferi et al. 2013; Zewdie and Csaplovics 2015).
If the Gain to Persistence ratio (G/P) values is higher than one indicates a greater chance of a land use/cover to gain than to persist. If the value of loss to persistence ratio (L/P) is higher than one, the land use/covers are rather vulnerable to changes to other land cover classes than to persistence (Braimoh 2006; Teferi et al. 2013). In this study, G/P and L/P values of all land use/cover classes are lower than one indicating the tendency to persist rather than to loss or gain. However, the G/P ratio of bare lands and shrub/bush lands are relatively higher, suggesting that these LULC categories have a tendency to gain than remain persistence. This implies the probability of higher vulnerability of the watershed to degradation and abandonment of farm lands to shrub/bush lands. The G/P of Woodland/plantation is zero, indicating that the gain of woodland/plantation is insignificant compared to its persistence.
Similarly, all land use/cover classes have an L/P value of lower than one indicating a lower vulnerability to lose than to persist. However, afro/sub Alpine vegetations have higher tendency of losing to other land uses/cover classes as compared to others (Table 8).
The net change to persistence ratio (N/P) of bare lands is higher indicating the net gain of bare lands increased by half of its persistence. The net loss of afro/sub Alpine vegetation is more of its persistence within the watershed. Grassland also got a net loss of about one-third of its persistence during the study period. The net change to persistence ratio is closer to zero for Farmlands/Settlements land uses/cover classes indicating that it had a lower tendency to change.
LULC patterns across agro ecology
Assessment of land use/cover patterns across agro ecological units is important to understand effects of topographic units for guiding management decisions and restoration strategies. To analyze the relationship between LULC and topography, the LULC Maps of the four study periods were delineated into three agro ecological belts considering elevations derived from 30-m Digital Elevation Model (DEM). The results of analysis of LULC status for the years 1973, 1986, 2001 and 2017 based on altitude (agroecology), are given in Figs. 8, 9 and Table 9.

Map depicting land use/cover distribution along agro ecology (1973–2017)

Land use distribution along Agro Ecology
Overlaying the LULC map with the agro ecology reveals that land use/cover classes were disproportionately distributed among the three agro-ecological zones. The largest proportion of farmlands/settlement and grasslands are mostly located in regions within Dega and Wurch agro ecological zone of the watershed. The main reason was that most of the land suitable for cultivation was located in these areas. While most of the shrub/bush lands, woodlands/plantations and bareland were located in the suburbs of the rugged terrain of Weyna Dega and Dega zones of the sub watersheds than in the upper reaches. This is due to the fact that most of the topography of the lower reaches are characterized by quite rugged terrains and therefore, enclosures are dominantly confined in this zone. Hence, areas that can be used for agricultural activities are very limited.
The results further show that the farmlands/settlement and grassland areas are mostly located in areas with an altitude of above 2300 m and extend up to above 3800 m in the watershed. This might due to the fact that only about 17 percent of the watershed is made up of flat to slopping areas. Given such rugged landscape, land for settlement, cultivation and grazing are extremely scarce in the watershed. With population pressure and concomitant growing land scarcity, more and more hillsides have been cleared of their vegetation cover and turned into settlement, croplands and grazing lands for many generations. Progressing upwards, however, there were no farmland/settlements witnessed especially above 3860 m in the watershed. Yet, in some areas, which were not used for agricultural activities in 1973, 1986 and 2001 has now turned into settlements and cropland areas. This is probably the effects of local climate change. Expectedly, the availability of woodland/plantations class also decreased in lower and higher areas of the watershed as well. The reason for the decrease would be attributed to unfavorable climatic conditions for the survival of trees species.
Though changes experienced in all agro ecological zones, land use transition process and extent also vary relatively across agro ecologies. For example, the major spatial change in afro/sub afro alpine was the conversion to cropland/settlements and/or grassland in mountain region of the Wurch agroecology. While the most significant change in Woodlands/plantation, grass lands and shrub/bush lands occurred within Dega agro ecological zones.
LULC patterns along slope categories
Despite there were minor variations in spatial coverage, the satellite imagery analysis for the study periods revealed that more than 80% of shrub/bush lands and woodlands/plantations were situated on slope categories ranging from moderately steep to very steep slopes (Table 10). This is probably due to the fact that since these areas are not conducive for cultivation, enclosures and rehabilitation activities were/are focused on these areas. Because of the poor natural conditions and sloppy nature of the terrain, much reforestation occurred in these areas. While the largest shares of farmlands/settlements and grass lands are located from flat to strongly slopping landscapes, more than 25% of these land use categories were/are still found on steep and very steep slope categories and hence, those steep agricultural fields could suffer from accelerated soil erosion and nutrient depletion. From this it can be easily understand that though the federal rural land administration and land use proclamation of Ethiopia (Proc. No. 456/2005, Article 13/6) stipulates the slope which is more than 60 percent shall not be used for farming and free grazing (FDRE 2005), in reality almost every steep slope had already been converted to cultivated and/or grazing lands. In fact, the Revised Amhara National Regional State Rural Land Administration and Use Proclamation (Proclamation No. 133/2006), article 5/7) (ANRS 2006), allow use of these rural land having slope more than 60 percent if it was priory seized by the land holders and so long as properly managed it. Thus, in the Gedals watershed, many areas of slopes greater than 60% are found employed for agricultural purpose, with or without conservation structures. Such state of affairs accelerates the deterioration of ecologically sensitive environments and threatens the fate of sustainability of local livelihoods. Hence, calls for great attention for sustainable land management activities.
Local perceptions on the drivers of LULC dynamics in Gedalas watershed
The analysis of community perceptions has gained popularity as a starting point in the context of resources management as local inhabitants possess far-reaching knowledge about their resource situations and problems. In other words, the use of geographic space is influenced by human perceptions and values (Creswell 2009). Lack of information about farmers understanding, preferences and priorities constrains planning of targeted land management strategies (Crossland et al. 2018). Hence, for acceptable, effective and sustainable interventions such as for environmental management decisions, capacity building, awareness raising campaigns and public participation, exploring the local knowledge and perceptions is indispensable. With this premise, an attempt was made to assess the perceptions of local communities on drivers of LULC dynamics in the watershed. The results of the analysis showed that the majority of the respondents asserted recurrent drought, population pressure and lack of livelihood options, fuel wood and timber extraction, livestock pressure and overgrazing, expansion of farmlands and settlements, government natural resources policy, terrain features of the area and land tenure insecurity (Fig. 10) were perceived and listed as the major drivers behind the LULC change in the watershed. The respondents were further asked to rank these driving force based on their perceived degree of intensity. Majority of the respondents (98%) ranked drought as the major driving force behind LULC change followed by population pressure and associated indiscriminate cutting of trees for fuel wood consumption.

Drivers of LULC change ranking by the local communities (2017)
In additions, a series of formal and informal group discussions were held with group of community members in various villages as well as key informant interviews in the watershed to identify the major perceived driving forces of LULC changes on their environment that were observed for the last 40 or so years. Key informants were elderly members of the community with an average age of 60 years and so who had lived in the study area throughout their lives and were knowledgeable about the dynamics in LULC.
Local residents were asked to narrate their experience on the impact of regime shift on LULC dynamics in line with the three successive regimes. Accordingly, they explained that during imperial regimes farmers’ motivation for tree planting was relatively low. During the military regime, enclosure supplemented with enrichment plantings of local and/or exotic species as well as SWC measures were common and hence, it was relatively better. But when the current government comes to power tree cutting was escalated particularly at the transition periods. Currently, the status of land cover of the watershed is relatively better due to the ongoing sustainable land/watershed management. The discussion result was link well with the result of satellite image analysis. However, the driving forces varied widely across the watershed. In this context, it is clearly visible from the transect walk that sustainable land/watershed management program has benefited the upper parts far more than the lower reach of the watershed.
They were also were asked to give their view on vegetation status, farmland sizes and soil fertility over time. Their responses are summarized as follows:
The situation of vegetation during the 1970s was better than the present despite recurrent drought impacts. Formerly, the human population was relatively small and agricultural lands were not a scarce resource. Consequently, there was a reasonable fallow period and hence, crop productivity was relatively better. There was also no problem for fire wood and livestock feed, the soil had a better fertility status and the rainy months were long. But, nowadays woody vegetation and variety of tree species, which were predominant in the area were steadily disappears and at present no longer visible or are available in limited amounts and area coverage; unlike the past, steep slopes are currently under cultivation. The fertility of the farm land has exhausted and its productivity has declining. It is demanding much input, which was not the case in the past.
In addition, the focus group discussants frequently point out drought birds, monkey, and rodents (mole rats) as the potential drivers of LULC changes in Weyna Dega and Dega agro ecologies of the watershed. In the words of one of the male focus group member, ‘‘Monkey roaming around our area not only destroys our crops during the cropping seasons but also devastate grass and other seedlings from enclosures, hillsides and grazing lands.’’ The participants explained further that the rate of crop attack increased before the crops have fully germinated and when it matures. Author’s observation also confirms the fact that the struggle between man and monkey has been an old-aged problem in almost all parts of the watershed that damage crops and other vegetation covers, including grass. When agricultural land expands against woodlands and shrub/bush land, the monkey habitation faces problems. When natural food is in short supply monkeys raiding crop on fields, which results in man-monkey conflicts. As the result of these facts farmers forced either to abandon the land or sow crops which are not preferred by monkey like Fenugreek (Trigonellafoenum-grecum). This land use change exerts negative implications on the sustainability of local livelihoods and environment and hence might be one possible reason for the LULC change in the area.
Similarly, one of the 76 aged key informants residing in the Wurch area (upper reach) elaborated his drought experiences in the area as follows:
When I was a child, we used to grow crops and the harvest was much higher compared to the present. The rain used to come regularly and consistently, and we were able to plant and harvest on time. But, since 1970s, the rainy seasons no longer follow known trends from the past, hence affecting the normal routine of the planting seasons. The rain has become quite erratic and insufficient. Sometimes it rains and sometimes it doesn’t. With no exaggeration, the amount of rainfall was not sufficient as it was before. I remember, the years 1972, 1978, 1984, 1989, 19993, 2003, 2009, and 2010 were drought years in this area. Of these drought years, the 1984 was the most terrible ever remembered in my life.
Therefore, though perceptions of people are often relative, it was found out that local communities are aware of LULC dynamics in their environment which compares well with the results of satellite image. Therefore, it is apparent that documenting local community viewpoints can be used as a chief source of supplementary LULC information in developing appropriate management planning at the local level (Additional file 1).
Implications of observed LULC dynamics for resource degradation and the need for SLM planning
LULC change may entail unintended implications and far-reaching long-term effects on ecological processes that potentially compromise the basic functioning of ecosystems. Therefore, understanding the implication of the past and present patterns of human–environment interaction is increasingly imperative for sustainable land management planning (Turner et al. 2007). Changes in LULC are an inevitable and complex phenomenon with multifaceted socioeconomic and biophysical implications. The available global literature indicate that these implications could be positive (convey desirable changes) such as regaining of natural cover and rehabilitation of degraded land through afforestation, reforestation enclosures and negative (bring undesirable changes), for instance, loss of biodiversity, soil erosion, the expansion of degraded landscapes and other ecological disasters. Due to scarcity of required data, this research did not determine the degree of associations between LULC changes and associated impacts. Therefore, what is presented below are literature-based author’s selected major LULC change implications supplemented by perceptions of local residents in the watershed.
Implications on biodiversity and habitat loss
Land use/cover and habitat loss are widely recognized as the major drivers of biodiversity depletion in Ethiopia (Nyssen et al. 2004). These losses and changes in turn pose significant challenges for meeting biodiversity conservation goals and targets (MEA 2005; Verburg et al. 2011; Jewitt et al. 2015). The changes in land use/cover also results in fragmentation of the landscape which in turn led to the loss of biodiversity as well as change in the structure and function of ecosystem services provision and human dependencies.
Apart from the satellite image analysis an aged local communities residing in the watershed were asked to narrate their observation and/or what they heard about the LULC changes and associated impacts in their locality in the last four decades through timelines (i.e., in the last three successive regimes-Haile Silase I, Derge and EPRDF). As living witness of the area, respondents replied that, in the past, there were a multitude of indigenous tree species and coarse grasses in the area. But, now days, the majority of these tree species were totally or partially disappear due to expansion of cultivated lands over time despite there is a promising signal of recovering of woody vegetations in the past two/three years. Loss of this vegetation was also allied with loss of wildlife habitat, habitat fragmentation and concomitant reduction in wildlife species diversity and availability.
The following quote regarding the loss of vegetation cover were taken from the explanation of one of the key informants residing in the Weyna Dega area of the watershed:
In the past, most of the area in our locality was covered with native vegetation of various tree species. There was variety of wildlife living inside. Local traditional Medicinal plants were easily collected from leaf, roots or barks of these plant species to heal almost all kind of human and livestock diseases. However, nowadays as you can see (pointing me to the hillside) such plant species are gradually disappearing and becomes rare (Mekonnon, 69, Sengolla).
The study has shown that agriculture/settlement was pushing into formerly wooded areas, peripheral steep slope lands, afro mountain ecosystems and other vulnerable areas until biophysical restrictions limited further expansion. This expansion particularly to afro mountain ecosystems has implications for the loss of biodiversity in both flora and fauna. For example, the respondents noted that endemic and rare animal species such as Ethiopian wolves (Canis simensis) which was abundant in the area, has recently became locally extinct from many sites (oral communication with local residents). This extirpation was primarily due to habitat destruction as a result of increased demand for farmland and the expansion of grazing lands.
Implication on hydrological regimes
Since the hydrological response in a given watershed is partly dependents on LULC characteristics of the area, change in LULC alters the hydrological fluxes such as runoff response and sediment load relationships of the local watershed (Mengistu 2009; Mueller 2009; Gebresamuel et al. 2010; Getachew and Melesse 2013; Wagesho 2014; Gebremedhin et al. 2017). Empirical investigations have confirmed that LULC also exert influence on the energy balance within the hydrologic cycle due to its effect on evaporation, transpiration and solar radiation interception (Ma et al. 2009). Land with no or under little vegetative cover is subject to low water retention and infiltration, high surface runoff and subsequent increases in sediment and nutrient loading into streams (Bewket 2002; Alemayehu et al. 2009). It is relevant to mention Lake Haramaya of eastern Ethiopia which disappeared, due to deforestation and clearing of land for farming activities on its surrounding watershed (Alemayehu et al. 2007).
All these indicate, LULC dynamics has direct implications on the hydrological regime and magnitude of runoff and base flow in the watershed. This reasonably calls for the need for more effort on stabilization of the land use/cover change in general and investments on sustainable land management activities in particular so as to regulate the hydrologic related turmoil occurring in the watershed.
Implication on soil erosion and sediment loads
Land use/cover is one of the major factors that determine the surface runoff, rate of soil erosion and sediment yield from the Catchments (Wischmeier and Smith 1978; Bewket 2002; Schutt and Thiemann 2006; Schutt and Wenclawiak 2010; Adamu 2013; Kidane and Alemu 2015; Gebremedhin et al. 2017). Removal and conversion of natural vegetation cover into cultivated land and/or grazing fields are commonly practiced in the study watershed. Depletion of these vegetation covers then reduces protection cover of the soil and leaves the top soil vulnerable to the impacts of rain drops; which may accelerate the detachment, removal, and transport of sediment by running water, which in turn, contributes to land degradation and dramatic declines in land productivity (Bewket 2002; Tsegaye et al. 2010; Moges and Holden 2006; Tefera and Sterk 2010).
The quantitative evidence obtained through interpretation of satellite image and ground survey indicated that the study area has undergone significant LULC changes, since 1973. This LULC change along with the steep slope topography of the watershed, exacerbated soil erosion. This is particularly more intense on farmlands. As it was reported by Hurni et al. (2016), runoff and associated soil erosion is by far higher in agricultural lands as compared to forest lands in Ethiopian highlands where mountainous and steeper slopes are cultivated, in many cases without protective measures. Above all, most of the available trees particularly around homesteads and even hillsides are dominated by eucalyptus trees which are not expected to reduce soil erosion due to sparse nature of the canopies (FAO 1988 cited in Bewket 2002).
As it was observed in the field during transect walk and clearly stated by the focus group participants, removal of the top fertile soils and the formation of deep and wide gully is common particularly in the margin of cultivated land in almost all parts of the watershed. According to local informants, during short and intense rains and streams occasionally change route and flow over agricultural and grazing lands, resulting in deposition of gravel, stone and boulder which make the land unsuitable for farming and grazing.
Implications on climate change
Ethiopia is arguably the most vulnerable to the impacts of climate change and variability (Kassie et al. 2013). LULC change is linked to climate and weather in complex ways and play critical roles in the interaction between the land and the atmosphere (World Bank 2008; Bekele et al. 2015). LULC can induce climate change at a range of spatial and temporal scales (Ellis and Pontius 2006; Jones et al. 2009; IPCC 2013; Mahmood 2010). For example, change in LULC affects the exchange of sensible heat between the land surface and the atmosphere. LULC influence local climate through absorption or emission of greenhouse gases and by modifying the physical properties of land surface (Foley et al. 2003; Bonan 2008). Hence, changes in LULC (e.g. conversion of forest land to agricultural uses) can have profound implications on land surface climate interactions by altering the exchange of heat, moisture, momentum, trace gas fluxes and albedo (Bonan 2008; Richter and Houghton 2011). As is well known, clearing forests for agriculture can have a significant impact on evapotranspiration rates which can enhance climate extremes such as droughts (Cook and Sims 1975; Taylor et al. 2002; IPCC 2007; Verburg et al. 2009). Hence, the observed LULC change in the study watershed most likely had brought about such environmental consequences.
Implications on livestock management
Livestock in the study watershed are extremely important as they have multifaceted roles such as provide food and improve the nutritional status of the people, serve as a source of security at times of crop failure and so on. The major feed resources for livestock are natural pasture. It is also not uncommon to use considerable areas of Shrubland for grazing and browsing. Hence, any alteration in the availability and quality of these livestock fooder had direct implications on the quantity and performance of the livestock resources. Such process has been apparently witnessed in the study area. As it was observed from satellite image analysis (Table 5), grassland and shrubland areas retreated particularly for the last two study periods. This would trigger shortage of animal fodder and this in turn resulted in declining quantity of livestock resource and the services obtained from livestock (e.g. for plowing, traction, transportation and manure to maintain soil fertility). Put in other words, the expansion of cultivated lands mainly by expanding into grazing lands results in decline in number of livestock populations in the watershed which has negative implication on sustainable land management (Zeleke and Hurni 2001).
Implications on the use of biomass for fuel energy
Due to a lack of cheaper alternative sources of energy, local communities depend on biomass energy (fuel wood, crop residues, and dung cakes) to meet their household energy needs (e.g. cooking, boiling, lighting, and heating) in all agro-ecological setting of the watershed. Thus, decline in woodlots and other tree species implies shortage of biomass source of energy for the rural household.
Conclusions
LULC is dynamic in its nature, and hence its change in time and space is inevitable. This study has highlighted the magnitude, biophysical and socioeconomic driving forces and implications of LULC change in the Gedalas watershed during the 43 years considered. Land use/cover change was observed in the watershed across various spatial and temporal dimensions. The transition matrices highlight the dominant dynamic events and the internal conversions between land use/cover types. The major change detected in the study area from satellite images indicated a consistent net gain in farmlands/settlements particularly at the expense of afro-montane ecosystems and its unique flora and fauna. There has been consistent increase in farmlands/settlement cover in the upland and, while shrub/bush land and grasslands area have continued to decrease. The transition matrices illustrates that the afro alpine areas are the most affected LUUC categories over the study time period, as it significantly shrank from 19.8% of the total watershed area in the 1973s to 14.7% in 2017, mainly as the result of an expansion of the cropland, built-up area and grazing land. The study also depicts an increasing trend in the total cultivated areas since the beginning of 2001 and in subsequent years. The comparison of the prepared maps with the personal field observation and Google Earth image reveals similar patterns in the distribution LULC categories.
Perceptions of the local communities on LULC change substantially agree with data from satellite images. The majority of the rural communities reported that there have been changes in the patterns of LULC in past decades. The most important driving factors for such change include rapid population growth and concomitant poverty, expansion of cultivated and settlement land, lack of alternative sources of energy, regime change and associated policy directives in the study periods. Study also indicates that the LUCC in the study area was evidently aggravated by environmental attributes, such as recurrent drought and fragile physical attributes such as terrain features of the area. Though the majority of farmlands/settlement was generally situated in flat to moderately sloping areas (< 30%), considerable proportion of these LULC categories were observed on steep and very steep slopes (> 30%).
The observed LULC changes have significant implications on the environmental and socio-economic dimensions of the watershed ranging from loss of terrestrial biodiversity, reduction in vegetation cover, change in hydrological regimes, increase in soil erosion and sediment loads, change in local climate and other socio-economic impacts on local livelihoods and livestock management of the watershed.
Hence, to mitigate unfavourable land use/cover change impacts and sustain the community livelihoods, it is vital to understand the interactions between the bio-geophysical and socio-economic processes leading to the land use/cover dynamics and associated land degradation. In this regard, the study suggested that the ongoing government initiated integrated watershed management and sustainable land management programs should be strengthened with genuine participation of local community. In addition, the expansion of farmlands/settlement area should not be allowed to increase at the expense of mountain ecosystems and marginal lands and rural land use policy should be strictly followed. It will be difficult to achieve sustainable land use unless intervention planning focus on community livelihood diversification and sustainable intensification strategies by building local awareness and capacities to invest on SLM activities, thereby to improve productivity of the land and reduce the vulnerability of the environment to human pressures and drought impacts.
Availability of data and materials
All the required data collected for analysis are included in the manuscript. If the datasets used in the manuscript are not clear, the corresponding author is ready to clarify and even to send the data on request.
Abbreviations
- LULC:
-
land use and land cover
- TWARDO:
-
Tenta Woreda Agriculture and Rural Development Office
- DEM:
-
digital elevation model
- FAO:
-
Food and Agricultural Organization
- MOA:
-
Ministry of Agriculture
- SLM:
-
sustainable land management
References
Abate S (2011) Evaluating the land use and land cover dynamics in Borena Woreda of South Wollo Highlands, Ethiopia. J Sustain Dev Afr 13:87–107
Adamu GA (2013) Assessing the impact of land use and land cove change on hydrology of the watershed: a case study on Gilgel-Abbay Watershed Lake Tana Basin, Ethiopia. Master Thesis, EU-Erasmus Mundus Consertium Universities
Adugna A, Abegaz A, Legass A, Antille DL (2017) Random and systematic land-cover transitions in north-eastern Wollega, Ethiopia. Focus/Land Use Land Cover Transistions 332(2):3–15
Aldwaik SZ, Pontius RG (2012) Intensity analysis to unify measurements of size and stationarity of land changes by interval, category, and transition. Landsc Urban Plan 106:103–114
Alemayehu T, Furi W, Legesse D (2007) Impact of water overexploitation on highland lakes of eastern Ethiopia. Environ Geol 52:147–154
Alemayehu F, Taha N, Nyssen J, Girma A, Zenebe A, Behailu M, Deckers S, Poesen J (2009) The impacts of watershed management on land use and land cover dynamics in eastern Tigray (Ethiopia). Resour Conserv Recycl 53:192–198
Amare B (2007) Landscape transformation and opportunities for sustainable land management along the eastern Escarpment of Wello (EEW), Ethiopia. Ph.D. Dissertation, University of Bern, Bern, Switzerland
Amhara National Regional State (ANRS) (2006) The revised rural land administration and use determination proclamation, No. 133/2006, Bahir-Dar, Ethiopia
Amsalu A, Stroosnijder L, Graaff Jd (2007) Long-term dynamics in land resource use and the driving forces in the Beressa watershed, highlands of Ethiopia. J Environ Manag 83:448–459
Anderson JR (1976) A land use and land cover classification system for use with remote sensor data, vol 964. US Government Printing Office, Washington, DC
Anil N, Sankar G, Rao M, Sailaja U (2011) Studies on land use/cover and change detection from parts of South West Godavari District, AP—using remote sensing and GIS techniques. J Ind Geophys Union 15(4):187–194
Ariti AT, van Vliet J, Verburg PH (2015) Land-use and land-cover changes in the Central Rift Valley of Ethiopia: assessment of perception and adaptation of stakeholders. Appl Geogr 65:28–37
Bekele M, Tesfaye Y, Mohammed Z, Zewdie S, TebikewY, Brockhaus M, Kassa H (2015) The context of REDD+ in Ethiopia: drivers, agents and institutions. Occasional Paper 127. CIFOR, Bogor, Indonesia
Bewket W (2002) Land cover dynamics since the 1950s in Chemoga watershed, Blue Nile Basin, Ethiopia. Mt Res Dev 22(3):263–269. https://doi.org/10.1659/0276-4741
Bewket W, Abebe S (2013) Land-use and land-cover change and its environmental implications in a tropical highland watershed, Ethiopia. Int J Environ Stud 70(1):126–139. https://doi.org/10.1080/00207233.2012.755765
Bishop YM, Fienberg SE (2007) Discrete multivariate analysis theory and practice. MIT Press, Cambridge
Bonan GB (2008) Ecological climatology. Cambridge University Press, New York, p 550
Briassoulis H (2000) Analysis of land use change: theoretical and modeling approaches. www.braiassoulis.edu.com. Accessed 2 Apr 2017
Braimoh AK (2006) Random and systematic land-cover transitions in northern Ghana. Agric Ecosyst Environ 113:254–263. https://doi.org/10.1016/j.agee.2005.10.019
Bringezu S, Schütz H, Pengue W, O'Brien M, Garcia F, Sims R, Howarth L, Swilling M, Herrick J (2014) Assessing global land use: balancing consumption with sustainable supply. United Nations Environment Programme
Central Statistical Agency (CSA) (2013) Ethiopia rural socioeconomic survey report, Addis Ababa
Chen X, Giri CP, Vogelmann JE (2012) Land-cover change detection. In: Giri CP (ed) Remote sensing of land use and land cover; principles and applications. CRC Press, Boca Raton, pp 153–175
Congalton RG, Green K (2009) Assessing the accuracy of remotely sensed data: principles and practices, 2nd edn. CRC Press, Taylor & Francis Group, Boca Raton
Cook CW, Sims PL (1975) Drought and its relationship to dynamics of primary productivity and production of grazing animals. In: Proceedings, evaluation and mapping of tropical African Rangelands. Addis Ababa, Ethiopia
Creswell J (2009) Research design: qualitative, quantitative, and mixed methods approaches, 3rd edn. Sage Publications, Thousand Oaks
Crossland M, Winowiecki LA, Pagella T, Hadgu K, Sinclair F (2018) Implications of variation in local perception of degradation and restoration processes for implementing land degradation neutrality. Environ Dev 28:42–54. https://doi.org/10.1016/j.envdev.2018.09.005
Demissie F, Yeshitil K, Kindu M, Schneider T (2017) Land use/cover changes and their causes in Libokemkem District of South Gonder, Ethiopia. Remote Sens Appl Soc Environ 8:224–230
Desalegn T, Cruz F, Kindu M, Turrión MB, Gonzalo J (2014) Land-use/land-cover (LULC) change and socioeconomic conditions of local community in the central highlands of Ethiopia. Int J Sustain Dev World Ecol 21:406–413
Ellis E, Pontius RG Jr (2006) Land-use and land-cover change encyclopedia of earth. Environ Protect 2:142–153
Etefa G, Frankl A, Lanckriet S, Biadgilgn D, Gebreyohannes Z, Amanuel Z, Nyssen J (2018) Changes in land use/cover mapped over 80 years in the highlands of northern Ethiopia. J Geogr Sci 28(10):1538–1563. https://doi.org/10.1007/s11442-018-1560-3
Fan F, Weng Q, Wang Y (2007) Land use land cover change in Guangzhou, China, from 1998 to 2003, based on Landsat TM/ETM+ imagery. Sensors 7:1323–1342
Federal Democratic Republic of Ethiopia (FDRE) (2005) Rural land administration and land use proclamation, proclamation No. 456/2005, Addis Ababa, Ethiopia
Fichera CR, Modica G, Pollino M (2012) Land cover classification and change detection analysis using multi temporal remote sensed imagery and landscape metrics. Eur Remote Sens 45:1–18
Fisher RP (2011) Tropical forest monitoring, combining satellite and social data, to inform management and livelihood implication: case studies from Indonesian West Timor. Int J Appl Earth Obs Geoinf 16:77–84
Fisseha G, Gebrekidan H, Kibret K, Yitaferu B, Bedadi B (2011) Analysis of land use/cover changes in the Debre-Mewi watershed at the upper catchment of the Blue Nile Basin, North West Ethiopia. J Biodivers Environ Sci 1:184–196
Foley JA, Costa MH, Delire C, Ramankutty N, Snyder P (2003) Green surprise? How terrestrial ecosystems could affect earth’s climate. Front Ecol Environ 1(1):38–44
Foody G (2002) Status of land-cover classification accuracy assessment. Remote Sens Environ 80:185–201
Garedew E, Sandewall M, Söderberg U, Campbell BM (2009) Land-use and land-cover dynamics in the central rift valley of Ethiopia. Environ Manag 44:683–694. https://doi.org/10.1007/s00267-011-9783-4
Gashaw T, Tulu T, Argaw M, Worqlul AW (2017) Evaluation and prediction of land use/cover changes in the Andassa watershed, Blue Nile Basin, Ethiopia. Environ Syst Res 6:17
Gebremedhin T, Abera A, Desale K (2017) Runoff, sediment load and land use/cover change relationship: the case of Maybar sub-watershed, South Wollo, Ethiopia. Int J River Basin Manag 15(1):89–101. https://doi.org/10.1080/15715124.2016.1239625
Gebresamuel G, Singh BR, Dick O (2010) Land-use changes and their impacts on soil degradation and surface runoff of two catchments of Northern Ethiopia. Acta Agric Scand B Plant Soil Sci 60:211–226
Gessesse B, Bewket W, Bräuning A (2015) Model-based characterization and monitoring of runoff and soil erosion in response to land use/cover changes in the Modjo watershed, Ethiopia. Land Degrad Dev 26:711–724
Getachew HE, Melesse AM (2013) The impact of land use change on the hydrology of the Angereb watershed, Ethiopia. Int J Water Sci. https://doi.org/10.5772/56266
Hurni H, Berhe WA, Chadhokar P, Daniel D, Gete Z, Grunder M, Kassaye G (2016) Soil and water conservation in Ethiopia: guidelines for development agents, 2nd edn. Centre for Development and Environment (CDE), University of Bern, with Bern Open Publishing (BOP), Bern, p 134
IPCC (2007) Climate change: synthesis report. IPCC fourth assessment report, Geneva, Switzerland
IPCC (2013) Observations: atmosphere and surface, climate change 2013: the physical science basis. Working group I contribution to the fifth assessment report of the intergovernamental panel of climate change. Cambridge University Press, New York, p 1535
Jensen JR (2005) Introductory digital image processing: a remote sensing perspective, 3rd edn. Prentice Hall, Upper Saddle River, pp 505–512
Jensen JR, Lulla K (1987) Introductory digital image processing: a remote sensing perspective. Geocarto Int 2(1):65. https://doi.org/10.1080/10106048709354084
Jewitt D, Goodman PS, Erasmus BFN, O’Connor TG, Witkowski ETF (2015) Systematic land-cover change in KwaZulu-Natal, South Africa: implications for biodiversity. S Afr J Sci 111(9/10):1–9. https://doi.org/10.17159/sajs.2015/20150019
Johnson B (2015) Remote sensing image fusion at the segment level using a spatially-weighted approach: applications for land cover spectral analysis and mapping. ISPRS Int J GeoInf 4(1):172–184
Jones C, Lowe J, Liddicoat S, Betts R (2009) Committed terrestrial ecosystem changes due to climate change. Nat Geosci 2:484–487
Kantakumar LN, Neelamsetti P (2015) Multi-temporal land use classification using hybrid approach. Egypt J Remote Sens Space Sci 18(2):289–295. https://doi.org/10.1016/j.ejrs.2015.09.003
Kassie BT, Rötter RP, Hengsdijk H, Asseng S, Van Ittersum MK, Kahiluto H, Van Keulen H (2013) Climate variability and change in the Central Rift Valley of Ethiopia: challenges for rainfed crop production. J Agric Sci 52:58–74
Kidane D, Alemu B (2015) The effect of upstream land use practices on soil erosion and sedimentation in the Upper Blue Nile Basin, Ethiopia. Res J Agric Environ Manag 4(2):55–068
Kindu M, Schneider T, Teketay D, Knoke T (2013) Land use/cover change analysis using object-based classification approach in Munessa-Shashemene landscape of the Ethiopian highlands. Remote Sens 5:2411–2435
Klenner W, Arsenault A, Brockerhoff EG, Vyse A (2009) Biodiversity in forest ecosystems and landscapes: a conference to discuss future directions in biodiversity management for sustainable forestry. For Ecol Manag 258:S1–S4
Lambin EF, Geist H (eds) (2007) Land-use and land-cover change. Global change—The IGBP series. https://doi.org/10.1007/3-540-32202-7
Lambin EF, Meyfroidt P (2011) Global land use change, economic globalization, and the looming land scarcity. Proc Natl Acad Sci 108:3465–3472. https://doi.org/10.1073/pnas.1100480108
Lambin E, Geist H, Lepers E (2003) Dynamics of land-use and land-cover change in tropical regions. Annu Rev Environ Resour 28:205–241
Lea C, Curtis A (2010) Thematic accuracy assessment procedures: National Park Service Vegetation Inventory, version 2.0. Natural resource report NPS/2010/NRR—2010/204. National Park Service, Fort Collins, Colorado
Ligdi E, Kahloun ME, Meire P (2010) Ecohydrological status of Lake Tana: a shallow highland lake in the Blue Nile (Abbay) basin in Ethiopia. Rev Ecohydrol Hydrobiol 10:109–122
Ma X, Xu JC, Luo Y, Prasad Aggarwal S, Jiatong L (2009) Response of hydrological processes to land-cover and climate changes in Kejie watershed, Southwest China. Hydrol Process 23:1179–1191. https://doi.org/10.1002/hyp.7233
Mahmood R (2010) Impacts of land use/cover change on climate and future research priorities. Bull Am Meteorol Soc 91(1):37–46
Mengistu KT (2009) Watershed hydrological responses to changes in land use and land cover, and management practices at Hare Watershed, Ethiopia. Dissertation, Universität Siegen Fakultät Bauingenieurwesen, Research Institute for water and Environment, Germany
Meshesha DT, Tsunekawa A, Tsubo M, Ali SA, Haregeweyn N (2014) Land-use change and its socio-environmental impact in eastern Ethiopia’s highland. Reg Environ Change 14:757–768
Millennium Ecosystem Assessment (2005) Ecosystems and human well-being: biodiversity synthesis. World Resources Institute, Washington, DC
Ministry of Agriculture (MOA) (1998) Agroecological zones of Ethiopia. MOA, Addis Ababa
Misana SB, Sokoni C, Milline JM (2012) Land-use/cover changes and their drivers on the slopes of Mount Kilimanjaro, Tanzania. J Geogr Reg Plan 5(6):151–164
Moges A, Holden NM (2006) Land cover change and gully development in the Umbulo watershed, southern Ethiopia. Biosyst Eng Res Rev 11:44–47
Mueller EN (2009) Modelling the effects of land-use change and climate change on runoff and sediment yield for the Ribera Salada in the southern Pyrenees. Catena 79(3):288–296
Mwehia MD (2015) Effects of land-use and land-cover change on land degradation in Kijabe-Longonot catchment, Kenya. Int J Sci Res Innov Technol 2(10):2313–3759
Nunes C, Auge JI (1999) Land-use and land-cover implementation strategy (Stockholm: IGBP). Climate-change policy beyond the radiative effect of greenhouse gases. The Royal Society, p 10
Nyssen J, Poesen J, Moeyersons J, Deckers J, Haile M, Lang A (2004) Human impact on the environment on the Ethiopian and Eritrean highlands—a state of the art. Earth-Sci Rev 64:273–320
Otukei JR, Blaschke T (2010) Land cover change assessment using decision trees, support vector machines and maximum likelihood classification algorithms. Int J Appl Earth Obs Geoinf 12:27–31
Ouedraogo I, Tigabu M, Savadogo P, Compaoré H, Odén PC, Ouadba JM (2010) Land cover change and its relation with population dynamics in Burkina Faso, West Africa. Land Degrad Dev. https://doi.org/10.1002/ldr.981
Petit CC, Lambin EF (2002) Long-term land-cover changes in the Belgian Ardennes (1775–1929): model-based reconstruction versus historical maps. Glob Change Biol 8:416–630
Pontius R, Shusas E, McEachern M (2004) Detecting important land changes while accounting for persistence. Agric Ecosyst Environ 101:251–268
Rahmato D (2001) Environmental change and state policy in Ethiopia: lessons from past experiences. FSS monograph series 2. Addis Ababa, Forum for Social Studies, p 121
Rands MRW, Adams WM, Bennun L, Butchart SHM, Clements A, Coomes D, Entwistle A, Hodge I, Kapos V, Scharlemann JPW (2010) Biodiversity conservation: challenges beyond 2010. Science 329:1298–1303
Richter D, Houghton RA (2011) Gross CO2 fluxes from land-use change: implications for reducing global emissions and increasing sinks. Carbon Manag 2:41–47. https://doi.org/10.4155/cmt.10.43
Sabr A, Moeinaddini M, Azarnivand H, Guinot B (2016) Assessment of land use and land cover change using spatiotemporal analysis of landscape: case study in south of Tehran. Environ Monit Assess 188:691. https://doi.org/10.1007/s10661-016-5701-9
Schutt B, Thiemann S (2006) Kulfo River, South Ethiopia as a regulator of lake level changes in the Lake Abaya-Lake Chamo system. Zbl Geol Paläont 1:129–143
Schutt B, Wenclawiak B (2010) Off-site effects of soil erosion in the environment of Lake Abaya, South Ethiopia. Erde 141:217–233
Sewnet A (2015) Land use/cover change at Infraz watershed, Nortwestern Ethiopia. J Landsc Ecol 8:69–83
Simane B, Zaitchik BF, Ozdogan M (2013) Agroecosystem analysis of the Choke Mountain watersheds, Ethiopia. Sustainability 5:592–616
Singh A (1989) Digital change detection techniques using remotely sensed data. Int J Remote Sens 10(6):989–1003
Sohl T, Sleeter B (2012) Role of remote sensing for land-use and land-cover change modeling. In: Giri CP (ed) Remote sensing of land use and land cover principles and applications. CRC Press, Boca Raton, pp 225–239
Taylor C, Lambin E, Stephenne N, Harding R, Essery R (2002) The influence of land use change on climate in the Sahel. J Clim 15(24):3615–3629
Tefera B, Sterk G (2010) Land management, erosion problems and soil and water conservation in Fincha watershed, western Ethiopia. Land Use Policy 27(4):1027–1037
Teferi E, Uhlenbrook S, Bewket W, Wenninger J, Simane B (2010) The use of remote sensing to quantify wetland loss in the Choke Mountain range, Upper Blue Nile Basin, Ethiopia. Hydrol Earth Syst Sci 14:2415–2428. https://doi.org/10.5194/hess-14-2415-2010
Teferi E, Bewket W, Uhlenbrook S, Wenninger J (2013) Understanding recent land use and land cover dynamics in the source region of the Upper Blue Nile, Ethiopia: spatially explicit statistical modeling of systematic transitions. Agric Ecosyst Environ 165:98–117
Tegene B (2002) Land-cover/land-use changes in the Derekolli catchment of South Wello Zone of Amhara Region, Ethiopia. Eastern Afr Soc Sci Res Rev 18:1–20. https://doi.org/10.1353/eas.2002.0005
Temesgen H, Nyssen J, Zenebe A, Haregeweyn N, Kindu M, Lemenih M, Haile M (2013) Ecological succession and land use changes in a lake retreat area (Main Ethiopian Rift Valley). J Arid Environ 91:53–60
Thomlinson JR, Bolstad PV, Cohen WB (1999) Coordinating methodologies for scaling land cover classifications from site-specific to global: steps toward validating i maging. LLC, Norcross
Tsegaye D, Moe SR, Vedeld P, Aynekulu E (2010) Land-use/cover dynamics in Northern Afar rangelands, Ethiopia. Agric Ecosyst Environ 139:174–180. https://doi.org/10.1016/j.agee.2010.07.017
Turner B, Meyer W, Skole D (1995) Global land-use/land cover change: towards an integrated study. Ambio 23(1):91–95
Turner BL, Lambin EF, Reenberg A (2007) The emergence of land change science for global environmental change and sustainability. Proc Natl Acad Sci 104:20666–20671. https://doi.org/10.1073/pnas.0704119104
TWARDO (2016) Tenta Wereda agriculture and rural development office, Adjibar-Tenta
Uriarte M, Yackulic CB, Lim Y, Arce-Nazario JA (2011) Influence of land use on water quality in a tropical landscape: a multi-scale analysis. Landsc Ecol 26:1151–1164
Verburg R, Stehfest E, Woltjer G, Eickhout B (2009) The effects of agricultural trade liberalization on land use released greenhouse gas emissions. Glob Environ Change 19(4):434–446
Verburg PH, Neumann K, Nol L (2011) Challenges in using land use and land cover data for global change studies. Glob Change Biol 17:974–989. https://doi.org/10.1111/j.1365-2486.2010.02307.x
Wagesho N (2014) Catchment dynamics and its impact on runoff generation: coupling watershed modelling and statistical analysis to detect catchment responses. Int J Water Resour Environ Eng 6:73–87
Wischmeier W, Smith D (1978) Predicting rainfall erosion losses: a guide to conservation planning. Agricultural Handbook No. 537. U.S. Department of Agriculture, Washington DC, USA
WoldeYohannes A, Cotter M, KelboroG Dessalegn W (2018) Land use and land cover changes and their effects on the landscape of Abaya-Chamo Basin, southern Ethiopia. Land. https://doi.org/10.3390/land7010002
World Bank (2008) Sustainable land management sourcebook. World Bank, Washington, DC
Yesuf HM, Assen M, Melesse AM, Alamirew T (2015) Detecting Land use/cover changes in the Lake Hayq (Ethiopia) drainage basin, 1957–2007. Lake Reserv Res Manag 20:1–18
Yuan F, Sawaya KE, Loeffelholz BC, Bauer ME (2005) Land cover classification and change analysis of the Twin Cities (Minnesota) metropolitan areas by multitemporal landsat remote sensing. Remote Sens Environ 98:317–328
Zeleke G, Hurni H (2001) Implications of land use and land cover dynamics for mountain resource degradation in the northwestern Ethiopian highlands. Mt Res Dev 21:184–191
Zewdie W, Csaplovics E (2015) Remote sensing based multi-temporal land cover classification and change detection in northwestern Ethiopia. Eur J Remote Sens. https://doi.org/10.5721/eujrs20154808
Acknowledgements
The authors would like to acknowledge Dilla University and University of South Africa for their support in this research project. Our heartfelt appreciation and thanks are extended to the people of the watershed for their kindness and cooperation in sharing their experiences. Finally, we would like to extend our sincere thank to Tenta district Agriculture and Administrative office members for providing valuable information and logistic arrangements during the field work.
Funding
No funding was received.
Author information
Authors and Affiliations
Contributions
AYY has lead the overall activities of the research process such as the design, data collection, entry, analysis, and interpretation of results as well as writing up of the draft manuscript. ABD has involved in improving the manuscript by providing constructive guidance, critical comments and suggestions pertaining to methodological design, data analysis, interpretation and structuring of the manuscript. Both authors read and approved the final manuscript.
Corresponding author
Ethics declarations
Ethics approval and consent to participate
An attempt was made to conduct the research in an ethical manner. Prior to commencing research activities, a research site permission letter was obtained from district level concerned institutions. Since most farmers were not read written consent forms, oral consent was obtained from all participants prior to commencing the interview and discussion. Hence, as the researcher, the Authors take full responsibility for all the contents and any mistakes here in the document.
Consent for publication
We have agreed to submit for ESR and approved the manuscript for submission.
Competing interests
The authors declare that they have no competing interests.
Additional information
Publisher's Note
Springer Nature remains neutral with regard to jurisdictional claims in published maps and institutional affiliations.
Additional file
Additional file 1: Plate S1.
Partial view of the study watershed. Plate S2. Pill of Eucalyptus woodlots highlighting rate of deforestation (photo author, 2017). Plate S3. Upslope expansion of farmlands/settlements, June, 2017.
Rights and permissions
Open Access This article is distributed under the terms of the Creative Commons Attribution 4.0 International License (http://creativecommons.org/licenses/by/4.0/), which permits unrestricted use, distribution, and reproduction in any medium, provided you give appropriate credit to the original author(s) and the source, provide a link to the Creative Commons license, and indicate if changes were made.
About this article

Cite this article
Yesuph, A.Y., Dagnew, A.B. Land use/cover spatiotemporal dynamics, driving forces and implications at the Beshillo catchment of the Blue Nile Basin, North Eastern Highlands of Ethiopia. Environ Syst Res 8, 21 (2019). https://doi.org/10.1186/s40068-019-0148-y
Received:
Accepted:
Published:
DOI: https://doi.org/10.1186/s40068-019-0148-y