Studies on Simulation of Spectra of Some Organic Compounds
Pradeep Kumar Gupta and Kishor Arora
Department of Chemistry, Govt. Postgraduate College (Auto.) Datia (Madhya Pradesh) 475 661, India.
Corresponding Author Email: kishoraroda@gmail.com
DOI : http://dx.doi.org/10.13005/ojc/350606
Article Received on : 06-11-19
Article Accepted on : 01-12-2019
Article Published : 27 Dec 2019
Quantum chemical viz. ab initio or semi-empirical based simulation studies are now prevailing among workers / scientists pursuing their studies in theoretical chemistry. These studies provide better insight for the compounds so far as the studies of their structural orother parameters are concern. Studies involving the packages developed on the basis of ab-initio or semi-empirical methods are proven to be more effective and as a better tool because of number of their advantages. The present communication includes the studies on synthesis or procurement along with the simulation of spectra viz. I.R. of some heterocyclic organic compounds.
KEYWORDS:Semi-Empirical Calculations; Simulation Of Spectra; Heterocyclic Compounds
Download this article as:| Copy the following to cite this article: Gupta P. K, Arora K. Studies on Simulation of Spectra of Some Organic Compounds. Orient J Chem 2019; 35(6). |
| Copy the following to cite this URL: Gupta P. K, Arora K. Studies on Simulation of Spectra of Some Organic Compounds. Orient J Chem 2019; 35(6). Available from: https://bit.ly/2PYZymK |
Introduction
One of the key objectives of organic, medicinal or pharmaceutical chemistry is to develop, design and synthesize new compounds that possess properties which have potent therapeutic values. There is a vital need for the development of new compounds which have antimicrobial and other medicinal values with potent activity against resistant microorganism[1-15].
Infrared spectroscopy has been among important tools for the spectral analysis of the compounds thereby it is a helpful technique in structural elucidation of compounds. As every different sample is a unique combination of different atoms. Therefore, no two compounds have the exactly same infrared spectrum. As a result of which, infrared spectroscopy gives the result in a positive identification of every different material and prove to be a better tool for qualitative estimation of different compounds. In addition to it, the size of the peaks in the spectrum provides us a directive indication of the amount of material present which leads to quantitative analysis of the material. Now-a-days such analyses are being performed with the help of modern software algorithms which make the IR spectroscopy an excellent tool for the purpose of quantitative analysis.
Simulation or precisely computer simulation is a term which is in wide use now-a –days and this may alternatively be defined as modeling. Simulation of spectra whether IR or NMR spectra and related studies have emerged as a new field of study and are the matter of interest for various workers at present. These studies involve designing or modeling of spectra on the computer with the help of different softwares developed on the basis of quantum mechanical studies. These simulated spectra may have compatibility with those experimentally observed with some or little error. The softwares which are in common use for this purpose use library data files for previously existing compounds or functional groups to generate or simulate or design a new spectra. The softwares used for the purpose may be understood according to their classification shown in the figure 1 below.
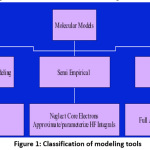 |
Figure 1: Classification of modeling tools Click here to View Figure |
Simulation or modeling may be done using softwares which include the methods of solution of basic Schrodinger equation as set-up for the molecular system within most common quantum chemical approximations viz. Born-Openhiemer approximation, Hartree –Fock Approximation and LCAO approximation using appropriate basis sets to get near exact values for practical molecular orbitals which in turn are then used to have different properties for the molecules such as Heat of formation, total energy, zero point energy, dipole moment, Eigen values along with the computed vibrational frequencies with corresponding intensities for the peaks. Some of the most commonly used softwares are MOPAC, HYPERCHEM, GAMESS and Gaussian.
Keeping above discussion in mind it prompt the authors to study the simulation of spectra of some selective heterocyclic compounds .The compounds included for studies in the present communication are Schiff bases of 2-Amino Pyrimidine along with the base compound. These are viz.
C-1 2-Amino Pyrimidine
C-2 2-N-(Furfuralidene) Amino pyrimydine
C-3 2-N-[2-Nitro(benzaledene)] Amino pyrimydine
C-4 2-N-[Benzaledene] Amino pyrimydine
C-5 2-N-[2-Hydroxy(Benzaledene)] Amino pyrimydine
Experimental
Materials Used
All the chemicals viz. 2-Amino Pyrimidine, Furfural, 2-Nitro Benzaldehyde, Benzaldehyde and 2-Hydroxy benzaldehyde were used as such as these are obtained by the standard sources as B.D.H. or C.D.H. All the solvents employed for this study were from standard sources such as BDH and E-Merck.
Preparation of heterocyclic compounds viz. Schiff bases of 2-Aminopyrimidine
A mixture of 2-Amino pyrimidine (1M) in absolute ethyl alcohol (30ml) was added in a slow manner to a solution of respective different aldehyde viz. Furfural, 2-Nitro Benzaldehyde, Benzaldehyde and 2-Hydroxy benzaldehyde . The stirred reaction mixture was then refluxed for a period of 12-14 hours. On cooling of which a precipitate was formed which was fitered and collected and than washed with cold ethanol and its re-crytallization was done from the same solvent[16-18]. Synthetic route for the synthesis of compounds is shown below in figure 2
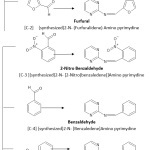 |
Figure 2: Synthetic route of the compounds under study Click here to View Figure |
Techniques used for studies
All the Heterocyclic Organic compound taken for studies in the present paper were subjected to following techniques through instrumental analysis in order to elucidate their respective structures.
Melting Point determination
Melting Point of each and every compound was obtained using metler’s melting point determination apparatus in chemistry Research laboratory of our own centre.
Detection of Elemental Analysis of the Compound
Elemental analysis of viz. CHN or carbon, hydrogen and nitrogen analyses of the compounds which are under studies in the present work were carried out on EUROVECTOR EA 3000 Elemental Analyser at SAIF-MICROANALYSIS LAB at CSIR-CENTRAL DRUG RESEARCH INSTITUTE, LUCKNOW (U.P.) with due acknowledgement.
Infra-red (IR) Spectra
The FTIR spectra of the synthesized as well as procured compounds were recorded on a Perkin Elmer Model Spectrum -2 Infrared Spectrophotometer in the range of 4000 to 400 cm-1 at SAIF Jiwaji University, Gwalior.
Mass Spectra
The Mass Spectra of some of the compounds were recorded on a liquid Chromatogram Mass Spectroscopy at SAIF Jiwaji University, Gwalior (M.P.)
Computational Details
The computational studies were carried out on Intel based Pentium core-2 Duo machine with configuration Intel (R) core TM 2 Duo CPU, T5450@1.66 GHZ, 2 GB RAM, 250 GB HDD and all the computations were carried out on it.
Semi-empirical methods viz. AM1, PM3, MNDO and ZINDO1 were employed for various quantum chemical calculations that were carried out by the computer software HYPERCHEM 8.0 professional version. The calculated parameters such as normal modes or vibration frequencies were also computed on the same plateform. These methods viz. AM1, PM3,MNDO and ZINDO1 have their usual meanings and may be considered as hamiltonia or key words for the methods under studies. The correlation diagrams, modeling equations and all other statistical calculations were carried out on MS-Excel.
Results and Discussion
Analytical data viz. m.pts. , colour, and carbon, hydrogen and nitrogen analyses for these compounds are presented in the table 1
Table 1: Analytical data for the compounds under study
|
Code |
Melting Point (0C) | Molecular Wieghts | Colour | Elemental Analysis | ||
|
C (in %) |
H (in %) |
N (in %) |
||||
| C-1 | 120-125 | 95 | Pale Yellow | 45.792 | 5.412 |
36.458 |
|
C-2 |
190-195 | 173 | Yellowish brown | 55.519 | 5.684 | 16.404 |
| C-3 | 205-210 | 228 | Yellow | 53.183 | 5.262 |
15.990 |
|
C-4 |
160-165 | 183 | Yellow | 60.632 | 6.359 | 14.930 |
| C-5 | 140-145 | 199 | Pale Yellow | 53.418 | 5.409 |
26.062 |
Mass spectral studies of any compound are also helpful in its structural establishment. This study is also helpful in the establishment of molecular weight of the compound.
Mass spectral studies of one of the compound C-3 selected for study reveal that the parent ion peak in the spectra of this compound appear at the m/e values where these are expected i.e. this parent ion peak for the compound C-3 appear at m/e 212, which confirms its molecular weight. The table-2 shows the mass spectral data of this compound with mass spectra in the figure -3.
Table 2: Mass spectral data for 2-N-[2-Nitro(Benzaledene)] Amino pyrimidine [C-3]
|
m/e |
% Relative Abundance |
| 321 |
11 |
|
293 |
72 |
| 278 |
10 |
|
269 |
22 |
| 253 |
12 |
|
239 |
15 |
| 229 |
55 |
|
223 |
17 |
| 205 |
19 |
|
196 |
11 |
| 183 |
6 |
|
163 |
61 |
| 157 |
12 |
|
137 |
15 |
| 130 |
15 |
|
111 |
17 |
| 91 |
100 (Base Peak) |
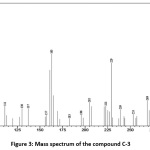 |
Figure 3: Mass spectrum of the compound C-3 Click here to View Figure |
Computational studies of the compounds:
All computed parameters viz. Zero Point Energy (ZPE), Dipole Moment (DM), Heat of Formation (HF), Highest Occupied Molecular Orbital (HOMO), Lowest Unoccupied Molecular Orbital (LUMO), Total Energy (TE), Binding Energy (BE) were reported for some Heterocyclic Organic Compounds and discussed in Table 3-7.
Table 3: Computed parameters for 2-Amino pyrimidine C-1]
| AM1 | PM3 | MNDO | ZINDO1 | |
| TE(K.cal./Mol) | -27697.66 | -23921.25 | -27753.95 |
-38492.73 |
|
BE(K.cal./Mol) |
-1235.90 | -1249.36 | -1251.51 | -3614.06 |
| DM(Debye) | 0.10 | 0.36 | 0.05 |
0.60 |
|
ZPE(K.cal./Mol) |
58.95 | 55.69 | 60.17 | 79.86 |
| HOMO(eV) | -9.03 | -0.02 | -9.13 |
-7.55 |
|
LUMO(eV) |
0.24 | 1.47 | 0.13 | 7.20 |
| HF(K.cal./Mol) | 47.16 | 33.70 | 31.55 |
-2330.99 |
Table 4: Computed parameters for 2-N-(Furfuralidene) Amino pyrimidine [C-2]
| AM1 | PM3 | MNDO | ZINDO1 | |
| TE(K.cal./Mol) | -50417.84 | -45011.87 | -50523.75 |
-70271.02 |
|
BE(K.cal./Mol) |
-2210.21 | -2239.13 | -2247.44 | -6654.61 |
| DM(Debye) | 2.84 | 2.74 | 3.04 |
4.07 |
|
ZPE(K.cal./Mol) |
96.08 | 91.85 | 98.91 | 130.36 |
| HOMO(eV) | -0.96 | -0.28 | -0.91 |
-5.21 |
|
LUMO(eV) |
0.13 | 1.13 | 0.04 | 5.14 |
| HF(K.cal./Mol) | 91.07 | 62.14 | 53.84 |
-4353.32 |
Table 5: Computed parameters for 2-N-[2-Nitro(Benzaledene)] Amino pyrimidine [C-3]
| AM1 | PM3 | MNDO | ZINDO1 | |
| TE(K.cal./Mol) | -68745.69 | -68745.69 | -68856.16 |
-96270.97 |
|
BE(K.cal./Mol) |
-2745.66 | -2745.66 | -2745.79 | -8403.60 |
| DM(Debye) | 7.53 | 7.53 | 7.65 |
8.63 |
|
ZPE(K.cal./Mol) |
117.69 | 117.69 | 119.47 | 158.63 |
| HOMO(eV) | -0.23 | -0.23 | -0.26 |
-7.26 |
|
LUMO(eV) |
0.36 | 0.36 | 0.17 | 3.90 |
| HF(K.cal./Mol) | 122.05 | 122.05 | 121.93 |
-5535.87 |
Table 6: Computed parameters for 2-N-[Benzaledene] Amino pyrimidine [C-4]
| AM1 | PM3 | MNDO | ZINDO1 | |
| TE(K.cal./Mol) | -49593.14 | -44432.80 | -49649.86 |
-68608.52 |
|
BE(K.cal./Mol) |
-2577.20 | -2599.47 | -2597.05 | -7793.82 |
| DM(Debye) | 2.76 | 2.69 | 2.83 |
3.31 |
|
ZPE(K.cal./Mol) |
114.98 | 110.62 | 117.71 | 156.13 |
| HOMO(eV) | -9.38 | -0.45 | -0.01 |
-6.86 |
|
LUMO(eV) |
0.03 | 0.07 | 0.03 | 6.90 |
| HF(K.cal./Mol) | 110.50 | 88.22 | 90.65 |
-5106.11 |
Table 7: Computed parameters for 2-N-[2-Hydroxy (Benzaledene)] Amino pyrimidine [C-5]
| AM1 | PM3 | MNDO | ZINDO1 | |
| TE(K.cal./Mol) | -56986.17 | -51208.15 | -57084.91 |
-79279.33 |
|
BE(K.cal./Mol) |
-2680.66 | -2702.31 | -2701.73 | -7994.47 |
| DM(Debye) | 3.59 | 3.14 | 3.60 |
4.79 |
|
ZPE(K.cal./Mol) |
117.86 | 113.95 | 120.96 | 159.60 |
| HOMO(eV) | -0.87 | -0.38 | -0.87 |
-6.76 |
|
LUMO(eV) |
0.10 | 0.31 | 0.03 | 5.24 |
| HF(K.cal./Mol) | 66.60 | 44.94 | 45.53 |
-5247.21 |
IR Spectral along with their simulation studies of the compounds
The selected computed normal modes frequency of vibration for the Heterocyclic Organic Compounds along with their experimentally observed vibration peaks are discussed as below-
Computed Results for Heterocyclic Organic Compound 2-Amino pyrimidine [C-1]
The AM1, PM3, MNDO, ZINDO1 Computed results for Heterocyclic Organic Compound 2-Amino pyrimidine (APm)[C-1] are presented in Table- 7 on the basis of which some important band in the spectra of compound are discussed as below-
AM1 Computed Results
The band observed at 3237.54 cm-1 may be due to N-H asymmetric stretching vibration and band at 1661.99 cm-1 has been assigned C=O stretching. The band observed at 1593.26 cm-1 may be due to NH2 scissoring mode and C=C stretching mode of vibration is assigned at 1432.33 cm-1. All other important bands are included in the table 8.
PM3 Computed Results
The band observed at 3488.16 cm-1 is because of N-H and is asymmetric stretching vibration while the band at 1634.06 cm-1 has been assigned C=O stretching vibration and C=C stretching mode of vibration is assigned at 1523.81 cm-1. The peak at 1348.88 cm-1 has been assigned C–C stretching vibration. All other are included in the table 8 given below.
MNDO Computed Results
The peak in the spectra observed at 3388.01 cm-1 is due to N-H asymmetric stretching vibration. The band at 1690.88 cm-1 is due to C=O stretching vibration and NH2 scissoring mode is at 1577.41 cm-1and C=C stretching mode of vibration is assigned at 1458.45 cm-1.
The band at 1324.95 cm-1 has been assigned as C–C stretching vibration and all other important bands are also included in the table 8.
ZINDO1 Computed Results
The band observed at 2611.26 cm-1 is because of N-H asymmetric stretching vibration and band at 1662.48 cm-1 has been assigned as C=O stretching vibration. The band observed at 1534.18cm-1 due to NH2 scissoring mode and C=C stretching mode of vibration is at 1474.58 cm-1. The band at 1328.31 cm-1 has been assigned C–C stretching vibration by this method. All other important peaks are listed and included in the table 8.
The correlation curves between experimental and AM1, PM3, MNDO, ZINDO1 computed normal modes or frequency of vibrations for C-1 are shown in fig. 3-7 along with the simulated spectra on the basis of computed normal modes from these methods with real experimental spectra of the compound C1 in figure 8.
Table 8: Comparative study of real Experimental and AM1, PM3, MNDO, ZINDO1 Computed Group frequencies (cm-1) for 2-Amino pyrimidine [C-1]
|
S.No. |
Experimental Group Frequency (cm-1) | AM1Computed Group Frequency (cm-1) | PM3 Compound Group Frequency (cm-1) | MNDO Computed Group Frequency (cm-1) | ZINDO1 Computed Group Frequency (cm-1) | Assignment |
| 1 | 3370.25 | 3237.54 | 3488.16 | 3388.01 | 2611.26 |
uas(N-H) in NH2 Group |
|
2 |
1641.83 | 1661.99 | 1634.06 | 1690.88 | 1662.48 | u(C=O) |
| 3 | 1574.99 | 1593.26 | – | 1577.41 | 1534.18 |
u (NH2) Sci |
|
4 |
1477.88 | 1432.33 | 1523.81 | 1458.45 | 1474.58 | u(C=C) |
| 5 | 1359.58 | 1305.93 | 1348.88 | 1324.95 | 1328.31 |
u(C – C) |
|
6 |
1093.05 | 1094.08 | 1106.63 | 1135.70 | 1043.91 | d(C – H) |
| 7 | 802.08 | 798.23 | 788.01 | 761.78 | 912.57 |
(CCC)rb |
|
8 |
566.08 | 507.41 | 651.75 | 657.24 | 567.72 | d(CCC) |
|
9 |
470.07 | 440.64 | 470.69 | 486.55 | 485.05 |
d(CCC) |
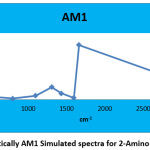 |
Figure 3: Theoretically AM1 Simulated spectra for 2-Amino pyrimidine [C-1] Click here to View Figure |
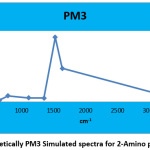 |
Figure 4: Theoretically PM3 Simulated spectra for 2-Amino pyrimidine [C-1] Click here to View Figure |
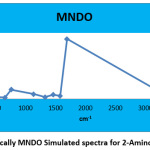 |
Figure 5: Theoretically MNDO Simulated spectra for 2-Amino pyrimidine [C-1] Click here to View Figure |
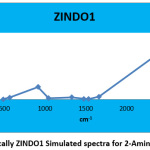 |
Figure 6: Theoretically ZINDO1 Simulated spectra for 2-Amino pyrimidine [C-1] Click here to View Figure |
The correlation diagrams for the compound C1with various methods viz. AM1, PM3, MNDO and ZINDO1are given in the figure-7
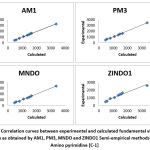 |
Figure 7: Correlation curves between experimental and calculated fundamental vibration modes as obtained by AM1, PM3, MNDO and ZINDO1 Semi-empirical methods for 2-Amino pyrimidine [C-1] Click here to View Figure |
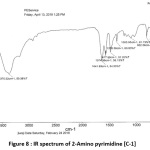 |
Figure 8: IR spectrum of 2-Amino pyrimidine [C-1] Click here to View Figure |
Computed Results for Heterocyclic Organic Compound 2-N-(Furfuralidene) Amino pyrimidine [C-2]
The AM1, PM3, MNDO, ZINDO1 Computed results for Heterocyclic Organic Compound 2-N-(Furfuralidene) Amino pyrimidine [C-2] are presented in Table-9 and some important bands are discussed as below-
AM1 Computed Results
1693.30 cm-1 is C=O stretching vibration. NH2 scissoring mode appears at 1629.84 cm-1 and 1582.14 cm-1. The band at 1546.49 cm-1 is assigned for NO2. The band observed at 1429.81 cm-1 is due to asymmetric mode of vibration of C-CH3. The band at 1335.26 cm-1 is C–C stretching vibration. All other important bands are listed in the table 9.
PM3 Computed Results
The band observed at 1719.14 cm-1 may be due to C=O stretching vibration and C=C stretching mode of vibration is at 1628.80 cm-1 and 1503.01 cm-1. The band at 1528.40 cm-1 is assigned for NO2. The band observed at 1401.40 cm-1 is N–H asymmetric stretching vibration. The band at 1315.37 cm-1 is because of C–C stretching vibration. All other important bands are given in table 9.
MNDO Computed Results
The substituted benzene give rise to C=O stretching vibration at 1613.73 cm-1 and C=C stretching mode of vibration is at 1610.19 cm-1 and 1459.09 cm-1. The band at 1537.81 cm-1 is for NO2. The band observed at 1404.13 cm-1 is due to N–H asymmetric stretching vibration. The band at 1316.10 cm-1 is C–C stretching vibration. Band at 666.37 cm-1 is for N-N stretching vibration. All important bands are listed in the table 9.
ZINDO1 Computed Results
The band observed at 1640.34 cm-1 are because of C=O stretching vibration and C=C stretching mode of vibration appears at 1498.05 cm-1, 1469.02 cm-1. The band observed at 1431.82 cm-1 and 1406.10 cm-1 is assigned to N–H asymmetric stretching vibration. The band at 1326.20 cm-1 is due to C–C stretching vibration. The important bands are listed in table 9. Band at 659.63 cm-1 is for N-N stretching vibration.
The correlation between experimental and AM1, PM3, MNDO, ZINDO1 computed normal modes of vibration for C-2 are shown in Figure 9-13 with simulated spectra on the basis of these normal modes. The real experimental spectrum of the compound is in figure 14
Table 9: Comparative study of Experimental and Computed (AM1, PM3, MNDO, ZINDO1) Group frequencies (cm-1) for 2-N-(Furfuralidene) Amino pyrimidine [C-2]
|
S.No. |
Experimental Group Frequency (cm-1) | AM1Computed Group Frequency (cm-1) | PM3 Compound Group Frequency (cm-1) | MNDO Computed Group Frequency (cm-1) | ZINDO1 Computed Group Frequency (cm-1) | Assignment |
| 1 | 1646.26 | 1693.30 | 1719.14 | 1613.73 | 1640.34 |
u(C=O) |
|
2 |
1603.80 | – | 1628.28 | 1610.19 | – | u(C=C) |
| 3 | 1593.28 | 1629.84 | – | – | – |
u(NH2)Sci |
|
4 |
1577.00 | 1582.14 | – | 1566.76 | – | u(NH2)Sci |
| 5 | 1546.02 | 1546.49 | 1528.40 | 1537.81 | – |
NO2 |
|
6 |
1489.11 | 1537.71 | 1503.01 | – | 1498.05 | u(C=C) |
| 7 | 1457.69 | 1437.88 | – | 1459.09 | 1469.02 |
u(C=C) |
|
8 |
1426.06 | 1429.81 | – | – | 1431.82 | uas(C – CH3) |
| 9 | 1416.12 | – | 1401.40 | 1404.13 | 1406.10 |
uas(C – CH3) |
|
10 |
1306.37 | 1335.26 | 1315.37 | 1316.10 | 1326.20 | u(C – C) |
| 11 | 1134.05 | 1112.39 | 1136.05 | 1156.11 | 1136.79 |
d(C = O) |
|
12 |
760.70 | 814.50 | 763.43 | 791.69 | 776.34 | d(C – H) |
| 13 | 752.76 | 729.19 | – | – | – |
d(C – H) |
|
14 |
703.44 | 670.58 | 655.73 | 666.37 | 659.63 | u(N – N) |
| 15 | 592.72 | 588.54 | 608.41 | 559.10 | 598.39 |
d(CCC) |
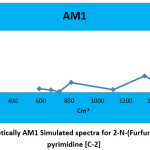 |
Figure 9: Theoretically AM1 Simulated spectra for 2-N-(Furfuralidene) Amino pyrimidine [C-2] Click here to View Figure |
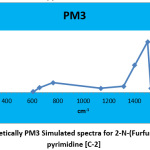 |
Figure 10: Theoretically PM3 Simulated spectra for 2-N-(Furfuralidene) Amino pyrimidine [C-2] Click here to View Figure |
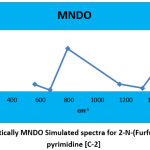 |
Figure 11: Theoretically MNDO Simulated spectra for 2-N-(Furfuralidene) Amino pyrimidine [C-2] Click here to View Figure |
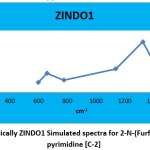 |
Figure 12: Theoretically ZINDO1 Simulated spectra for 2-N-(Furfuralidene) Amino pyrimidine [C-2] Click here to View Figure |
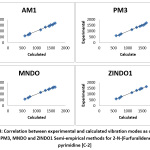 |
Figure 13: Correlation between experimental and calculated vibration modes as obtained by AM1, PM3, MNDO and ZINDO1 Semi-empirical methods for 2-N-(Furfuralidene) Amino pyrimidine [C-2] Click here to View Figure |
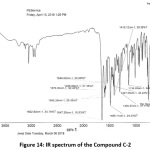 |
Figure 14: IR spectrum of the Compound C-2 Click here to View Figure |
Computed Results for Heterocyclic Organic Compound 2-N-[2-Nitro(Benzaledene)] Amino pyrimidine [C-3]
The AM1, PM3, MNDO, ZINDO1 Computed results for the Heterocyclic Organic Compound 2-N-[2-Nitro(Benzaledene)] Amino pyrimidine [C-3] are presented in Table10 in which some important bands are listed and are discussed as below-
AM1 Computed Results
The band observed at 3225.81 cm-1 is because of N-H asymmetric stretching vibration and band at 3030.59 cm-1 is C-H symmetric mode of vibration and 1626.26 cm-1 has been assigned as C=O stretching vibration. NH2 scissoring modes are assigned at 1581.66 cm-1 and 1558.54 cm-1. The band at 1542.52 cm-1 is for NO2 and C=C stretching mode of vibration is at 1494.70 cm-1. The band at 1429.24 cm-1 and 1397.95 cm-1 are asymmetric modes of vibration due to C–CH3. The bands at 1379.69 cm-1, 1329.49 cm-1 and 1280.93 cm-1 are C–C stretching vibration.
PM3 Computed Results
The band observed at 3225.81 cm-1 is due to N-H asymmetric stretching vibration and band at 3030.59 cm-1 is C-H symmetric mode of vibration and peak at 1626.26 cm-1 has been assigned as C=O stretching vibration. NH2 scissoring modes are at 1581.66 cm-1 and 1558.54 cm-1. The band at 1542.52 cm-1 is for NO2 while C=C stretching mode of vibration is at 1494.70 cm-1. The bands at 1429.24 cm-1 and 1397.95 cm-1 are assigned to asymmetric mode of vibration due to C–CH3. The bands at 1379.69 cm-1, 1329.49 cm-1 and 1280.93 cm-1 are due to C–C stretching vibration.
MNDO Computed Results
The band observed at 3383.18 cm-1 is N-H asymmetric stretching vibration and 1690.73 cm-1 has been assigned to C=O stretching vibration. NH2 scissoring modes are at 1598.64 cm-1 and 1568.30 cm-1. The band at 1527.20 cm-1 is for NO2 while C=C stretching mode of vibration is at 1492.17 cm-1. The band at 1424.44 cm-1 is assigned to asymmetric mode of vibration due to C–CH3. The band at 1378.81 cm-1, 1348.01 cm-1 and 1295.19 cm-1 are computed as C–C stretching vibration..
ZINDO1 Computed Results
The band at 2899.10 cm-1 are assigned to C-H symmetric mode of vibration and 1735.67 cm-1 has been assigned C=O stretching vibration. NH2 scissoring modes are assigned at 1551.46 cm-1. C=C stretching mode of vibration is assigned at 1501.46 cm–1 and 1468.56 cm-1. The band at 1446.33 cm-1 and 1403.09 cm-1 are assigned to asymmetric mode of vibration due to C–CH3. The band at 1378.07 cm-1, 1352.12 cm-1 and 1305.89 cm-1 has been designated as C–C stretching vibration.
The correlation between experimental and AM1, PM3, MNDO, ZINDO1 computed normal mode frequency of vibration for C-3 are shown in Figure 15-19 along with simulated spectra on the basis of computed normal modes and the real experimental spectrum of the compound in figure 20.
Table 10: Comparative table for Experimental and Computed (AM1, PM3, MNDO, ZINDO1) Group frequencies (cm-1) for 2-N-[2-Nitro(Benzaledene)] Amino pyrimidine [C-3]
|
S.No. |
Experimental Group Frequency (cm-1) | AM1Computed Group Frequency (cm-1) | PM3 Compound Group Frequency (cm-1) | MNDO Computed Group Frequency (cm-1) | ZINDO1 Computed Group Frequency (cm-1) | Assignment |
| 1 | 3440.53 | 3225.81 | 3225.81 | 3383.18 | 4330.79 |
uas(N–CH3) |
|
2 |
2923.82 | 3030.59 | 3030.59 | – | 2899.10 | u(C–H) |
| 3 | 1647.62 | 1626.26 | 1626.26 | 1690.73 | 1735.67 |
u(C=O) |
|
4 |
1592.83 | 1581.66 | 1581.66 | 1598.64 | – | NH2(Sci) |
| 5 | 1568.22 | 1558.54 | 1558.54 | 1568.30 | 1551.46 |
NH2(Sci) |
|
6 |
1521.58 | 1542.52 | 1542.52 | 1527.20 | – | NO2 |
| 7 | 1498.07 | 1494.70 | 1494.70 | 1492.17 | 1501.46 |
u(C=C) |
|
8 |
1486.04 | – | – | – | – | u(C=C) |
| 9 | 1454.81 | – | – | – | 1468.56 |
u(C=C) |
|
10 |
1430.04 | 1429.24 | 1429.24 | 1424.44 | 1446.33 | uas(C–CH3) |
| 11 | 1414.55 | 1397.95 | 1397.95 | – | 1403.09 |
uas(C–CH3) |
|
12 |
1385.27 | 1379.69 | 1379.69 | 1378.81 | 1378.07 | u(C–C) |
| 13 | 1356.44 | 1329.49 | 1329.49 | 1348.01 | 1352.12 |
u(C–C) |
|
14 |
1305.55 | 1280.93 | 1280.93 | 1295.19 | 1305.89 | u(C–C) |
| 15 | 770.91 | 758.36 | 758.36 | 747.33 | 758.97 |
d(C – H) |
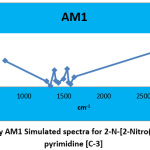 |
Figure 15: Theoretically AM1 Simulated spectra for 2-N-[2-Nitro(Benzaledene)] Amino pyrimidine [C-3] Click here to View Figure |
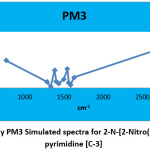 |
Figure 16: Theoretically PM3 Simulated spectra for 2-N-[2-Nitro(Benzaledene)] Amino pyrimidine [C-3] Click here to View Figure |
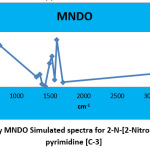 |
Figure 17: Theoretically MNDO Simulated spectra for 2-N-[2-Nitro(Benzaledene)] Amino pyrimidine [C-3] Click here to View Figure |
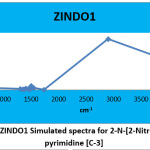 |
Figure 18: Theoretically ZINDO1 Simulated spectra for 2-N-[2-Nitro(Benzaledene)] Amino pyrimidine [C-3] Click here to View Figure |
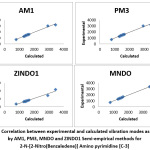 |
Figure 19: Correlation between experimental and calculated vibration modes as obtained by AM1, PM3, MNDO and ZINDO1 Semi-empirical methods for 2-N-[2-Nitro(Benzaledene)] Amino pyrimidine [C-3] Click here to View Figure |
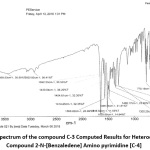 |
Figure 20: IR spectrum of the compound C-3 Computed Results for Heterocyclic Organic Compound 2-N-[Benzaledene] Amino pyrimidine [C-4] Click here to View Figure |
The AM1, PM3, MNDO, ZINDO1 Computed results for Heterocyclic Organic Compound 2-N-[Benzaledene] Amino pyrimidine (BAPm)[C-4] are represented in Table- 11 in which some important bands are given and are discussed as below-
AM1 Computed Results
Asymmetric mode of vibration due to N-CH3 appears at 3237.06 cm-1. The peak at 3004.26 cm-1 is because of C-H asymmetric mode of vibration. 1624.13 cm-1 has been assigned as C=O stretching vibration. The bands at 1545.91 cm-1 and 1447.33 cm-1 are designated as C–C stretching vibration and the bands at 1428.16 cm-1 and 1386.33 cm-1 as asymmetric mode of vibration due to C–CH3. The band at 1314.17 cm-1 has been designated to C–C stretching vibration. The band at 1009.75 cm-1 is twisting mode of vibration for NH2 group. In plane and Out of Plane C-H bending mode of appear at 780.76 cm-1 and 716.19 cm-1.
PM3 Computed Results
The band observed at 3087.83 cm-1 is asymmetric mode of vibration due to N-CH3. The peak at 2903.23 cm-1 is assigned to C-H asymmetric mode of vibration. 1600.28 cm-1 has been assigned as C=O stretching vibration. NH2 Scissoring mode is at 1538.69 cm-1and C=C stretching mode of vibration at 1505.18cm-1. The band at 1370.31 cm-1 is assigned to asymmetric mode of vibration due to C–CH3. The band at 1314.06 cm-1 has been designated to C–C stretching vibration. The band at 1013.01 cm-1 as twisting mode of vibration for NH2 group. All other important bands are given in table 11.
MNDO Computed Results
The band observed at 3438.62 cm-1 is assigned to N-H asymmetric stretching vibration. Asymmetric mode of vibration due to N-CH3 is assigned at 3242.37 cm-1. 1613.37 cm-1 has been assigned as C=O stretching vibration. NH2 Scissoring mode is assigned at 1563.97 cm-1. The bands at 1563.97 cm-1, 1530.22 cm-1 and 1488.71 cm-1 have been designated as C–C stretching vibration. The bands at 1424.87 cm-1 and 1369.56 cm-1 are asymmetric modes of vibration due to C–CH3. The band at 1316.96 cm-1 is C–C stretching vibration.
ZINDO1 Computed Results
The Band at 2756.00 cm-1 is assigned to C-H asymmetric mode of vibration. 1615.76 cm-1 has been assigned C=O stretching vibration. The band at 1507.57 cm-1, 1481.30 cm-1 and 1447.00 cm-1 are C–C stretching vibration. The bands at 1416.32 cm-1 and 1379.83 cm-1 are assigned to asymmetric mode of vibration due to C–CH3. The band at 1301.52 cm-1 C–C stretching vibration. The band at 1004.16 cm-1 is twisting mode of vibration for NH2 group.
The correlation curves between real experimental and AM1, PM3, MNDO, ZINDO1 computed normal mode frequency of vibration for C-4 are shown in Figure 21-25 with simulated spectra based on computed normal modes in the figures 21-25 along with experimental spectrum of the compound in figure 26.
Table 11: Comparative table of real experimental and Computed (AM1, PM3, MNDO, ZINDO1) Group frequencies (cm-1) for 2-N-[Benzaledene] Amino pyrimidine [C-4]
|
S.No. |
Experimental Group Frequency (cm-1) | AM1Computed Group Frequency (cm-1) | PM3 Compound Group Frequency (cm-1) | MNDO Computed Group Frequency (cm-1) | ZINDO1 Computed Group Frequency (cm-1) | Assignment |
| 1 | 3425.73 | – | – | 3438.62 | – |
uas(N–H) in NH2 Group |
|
2 |
3239.06 | 3228.07 | 308783 | 3242.37 | – | uas(N–CH3) |
| 3 | 2925.50 | 3004.26 | 2903.23 | – | 2756.00 |
uas(C–H) in CH3 |
|
4 |
1651.90 | 1624.13 | 1600.28 | 1613.37 | 1615.76 | u(C=O) |
| 5 | 1570.60 | 1569.08 | 1538.69 | 1563.97 | – |
NH2(Sci) |
|
6 |
1494.40 | 1545.91 | 1505.18 | 1530.22 | 1507.57 | u(C=C) |
| 7 | 1482.32 | – | – | 1488.71 | 1481.30 |
u(C=C) |
|
8 |
1444.66 | 1447.33 | – | – | 1447.00 | u(C=C) |
| 9 | 1415.78 | 1428.16 | – | 1424.87 | 1416.32 |
uas(C–CH3) |
|
10 |
1380.28 | 1386.33 | 1370.31 | 1369.56 | 1379.83 | uas(C–CH3) |
| 11 | 1359.18 | 1350.86 | 1337.75 | 1336.89 | 1363.23 |
u(C–N) |
|
12 |
1307.35 | 1314.17 | 1314.06 | 1316.96 | 1301.52 | u(C–C) |
| 13 | 1246.47 | 1236.69 | 1228.12 | 1220.92 | 1236.36 |
u(C–H) |
|
14 |
1125.59 | 1152.01 | 1127.47 | 1167.37 | 1122.01 |
d(C–H) |
|
15 |
1019.30 | 1009.75 | 1013.01 | 1015.23 | 1004.16 | (NH2) Twi |
| 16 | 961.40 | 953.37 | 961.58 | 956.16 | 972.21 |
d(C–H) |
|
17 |
875.65 | 871.40 | 884.01 | 875.56 | 862.81 | d(C–H) |
| 18 | 802.02 | 825.60 | 799.75 | 821.95 | – |
(CCC)rb |
|
19 |
756.60 | 780.76 | 751.92 | 782.22 | 755.57 | d(C–H) |
| 20 | 742.89 | 716.19 | 729.07 | 727.36 | – |
d(C–H) |
|
21 |
692.45 | 658.43 | – | 651.78 | 683.55 | u(N–N) |
| 22 | 619.87 | 636.79 | 632.40 | 626.29 | 620.48 |
d(CCC) |
|
23 |
592.35 | 594.51 | – | – | – | d(CCC) |
| 24 | 558.18 | 558.52 | 548.18 | 561.60 | 565.41 |
d(CCC) |
|
25 |
515.97 | – | 525.99 | 527.76 | 526.80 | d(CCC) |
| 26 | 503.52 | – | – | – | 487.69 |
d(CNN) |
|
27 |
464.88 | 462.94 | 444.15 | 457.16 | 444.61 |
d(CCC) |
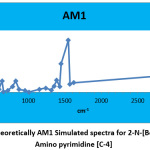 |
Figure 21: Theoretically AM1 Simulated spectra for 2-N-[Benzaledene] Amino pyrimidine [C-4] Click here to View Figure |
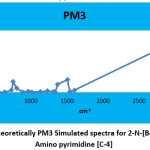 |
Figure 22: Theoretically PM3 Simulated spectra for 2-N-[Benzaledene] Amino pyrimidine [C-4] Click here to View Figure |
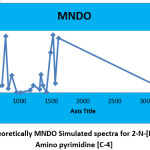 |
Figure 23: Theoretically MNDO Simulated spectra for 2-N-[Benzaledene] Amino pyrimidine [C-4] Click here to View Figure |
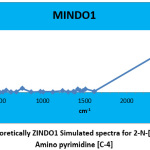 |
Figure 24: Theoretically ZINDO1 Simulated spectra for 2-N-[Benzaledene] Amino pyrimidine [C-4] Click here to View Figure |
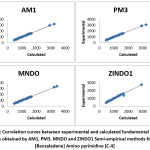 |
Figure 25: Correlation curves between experimental and calculated fundamental vibration modes obtained by AM1, PM3, MNDO and ZINDO1 Semi-empirical methods for 2-N-[Benzaledene] Amino pyrimidine [C-4] Click here to View Figure |
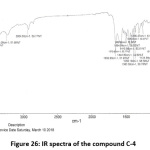 |
Figure 26: IR spectra of the compound C-4 Click here to View Figure |
Computed Results for Heterocyclic Organic Compound 2-N-[2-Hydroxy (Benzalidene)] Amino pyrimidine [C-5]
The AM1, PM3, MNDO, ZINDO1 Computed results for Heterocyclic Organic Compound 2-N-[2-Hydroxy (Benzaledene)] Amino pyrimidine (HBAP)[C-5] are represented in Table- 12 in which some important band are discussed as below-
AM1 Computed Results
The bands observed at 3449.24 cm-1 and 3228.22 cm-1 are N-H asymmetric stretching vibration. NH2 scissoring mode appears at 1582.25 cm-1 and 1561.54 cm-1. C=C stretching mode of vibration at 1483.07 cm-1 and 1452.52 cm-1. The band observed at 1412.86 cm-1 is N-H asymmetric stretching vibration. Bands at 1269.28 cm-1 and 1209.78 cm-1 are designated to C-H symmetric mode of vibration.
PM3 Computed Results
The band observed at 3089.50 cm-1 is N-H asymmetric stretching vibration. NH2 scissoring mode is at 1581.07 cm-1. The band at 1527.80 cm-1 is for NO2. C=C stretching mode of vibration is at 1506.75 cm-1, 1412.05 cm-1. All other important bands are listed in the table 11.
MNDO Computed Results
The band observed at 3438.01 cm-1 and 3257.93 cm-1 is N-H asymmetric stretching vibration. NH2 scissoring mode is assigned at 1603.58 cm-1 and 1564.24 cm-1. The band at 1523.64 cm-1 is assigned for NO2. C=C stretching mode of vibration is at 1461.70 cm-1, and 1443.89 cm-1. The band observed at 1420.88 cm-1 is due to N-H asymmetric stretching vibration. All other important bands are listed in the table 11.
ZINDO1 Computed Results
NH2 scissoring mode is at 1579.12 cm-1. C=C stretching mode of vibration is at 1446.35 cm-1 and 1464.45 cm-1. The band observed at 1411.67 cm-1 is due to N-H asymmetric stretching vibration. Band at 1235.27 cm-1 and 1226.37 cm-1 are designated to C-H symmetric mode of vibration.
The correlation between experimental and AM1, PM3, MNDO, ZINDO1 computed normal mode frequency of vibration for C-5 are shown in Figure 27-31 along with simulated spectra based on the computed normal modes and real experimental spectra in figure 32.
Table 12: Comparative table of Experimental and Computed (AM1, PM3, MNDO, ZINDO1) Group frequencies (cm-1) for 2-N-[2-Hydroxy (Benzaledene)] Amino pyrimidine [C-5]
|
S.No. |
Experimental Group Frequency (cm-1) | AM1Computed Group Frequency (cm-1) | PM3 Compound Group Frequency (cm-1) | MNDO Computed Group Frequency (cm-1) | ZINDO1 Computed Group Frequency (cm-1) | Assignment |
| 1 | 3420.76 | 3449.24 | – | 3438.01 | 4398.19 |
uas(N–CH3) |
|
2 |
3244.31 | 3228.22 | 3089.50 | 3257.93 | 2740.99 | uas(N–CH3) |
| 3 | 1596.01 | 1582.25 | 1581.07 | 1603.58 | – |
NH2(Sci) |
|
4 |
1573.31 | 1561.54 | – | 1564.24 | 1579.12 | NH2(Sci) |
| 5 | 1536.63 | – | 1527.80 | 1523.64 | – |
NO2 |
|
6 |
1498.95 | 1483.07 | 1506.72 | – | 1486.35 | u(C=C) |
| 7 | 1459.98 | – | – | 1461.70 | 1464.45 |
u(C=C) |
|
8 |
1447.25 | 1452.52 | 1412.05 | 1443.89 | – | u(C=C) |
| 9 | 1416.85 | 1412.86 | 1389.16 | 1420.88 | 1411.67 |
uas(C–CH3) |
|
10 |
1356.32 | 1355.07 | 1359.17 | 1348.85 | 1357.43 | u(C–N) |
| 11 | 1242.55 | 1269.28 | 1251.50 | 1286.44 | 1235.27 |
u(C–H) |
|
12 |
1230.88 | 1209.78 | 1236.37 | 1221.14 | 1226.37 | u(C–H) |
| 13 | 1095.02 | 1083.14 | 1085.44 | 1164.90 | 1107.81 |
d(C=O) |
|
14 |
800.44 | 803.57 | 798.35 | 793.95 | 880.32 | d(C–H) |
| 15 | 754.97 | 774.92 | 718.93 | 714.31 | 752.97 |
d(C–H) |
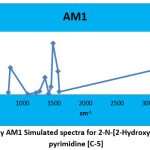 |
Figure 27: Theoretically AM1 Simulated spectra for 2-N-[2-Hydroxy (Benzaledene)] Amino pyrimidine [C-5] Click here to View Figure |
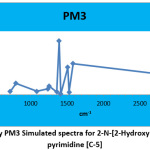 |
Figure 28: Theoretically PM3 Simulated spectra for 2-N-[2-Hydroxy (Benzaledene)] Amino pyrimidine [C-5] Click here to View Figure |
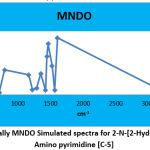 |
Figure 29: Theoretically MNDO Simulated spectra for 2-N-[2-Hydroxy (Benzaledene)] Amino pyrimidine [C-5] Click here to View Figure |
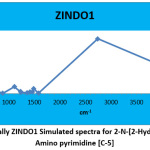 |
Figure 30: Theoretically ZINDO1 Simulated spectra for 2-N-[2-Hydroxy (Benzaledene)] Amino pyrimidine [C-5] Click here to View Figure |
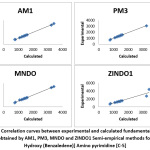 |
Figure 31: Correlation curves between experimental and calculated fundamental vibration modes obtained by AM1, PM3, MNDO and ZINDO1 Semi-empirical methods for 2-N-[2-Hydroxy (Benzaledene)] Amino pyrimidine [C-5] Click here to View Figure |
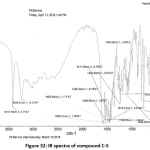 |
Figure 32: IR spectra of compound C-5 Click here to View Figure |
Conclusions
The AM1, PM3, MNDO, ZINDO1 semi-empirical studies with the help of computer software HYPERCHEM 8.0 professional version that was used to calculate the normal modes frequency of vibration and to draw theoretically simulated spectra of these Hetero Cyclic Compounds and as discussed in the results and discussion section, the normal modes frequency of vibration are in a good agreement with experimental and calculated vibration frequencies which are observed in by all these four methods viz. AM1, PM3, MNDO, ZINDO1 with appreciable Correlation coefficient values.
In conclusion all these semi-empirical methods viz. AM1, PM3, MNDO and ZINDO1 are reasonably good and these methods provide an excellent results with perfect correlation with the experimental values so far as simulation of spectra is concern. Among all these methods, AM1 method is very good as compare to others. Secondly, the studies incorporated in the present paper are less time consuming. These may be considered as alternative method of Studies/Teaching in the related field [19-20].
Acknowledgements
Authors sincerely acknowledges SAIF, C.D.R.I. and SAIF, Jiwaji University, Gwalior for the support for various analysis viz. IR, Mass, NMR and elemental analysis of the compounds.
References
- Udupi, R.H.; Rao, Narayan S.; Bhat, A.R.; Ind. J. Het. Chem., 1998, 7, 217
- Halnor, V.B.; Joshi, N.S.; Karale, B.K.; Gill, C.H.; Ind. J. Het. Chem., 2005, 14, 371
- Bondock, S.; Fadaly, W.; Metwally, M.A.; Eur. J. Med. Chem., 2010, 45, 3692
- Radi, S.; Salhi, S.; Radi, A.; 2010, 7, 27
- Sahu, S.K.; Banerjee, M.; Samantra, A.; Behera, C.; Azam, M.A.; Tropical J. Pharm. Research, 2008,7(2), 961
- Sridhar, S.; Perumal, P.J.; Etti, S.; Shanmugam, G.; Ponnuswamy, M.N.; Prabavathy, V.R.; Mathivanan, N.; Bioorg. Med. Chem. Lett., 2004, 14, 6035
- Rao, Jyothi N.; Sujith, K.V.; Kalluraya, B.; J. Saudi Chem. Soc., 2008, 12(3), 347
- Satheesha Rai, N.; Kalluraya, Balakrishna; Indian J. Chem., 2007, 46B, 375
- Argade, N.D.; Kalrale, B.K.; Gill, C.H.; E-Journal Chemistry, 2008, 5(1), 120.
- Chovatia, P.T.; Akabari, J.D.; Kachhadia, P.K.; Zalavadia, P.D.; Joshi, H.S.; J. Serb. Chem. Soc., 2007, 71(7), 713
- Kuntal, M.; Yadvendra, K.; 2009, 19, 2688
- Karthikeyan, M.S.; Holla, B.S.; Kumari, N.S.; Eur. J. Med. Chem., 2007, 42, 30
- Venkat Raghvan, R.; Vijayakumar, V.; Suchethakumari, N.; 2010, 45, 1173
- Menozzi, G.; Merello, L.; Fossa, P.; Schenone, S.; Ranise, A.; Mosti et al, 2004, 12, 5465
- Pattan, R.; Rabara, P.A.; Pattan, J.S.; Bukitagar, A.A.; Wakale, V.S.; Musmade, D.S.; Indian Journal of Chemistry, 2009, 48B, 1453
- Hodnett, E.M.; and Dunn, W.J.; Journal of Medicinal Chemistry, 1970, 13, 768-770
- Oforka, N.C.; Mkpenie, V.N.; Chinese Journal of Chemistry, 2007 , 25, 869-871
- Przybylski, P; Huczynski, A; Pyta, K; Brzezinski, B; Bartl, F; 2009, 13, 124-148
- Parmar, Anu; Arora, Kishor; International Journal of Science and Research (IJSR), 2015, 4(9), 1352-1357
- Parmar, Anu; Arora, Kishor; IOSR Journal of Applied Chemistry, 2015, 8(10), 77-86

This work is licensed under a Creative Commons Attribution 4.0 International License.
![]()
A New Edition of Web of Science
Journal Impact Factor
2022: 0.5
Five Year: 0.8
Journal is Indexed in

Cabells Whitelist
![]()


