
. Introduction
The successful application of optically stimulated luminescence (OSL) on young fluvial deposits requires the assessment of several factors influencing the reliability of the dating result. Residual dose (Dres) as a consequence of incomplete bleaching and thermal transfer (TT) is among the most significant issues affecting the apparent and usually overestimated age determined by the method.
The resetting or bleaching of the luminescence signal in sediment grains during transportation as a consequence of sunlight exposure is one of the most important underlying principle of OSL dating, providing the zeroing event for the analysis. Resetting is affected by several external and inherent factors, such as the length, distance, mode and recurrence of the transportation process, or the mineralogical composition and size of grains (Alexanderson, 2007; Rittenour, 2008). In fluvial environments, incomplete resetting and thus the preservation of a Dres is highly probable, since travelling time before deposition can be short, the shading effect of water can be significant and grains may coagulate. Although it can be complicated, the handling of the problem is important either young or older sediments are the subject of the investigation. In most of the cases, the issue of residual dose is tackled by applying different statistical analyses on equivalent dose (De) values measured preferably using single grains or very small aliquots (Olley et al., 1998; Galbraith et al., 1999; Lepper et al., 2000; Fuchs and Lang 2001; Galbraith, 2005). Another approach can be to determine residual doses in modern, known-age sediments in similar sedimentary environments to those from where palaeo-samples have been collected (Murray et al., 1995; Olley et al., 1998; Stokes et al., 2001). This way, the statistically derived minimum equivalent dose can be compared to the Dres measured directly.
In larger river systems, the degree of resetting may significantly vary, both in space and according to the sediment type (Sipos et al., 2016), therefore the analysis of longer sections and different grain sizes is desirable. Stokes et al. (2001) investigated the bedload of the Loire River along its entire 1000 km length. In the headwater area Dres dropped from 14.0 Gy to 3.3 Gy, while 300 km further downstream it decreased to 0.3 Gy. Similar, but somehow higher values were obtained by Jaiswal et al. (2009), investigating modern slack water deposits in the mid-section of the subtropical Kaveri River. Results indicated a 0.3–1.2 Gy Dres, meaning a 200–1000-year age overestimation. Nevertheless, as indicated by Jaiswal et al. (2009) and others as well (e.g. Rittenour, 2008), significant spatial differences may arise as a result of floods and consequent erosion of older deposits. Therefore, we suggest that the analysis of flood related sediments may indicate the possible maximum of residual doses in the sediments of a river system. Concerning the Danube, with the exception of Fiebig and Preusser (2007), hardly any investigations were made on modern sediments. During their research near the Vienna section of the river they obtained remarkably high residual doses (6.1 ± 0.2 Gy), which were explained clearly by anthropogenic effects, namely the introduction of quarried sediments into the river to normalise bedload budget and prevent incision.
The significance of grain size and mineralogy in dating fluvial deposits is widely studied in the literature (see e.g. Olley et al., 1998; Wallinga et al., 2001; Colls et al., 2001; Vandenberghe et al., 2007). In general, it is claimed that the sand sized fraction (coarse grains) is much more probable to get reset adequately then the silt sized fraction (fine grains) (Hu et al., 2010, Vandenberghe et al., 2007; Alexanderson, 2007). This is explained mostly by the coagulation of fine grains during transport and deposition, whereas coarse bedload grains might be exposed to sunlight more probably on the surface of bars for example (Hu et al., 2010). Concerning mineralogy quartz is preferred, as feldspars are proven to be bleached less efficiently (Rittenour, 2008).
When determining the dose absorbed by young or modern sediments, another factor, thermal transfer (TT), may also significantly influence the results. The magnitude of overestimation can reach several grays (Li and Li, 2006; Jain et al., 2004), which can even overshadow the effect of incomplete bleaching. Two types of TT are known: recuperation and basic transfer (Aitken, 1998), and both are generated by returning preheats during OSL measurements. Whereas recuperation, a combination of photo and thermal transfer effects, can be routinely monitored by using the SAR protocol, and can be mitigated by inserting a hot bleach at the end of each SAR cycle (Wintle and Murray, 2006), the estimation of basic transfer, related to heat induced charge release from light-insensitive deep traps and subsequent retrapping in OSL traps, requires more care (Wang et al., 2006).
Based on the study of Ward et al. (2003) on several samples from different depositional environments, fluvial sediments are prone to be affected by a significant TT as a result of preheat (up to around 1.5 Gy at 220°C), while aeolian samples proved to be insensitive to thermal treatment. On the other hand, Jaiswal et al. (2009) observed only a 0.04–0.10 Gy TT in fluvial sediments. Treulsen and Wallinga (2003) examined in detail the effect of TT on different coarse grain fractions of fluvial channel deposits, and received values between 0.2–0.5 Gy at 200°C, but did not find any relationship between grain size and the degree of TT.
In the present paper, coarse and fine grain river bank sediments deposited during the 2013 Danube flood along the Hungarian section of the river were investigated. The primary aim of the research was to determine the effect of thermal transfer and the degree of incomplete bleaching on both coarse and fine grain sediments. The second major aim was to investigate the longitudinal distribution of thermal transfer corrected residual doses, and to reveal whether there is any spatial pattern in the variation of values. Moreover, results can also contribute later to the assessment of age uncertainties in terms of paleo-sediments collected in the region.
. Study area and sampling
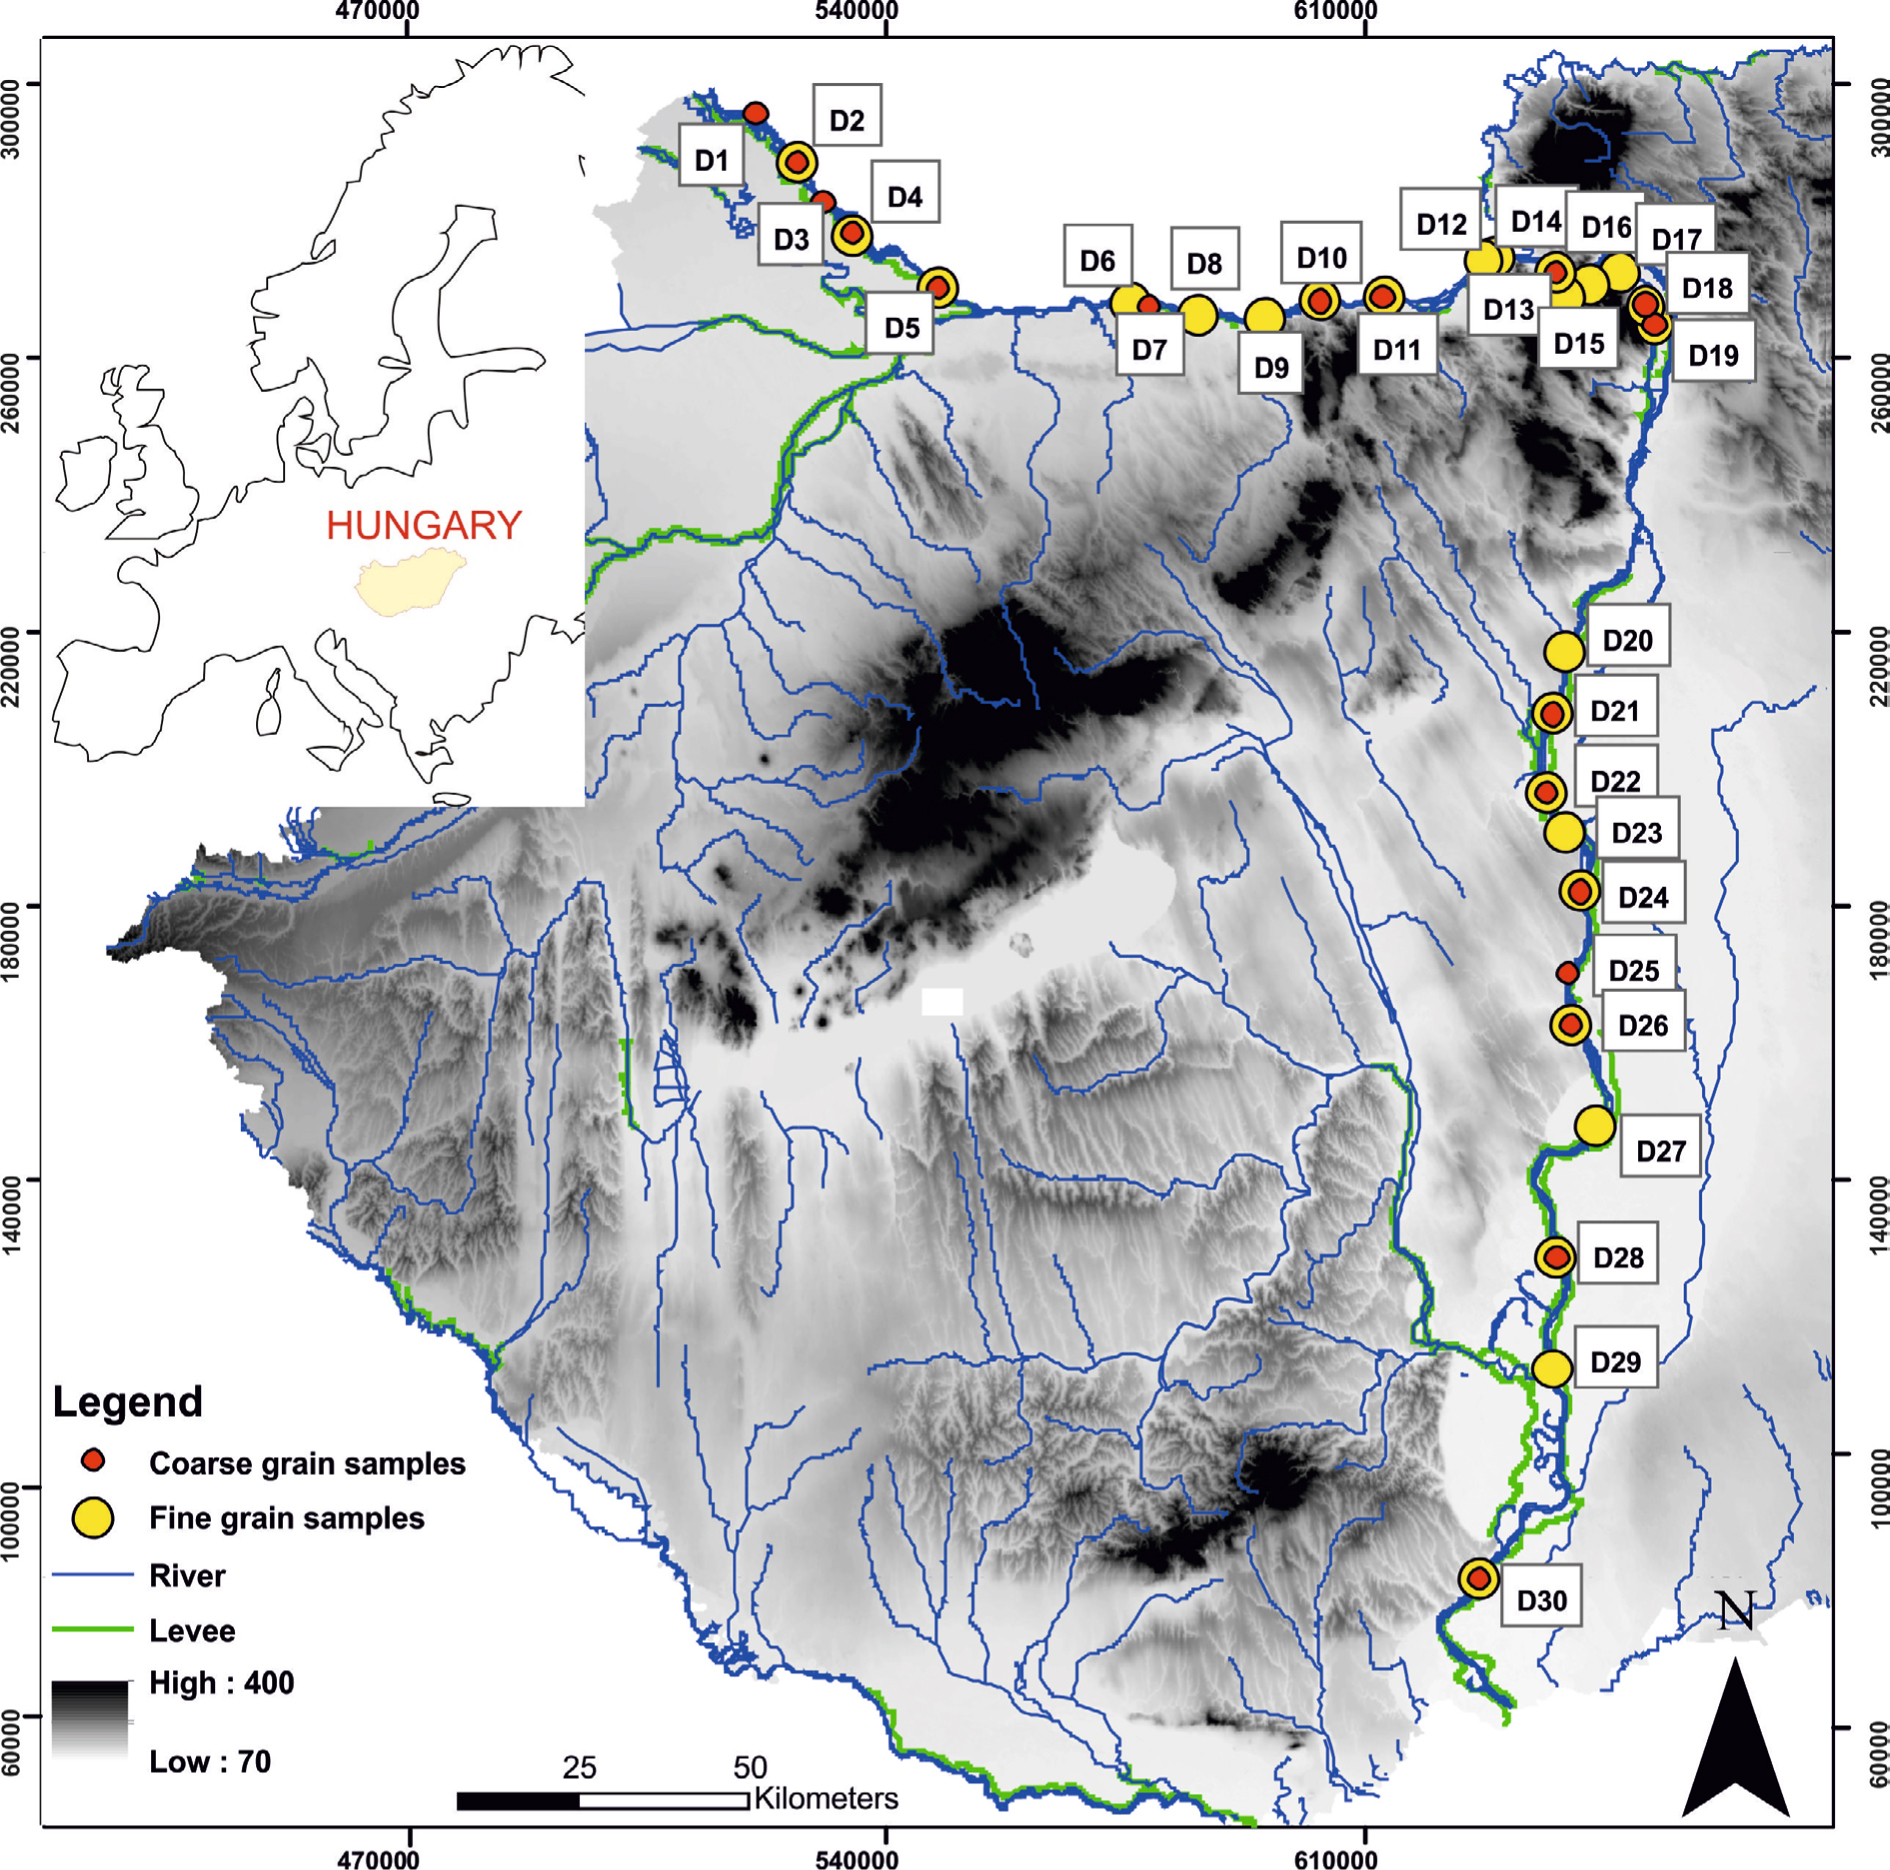
The Danube with its 2850 km length, 817 000 km2 large drainage basin and its versatile geological and geomorphological background is one of the most complex fluvial systems of the world. The Hungarian section of the river is 417 km, most of which has undergone river regulation in the 19th and 20th centuries. Nevertheless, downstream of the Gabčíkovo hydropowerplant (1992) no dams hamper the continuity of sediment transport, therefore luminescence characteristics are determined by quasi natural processes.
The mode of sediment transport clearly shifts on the Hungarian section. Prior to the diversion of the Danube to the Gabčíkovo plant, the discharge of the gravelly bed-load was 600 000 m3/year at the entrance to the country (Bogárdi, 1971), while already after 50–70 km where the river leaves its alluvial fan it decreased to around 30 000–50 000 m3/year. In the meantime, median grain size halved (from 5–7 to 2–3 cm), thus a significant amount of bedload is converted into suspended load. The sediment regime has been dramatically altered on a 50 km long section as a result of channel diversion to the above mentioned hydropower plant, but during larger floods connectivity is refreshed in partly abandoned anabranches as well. Going downstream the significance of suspended load is overwhelming and its discharge reaches 6–7 million t/year on the middle section of the Hungarian Danube, and 8–9 million t/year on its lower reach. Bedload measurements are very scarce on these sections. Bedload is mostly composed of coarse and medium sand.
Sedimentological characteristics are also affected by the erosional regime and channel pattern of the river. On the first 40–50 km it was originally anastomosing and accumulating, then for another 50–60 km a transitional section can be identified. After entering the Transdanubian Hills the river is flowing in a straight, incised channel for more than 200 km. This section is prone to erosion especially in the loess covered region downstream of Budapest. The final 100 km is characterised by a meandering pattern, which was straightened at certain sections in the 19th century (VITUKI, 1971; Mezősi, 2011). On its way through Hungary only smaller tributaries join the river, hardly changing the mineralogy of its sediment.
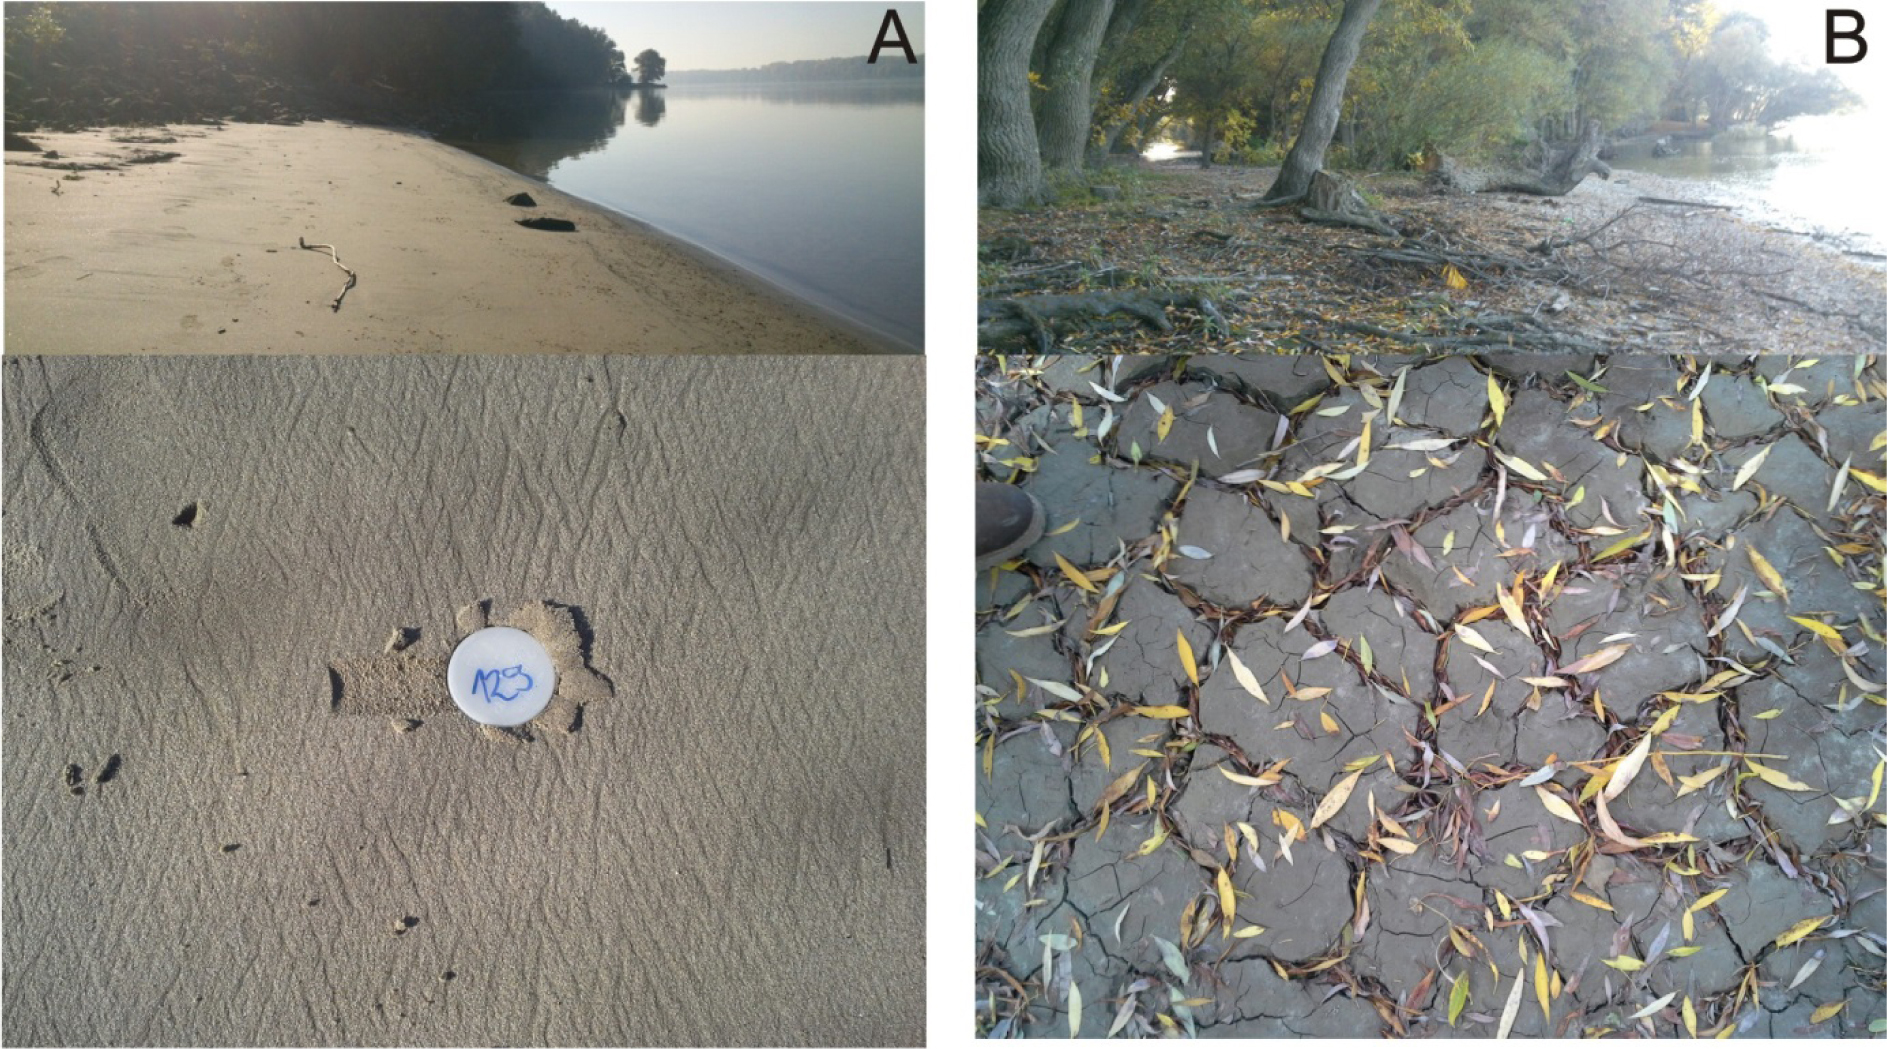
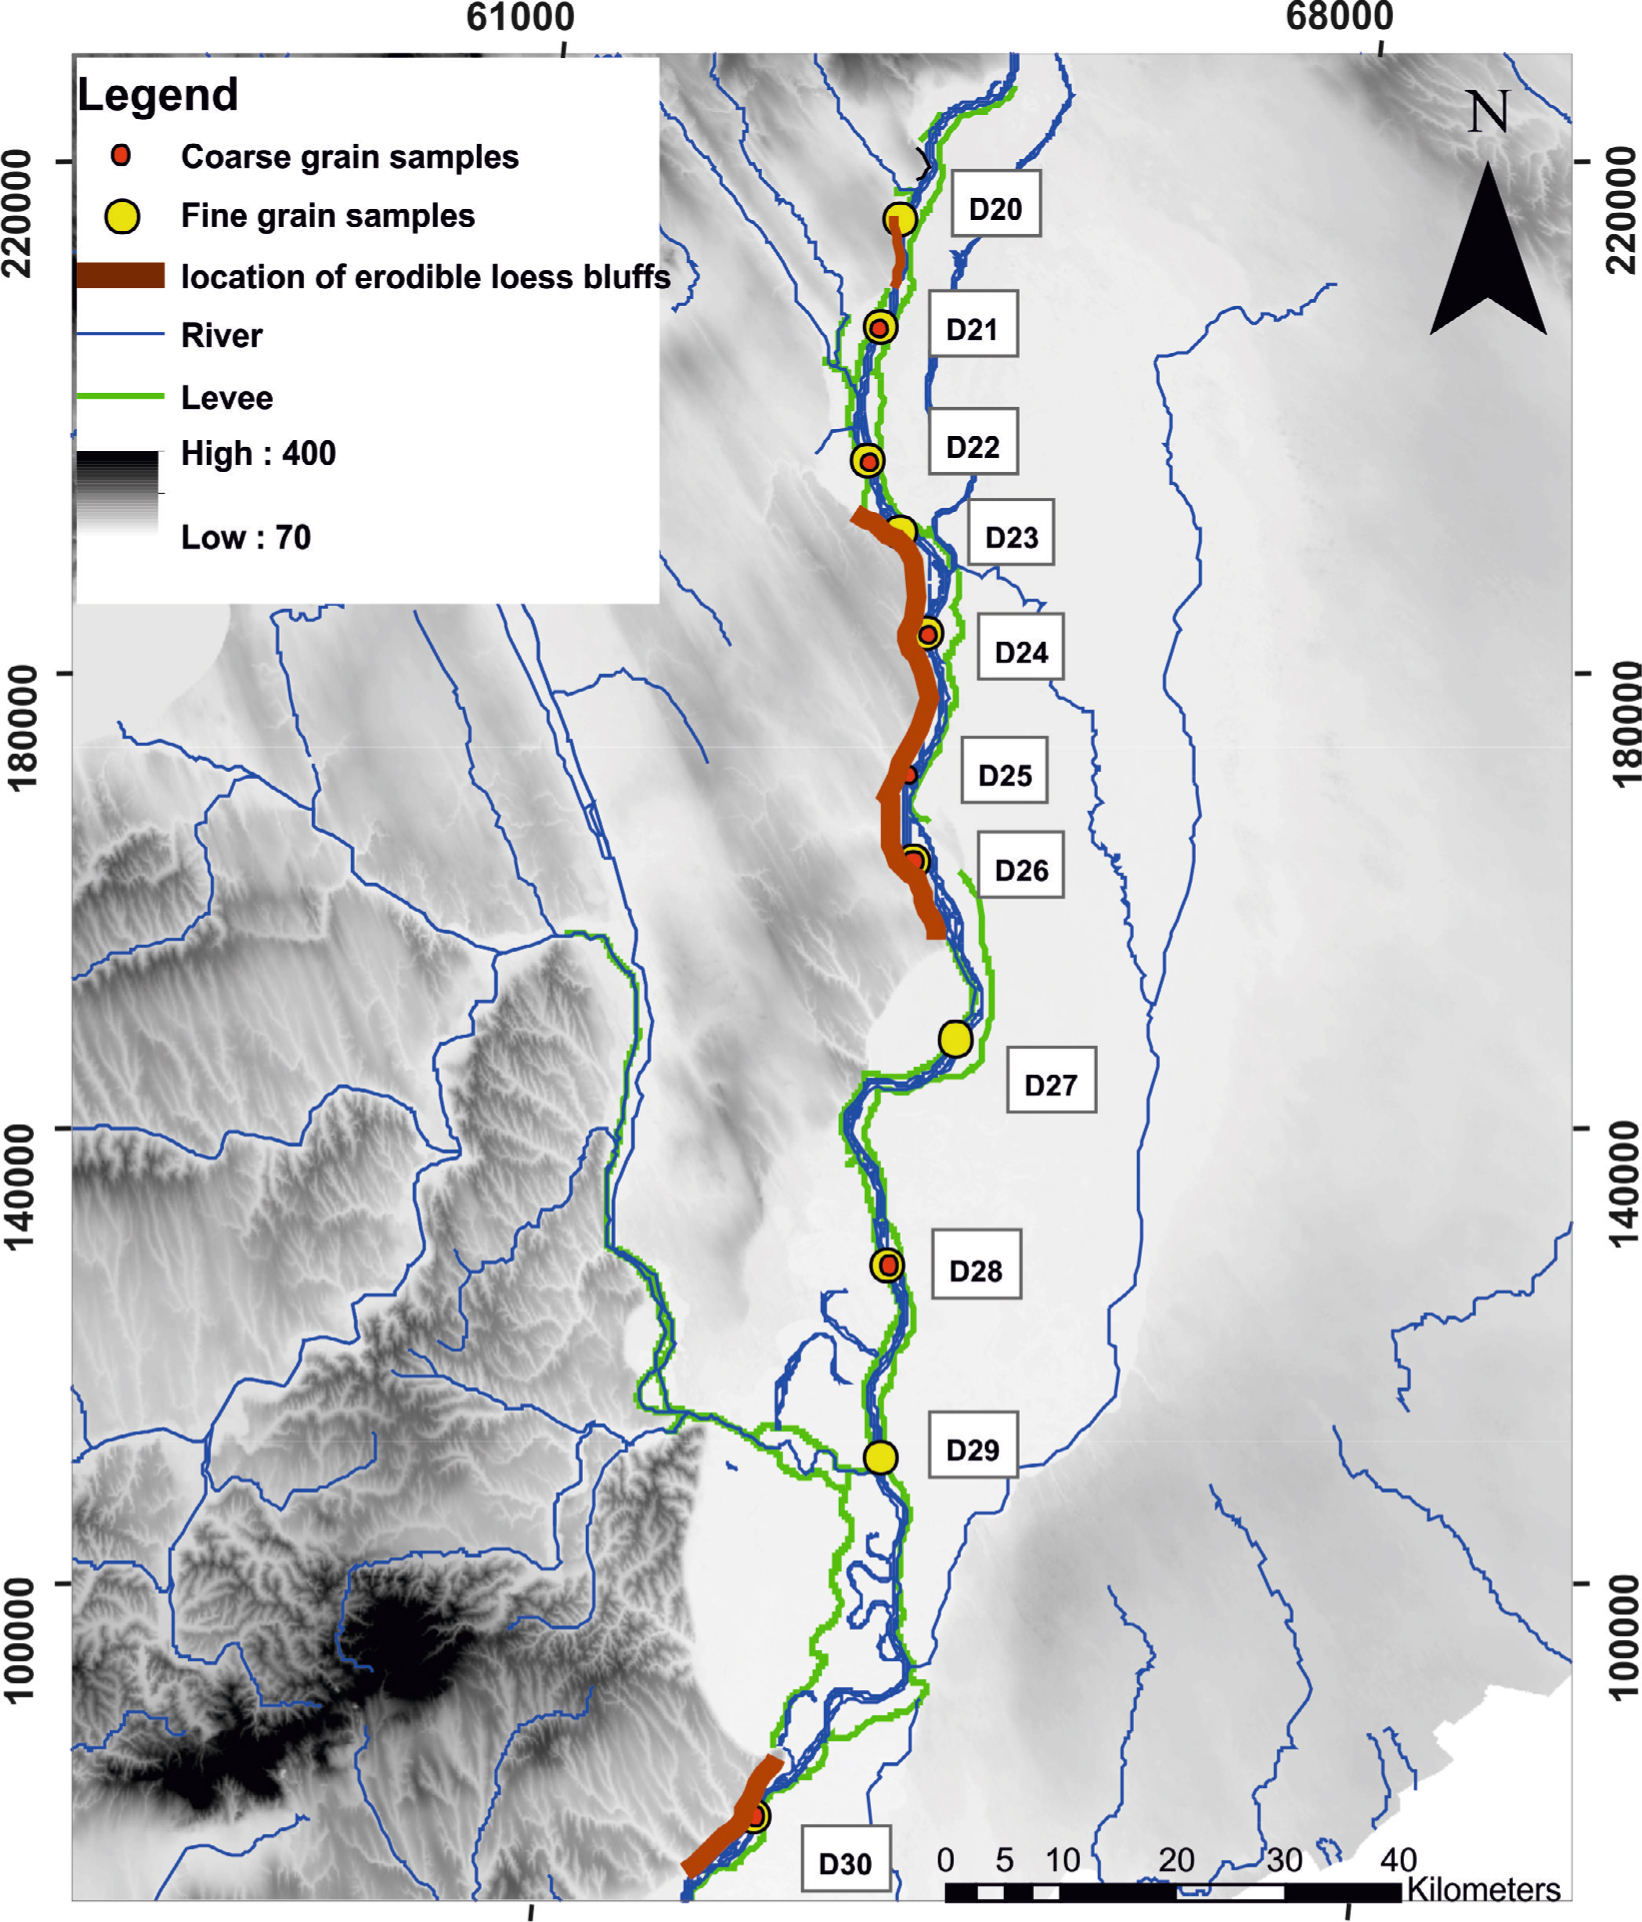
Sampling was made 2 months after the extreme flood of 2013, which activated connectivity and the transportation of sediments along the system. Consequently, samples were supposed to have higher Dres than average. In all, 30 sites were visited (Fig. 1). Samples were collected from the bank (silt-clay) and the channel (sand) material, at each site from similar morphological position. Where it was possible, both silty-clayey (fine) and sandy (coarse) samples were collected. The fresh layer of sediments was easy to identify in case of both sample types (Fig. 2). Samples were collected into stainless steel cylinders (sand) or by taking and wrapping pieces of the topmost compact sediment layer (silty-clay).
. Methods
Sample preparation
Samples were dried and the outer 5 mm of both sand cores and silt flakes were removed. Coarse grain (90–150 μm) and fine grain (4–11 μm) samples were prepared by usual techniques. The separation of grain size fractions was made by wet sieving and settling in Atterberg cylinders, respectively. The carbonate and organic material content was removed by repeated treatment in 10% HCl and 10% H2O2. In case of coarse grains, a sodium polytungstate (LST Fastfloat) heavy liquid separation was applied for the separation of the quartz fraction. This step was followed by a 50 min etching in 40% HF. The abundance of quartz in fine grain samples was enhanced by a 7 day etching in hexafluorosilicic acid. Coarse grains were adhered to stainless steel discs by silicone spray (6 mm mask for preheat and TT tests and 2 mm mask for Dres measurements), fine grains (2 mg/aliquot) were settled on aluminium discs using acetone.
Experimental details
OSL measurements were made using a Risø TL-DA-15 TL/OSL luminescence reader at the Szeged Luminescence Dating Laboratory. Tests and equivalent dose determination were based on the SAR protocol (Murray and Wintle, 2003).
From the total 30 sites, 5 sites (D5, D10, D21, D26, D30), representing the different morphological sections of the river (Fig. 1), were selected to perform detailed measurements, focusing on preheat and cutheat temperatures and TT on both fine and coarse grain samples.
First the response to different preheat and cutheat temperatures was tested in case of the selected samples. A combined dose recovery and preheat test was applied, starting with a repeated optical stimulation, followed by administering a known dose, and completed by SAR measurements using different combinations of preheat and cutheat temperatures. Preheat and cutheat temperatures were increased from 200°C to 260°C and 120°C to 180°C, respectively, both in 20°C steps. Each temperature combination was applied on 5 aliquots.
For the TT tests, the procedure of Treulsen and Wallinga (2003) was adopted and modified. The test has two main phases (Table 1). In the first phase, after bleaching 5 aliquots and administering no artificial dose, OSL responses are measured by applying increasing preheat temperatures in ten cycles on each aliquot. The preheat activated equivalent dose is then determined by using 3 regeneration cycles (Table 1).
Table 1
The arrangement and measurement parameters of the two phase TT test (phase 1 adopted from Truelsen and Wallinga, 2003).
The aim of the second phase of TT tests was to determine the effect of simultaneous thermal and optical stimulation (hot bleach), and whether this type of treatment can mitigate the TT phenomenon experienced in the first phase of tests. Consequently, the previous measurement structure was applied on the same aliquots but by inserting an elevated temperature optical bleaching (Murray and Wintle, 2003) both before measuring preheat OSL responses and before each regeneration cycle (Table 1).
After evaluating the results of the preheat/cutheat tests and the detailed TT tests all other samples were subjected to a simplified TT test using the temperature settings which proved to be adequate for the De measurements.
The measurement of sample De, and consequently Dres, was made using 48 and 24 aliquots in case of coarse grain and fine gain samples, respectively. Temperature settings were based on the tests above to minimise the effect of TT. The first 0.5 s of OSL curves was taken as the signal, the last 10 s were used to estimate the background of measurements. Possible feldspar contamination was also monitored by measuring IRSL/OSL depletion ratio at the end of the SAR procedure. Coarse grain sample De was determined by using the un-logged minimum age model (Galbraight et al., 1999). In case of fine grain samples, the arithmetic mean and standard error of individual results was taken as De.
. Results and discussion
Preheat-cutheat tests
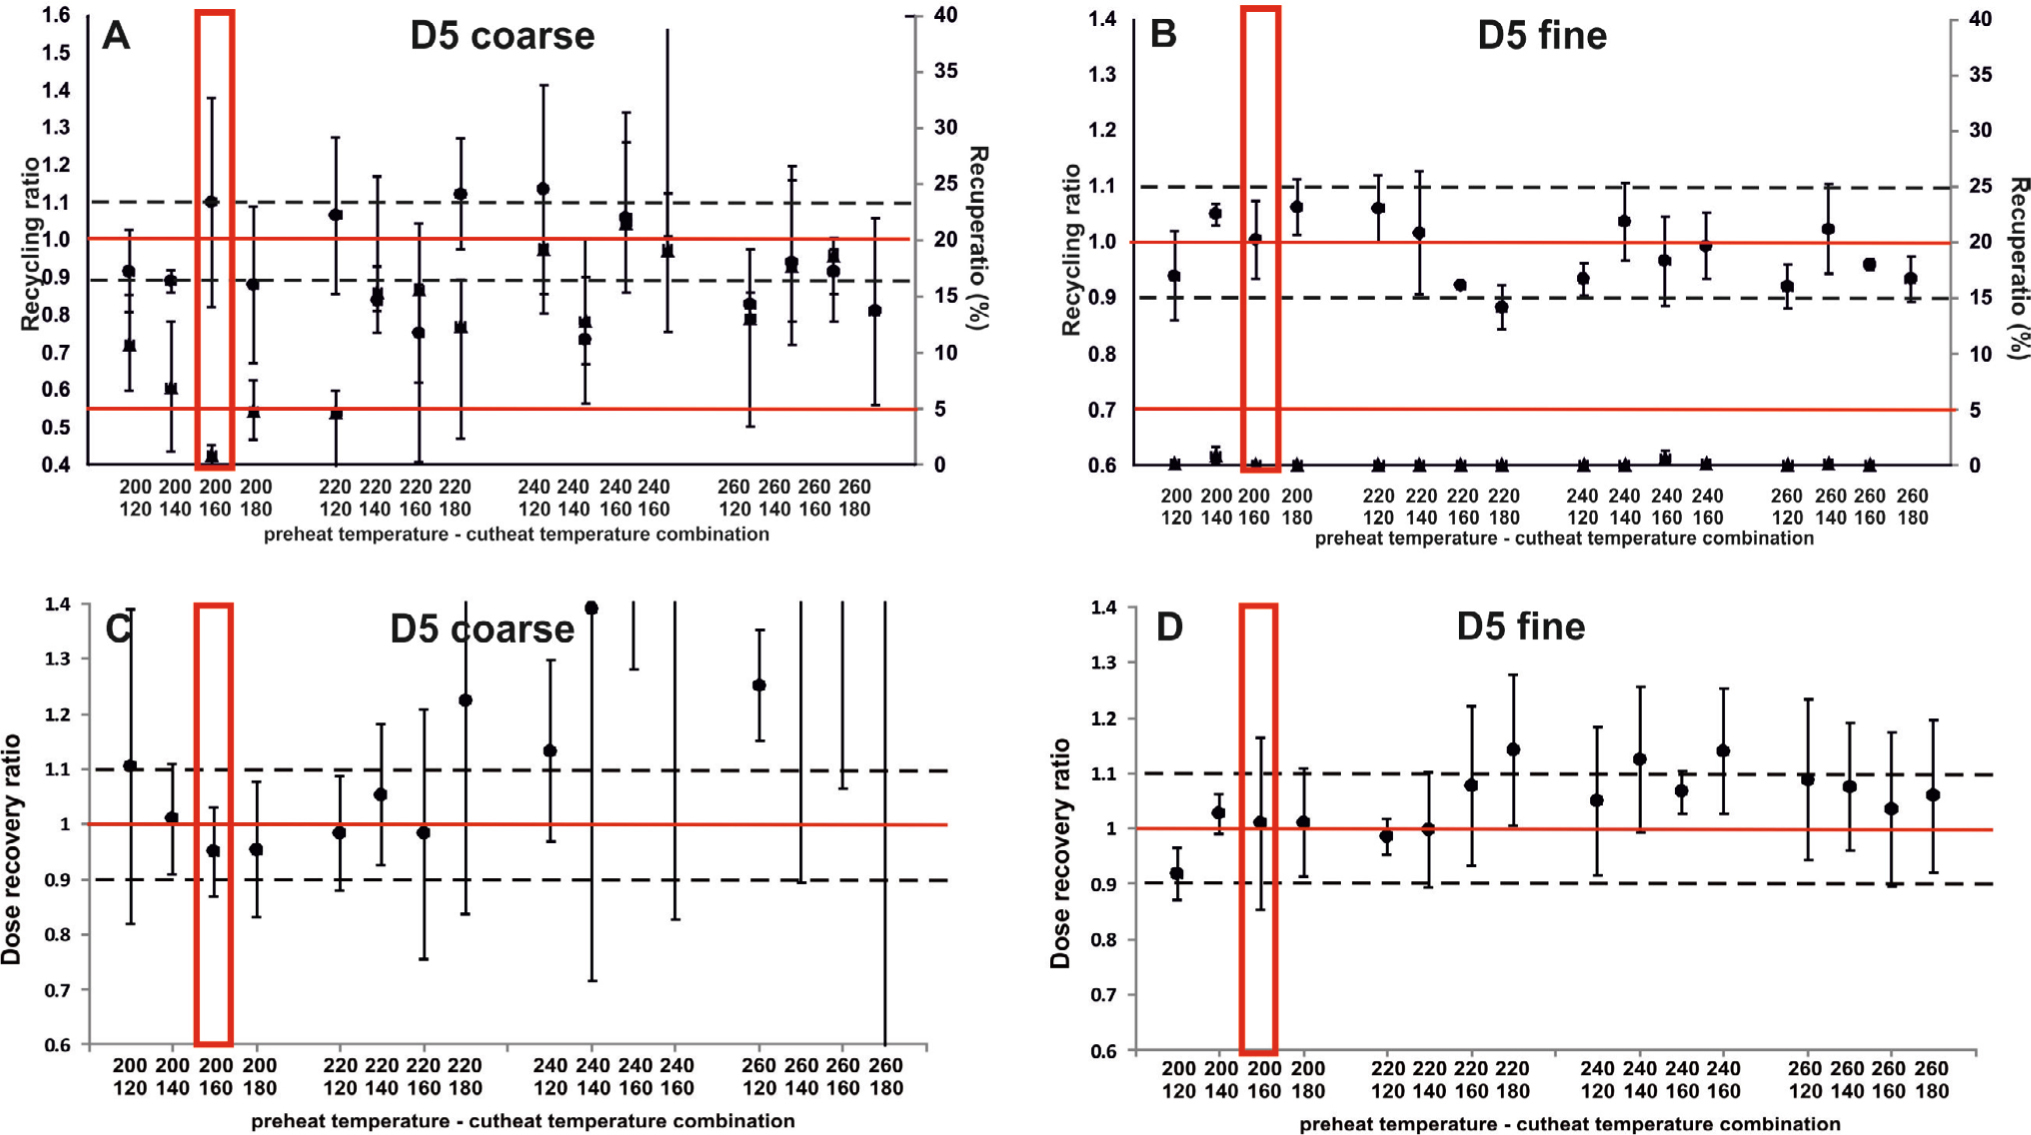
Concerning the samples tested in detail, recycling ratios exhibited a large scatter throughout the test as a consequence of the relatively low sensitivity and rather poor luminescence response of both coarse and fine grain samples. Recuperation increased usually at 240°C in case of coarse grain aliquots, but remained constantly low for fines (Fig. 3). As expected, given doses were recovered better by fine grain samples, however there were several temperature combinations where coarse grain aliquots performed well, too (Fig. 3). When the three criteria (recycling ratio, recuperation, dose recovery) were considered together, the 200°C/160°C preheat-cutheat treatment proved to be the best option. At this temperature combination the average recycling ratio, recuperation and dose recovery ratio of samples investigated in detail were 1.02 ± 0.04, 2.58 % and 0.98 ± 0.05 for the coarse grain and 1.03 ± 0.05, 0.17 % and 0.99 ± 0.11 for the fine grain fraction, respectively.
Thermal transfer
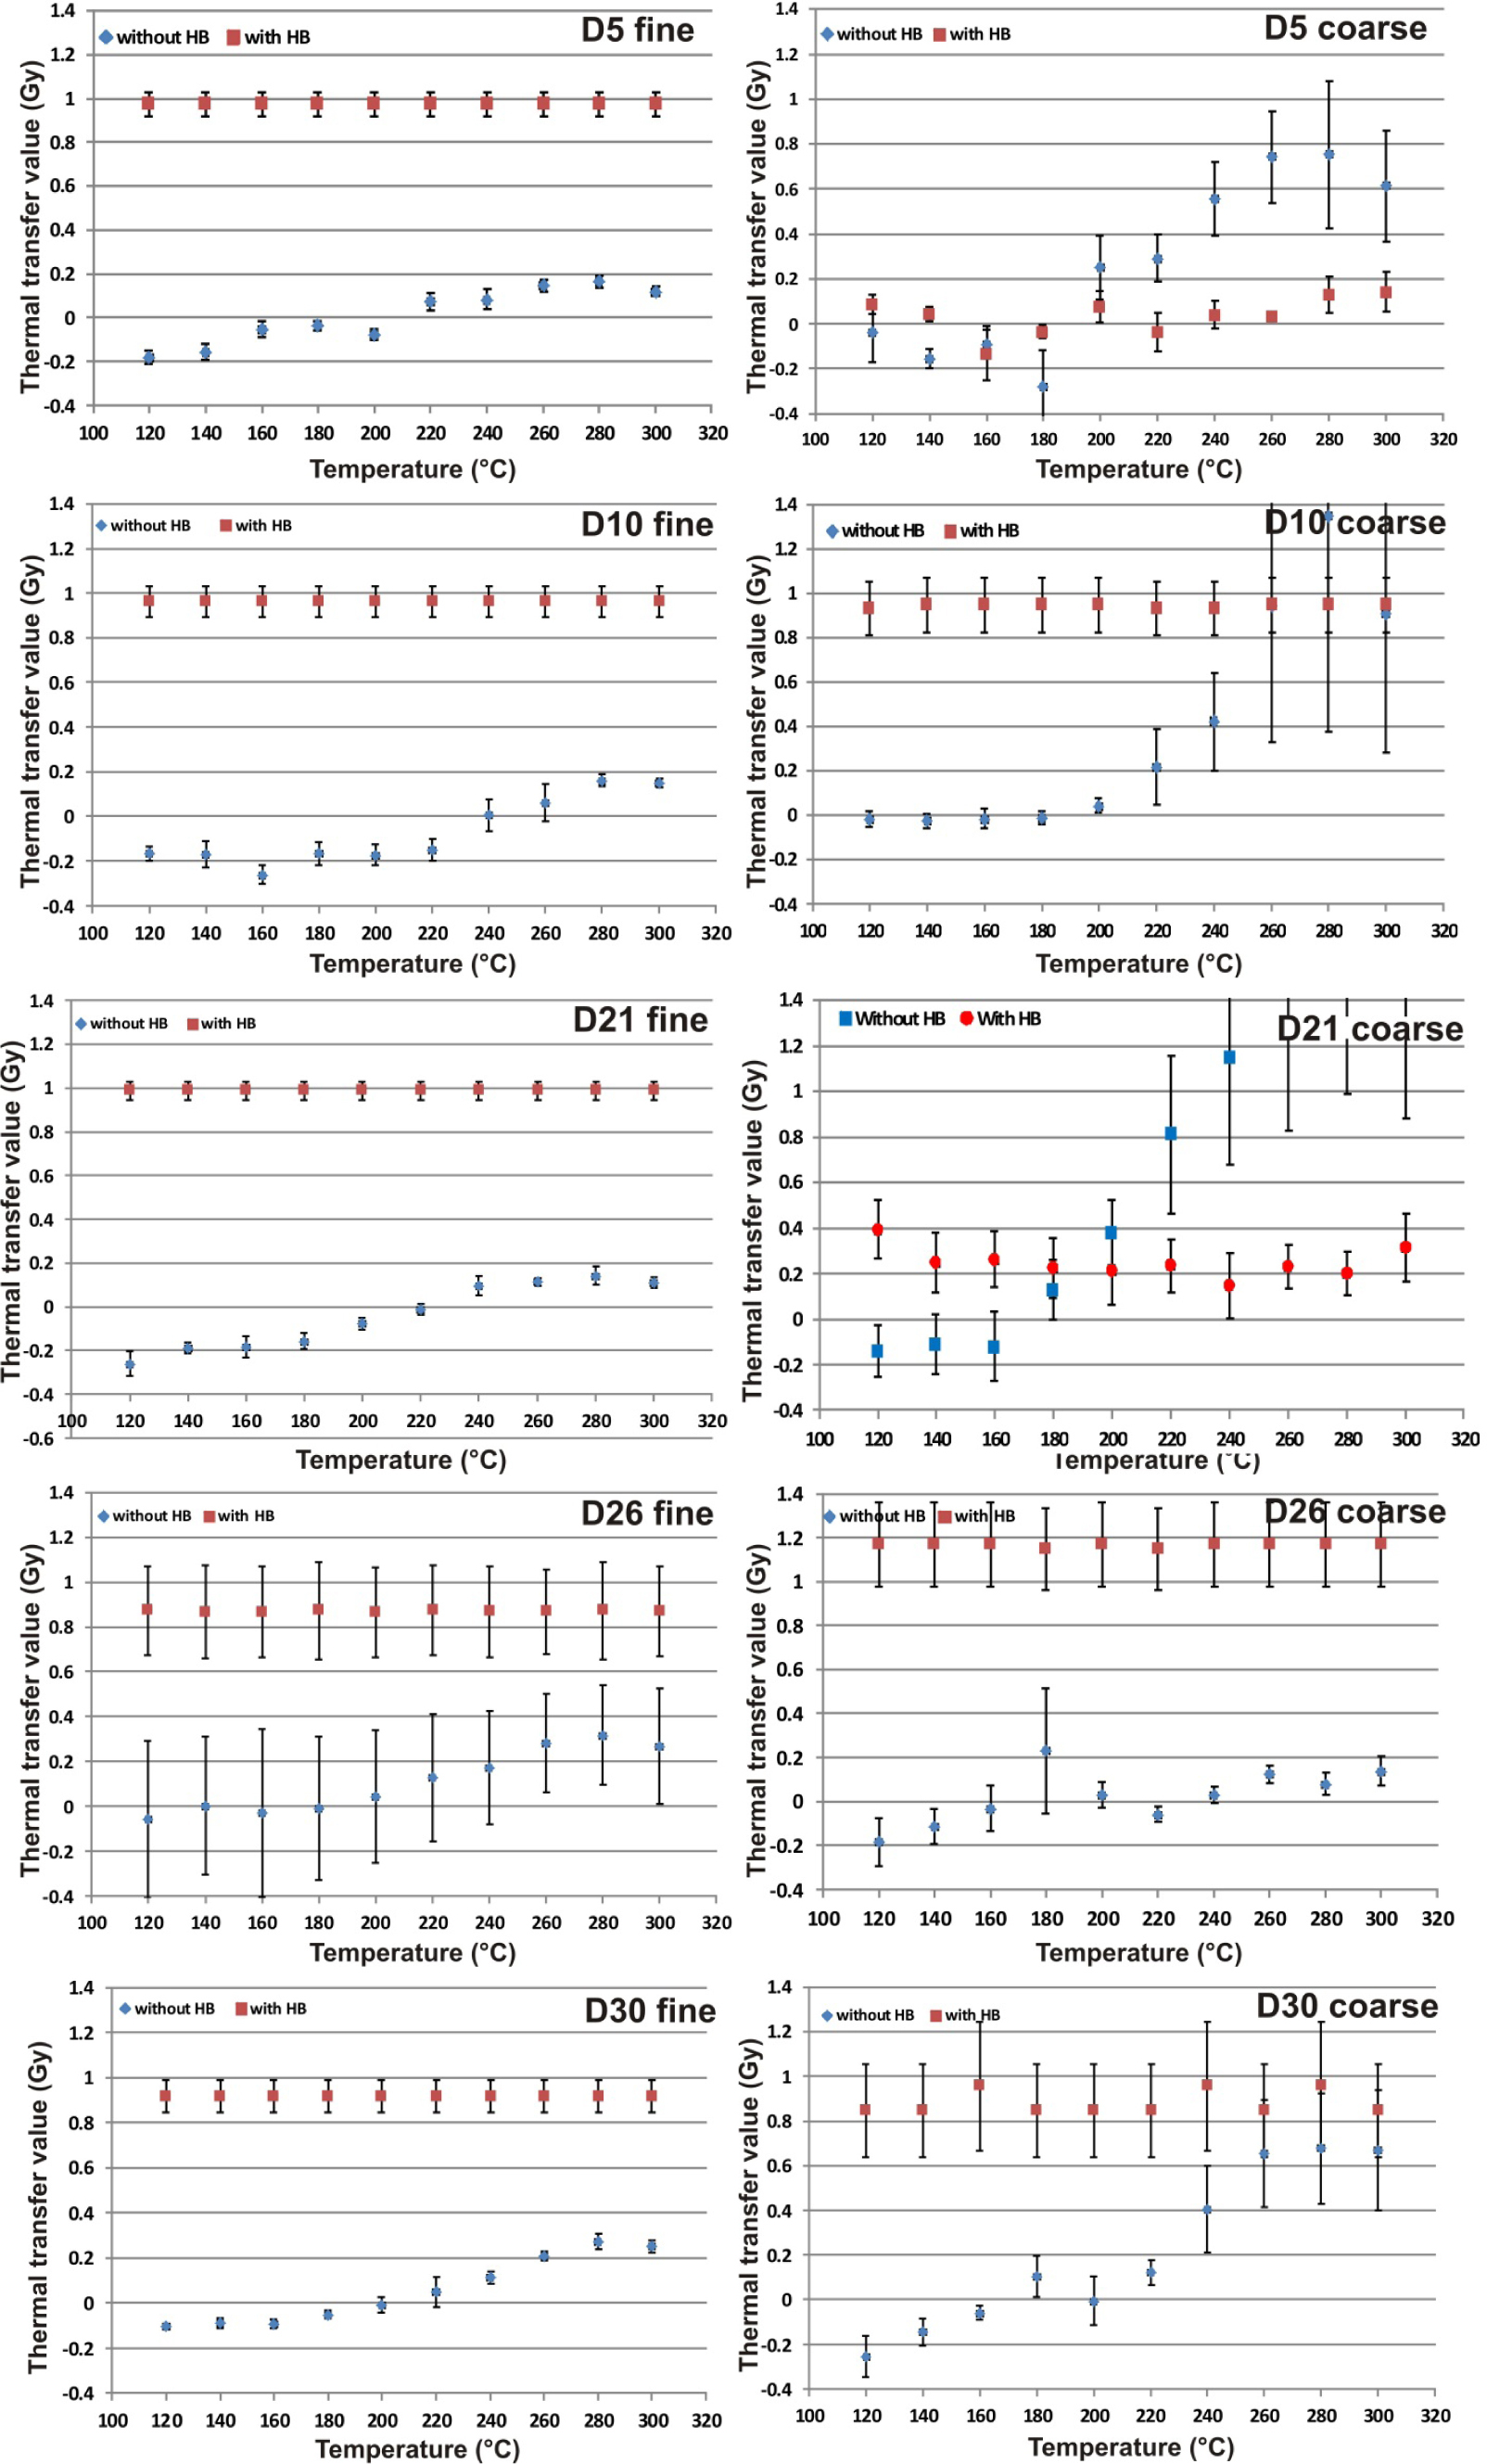
In the first phase of the tests, coarse grain results exhibited the same pattern concerning TT in case of almost each sample. Regarding measurements without hot bleach (w/oHB) TT is insignificant at low temperatures and even negative values appear, which is due to the fact that practically no signal was detected subsequent to thermal treatment at low temperatures. An inflection point can be identified at 180–200°C, over which the gradual increase of TT values starts, which corresponds well to the findings made at the preheat-cutheat tests. The mean value of TT at 200°C is 0.06 ± 0.05 Gy with a maximum value of 0.25 ± 14 Gy. Regarding the 5 samples only one, sample D26 exhibited practically no transfer effects in the high temperature region (Fig. 4). The mean TT of the 5 samples at 300°C was therefore 0.88 ± 0.33 Gy. Concerning the second phase of TT tests, when measurements were made with a hot bleach (w/HB) TT values were stable. This meant that even at low temperatures some TT occurred and similar values were characteristic in the entire temperature range (Fig. 4). Consequently, at 200°C and 300°C the mean value of TT was 0.65 ± 0.22 Gy (maximum value: 1.17 ± 0.19 Gy) and 0.68 ± 0.20 Gy, respectively, meaning that in both cases w/HB values exceeded w/oHB values by 0.1 Gy.
In terms of fine grain samples, w/oHB values of TT showed a similar pattern than in case of coarse grain samples, however results were in general lower and the difference between lower and higher temperature values was smaller (Fig. 4). The mean TT at 200°C was –0.07 ± 0.03 with a maximum value of 0.00 ± 0.01 Gy, in the meantime TT at 300°C was 0.18 ± 0.03 Gy. When measurements were made w/HB the experienced TT values were remarkably higher than w/oHB results (Fig. 4). On average, the degree of w/HB TT at 200°C was 0.94 ± 0.02 Gy with a maximum value of 0.99 ± 0.04 Gy. Accordingly, mean TT at 300°C was 0.94 ± 0.02 Gy. Consequently, in all w/HB TT was higher than w/oHB TT regarding fine grain samples, just like in terms of coarse grain samples. When coarse and fine grain results are compared it is also obvious that TT is significantly lower in case of fines if measurements are done w/oHB. The mean TT values received are similar to those measured by Truelsen and Wallinga (2003) at 200°C (~0.2 Gy).
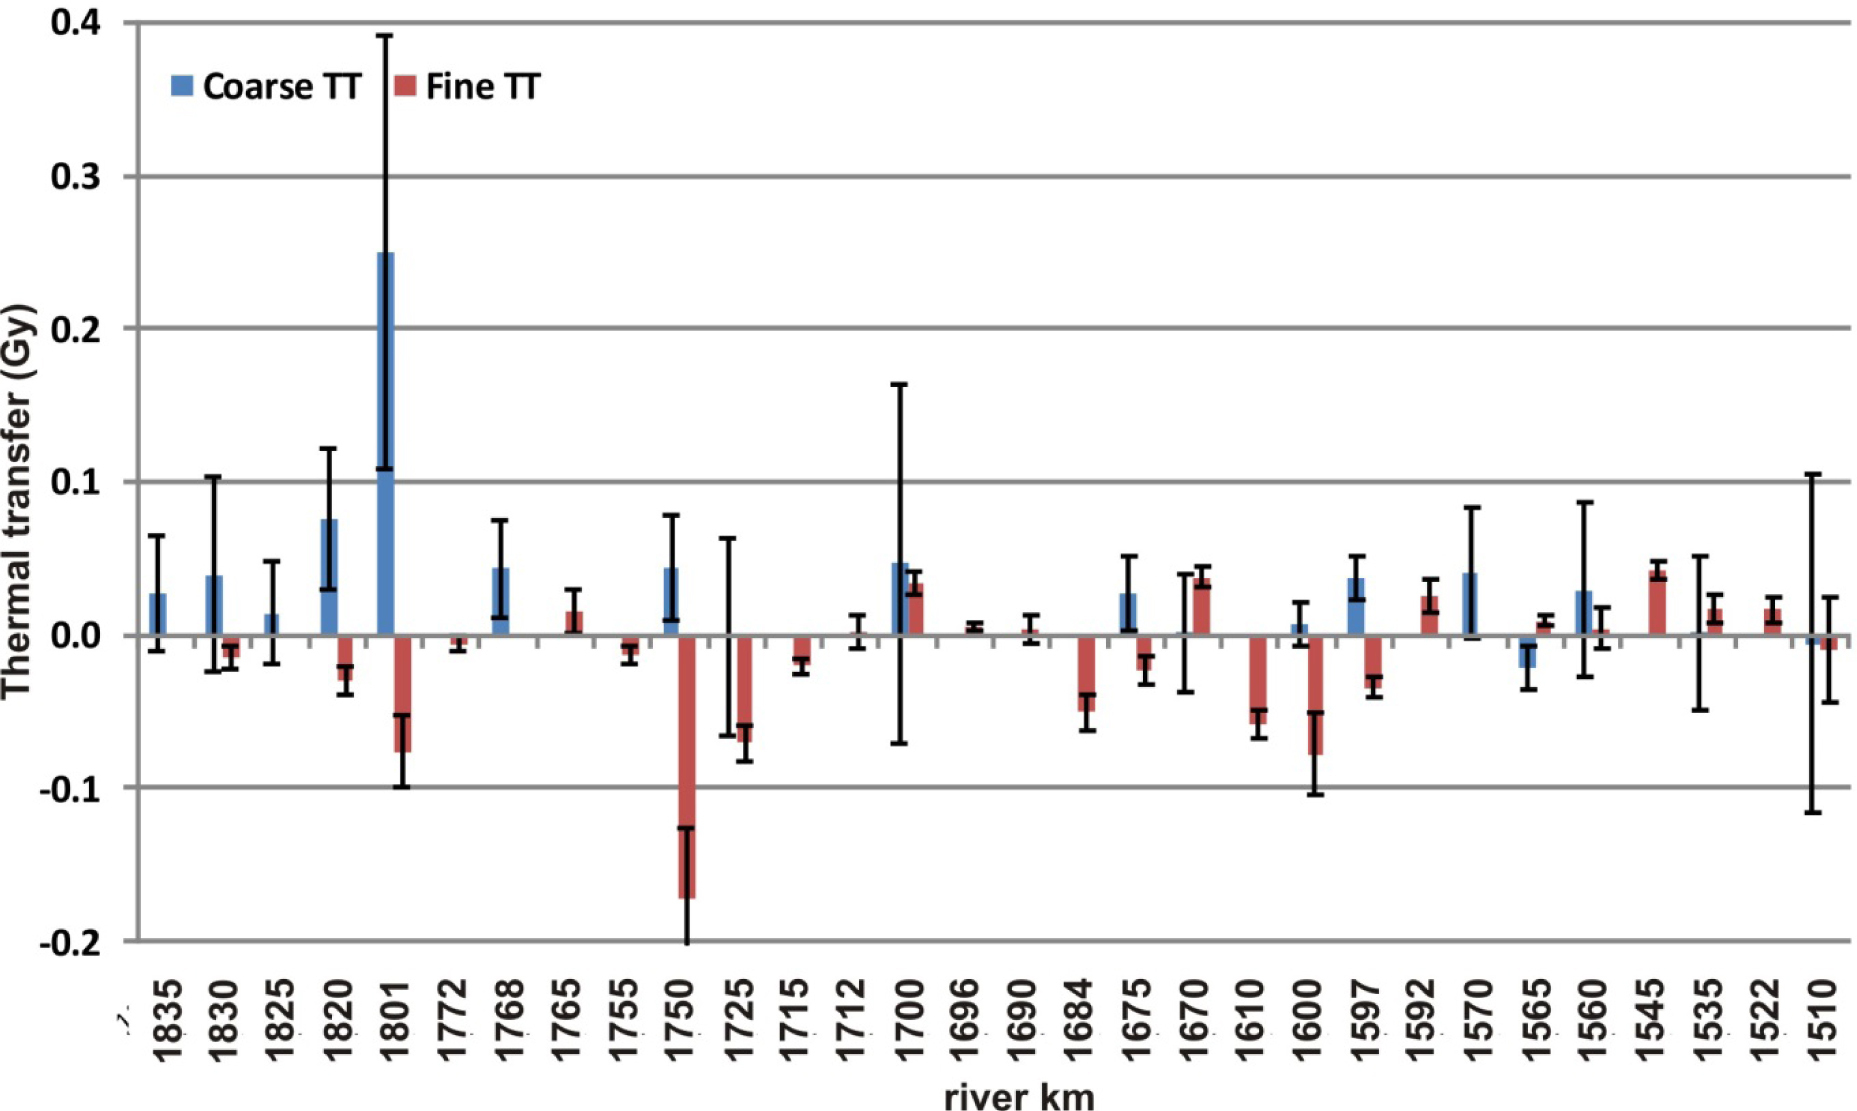
Finally, all coarse and fine grain samples were tested for TT. Measurements were carried out without applying HB, using a 200°C and 160°C preheat and cutheat temperature, respectively. In general, the results of fine grain samples were lower (average: –0.02 ± 0.00 Gy; max: 0.04 ± 0.01 Gy) than those of coarse grains (average: 0.04 ± 0.00 Gy; max: 0.25 ± 0.14 Gy).
There is no obvious trend or pattern, if sample TT results are plotted on the longitudinal section of the river (Fig. 5). Values are usually low with some outstanding peaks, but these cannot be related to any of the tributaries or morphological change of the Danube itself. Accordingly, the mineralogical characteristics of quartz should be fairly uniform along the investigated section. As a matter of the low values experienced above, it seems that TT correction during routine De measurements is not necessary, and Danube sediments perform in this respect well on the investigated section. The level of TT in the present study is very close to that of Jaiswal et al. (2009) and Truelsen and Wallinga (2003).
Residual doses
Following tests on TT, Dres was determined for each coarse and fine grain sample. In case the value of TT was positive Dres was calculated by subtracting the TT dose from the measured De (Table 2). The corrected results were considered as the apparent Dres of samples.
Table 2
Equivalent dose, thermal transfer and corrected residual dose of the investigated modern samples.
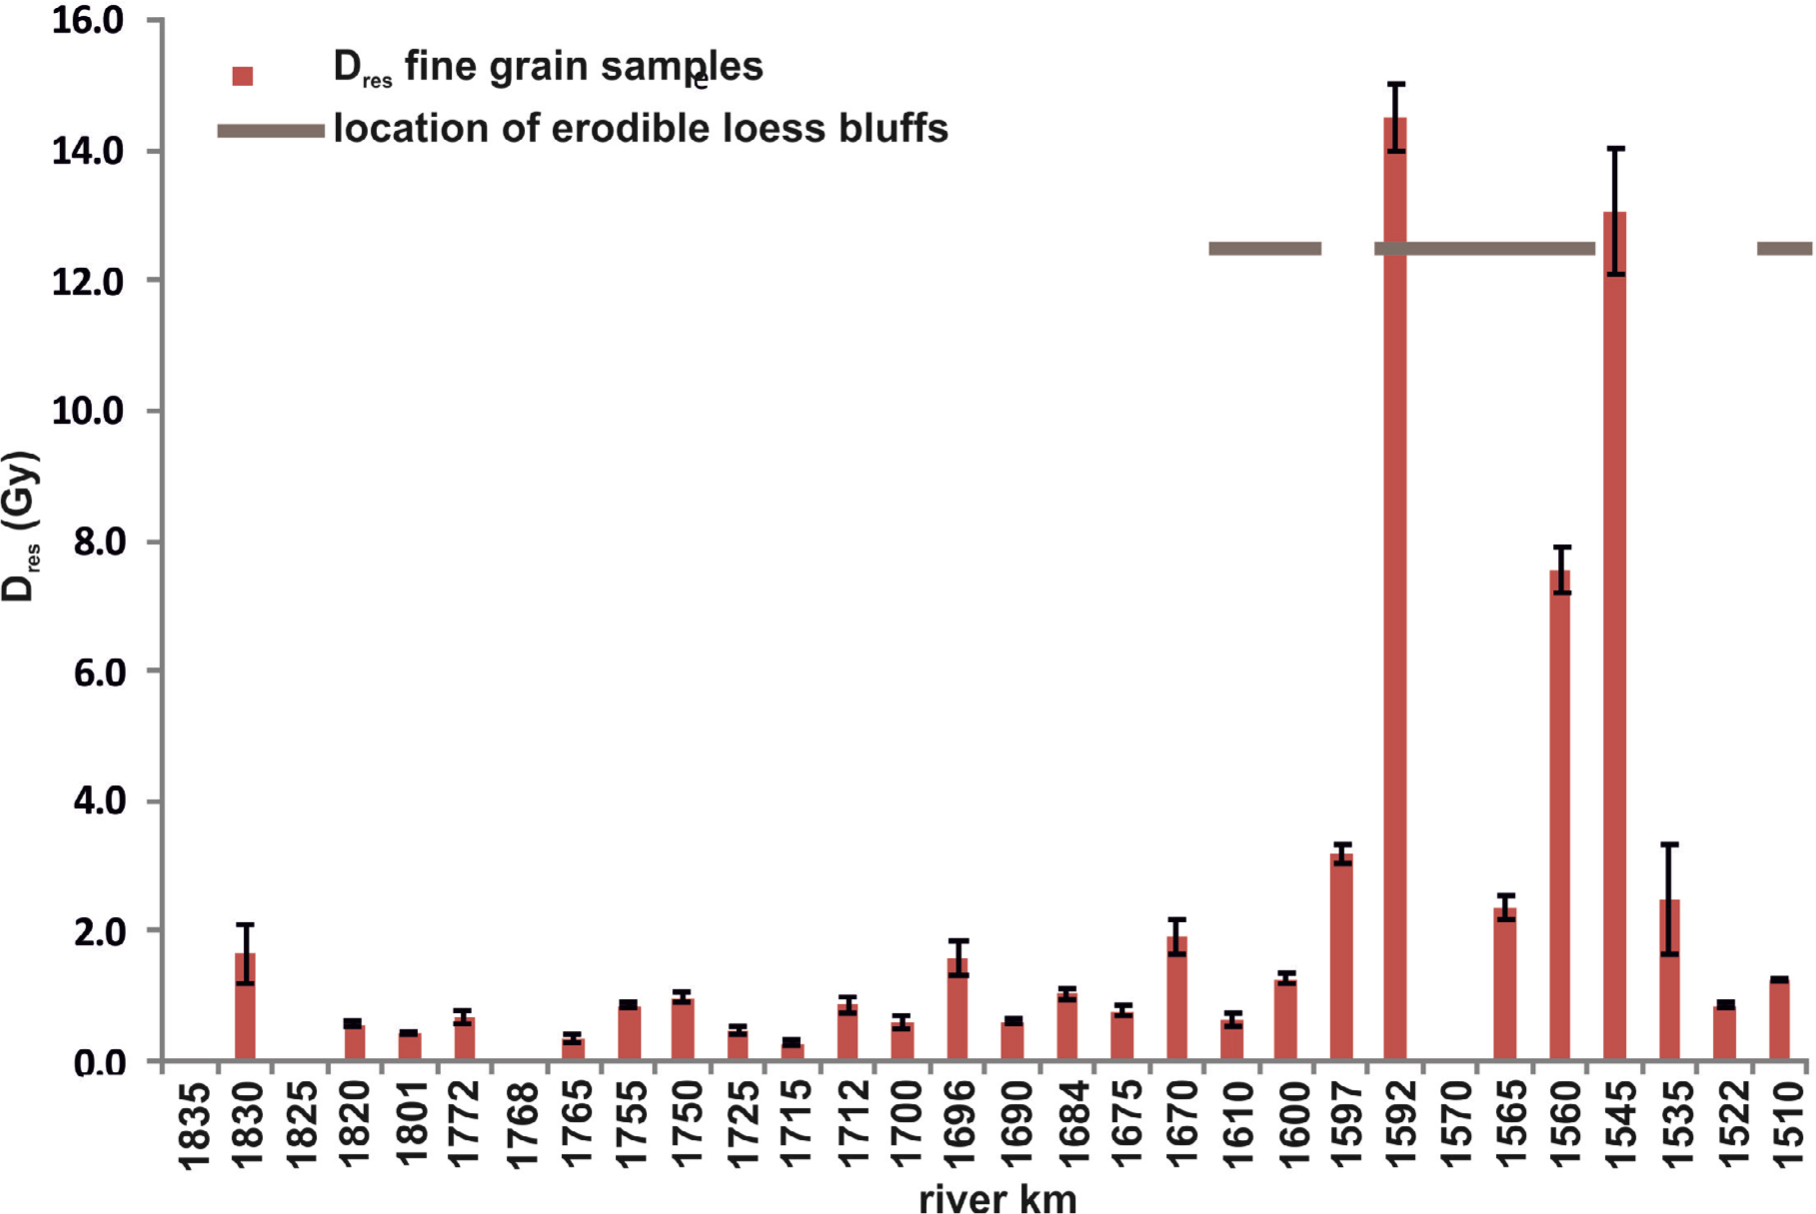
Concerning coarse grain samples mean and maximum Dres was 0.10 ± 0.01 Gy and 0.56 ± 0.17 Gy, respectively, whereas in case of fine grain samples the mean and maximum reached 2.34 ± 0.72 Gy and 14.50 ± 0.52 Gy. Consequently, Dres was almost negligible in case of coarse grain samples equaling to a 60–120 y age overestimation if usual 1.0–2.0 Gy/ky dose rates are considered. As it was shown in numerous previous studies Dres of fine grain samples is considerably higher, leading to an average 1.2–2.3 ky age overestimation (Table 2).
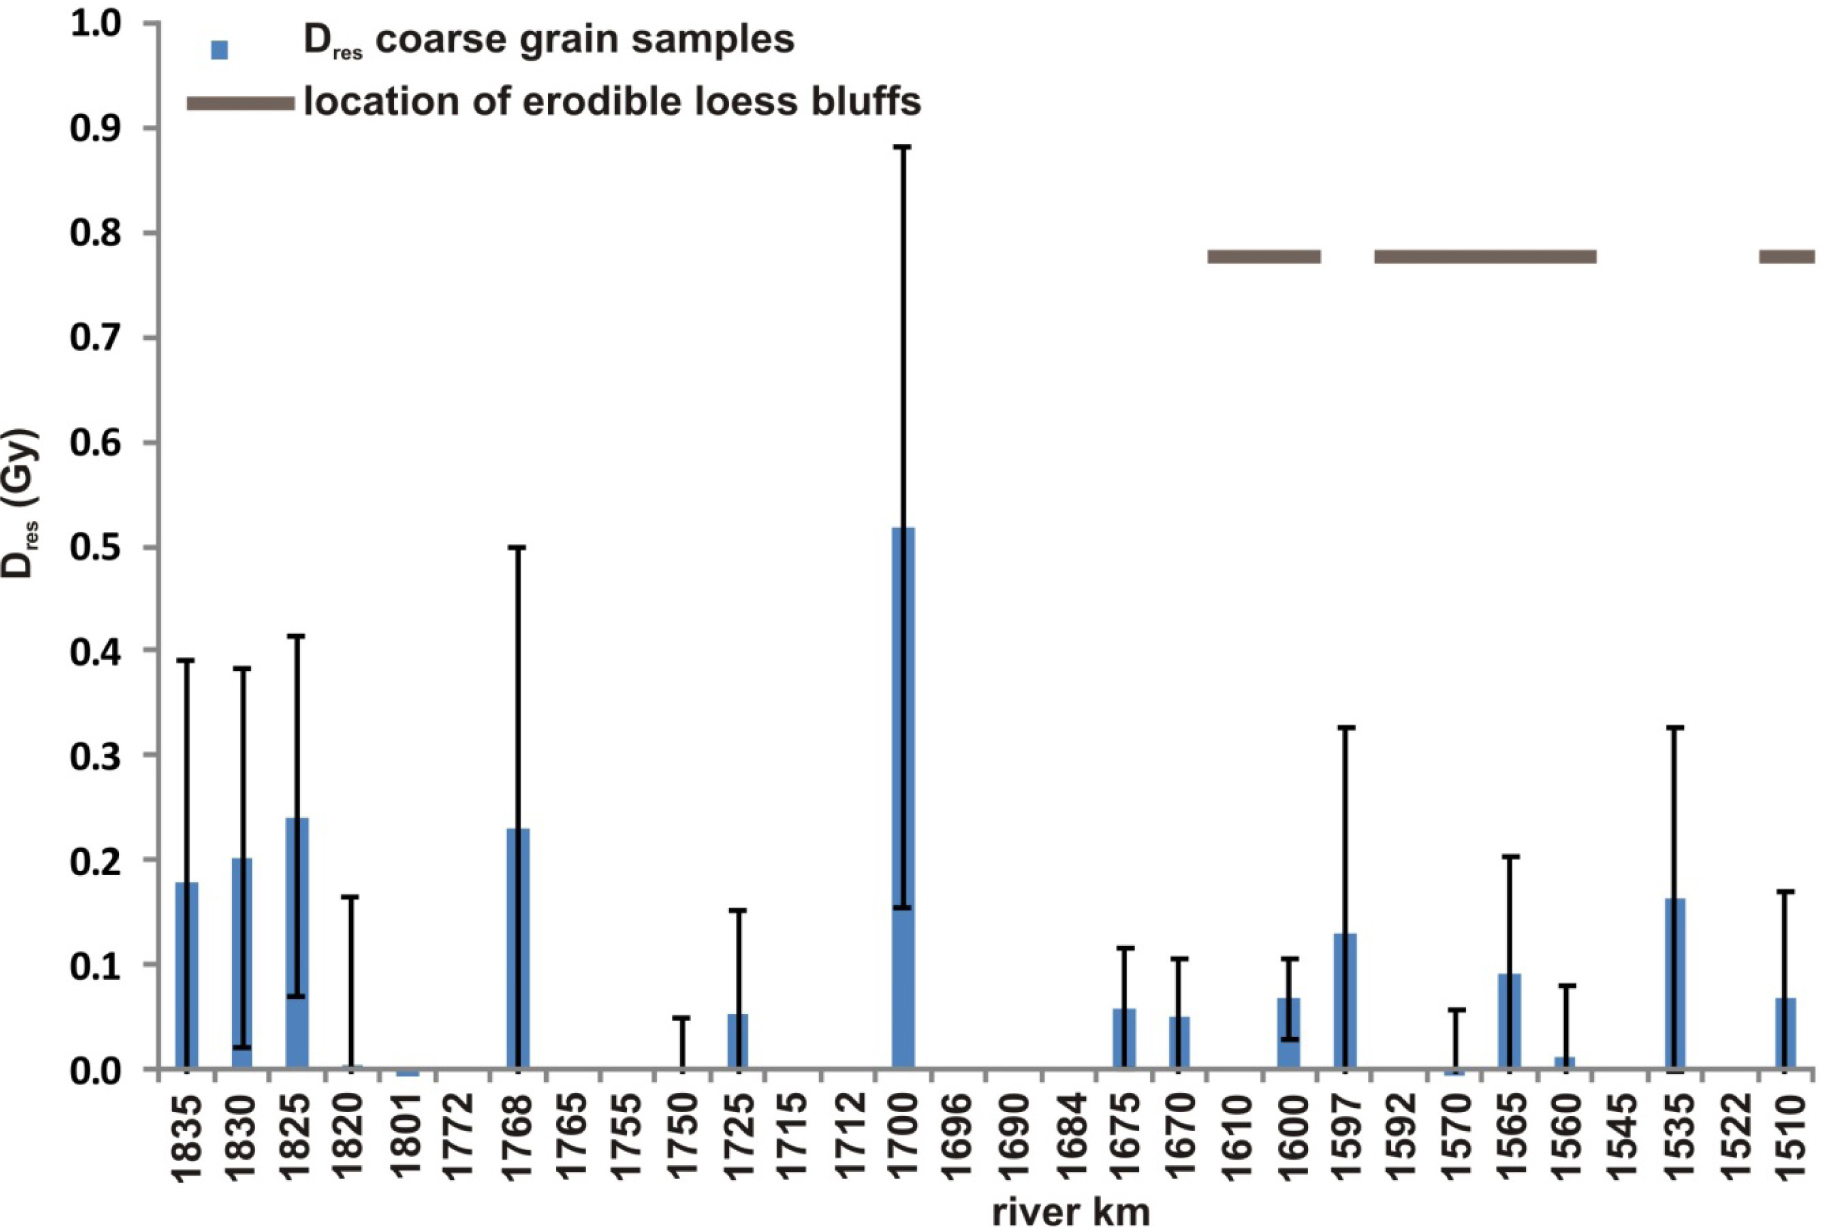
If results are considered longitudinally along the investigated section of the river, coarse grain values do not exhibit any spatial tendencies or patterns. There is one outstanding value, but it cannot be related to any change in morphology or fluvial dynamics. On the contrary, in terms of fine grain samples a sharp increase can be observed on the downstream half of the studied Danube reach. The increasing tendency starts upstream of Budapest, where the river has an incising character. The greatest values (14.5 ± 0.5 and 13.1 ± 1.0 Gy) appear however more downstream at sampling points D23 and D27. Further on, the values decrease again. This refers to a local but significant disturbance in fine grain Dres values (Fig. 6). The clearly identifiable phenomenon is apparent at locations downstream of erodible loess bluffs along the right bank of the river (Fig. 8). It is suggested therefore that Pleistocene sediments transferred to the Danube as a consequence of flood-time fluvial erosion and almost continuous mass movements can significantly contribute to residual doses. The above finding is also supported by the fact that coarse grain Dres values do not show any increase at these sites, thus very likely the source of Dres disturbance is loess. The gradual decrease of fine grain Dres values downstream of the erosional section also shows how bleaching affects the fine grain suspended load of the river, as such, in 20 km the level of Dres drops to similar values as on the upstream half of the investigated Danube reach (Fig. 7).
Fig. 6
The residual dose in modern coarse grain sediments along the investigated river reach of the Danube.
. Conclusion
In the present study, the contribution of thermal transfer and incomplete bleaching to equivalent doses measured in terms of modern fluvial samples was investigated. Tests on both coarse and fine grain sediments proved that as a matter of TT, the virtual equivalent dose of Danube sediments increases considerably if preheat temperature is set above 200°C. Fine grain samples exhibited a more uniform pattern of TT at different preheat temperatures, whereas coarse grain samples showed a higher variability. Although the use of a HB decreases the scatter of recovered doses, it also introduces a considerable degree of TT, which differs from sample to sample. Therefore, the w/oHB SAR protocol is advised to be used in subsequent studies processing Hungarian Danube sediments. In general, the TT of samples was not considerable, and correction seems to be necessary only in case of modern and few centuries old sediments. Concerning coarse grain young sediments therefore a 0.04 ± 0.00 Gy TT correction value is suggested on the basis of the present study.
Bleaching of medium sand sized coarse grain sediments is fairly complete along the investigated river reach, consequently the mean and standard error of Dres is 0.10 ± 0.01 Gy. Therefore, it is suggested that regarding younger sediment deposits from the investigated area De results should be corrected by this value. Besides, in terms of Danube related palaeo-sediments the effect of incomplete bleaching on the measured De seems to be of low significance if a proper statistical treatment is applied, however the depositional environment might cause some differences which should be investigated further in the future.
As expected, concerning fine grain sediments incomplete bleaching can be considerable, the mean and standard error of fine grain Dres along the studied section of the river is 2.34 ± 0.72 Gy. The longitudinal pattern of values shows a great contrast, implying that on the lower reaches this fraction cannot be applied safely for palaeo-sediments in the usual age range of fine grain quartz OSL dating. However, on the upstream part of the studied section in depositional environments where no sand is available fine grains can be an alternative over the age range of several thousands of years, however, Dres must be considered and the mean value received here (0.85 ± 0.12 Gy) must be indicated.
The longitudinal distribution of Dres in case of coarse grain modern sediments showed no clear pattern or tendency, however, regarding fine grain sediments an unambiguous increase was revealed at sections where the Danube is passing loess bluffs. This way it is suggested that fine grain Dres can be an indicator of modern day erosional activity.