
ABSTRACT:
The goal of the present study was to assess the economic viability relating to the risk of replacing corn with pearl millet in diets with 80% concentration for feedlot cattle confined for 89 days. Replacement levels were: 0, 33, 66, and 100%. The risk was estimated using Monte Carlo simulation, Spearman’s rank correlation test between input variables, stochastic dominance, and analysis of sensitivity. The expected average values ± standard deviation for net present value (R$/animal) were ± 71.74 ± 283.32, 91.23 ± 285.18, 196.05 ± 273.79, and 223.80 ± 267.96 for diets containing 0, 33, 66, and 100% of pearl millet, respectively. The probability of ≥0 net present value was 63.4, 66.1, 78.4, and 82.4%, respectively. The net present values were statistically different (P<0.05), and the higher levels dominated the lower values. The items that most influenced the net present values were, in descending order, prices of unfinished and finished cattle, initial and final weights, prices of concentrate and forage, concentrate and forage consumption. Based on the results of the simulation, diet of 100% pearl millet exhibited the best economic viability.
Key words:
investment analysis; probabilistic analysis; stochastic method; correlation of classification
RESUMO:
O objetivo do estudo foi avaliar a viabilidade econômica relacionada ao risco da substituição de milho por milheto em dietas com 80% de concentrado no confinamento de bovinos por 89 dias. Os níveis de substituição foram: 0, 33, 66 e 100%. O risco foi estimado usando simulação de Monte Carlo, correlação de Spearman entre as variáveis de entrada, dominância estocástica e análise de sensibilidade. Os valores médios esperados ± desvio padrão para o valor presente líquido (R$/animal) foram de ± 71,74 ± 283,32, 91,23 ± 285,18, 196,05 ± 273,79 e 223,80 ± 267,96 para dietas contendo 0, 33, 66 e 100% de milheto, respectivamente. A probabilidade de valor presente líquido ≥0 foi de 63,4, 66,1, 78,4 e 82,4%, respectivamente. Os valores presentes líquidos foram estatisticamente diferentes (p<0,05), e os níveis mais elevados dominaram os valores mais baixos. Os itens que mais influenciaram os valores presentes líquidos foram, em ordem decrescente, os preços de bovinos não terminados e acabados, pesos inicial e final, preços de concentrado e forragem, consumo de concentrado e forragem. Com base nos resultados da simulação, a dieta de 100% de milheto mostrou a melhor viabilidade econômica.
Palavras-chave:
análise de investimento; análise probabilística; método estocástico; correlação de classificação.
INTRODUCTION:
Alternative ingredients to corn (Zea mays) and sorghum are commonly used in cattle feedlots as concentrate components for diets. The use of pearl millet (Pennisetum glaucum) is an interesting alternative, considering its low cost in comparison with corn.
Among the crops used in succession to annual crops, pearl millet is one of the most important in the central-west and north regions of Brazil. It is usually seeded after the soybean cultivation and can be used for grazing and production of haystack, to produce grains for replacing corn crops (with higher risk during the interim-harvest), and/or for producing silage (BERGAMASCHINE et al., 2011).
Studies have demonstrated that animal performance was similar in cattle fed pearl millet (HILL et al., 1996HILL, G. M. et al. Digestibility and utilization of pearl pearl millet diets fed to finishing beef cattle. Journal Animal Science, v.74, n.7, p.1728-1735, 1996. Available from: <Available from: http://bit.ly/369DsDQ
>. Accessed: Dec. 09, 2019. doi: 10.2527/1996.7471728x.
http://bit.ly/369DsDQ...
; GONÇALVES et al., 2010GONÇALVES, J. R. S. et al. Replacement of corn grain by pearl millet grain in diets containing corn or elephant grass silage fed beef cattle. Revista Brasileira Zootecnia, v.39, n.9, p.2032-2039, 2010. Available from: <Available from: http://bit.ly/36fmjbN
>. Accessed: Dec. 05, 2019. doi: 10.1590/S1516-35982010000900023.
http://bit.ly/36fmjbN...
; SILVA et al., 2014SILVA, R. M. et al. Características físico-químicas da carne de tourinhos zebuínos e europeus alimentados com níveis de grão de milheto na dieta. Ciência Animal Brasileira, v.15, p.20-31, 2014. Available from: <Available from: http://bit.ly/36dlErj
>. Accessed: Dec. 30, 2019. doi: 10.5216/cab.v15i1.25777.
http://bit.ly/36dlErj...
), even without compromising the characteristics of carcasses and meat (SILVA et al., 2015SILVA, R. M. et al. Características de carcaça e carne de novilhos de diferentes predominâncias genéticas alimentados com dietas contendo níveis de substituição do grão de milho pelo grão de milheto. Semina: Ciências Agrárias, v.36, p.943-959, 2015. Available from: <Available from: http://bit.ly/2ZHjRZ7
>. Accessed: Dec. 30, 2019. doi: 10.5433/1679-0359.2015v36n2p943.
http://bit.ly/2ZHjRZ7...
), when compared with diets containing corn.
However, SILVA et al. (2014SILVA, R. M. et al. Características físico-químicas da carne de tourinhos zebuínos e europeus alimentados com níveis de grão de milheto na dieta. Ciência Animal Brasileira, v.15, p.20-31, 2014. Available from: <Available from: http://bit.ly/36dlErj
>. Accessed: Dec. 30, 2019. doi: 10.5216/cab.v15i1.25777.
http://bit.ly/36dlErj...
) affirmed that pearl millet, despite its great potential for feeding ruminants, has been relatively little studied as a diet for beef cattle and, in addition, it has been used for diets with low concentrate contents.
Taking into consideration that the economic aspects involving the use of pearl millet in the diet of cattle have been less explored by the scientific community, the present study proposed the use of the Monte Carlo simulation technique (economic risk analysis) to assess whether replacing corn grains with pearl millet grains interfered with the economic viability of feedlot cattle.
MATERIALS AND METHODS:
The confinement was carried out in the Livestock Sector of the Technological Department of the Agroindustrial Cooperative for Rural Producers of Southwest Goiás (COMIGO), Rio Verde, State of Goiás, Brazil (17°46’22” S - 51°02’86” W), located at 815 meters above sea level. According to Köppen classification (ALVAREZ et al., 2014), the region has tropical savanna-type climate (Aw’), with rainfall concentrated in summer (October to April) and a dry season in winter (May to September). Data analysis and stochastic simulations were carried out at the Federal University of Santa Maria, State of Rio Grande do Sul, Brazil.
Economic viability was assessed using the probabilistic method via Monte Carlo simulation, replacing grinded corn grains with grinded pearl millet grains for the diet of feedlot calves with four content levels: 0, 33, 66, and 100%.
Details of the experimental procedure during the feeding phase to obtain zootechnical performance data have been previously described in the study conducted by SILVA et al. (2014SILVA, R. M. et al. Características físico-químicas da carne de tourinhos zebuínos e europeus alimentados com níveis de grão de milheto na dieta. Ciência Animal Brasileira, v.15, p.20-31, 2014. Available from: <Available from: http://bit.ly/36dlErj
>. Accessed: Dec. 30, 2019. doi: 10.5216/cab.v15i1.25777.
http://bit.ly/36dlErj...
). We used 89 non-castrated calves (European/zebu crossbreed cattle), of which 45 had predominance of European-zebu genotypes and 44 had predominance of zebu genotypes. The average initial weights were 318 and 321 kg, respectively. The average initial age was 21 months for both genotypes. The experimental design used was completely randomized with four replications.
At the beginning of the feeding period, the animals were identified, vaccinated, treated against endo-and ectoparasites, and allocated in 16 collective pens (10 x 7.70 m). The drinkers were equipped with float ball valves, concrete feeders, and gravel floor with a 5% slope. Four pens were used for each treatment. The animals were weighted individually after fasting for solids from 14 to 16 hours. The adaptation period was of seven days, and the feeding period lasted 89 days, totaling 96-day confinement. The proportion of ingredients in the diet and the performance characteristics of the animals are shown in table 1.
The methodologies of MATSUNAGA et al., (1976), RESENDE FILHO et al., (2001) and PACHECO et al., (2014bPACHECO, P. S. et al. Use of the correlation between input variables in estimating the risk of feedlot finishing of steers and young steers. Anais da Academia Brasileira de Ciências, v.86, p.945-954, 2014b. Available from: <Available from: http://bit.ly/37jIa1Y
>. Accessed: Dec. 14, 2019. doi: 10.1590/0001-37652014110012.
http://bit.ly/37jIa1Y...
) were used to estimate costs and revenues for each animal, where: Total Cost represented the sum of depreciations (facilities, machinery, implements and equipment), purchase of the ‘thin’ animal, sanitary control, feeding (roughage and concentrate), labor and other operational expenses. Gross revenue consisted in the sale of the fat animal. Facilities (estimated for fixed capacity of 1,000 animals), machinery, implements and equipments depreciation were calculated for a planning horizon of one year. To calculate the production costs of corn silage, the yield of 45 tons of green matter/ha and DM content of 33% was considered. Details on the items that comprise the costs of silage making are included in PACHECO et al. (2006). For cost estimates of labor, was considered 1 man hired/300 feedlot cattle and three minimum wages/month/1,000 animals for technical assistance. Other operational expenses such as maintenance of facilities, machinery, implements and equipment, fuel, electricity, freight, taxes and meals for workers/human resources were estimated for the equivalent of 2.5% of operating costs. The risk assessment considered the methods of stochastic simulation, stochastic dominance and sensitivity, with the aid of Microsoft Excel®, @Risk® and SAS System® softwares. Initially the cost items of each year were deflated by the IGP-FGV (General Price Index Fundação Getulio Vargas - Anualpec 2016ANUALPEC 2016. Anuário da pecuária brasileira, Informa Economics FNP, São Paulo, SP, Brasil, 272p.) for the year of 2015. Afterwards the type of probability distribution (Anderson-Darling statistic) of the following cost items, revenue and performance variables of the animals were determined: thin and fat cattle (R$/kg), minimum wage (R$/month), roughage (R$/kg DM), concentrate (R$/kg DM), facilities/equipment (R$/animal/day), machinery/ implements (R$/animal/day), health/vaccine (R$/ dose), health/deworming (R$/mL), initial and final weights (kg), average daily weight gain (kg), total weight gain (kg), roughage and concentrate intake (kg DM/day) and minimum rate of attractiveness (% per month).
Items used to estimate costs and revenues were obtained from 11 consecutive years of quotes (between 2005 and 2015). Costs of the facilities were estimated for a static capacity of 1,000 animals, with useful life of 10 years. Details of the estimation of depreciation, sanitary control, feeding cost, labor cost, and other operating expenses were previously described by PACHECO et al., (2014bPACHECO, P. S. et al. Use of the correlation between input variables in estimating the risk of feedlot finishing of steers and young steers. Anais da Academia Brasileira de Ciências, v.86, p.945-954, 2014b. Available from: <Available from: http://bit.ly/37jIa1Y
>. Accessed: Dec. 14, 2019. doi: 10.1590/0001-37652014110012.
http://bit.ly/37jIa1Y...
).
The net present value (NPV, R$/animal) was used as a financial indicator. The NPV is one of the most commonly used indicators to evaluate capital investment proposals, according to the definition by SOUZA & CLEMENTE (2009SOUZA, A.; CLEMENTE, A. Decisões financeiras e análise de investimentos: fundamentos, técnicas e aplicações. 6. ed. São Paulo: Atlas, 2009.). Its estimation method is considered the most well-known and widely used robust investment analysis technique and, as its name implies, is the concentration of all expected values of a cash flow on date zero using the TMA. This indicator reflects the return on monetary values of the investment measured by the difference between the present value of cash inflows and the present value of cash outflows, subject to a certain discount rate (KASSAI et al., 2007KASSAI, J. R. et al. Retorno de investimento: Abordagens matemática e contábil do lucro empresarial. 3. ed. São Paulo: Editora Atlas S.A., 2007.). According to SOUZA & CLEMENTE (2009SOUZA, A.; CLEMENTE, A. Decisões financeiras e análise de investimentos: fundamentos, técnicas e aplicações. 6. ed. São Paulo: Atlas, 2009.), NPV can provide basically three answers to the investor: being less than zero indicates that the investment is not viable; being zero indicates that the initial investment was recovered and the remuneration was equal to the application in TMA; and if the indicator is positive, it shows the surplus obtained by the return on investment, in addition to the initial cost and TMA.
The NPV was calculated by the equation , where n is the number of months, i is the n-th time period in which the money is invested in the project, TMA is the minimum acceptable rate of return, and FC represents the net revenue of each i-th period. Independent investment projects with one-year planning were considered fort the cash flow (prepared with a planning horizon of one year (RESENDE FILHO et al., 2001)) of each concentrate level. TMA was incorporated in the estimate of the NPV considering a triangular distribution with a minimum value of 5%, most likely 9% and 14% maximum value.
In the simulation of the NPV, Latin Hypercube sampling was used, random generator number Mersenne Twister, with 2000 interactions, according ALBRIGHT et al., (2010ALBRIGHT, S. C. et al. Data analysis and decision making. 4.ed. Mason: South-Western Cengage Learning, 2010. 1080p.), PALISADE 2010. For each content of pearl millet, this analysis was performed either with the Spearman correlation between the cost items that had their probability distribution determined (input variables) (Tables 3 and 4).
The NPV simulations included probability distributions for all cost and revenue items, as well as for animal performance indicators. We used the simulation method with Latin hypercube sampling (MCKAY et al., 1979MCKAY, M. D. et al. A Comparison of three methods for selecting values of input variables in the analysis of output from a computer code. Technometrics, v.21, n.2, p.239-245, 1979. Available from: <Available from: http://bit.ly/357PJY8
>. Accessed: Dec. 14, 2019. doi: 10.1080/00401706.1979.10489755.
http://bit.ly/357PJY8...
; IMAN et al., 1981IMAN, R. L. et al. An approach to sensitivity analysis of computer models, Part 1. Introduction, input variable selection and preliminary variable assessment. Journal of quality technology, v.13, n.3, p.174-183, 1981. Available from: <Available from: http://bit.ly/2ZEFFEQ
>. Accessed: Dec. 09, 2019. doi: 10.1080/00224065.1981.11978748.
http://bit.ly/2ZEFFEQ...
) and Mersenne twister random number generator (MATSUMOTO & NISHIMURA, 1998MATSUMOTO, M.; NISHIMURA, T. Mersenne twister: a 623-dimensionally equidistributed uniform pseudo-random number generator. ACM Transactions on Modeling and Computer Simulation, v.8, n.1, p.3-30, 1998. Available from: <Available from: http://bit.ly/2QBdgLH
>. Accessed: Dec. 14, 2019. doi: 10.1145/272991.272995.
http://bit.ly/2QBdgLH...
) with 2,000 interactions. Spearman’s rank correlation coefficient was used to determine the associations between the input variables. All estimates were calculated per animal/year, monetarily corrected for 2015 by the general price index (internal availability calculated by Getúlio Vargas Foundation).
Microsoft® Excel (Redmond, WA, USA), @ Risk® (Ithaca, NY, USA), and SAS® Studio (Cary, NC, USA) software programs were used to carry out risk assessments, following the methods described by Albright et al. (2010ALBRIGHT, S. C. et al. Data analysis and decision making. 4.ed. Mason: South-Western Cengage Learning, 2010. 1080p.) and Pacheco et al. (2014bPACHECO, P. S. et al. Use of the correlation between input variables in estimating the risk of feedlot finishing of steers and young steers. Anais da Academia Brasileira de Ciências, v.86, p.945-954, 2014b. Available from: <Available from: http://bit.ly/37jIa1Y
>. Accessed: Dec. 14, 2019. doi: 10.1590/0001-37652014110012.
http://bit.ly/37jIa1Y...
). The definitions of probability distribution (considering Anderson-Darling test) for the items of cost, revenue, and animal performance, and Spearman’s correlations between the input variables and statistics of variability are presented in tables 2, 3, 4, and 5.
Spearman’s rank correlation coefficients of costs, revenue, and zootechnical performance for 0% (below the diagonal) and 33% (above the diagonal) of pearl millet.
Spearman’s rank correlation coefficients of cost, revenue, and zootechnical performance for 66% (below the diagonal) and 100% (above the diagonal) of pearl millet.
Variability statistics of input variables and descriptive statistics for simulated net present value (R$/animal), for all levels of pearl millet.
We used the stochastic dominance analysis to compare the pairs of cumulative probability distribution of NPV simulated for different levels of concentrate according to the first-and second-order criteria (HADAR & RUSSELL, 1969HADAR, J.; RUSSELL, W. R. Rules for ordering uncertain prospects. The American Economic Review, v.59, n.1, p.25-34, 1969. Available from: <Available from: https://www.jstor.org/stable/1811090
>. Accessed: Dec. 09, 2019.
https://www.jstor.org/stable/1811090...
; HANOCH & LEVY, 1969HANOCH, J.; LEVY, H. The efficiency analysis of choices involving risk. The American Economic Review, v.74, p.335-346, 1969. Available from: <Available from: http://bit.ly/2MEGPen
>. Accessed: Dec. 09, 2019. doi: 10.1016/B978-0-12-780850-5.50015-0.
http://bit.ly/2MEGPen...
). In the criterion of stochastic dominance of first order, there are selected investments for investors who prefer a higher return investment, and the stochastic dominance of second-order, are selected investments for investors who prefer a higher return and either are averse to the risk. Significant differences were found using Kolmogorov-Smirnov test (CONOVER, 1999CONOVER, W. J. Practical nonparametric statistics. 3.ed. New York: John Wiley and Sons, 1999. 592p.), using software SAS® University Edition.
For the analysis of sensitivity, we used stepwise multivariate multiple regression with standardized regression coefficients (ALBRIGHT et al., 2010ALBRIGHT, S. C. et al. Data analysis and decision making. 4.ed. Mason: South-Western Cengage Learning, 2010. 1080p.; PALISADE, 2010PALISADE RISK SOFTWARE - @RISK. Risk analysis and simulation add-in for Microsoft® Excel. Ithaca: Palisade, 2010. 739p.). Standardized multivariate regression coefficients indicate the number of NPV standard deviations that will change with each change of one standard deviation in the input variables, considering that the other input variables remain constant (ALBRIGHT et al., 2010).
In figure 1, the flowchart illustrates the steps taken during the deterministic and probabilistic phases of the adopted methodology.

RESULTS AND DISCUSSION:
Monte Carlo simulation technique is considered of great value in decision making, mostly used in administration, management, and economics (ALBRIGHT et al., 2010ALBRIGHT, S. C. et al. Data analysis and decision making. 4.ed. Mason: South-Western Cengage Learning, 2010. 1080p.). However, studies using this method have been recently oriented to the field of agribusiness (PACHECO et al., 2014aPACHECO, P. S. et al. Risk assessment of finishing beef cattle in feedlot: slaughter weights and correlation amongst input variables. Revista Brasileira de Zootecnia, v.43, p.92-99, 2014a. Available from: <Available from: http://bit.ly/2u9uEjl
>. Accessed: Dec. 14, 2019. doi: 10.1590/S1516-35982014000200007.
http://bit.ly/2u9uEjl...
, 2014bPACHECO, P. S. et al. Use of the correlation between input variables in estimating the risk of feedlot finishing of steers and young steers. Anais da Academia Brasileira de Ciências, v.86, p.945-954, 2014b. Available from: <Available from: http://bit.ly/37jIa1Y
>. Accessed: Dec. 14, 2019. doi: 10.1590/0001-37652014110012.
http://bit.ly/37jIa1Y...
, 2017PACHECO, P. S. et al. Use of the correlation between input variables in estimating the risk of feedlot finishing of steers and young steers. Anais da Academia Brasileira de Ciências, v.86, p.945-954, 2014b. Available from: <Available from: http://bit.ly/37jIa1Y
>. Accessed: Dec. 14, 2019. doi: 10.1590/0001-37652014110012.
http://bit.ly/37jIa1Y...
).
Specifically, about feedlot beef cattle, ROSA et al., (2017ROSA, J. R. P. et al. Risk analysis of the economic viability of feedlot aberdeen angus steers fed with different proportions of concentrate. Bioscience Journal, v.33, n.3, p.660-669, 2017. Available from: <Available from: http://bit.ly/39pbmXr
>. Accessed: Dec. 30, 2019. doi: 10.14393/BJ-v33n3-34547.
http://bit.ly/39pbmXr...
) and SILVA et al., (2017SILVA, R. M. et al. Stochastic simulation of the economic viability of feedlot steers fed with different proportions of concentrate. Bioscience Journal, v.33, n.1, 2017. Available from: <Available from: http://bit.ly/2u0AX8C
>. Accessed: Dec. 30, 2019. doi: 10.14393/BJ-v33n1a2017-33608.
http://bit.ly/2u0AX8C...
) have used Monte Carlo simulation to assess the economic viability of using different concentrate levels in the diets. Conversely, PACHECO et al., (2014aPACHECO, P. S. et al. Risk assessment of finishing beef cattle in feedlot: slaughter weights and correlation amongst input variables. Revista Brasileira de Zootecnia, v.43, p.92-99, 2014a. Available from: <Available from: http://bit.ly/2u9uEjl
>. Accessed: Dec. 14, 2019. doi: 10.1590/S1516-35982014000200007.
http://bit.ly/2u9uEjl...
, 2017PACHECO, P. S. et al. Use of the correlation between input variables in estimating the risk of feedlot finishing of steers and young steers. Anais da Academia Brasileira de Ciências, v.86, p.945-954, 2014b. Available from: <Available from: http://bit.ly/37jIa1Y
>. Accessed: Dec. 14, 2019. doi: 10.1590/0001-37652014110012.
http://bit.ly/37jIa1Y...
) and FABRICIO et al., (2017FABRICIO, E. A. et al. Financial indicators to evaluate the economic performance of feedlot steers with different slaughter weights. Ciência Rural, v.47: 03, e20160516, 2017. Available from: <Available from: http://bit.ly/2MJyK7Y
>. Accessed: Dec. 05, 2019. doi: 10.1590/0103-8478cr20160516.
http://bit.ly/2MJyK7Y...
) have used this technique to assess different slaughter weights, and Pacheco et al. (2014b) to assess different categories of calves.
SILVA et al., (2017SILVA, R. M. et al. Stochastic simulation of the economic viability of feedlot steers fed with different proportions of concentrate. Bioscience Journal, v.33, n.1, 2017. Available from: <Available from: http://bit.ly/2u0AX8C
>. Accessed: Dec. 30, 2019. doi: 10.14393/BJ-v33n1a2017-33608.
http://bit.ly/2u0AX8C...
) stated that, from an economic point of view, studies involving stochastic simulation in livestock production systems are limited, specially with respect to the refinement of methods aimed to improve the quality of simulations results. ROSA et al., (2017ROSA, J. R. P. et al. Risk analysis of the economic viability of feedlot aberdeen angus steers fed with different proportions of concentrate. Bioscience Journal, v.33, n.3, p.660-669, 2017. Available from: <Available from: http://bit.ly/39pbmXr
>. Accessed: Dec. 30, 2019. doi: 10.14393/BJ-v33n3-34547.
http://bit.ly/39pbmXr...
) draw attention to the fact that feedlot beef cattle require high volume of financial resources at the beginning of the investment project implementation, which justifies the use of simulation techniques to help in decision making on the part of investors.
An important aspect of the present study is the fact of using high level of concentrate in the diets, representing the current reality of feedlots in Brazil, which has been demonstrated in studies conducted by MILLEN et al., (2009MILLEN, D. D. et al. A snapshot of management practices and nutritional recommendations used by feedlot nutritionists in Brazil. Journal Animal Science, v.87, p.3427-3439, 2009. Available from: <Available from: http://bit.ly/2Qzg9Nl
>. Accessed: Dec. 14, 2019. doi: 10.2527/jas.2009-1880.
http://bit.ly/2Qzg9Nl...
) and COSTA JUNIOR et al., (2013)COSTA JUNIOR, C. et al. Brazilian beef cattle feedlot manure management: a country survey. Journal Animal Science, v.91, n.4, p.1811-1818, 2013. Available from: <Available from: http://bit.ly/2MGoXja
>. Accessed: Dec. 05, 2019. doi: 10.2527/jas2012-5603.
http://bit.ly/2MGoXja...
, who applied questionnaires to nutritionists responsible for the development of diets for feedlot cattle in several Brazilian states.
Table 6 shows the positive expected values for NPV at all levels of replacement of corn with pearl millet (0 to 100%), increasing linearly from R$ 71.74 to R$ 223.80/animal, respectively.
Descriptive statistics for simulated net present value (R$/animal), according to the level of pearl millet.
The statistics of minimum and maximum values, standard deviation, and coefficients of variation allowed the quantification of the variability simulated for several scenarios, considering indicators of zootechnical performance, costs, and revenues at the same time. Although, the standard deviation was slightly reduced with increasing replacement level, it was observed that when expressed as a percentage of the average (coefficient of variation), there was linear increase from 25.3 to 83.5% and 0 to 100% of replacement, respectively.
With respect to the likelihood of NPV ≥0, representing the percentage of viability of an investment project, there was linear increment with increased percentage of replacement of corn with pearl millet in the diet, i.e., from 63.4% at 0% level to 82.4% at 100% level.
The graphical representation of the cumulative probability distribution of 2,000 simulated values of NPV for each replacement level is shown in figure 2. This plot showed the NPV (x-axis) in terms of cumulative probability (y-axis), enabling the visualization of simulated cumulative values above and below zero, i.e., probability of viability and loss, respectively. It can be observed that the curve to the right moved to 100% of pearl millet, thus representing greater occurrence of simulated values for NPV above zero.

Cumulative probability distribution in the simulation of net present value (NPV), according to the level of pearl millet.
In addition, the probability distributions of the simulated NPV for different levels of replacement of corn with pearl millet could be statistically compared in the present study using the Kolmogorov-Smirnov test, as shown in table 7.
As shown in table 6, the expected average NPV values showed optimistic results for the viability of feedlot technology, considering the high probability of losses reported in several studies cited by Pacheco et al. (2014aPACHECO, P. S. et al. Risk assessment of finishing beef cattle in feedlot: slaughter weights and correlation amongst input variables. Revista Brasileira de Zootecnia, v.43, p.92-99, 2014a. Available from: <Available from: http://bit.ly/2u9uEjl
>. Accessed: Dec. 14, 2019. doi: 10.1590/S1516-35982014000200007.
http://bit.ly/2u9uEjl...
, 2014bPACHECO, P. S. et al. Use of the correlation between input variables in estimating the risk of feedlot finishing of steers and young steers. Anais da Academia Brasileira de Ciências, v.86, p.945-954, 2014b. Available from: <Available from: http://bit.ly/37jIa1Y
>. Accessed: Dec. 14, 2019. doi: 10.1590/0001-37652014110012.
http://bit.ly/37jIa1Y...
, 2014cPACHECO, P. S. et al. Correlation and slaughter weight on sensitivity analysis of charolais steers feedlot finished. American International Journal Contemporary Research, v.4, p.28-34, 2014c. Available from: <Available from: http://bit.ly/2ZGIDIQ
>. Accessed: Dec. 14, 2019.
http://bit.ly/2ZGIDIQ...
, 2017PACHECO, P. S. et al. Stochastic simulation of the economic viability of feedlot finishing steers slaughtered at different weights in southern Brazil. Bioscience Journal, v.33, n.3, 2017. Available from: <Available from: http://bit.ly/35iBaBi
>. Accessed: Dec. 14, 2019. doi: 10.14393/BJ-v33n3-34110.
http://bit.ly/35iBaBi...
). It is worth mentioning the flexibility of the Monte Carlo simulation technique, which can estimate several alternatives applied in feedlots, as is the case of the present study replacing an energetic ingredient with other for the diets.
We did not find studies in the literature assessing the probability of economic viability in feedlot cattle fed pearl millet. However, there are reports with values for NPV ≥0 oscillating from 18.7% (PACHECO et al., 2017PACHECO, P. S. et al. Stochastic simulation of the economic viability of feedlot finishing steers slaughtered at different weights in southern Brazil. Bioscience Journal, v.33, n.3, 2017. Available from: <Available from: http://bit.ly/35iBaBi
>. Accessed: Dec. 14, 2019. doi: 10.14393/BJ-v33n3-34110.
http://bit.ly/35iBaBi...
) to 80.4% (PACHECO et al., 2014bPACHECO, P. S. et al. Use of the correlation between input variables in estimating the risk of feedlot finishing of steers and young steers. Anais da Academia Brasileira de Ciências, v.86, p.945-954, 2014b. Available from: <Available from: http://bit.ly/37jIa1Y
>. Accessed: Dec. 14, 2019. doi: 10.1590/0001-37652014110012.
http://bit.ly/37jIa1Y...
), which demonstrates the possible extent according to the technology used, time of year for marketing, race, age, sex, initial weight, slaughter weight, concentrate level, Brazilian states, etc.
The present study demonstrated the great alternative that pearl millet represents in place of corn relating to zootechnical performance (Table 1) and, especially, economic viability (Table 6).
According to Kolmogorov-Smirnov test, it was observed that the differences in simulated NPVs were significant (P<0.05) in all pairs of pearl millet levels. In this way, as the level of replacement increased, there was a correspondingly significant higher NPV.
All the probability distribution curves were classified as first-order stochastic dominance, i.e., characterizing investors who preferred investment projects with higher returns. In addition, higher levels of replacement dominated lower levels in all comparisons of distribution pairs. In this way, it was possible to observe that 100% replacement of corn with pearl millet was the best investment project, because, statistically, it promoted the highest return in comparison to other replacement levels.
The last method of quantification of the risk involved in the economic viability presented in the present study was the probabilistic sensitivity analysis using standardized regression coefficients (Figure 3). This method allowed the comparison of inputs with different units of measurement.
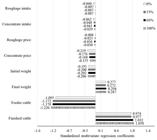
Standardized multivariate regression coefficients of the most relevant variables influencing the simulated net present values, according to the level of pearl millet.
The most important items that influenced the financial indicator (NPV) were, in descending order, the prices of unfinished and finished cattle, final weight, initial weight, price of concentrate, price of forage, concentrate consumption, and forage consumption.
With respect to the prices of unfinished and finished cattle, it was observed that the higher the level of replacement, the higher the relevance of these two inputs to influence NPV. The opposite occurred with concentrate and forage consumption, i.e., the higher the level of replacement, the lower the standardized regression coefficients.
Considering the risk indicated by the analysis of sensitivity (Figure 3), it was observed that among the items of the experimental diet components, only the price of concentrate exhibited higher relevance influencing NPV, which was equivalent to initial weight.
Prices of unfinished and finished cattle and final weight were the most important items. This finding was in line with other probabilistic sensitivity analyses of feedlot cattle (PACHECO et al., 2014aPACHECO, P. S. et al. Risk assessment of finishing beef cattle in feedlot: slaughter weights and correlation amongst input variables. Revista Brasileira de Zootecnia, v.43, p.92-99, 2014a. Available from: <Available from: http://bit.ly/2u9uEjl
>. Accessed: Dec. 14, 2019. doi: 10.1590/S1516-35982014000200007.
http://bit.ly/2u9uEjl...
, 2014b, 2014c, 2017; ROSA et al., 2017ROSA, J. R. P. et al. Risk analysis of the economic viability of feedlot aberdeen angus steers fed with different proportions of concentrate. Bioscience Journal, v.33, n.3, p.660-669, 2017. Available from: <Available from: http://bit.ly/39pbmXr
>. Accessed: Dec. 30, 2019. doi: 10.14393/BJ-v33n3-34547.
http://bit.ly/39pbmXr...
; SILVA et al., 2017SILVA, R. M. et al. Stochastic simulation of the economic viability of feedlot steers fed with different proportions of concentrate. Bioscience Journal, v.33, n.1, 2017. Available from: <Available from: http://bit.ly/2u0AX8C
>. Accessed: Dec. 30, 2019. doi: 10.14393/BJ-v33n1a2017-33608.
http://bit.ly/2u0AX8C...
).
In the present study, prices of unfinished and finished cattle were up to six times more relevant to influence NPV than the price of concentrate. For example, every increase of R$ 0.01 in the price of unfinished cattle caused a reduction of R$ -3.33 in NPV for 100% replacement level. This result was obtained using the information of standard deviation of the inputs in table 5, associated with the data of standard deviation of NPV in table 6, and regression coefficients in figure 3, as follows according to Pacheco et al. (2014cPACHECO, P. S. et al. Correlation and slaughter weight on sensitivity analysis of charolais steers feedlot finished. American International Journal Contemporary Research, v.4, p.28-34, 2014c. Available from: <Available from: http://bit.ly/2ZGIDIQ
>. Accessed: Dec. 14, 2019.
http://bit.ly/2ZGIDIQ...
): each unit of standard deviation in the price of unfinished cattle (R$ 0.98/kg live weight) resulted in -1.22 standard deviation units in NPV output (1 standard deviation of NPV for 100% = R$ 267.96/confined animal), and the other input items remained constant. Therefore, R$ 0.98 of change in price of unfinished cattle = R$ -326.91 of change in NPV (= -1.22*267.96), and R$ 0.01 of change in price of unfinished cattle = R$ -3.33 of change in NPV (= -326.91*0.01/0.98).
These calculations can facilitate the decision-making process on the part of the investors/managers. LOPES et al., (2011LOPES, L. S. et al. Viabilidade econômica da terminação de novilhos nelore e red norte em confinamento na região de Lavras-MG. Ciência e Agrotecnologia, v.35, n.4, p.774-780, 2011. Available from: <Available from: http://bit.ly/35ieGQV
>. Accessed: Dec. 14, 2019. doi: 10.1590/S1413-70542011000400017.
http://bit.ly/35ieGQV...
) reported the influence established by the best strategies for purchasing grains and dietary ingredients, unfinished cattle, finished cattle, and monitoring of price volatility of grains and cattle to obtain the best results of economic viability.
CONCLUSION:
Based on the simulated results for the financial indicator NPV, the diet with 100% of pearl millet exhibited the best economic viability. The items that most influenced the financial indicator were, in descending order, prices of unfinished and finished cattle, initial and final weights, prices of concentrate and forage, and concentrate and forage consumption.
ACKNOWLEDGEMENTS
The authors are thankful to Coordenação de Aperfeiçoamento de Pessoal de Nível Superior (CAPES) and Conselho Nacional de Desenvolvimento Científico e Tecnológico (CNPq). This study was financed in part by the Coordenação de Aperfeiçoamento de Pessoal de Nível Superior (CAPES), Brasil - Finance code 001.
REFERENCES
- ALBRIGHT, S. C. et al. Data analysis and decision making. 4.ed. Mason: South-Western Cengage Learning, 2010. 1080p.
- ANUALPEC 2016. Anuário da pecuária brasileira, Informa Economics FNP, São Paulo, SP, Brasil, 272p.
- CONOVER, W. J. Practical nonparametric statistics. 3.ed. New York: John Wiley and Sons, 1999. 592p.
- COSTA JUNIOR, C. et al. Brazilian beef cattle feedlot manure management: a country survey. Journal Animal Science, v.91, n.4, p.1811-1818, 2013. Available from: <Available from: http://bit.ly/2MGoXja >. Accessed: Dec. 05, 2019. doi: 10.2527/jas2012-5603.
» https://doi.org/10.2527/jas2012-5603.» http://bit.ly/2MGoXja - FABRICIO, E. A. et al. Financial indicators to evaluate the economic performance of feedlot steers with different slaughter weights. Ciência Rural, v.47: 03, e20160516, 2017. Available from: <Available from: http://bit.ly/2MJyK7Y >. Accessed: Dec. 05, 2019. doi: 10.1590/0103-8478cr20160516.
» https://doi.org/10.1590/0103-8478cr20160516.» http://bit.ly/2MJyK7Y - GONÇALVES, J. R. S. et al. Replacement of corn grain by pearl millet grain in diets containing corn or elephant grass silage fed beef cattle. Revista Brasileira Zootecnia, v.39, n.9, p.2032-2039, 2010. Available from: <Available from: http://bit.ly/36fmjbN >. Accessed: Dec. 05, 2019. doi: 10.1590/S1516-35982010000900023.
» https://doi.org/10.1590/S1516-35982010000900023.» http://bit.ly/36fmjbN - HADAR, J.; RUSSELL, W. R. Rules for ordering uncertain prospects. The American Economic Review, v.59, n.1, p.25-34, 1969. Available from: <Available from: https://www.jstor.org/stable/1811090 >. Accessed: Dec. 09, 2019.
» https://www.jstor.org/stable/1811090 - HANOCH, J.; LEVY, H. The efficiency analysis of choices involving risk. The American Economic Review, v.74, p.335-346, 1969. Available from: <Available from: http://bit.ly/2MEGPen >. Accessed: Dec. 09, 2019. doi: 10.1016/B978-0-12-780850-5.50015-0.
» https://doi.org/10.1016/B978-0-12-780850-5.50015-0.» http://bit.ly/2MEGPen - HILL, G. M. et al. Digestibility and utilization of pearl pearl millet diets fed to finishing beef cattle. Journal Animal Science, v.74, n.7, p.1728-1735, 1996. Available from: <Available from: http://bit.ly/369DsDQ >. Accessed: Dec. 09, 2019. doi: 10.2527/1996.7471728x.
» https://doi.org/10.2527/1996.7471728x.» http://bit.ly/369DsDQ - IMAN, R. L. et al. An approach to sensitivity analysis of computer models, Part 1. Introduction, input variable selection and preliminary variable assessment. Journal of quality technology, v.13, n.3, p.174-183, 1981. Available from: <Available from: http://bit.ly/2ZEFFEQ >. Accessed: Dec. 09, 2019. doi: 10.1080/00224065.1981.11978748.
» https://doi.org/10.1080/00224065.1981.11978748.» http://bit.ly/2ZEFFEQ - KASSAI, J. R. et al. Retorno de investimento: Abordagens matemática e contábil do lucro empresarial. 3. ed. São Paulo: Editora Atlas S.A., 2007.
- LOPES, L. S. et al. Viabilidade econômica da terminação de novilhos nelore e red norte em confinamento na região de Lavras-MG. Ciência e Agrotecnologia, v.35, n.4, p.774-780, 2011. Available from: <Available from: http://bit.ly/35ieGQV >. Accessed: Dec. 14, 2019. doi: 10.1590/S1413-70542011000400017.
» https://doi.org/10.1590/S1413-70542011000400017.» http://bit.ly/35ieGQV - MATSUMOTO, M.; NISHIMURA, T. Mersenne twister: a 623-dimensionally equidistributed uniform pseudo-random number generator. ACM Transactions on Modeling and Computer Simulation, v.8, n.1, p.3-30, 1998. Available from: <Available from: http://bit.ly/2QBdgLH >. Accessed: Dec. 14, 2019. doi: 10.1145/272991.272995.
» https://doi.org/10.1145/272991.272995.» http://bit.ly/2QBdgLH - MCKAY, M. D. et al. A Comparison of three methods for selecting values of input variables in the analysis of output from a computer code. Technometrics, v.21, n.2, p.239-245, 1979. Available from: <Available from: http://bit.ly/357PJY8 >. Accessed: Dec. 14, 2019. doi: 10.1080/00401706.1979.10489755.
» https://doi.org/10.1080/00401706.1979.10489755.» http://bit.ly/357PJY8 - MILLEN, D. D. et al. A snapshot of management practices and nutritional recommendations used by feedlot nutritionists in Brazil. Journal Animal Science, v.87, p.3427-3439, 2009. Available from: <Available from: http://bit.ly/2Qzg9Nl >. Accessed: Dec. 14, 2019. doi: 10.2527/jas.2009-1880.
» https://doi.org/10.2527/jas.2009-1880.» http://bit.ly/2Qzg9Nl - PACHECO, P. S. et al. Risk assessment of finishing beef cattle in feedlot: slaughter weights and correlation amongst input variables. Revista Brasileira de Zootecnia, v.43, p.92-99, 2014a. Available from: <Available from: http://bit.ly/2u9uEjl >. Accessed: Dec. 14, 2019. doi: 10.1590/S1516-35982014000200007.
» https://doi.org/10.1590/S1516-35982014000200007.» http://bit.ly/2u9uEjl - PACHECO, P. S. et al. Use of the correlation between input variables in estimating the risk of feedlot finishing of steers and young steers. Anais da Academia Brasileira de Ciências, v.86, p.945-954, 2014b. Available from: <Available from: http://bit.ly/37jIa1Y >. Accessed: Dec. 14, 2019. doi: 10.1590/0001-37652014110012.
» https://doi.org/10.1590/0001-37652014110012.» http://bit.ly/37jIa1Y - PACHECO, P. S. et al. Correlation and slaughter weight on sensitivity analysis of charolais steers feedlot finished. American International Journal Contemporary Research, v.4, p.28-34, 2014c. Available from: <Available from: http://bit.ly/2ZGIDIQ >. Accessed: Dec. 14, 2019.
» http://bit.ly/2ZGIDIQ - PACHECO, P. S. et al. Stochastic simulation of the economic viability of feedlot finishing steers slaughtered at different weights in southern Brazil. Bioscience Journal, v.33, n.3, 2017. Available from: <Available from: http://bit.ly/35iBaBi >. Accessed: Dec. 14, 2019. doi: 10.14393/BJ-v33n3-34110.
» https://doi.org/10.14393/BJ-v33n3-34110.» http://bit.ly/35iBaBi - PALISADE RISK SOFTWARE - @RISK. Risk analysis and simulation add-in for Microsoft® Excel. Ithaca: Palisade, 2010. 739p.
- ROSA, J. R. P. et al. Risk analysis of the economic viability of feedlot aberdeen angus steers fed with different proportions of concentrate. Bioscience Journal, v.33, n.3, p.660-669, 2017. Available from: <Available from: http://bit.ly/39pbmXr >. Accessed: Dec. 30, 2019. doi: 10.14393/BJ-v33n3-34547.
» https://doi.org/10.14393/BJ-v33n3-34547.» http://bit.ly/39pbmXr - SOUZA, A.; CLEMENTE, A. Decisões financeiras e análise de investimentos: fundamentos, técnicas e aplicações. 6. ed. São Paulo: Atlas, 2009.
- SILVA, R. M. et al. Características físico-químicas da carne de tourinhos zebuínos e europeus alimentados com níveis de grão de milheto na dieta. Ciência Animal Brasileira, v.15, p.20-31, 2014. Available from: <Available from: http://bit.ly/36dlErj >. Accessed: Dec. 30, 2019. doi: 10.5216/cab.v15i1.25777.
» https://doi.org/10.5216/cab.v15i1.25777.» http://bit.ly/36dlErj - SILVA, R. M. et al. Características de carcaça e carne de novilhos de diferentes predominâncias genéticas alimentados com dietas contendo níveis de substituição do grão de milho pelo grão de milheto. Semina: Ciências Agrárias, v.36, p.943-959, 2015. Available from: <Available from: http://bit.ly/2ZHjRZ7 >. Accessed: Dec. 30, 2019. doi: 10.5433/1679-0359.2015v36n2p943.
» https://doi.org/10.5433/1679-0359.2015v36n2p943.» http://bit.ly/2ZHjRZ7 - SILVA, R. M. et al. Stochastic simulation of the economic viability of feedlot steers fed with different proportions of concentrate. Bioscience Journal, v.33, n.1, 2017. Available from: <Available from: http://bit.ly/2u0AX8C >. Accessed: Dec. 30, 2019. doi: 10.14393/BJ-v33n1a2017-33608.
» https://doi.org/10.14393/BJ-v33n1a2017-33608.» http://bit.ly/2u0AX8C
-
0
CR-2019-0443.R1
BIOETHICS AND BIOSSECURITY COMMITTEE APPROVAL
-
The present study was approved by the Research Ethics Committee and Animal Experimentation Ethics Committee of the Federal University of Goiás (CEEA/COEP/UFG), Protocol No. 101/2011.
Publication Dates
-
Publication in this collection
13 Mar 2020 -
Date of issue
2020
History
-
Received
12 June 2019 -
Accepted
04 Dec 2019 -
Reviewed
05 Feb 2020


