Abstract
Several metrics have been developed for estimating phylogenetic signal in comparative data. These may be important both in guiding future studies on correlated evolution and for inferring broad-scale evolutionary and ecological processes (e.g., phylogenetic niche conservatism). Notwithstanding, the validity of some of these metrics is under debate, especially after the development of more sophisticated model-based approaches that estimate departure from particular evolutionary models (i.e., Brownian motion). Here, two of these model-based metrics (Blomberg's K-statistics and Pagel's λ) are compared with three statistical approaches [Moran's I autocorrelation coefficient, coefficients of determination from the autoregressive method (ARM), and phylogenetic eigenvector regression (PVR)]. Based on simulations of a trait evolving under Brownian motion for a phylogeny with 209 species, we showed that all metrics are strongly, although non-linearly, correlated to each other. Our analyses revealed that statistical approaches provide valid results and may be still particularly useful when detailed phylogenies are unavailable or when trait variation among species is difficult to describe by more standard Brownian or O-U evolutionary models.
autocorrelation; Blomberg's K; Pagel's lambda; autoregressive method; Moran's I; phylogenetic eigenvector regression
A comparison of metrics for estimating phylogenetic signal under alternative evolutionary models
José Alexandre F. Diniz-FilhoI; Thiago SantosII; Thiago Fernando RangelI; Luis Mauricio BiniI
IDepartamento de Ecologia, Instituto de Ciências Biológicas, Universidade Federal de Goiás, Goiânia, GO, Brazil
IIPrograma de Pós-Graduação em Ecologia e Evolução, Instituto de Ciências Biológicas, Universidade Federal de Goiás, Goiânia, GO, Brazil
Correspondence Correspondence: José Alexandre F. Diniz-Filho, Diniz-Filho Departamento de Ecologia Instituto de Ciências Biológicas Universidade Federal de Goiás Caixa Postal 131 74001-970 Goiânia, GO, Brazil E-mail: diniz@icb.ug.br
ABSTRACT
Several metrics have been developed for estimating phylogenetic signal in comparative data. These may be important both in guiding future studies on correlated evolution and for inferring broad-scale evolutionary and ecological processes (e.g., phylogenetic niche conservatism). Notwithstanding, the validity of some of these metrics is under debate, especially after the development of more sophisticated model-based approaches that estimate departure from particular evolutionary models (i.e., Brownian motion). Here, two of these model-based metrics (Blomberg's K-statistics and Pagel's λ) are compared with three statistical approaches [Moran's I autocorrelation coefficient, coefficients of determination from the autoregressive method (ARM), and phylogenetic eigenvector regression (PVR)]. Based on simulations of a trait evolving under Brownian motion for a phylogeny with 209 species, we showed that all metrics are strongly, although non-linearly, correlated to each other. Our analyses revealed that statistical approaches provide valid results and may be still particularly useful when detailed phylogenies are unavailable or when trait variation among species is difficult to describe by more standard Brownian or O-U evolutionary models.
Key words: autocorrelation, Blomberg's K, Pagel's lambda, autoregressive method, Moran's I, phylogenetic eigenvector regression.
Introduction
Phylogenetic signal was defined by Blomberg and Garland (2002) "...as a tendency for related species to resemble each other more than they resemble species drawn at random from a tree". The lack of statistical independence among species implied by a phylogenetic signal precludes the use of traditional statistical tests in studies of correlated evolution (Felsenstein, 1985). However, it is important to note that the lack of independence should first be tested, and not simply assumed a priori, before using phylogenetically-based statistical methods (Gittleman and Kot, 1990). Thus, one initial motivation for estimating phylogenetic signal was to establish which (in any) correction must be made to take the phylogenetic relationships among species into account (see Martins and Garland 1991; Martins et al., 2002).
In addition to this methodological issue, there has been a growing interest on how phylogenetic signal can be used to infer broad-scale evolutionary and ecological processes (Martins, 2000; Diniz-Filho, 2001; Cooper et al. 2010; Hof et al., 2010; but also see Revell et al., 2008; Losos, 2008). For instance, when a trait is positively autocorrelated across the phylogeny, the most common explanation involves inheritance from a common ancestor or phylogenetic niche conservatism. Negative phylogenetic autocorrelations (i.e., when close relatives are more different in a given trait than randomly chosen pairs of taxa), although not so common, may arise due to recent events of evolutionary divergence induced by character displacement.
Currently, there are several ways to quantify phylogenetic signal in comparative data (see Blomberg and Garland, 2002). The earliest techniques were based on statistical methods (e.g., phylogenetic autocorrelation coefficients, phylogenetic correlograms and autoregressive models), that quantify the level of phylogenetic autocorrelation for a given trait of interest throughout the phylogeny (see Cheverud et al., 1985; Gittleman and Kot, 1990; Diniz-Filho et al., 1998), or under non-stationary processes (Diniz-Filho et al., 2010). When more detailed and accurate phylogenies are available, it is also possible to ascertain the expected divergence between species by assuming a theoretical model of trait evolution, and thus derive model-based metrics to compare expected and observed divergences (e.g., Pagel, 1999; Freckleton et al., 2002; Blomberg et al., 2003). In this case, Brownian motion is the most commonly used reference model for inferring changes in quantitative traits. Under Brownian motion, phenotypic divergence (covariance) among species increases linearly with time (Felsenstein, 1985, 1988; Hansen and Martins, 1996), and this can be interpreted as resulting from a pure neutral evolutionary model or from rapid and independent responses of species traits to randomly changing environments (e.g., see Hansen et al., 2008).
In spite of the debate on the relative merits of statistical and model-based approaches (e.g., Martins et al., 2002), they usually produce similar results when evaluating evolutionary correlations between traits (see Martins et al., 2002; Diniz-Filho and Tôrres, 2002). Thus, it is likely that these approaches would also provide similar results when estimating phylogenetic signal (for a theoretical evaluation of the metrics underlying phylogenetic autocorrelation analysis see Pavoine et al., 2007; Diniz-Filho et al., 2012a). Here we use simulated data and show that, for a constant phylogeny, all metrics are comparable and provide similar results, despite their different statistical and conceptual backgrounds. Focus was not placed on the statistical performance of well-established methods (Martins 1996; Diniz-Filho et al., 2012a), but rather on the correlations among estimates across evolutionary models.
Materials and Methods
Simulations
We performed simulations for a trait with zero mean and unity variance evolving under Brownian motion. We also generated simulations for Ornstein-Uhlenbeck (O-U) processes with α-parameter equal to 2, 4, 6, 8 and 10, which tend to progressively eliminate phylogenetic signal (see Diniz-Filho, 2001). For each parameter, 200 simulations were performed using the routine PDSIMUL of "Phenotypic Diversity Analysis Program" (PDAP) (Garland et al., 1993).
In all simulations, the phylogenetic relationships among the 209 species were based on the terrestrial Carnivora supertree (Bininda-Emonds et al., 2008). This phylogeny was used only as a reference for Brownian-motion evolution and to represent a real topology and observed distribution of branch lengths. The phylogenetic distances among species were expressed as patristic distances, forming the matrix D, or conversely as phylogenetic covariances (matrix C), the proportion of shared branch length from root to tip between pairs of species (in this case with an ultrametric tree, the main diagonal was set to 1.0, so that this C matrix can also be viewed as a pairwise matrix of phylogenetic correlations between species - see Helmus et al., 2007). This C matrix is the expectation correlation among phenotypes under Brownian motion (Hansen and Martins, 1996).
Metrics for phylogenetic signal
Five methods for measuring phylogenetic signal were used for each simulation, which can be broadly divided into "statistical" and "model-based" approaches. A detailed description of these metrics can be found elsewhere (Cheverud et al., 1985; Gittleman and Kot, 1990, Diniz-Filho et al. 1998; Pagel, 1999; Freckleton et al., 2002; Blomberg et al., 2003). First, for statistical-based metrics, we used the Moran's I autocorrelation coefficient, which is given by
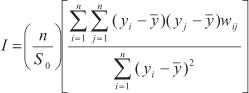
where n is the number of species, yi and yj are the trait values in a vector Y for species i and j (i.e., in this case the values of species is simulated under a given process - see above), with average  , and wij are the elements of the weighting matrix W with the pairwise phylogenetic relationship between species. Here the matrix W was replaced by the phylogenetic covariance (matrix C). We also estimated Moran's I in the first class of a phylogenetic correlogram, by using a binary weighting matrix W, with values of one indicating pairs of species that are separated by less than 12 million years (about 0.8 of phylogenetic correlation) (see Diniz-Filho, 2001; see also Diniz-Filho et al. 2009 for details of the phylogeny).
The second metric was given by the coefficient of determination (R2) estimated by the Cheverud et al. (1985) autoregressive model (ARM), which can be written as

where ρ is an autoregressive coefficient estimated by maximum likelihood, W is the weighting matrix (as defined above, and equals to covariance among species V here in this application), and ε are the model residuals.
The third metric was based on the coefficient of determination (R2) derived from a multiple regression model called Phylogenetic eigenVector Regression (PVR; Diniz-Filho et al., 1998; see Desdevises et al., 2003; Kuhn et al., 2009; Staggemeier et al., 2010; Diniz-Filho et al., 2011 and Safi and Pettorelli, 2010 for recent applications and expansions). The PVR model is given by Y = Xβ + ε, where β is a vector with regression coefficients, X is a matrix with k (k < n-1) selected eigenvectors extracted from the phylogenetic distance matrix (D), and ε are the model residuals as before. The eigenvectors represent the patterns of phylogenetic relationships among the species at distinct hierarchical levels throughout the phylogeny, and PVR is part of a group of techniques that have been widely used to take autocorrelation into account in spatial, phylogenetic and temporal data (see Peres-Neto, 2006; Peres-Neto and Legendre, 2010). For PVR, we used k = 90 eigenvectors which explained 95% of the variability in the phylogenetic distance matrix (D) because of computational constraints. Diniz-Filho et al. (2012a) showed that, under Brownian motion, the amount of variation explained by PVR (the coefficient of determination R2) must be correlated to the amount of variation explained by the eigenvectors. Because here we are using the same set of eigenvectors for all comparisons, the R2 can be directly comparable among simulations and can be correlated with other metrics. Thus, the coefficients of determination (R2) of both models (ARM and PVR) were used to quantify the amount of phylogenetic signal in the simulated data sets for the so-called "partition methods".
The other two metrics we used to quantify phylogenetic signal explicitly assume a Brownian motion model of trait evolution as a reference for estimating the phylogenetic signal. Thus, the first "model-based" statistic was the (Pagel, 1999) λ, which is equal to 0 when the trait is evolving independently of the phylogeny, while a value of 1.0 indicates that the trait under study is evolving according to Brownian motion. Details on how to estimate Pagel's λ can be found in Freckleton et al. (2002). Blomberg et al. (2003) K was the second model-based metric used in this study. Values of K-statistics lower than 1.0 indicate that related species resemble each other less than expected under the Brownian motion model of trait evolution, while values greater than 1.0 signify that more related species are more similar, for the trait under study, than predicted by this model. Because K has a right-skewed distribution (see results), we used a logarithmic transformation (base 10) to normalize this metric, so that the neutral expectation (i.e., evolution under Brownian motion) can be inferred when K = zero.
The final dataset used for analyses was then comprised by the 200 simulated values of the five metrics (Moran's I, R2ARM, R2PVR, λ and K). A stochastic variation in the magnitude of phylogenetic signal is expected under Brownian motion, so that the convergence among the metrics can be evaluated in terms of the amount of phylogenetic structure observed in each simulation. We used Spearman's rank correlation to measure to level of association between pairs of metrics because it is robust against outliers and can also measure nonlinear relationships. We also calculated correlation among mean estimates of phylogenetic signal among the different methods when increasingly α-parameter along O-U simulations.
Moran's I coefficients, ARM's and PVR's R2 were calculated with the use of a software written in the Basic and Delphi programming languages, available from the authors upon request. K and λ were calculated by using the package picante (Kembel et al., 2010) and geiger (Harmon et al., 2008) respectively, both implemented in the R software environment (R Development Core Team, 2009).
Results
Pagel's λ was equal to 1.0 in 97% of the simulations performed, thus revealing high statistical power and ability to correctly detect Brownian motion. However, this metric was not sensitive to stochastic variation in species values generated under Brownian motion and disturbing the magnitude of phylogenetic signals, being not correlated with the other metrics.
Moran's I varied between 0.03 and 0.89, with a mean of 0.31 ± 0.19, with a slightly right-skewed distribution (median = 0.27) (Figure 1a). The R2 from ARM also varied widely (Figure 1b), ranging from 0.07 to 0.89 (mean = 0.43 ± 0.17), whereas values of R2 from PVR (Figure 1c) were higher (mean = 0.94 ± 0.02) and varied much less (0.88 and 0.99) than those estimated from ARM. Comparatively, the distributions of both R2 tended to be more symmetric (Figure 1). K-statistics varied from 0.41 to 4.44, with a mean of 0.99 (as expected under Brownian motion), but the values were strongly right-skewed, and this remained even after logarithm transformation (Figure 1d).
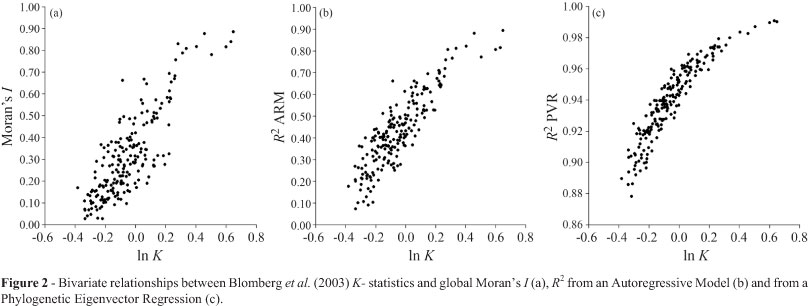
Under Brownian motion, all metrics (Moran's I, R2 from PVR and ARM and K-statistics) were highly correlated to each other, with Spearman correlation higher than 0.70 (Table 1). The lowest correlation (rS = 0.728) was between Moran's I and PVR's R2. Because Moran's I and ARM's and PVR's R2 are all empirical (statistical) metrics and K-statistics was explicitly designed to work under Brownian motion, we show the relationships between K-statistics and each one of these metrics in Figure 2. In general, as indicated by the Spearman's correlations, these empirical metrics were clearly associated to K, but the relationships were curvilinear.
Increasing the value of the α-parameter in the O-U process caused, as expected, a monotonic decrease in all metrics (all Spearman's correlation among metrics higher than 0.95), and thus the mean phylogenetic signals estimated using different methods are also strongly correlated across simulations, with decreasing signal when increasing O-U parameter (Table 2). However, the rate of decrease varied among them. For λ, the best indicator of deviation from Brownian motion was not the mean, but the frequency with which λ differed from 1.0. For PVR, even when signal was nearly absent, the mean R2 was still very high (0.724 ± 0.048). However, these coefficients of determination were usually not significant due to the small degrees of freedom left after using 90 eigenvectors. Thus, the adjusted R2, ranging from 0.027 (α = 10) to 0.785 (α = 0), provided a more standardized metrics for the decrease in phylogenetic signal.
Discussion
Our analyses show that all metrics for estimating phylogenetic signal in quantitative traits are strongly, albeit non-linearly, associated to each other. Thus, criticisms to some of these metrics, including PVR and ARM (e.g., Rohlf, 2001), although referring to more detailed behavior of these methods under specific evolutionary processes, do not invalidate results of empirical analyses if phylogenetic structures are well defined and distance/weighting matrices reflect evolutionary dynamics and expectations for trait variation among taxa, as done here.
High Moran's I coefficients and R2 values derived from PVR and ARM are consistent with the expected structure in data generated under Brownian motion process, in which closely related species will tend to be similar and this similarity decreases with phylogenetic distance (see Hansen and Martins, 1996). However, on average, both global Moran's I and R2 from ARM were low, indicating that these metrics have a low statistical power in detecting signal, by considering the wide range of values observed under Brownian motion (which is expected to generate strong and linear relationship between species divergence and time, especially with large, i.e., n > 50, sample sizes). Note that we estimated a single (global) Moran's I statistics, instead of a phylogenetic correlogram composed by several Moran's I (see Gittleman and Kot, 1990; Diniz-Filho, 2001), so that it was directly comparable with the other metrics. Because of random process at larger phylogenetic distances, global Moran's I cannot be so high, even under Brownian motion. However, Moran's I in the first distance class was closer to 1.0 under Brownian motion and also decreased with the increase of the α-parameter in the O-U process, although at a much lower rate (because, even under strong O-U, similarity between closely related taxa persists - see Hansen and Martins, 1996). Thus, using only first distance class is more effective in taking into account more complex, non-linear, models of evolution. Also, Moran's I coefficients tend to be more independent of errors in the phylogeny in general, being only affected by errors at a particular distance class (see Diniz-Filho and Nabout, 2009).
On the other hand, coefficients of determination derived from PVR were usually very high and close to 1.0 under Brownian motion (see Diniz-Filho et al., 2012b). More importantly, they were highly correlated with K-statistics, so PVR can be considered a powerful way to estimate the relative amount of phylogenetic signal. Rohlf (2001) criticized PVR as producing a trivial result when all eigenvectors are used to fully represent the phylogeny. Indeed, when all eigenvectors are used, a trivial R2 of 1.0 is obtained. Thus, although all eigenvectors are indeed necessary to fully summarize the original phylogenetic distance matrix (as in any Principal Coordinate Analysis), our results indicate that not all of them are necessary to correctly estimate phylogenetic signal. Also, it is important to remember that a phylogenetic distance matrix is not error-free and, therefore, some of the (residual) variation in this matrix, summarized by eigenvectors associated to very low (absolute) eigenvalues can be discarded (as in any multivariate analysis). In terms of scaling, we realize that using the adjusted R2 offers a more appropriate range of values, being closer to zero under strong O-U processes that minimizes phylogenetic structure in data.
The main advantage of the model-based approaches, such as K-statistics or λ, is that they provide a reference value for departure from Brownian motion, whereas the pure statistical methods only indicate whether a small or large amount of signal is present in data. Even so, the similarity among the metrics suggests that they all must be someway related to this evolutionary model and thus must be calibrated according to neutral expectations. Indeed, Diniz-Filho (2001) showed that, under Brownian motion, phylogenetic correlograms were better described by a linear model (i.e., large positive Moran's I coefficients in the first distance classes, followed by non-significant coefficients and afterward by negative and significant coefficients at high phylogenetic distances). Here there is also a conspicuous change in the correlogram profile and the elimination of the phylogenetic signal with the increase of the alpha parameter (which controls the strength of stabilizing selection) of the O-U process. This reference value for O-U is not available, however, for global Moran's I coefficients, and also not for coefficients of determination from PVR and ARM.
However, the distribution of Moran's I and PVR's R2 under Brownian motion obtained here can give some clues on the expected values under Brownian motion. If Moran's I is interpreted as a ratio between evolutionary covariance and total variance of a trait, it should be inversely related to phylogenetic species variability (PSV) (Helmus et al., 2007), which is actually the denominator of the K-statistics of Blomberg et al. (2003). For the phylogeny used here, the PSV was equal to 0.781, whose complement (1 - PSV) is then equal to 0.219 and thus close to median Moran's I (= 0.278) from the simulations. This value of PSV indicates that, due to the shape of the tree, a trait evolving under Brownian motion would not attain a strong phylogenetic signal, if measured by ratios of variances. Notice that K-statistics takes this possibility of different expectation due to shape of the phylogeny into account by dividing the observed by expected (under Brownian motion) ratio of variances.
For the PVR's R2 the interpretation of Brownian motion expectation is even more obvious after the comparisons between metrics (i.e., PVR's R2 and K), and follows the reasoning of Rohlf (2001)for criticizing the PVR. If all eigenvectors are needed to describe the full structure of the phylogeny, and if using them will produce (by definition) an R2 equal to 1.0, then not using all of them would produce a drop in the R2 proportional to the importance of the eigenvalues not used. Thus, if the eigenvectors used explain 95%, this value would be the expected R2 if a trait is evolving linearly along the phylogeny. Indeed, the mean R2 from PVR was equal to 0.94, and it is possible to observe in Figure 2c that this value corresponds to a K-statistics close to zero (see Diniz-Filho et al., 2012b).
Notice that all these comparisons between PVR, ARM and Moran's I with K-statistics were performed using simulated data on the same phylogeny, and thus the denominator of K-statistics is constant throughout the comparisons. Thus, the quantity being compared is actually the ratio between observed and phylogenetic mean squares, the "absolute" magnitude of the phylogenetic effect in data (see Blomberg et al., 2003). Further comparisons in which several phylogenies are used are still necessary, and in this case both the magnitude of the phylogenetic effect and the shape of the phylogeny (the denominator of K-statistics) would be taken into account.
Therefore, criticisms about these methods should be re-examined by considering the phylogenetic relationships used (e.g. Pavoine et al., 2007). Further analyses addressing more complex scenarios, including different tree shapes, sample sizes and evolutionary models, can validate their robustness and better establish their statistical power under more variable situations. Also, now that theoretical issues require the measurement of phylogenetic signal as deviations (both positive and negative) from neutral expectation of species divergence modeled by Brownian motion (e.g., Cooper et al., 2010), it should be important to derive neutral (not null) expectation for these statistics. However, our analyses reveal that old metrics based on autocorrelation analyses may still be valid and useful especially when detailed phylogenies are unavailable or when trait variation among species is difficult to describe by more standard Brownian or O-U evolutionary models.
Acknowledgments
We thank Leandro Duarte and an anonymous reviewer for suggestions that improved earlier versions of the manuscript. Work by JAFDF, LMB and TFR has been continuously supported by many fellowships from the Brazilian Agency CNPq. Work by TS is supported by a CAPES doctoral fellowship.
Received: November 30, 2011
Accepted: April 18, 2012
Associate Editor: Antonio Matteo Solé-Cava
License information: This is an open-access article distributed under the terms of the Creative Commons Attribution License, which permits unrestricted use, distribution, and reproduction in any medium, provided the original work is properly cited.
- Bininda-Emonds ORP, Cardillo M, Jones KE, MacPhee RDE, Beck RMD, Grenyer R, Price SA, Vos RA, Gittleman JL and Purvis A (2008) The delayed rise of present-day mammals. Nature 456:274.
- Blomberg SP and Garland Jr T (2002) Tempo and model in evolution: Phylogenetic inertia, adaptation and comparative methods. J Evol Biol 15:899-910.
- Blomberg SP, Garland T and Ives AR (2003) Testing for phylogenetic signal in comparative data: Behavioral traits are more labile. Evolution 57:717-745.
- Cheverud JM, Dow MM and Leutenegger W (1985) The quantitative assessment of phylogenetic constraints in comparative analyses - Sexual dimorphism in body-weight among primates. Evolution 39:1335-1351.
- Cooper N, Jetz W and Freckleton RP (2010) Phylogenetic comparative approaches for studying niche conservatism. J Evol Biol 23:2529-2539.
- Desdevises Y, Legendre P, Azouzi L and Morand S (2003) Quantifying phylogenetically structured environmental variation. Evolution 57:2647-2652.
- Diniz-Filho JAF (2001) Phylogenetic autocorrelation under distinct evolutionary processes. Evolution 55:1104-1109.
- Diniz-Filho JAF and Torres NM (2002) Phylogenetic comparative methods and the geographic range size - Body size relationship in new world terrestrial Carnivora. Evol Ecol 16:351-367.
- Diniz-Filho JAF, Sant'Ana CER and Bini LM (1998) An eigenvector method for estimating phylogenetic inertia. Evolution 52:1247-1262.
- Diniz-Filho JAF and Nabout JC (2009) Modeling body size evolution in Felidae under alternative phylogenetic hypotheses. Genet Mol Biol 32:170-176.
- Diniz-Filho JAF, Rodríguez MA, Bini LM, Olalla-Tárraga MA, Cardillo M, Nabout JC, Hortal J and Hawkins BA (2009) Climate history, human impacts and global body size of Carnivora (Mammalia, Eutheria) at multiple evolutionary scales. J Biogeogr 36:2222-2236.
- Diniz-Filho JAF, Terribile LC, Da Cruz MJR and Vieira LCG (2010) Hidden patterns of phylogenetic non-stationarity overwhelm comparative analyses of niche conservatism and divergence. Glob Ecol Biogeogr 19:916-926.
- Diniz-Filho JAF, Cianciaruso MV, Rangel TF and Bini LM (2011) Eigenvector estimating of phylogenetic and functional diversity. Funct Ecol 25:735-744.
- Diniz-Filho JAF, Bini LM, Rangel TF, Morales-Castilla I, Ollala-Tarraga MA, Rodríguez MA and Hawkins BA (2012a) On the selection of phylogenetic eigenvectors for ecological analyses. Ecography 35:239-249.
- Diniz-Filho JAF, Rangel TF, Santos T and Bini LM (2012b) Exploring patterns of interspecific variation in quantitative traits using sequential phylogenetic eigenvector regression. Evolution 66:1079-1090.
- Felsenstein J (1985) Phylogenies and the comparative method. Am Nat 125:1-15.
- Felsenstein J (1988) Phylogenies and quantitative characters. Annu Rev Ecol Syst 19:445-471.
- Freckleton RP, Harvey PH and Pagel M (2002) Phylogenetic analysis and comparative data: A test and review of evidence. Am Nat 160:712-726.
- Garland T, Dickerman AW, Janis CM and Jones JA (1993) Phylogenetic analysis of covariance by computer-simulation. Syst Biol 42:265-292.
- Gittleman JL and Kot M (1990) Adaptation: Statistics and a null model for estimating phylogenetic effects. Syst Zool 39:227-241.
- Hansen TF and Martins EP (1996) Translating between microevolutionary process and macroevolutionary patterns: The correlation structure of interspecific data. Evolution 50:1404-1417.
- Hansen TF, Piennar J and Orzack SH (2008) A comparative method for studying adaptation to a randomly evolving environment. Evolution 62:1965-1977.
- Harmon LJ, Weir J, Brock CD, Glor RE and Challenger W (2008) GEIGER: Investigating evolutionary radiations. Bioinformatics 24:129-131.
- Helmus MR, Bland TJ, Williams CK and Ives AR (2007) Phylogenetic measures of biodiversity. Am Nat 169:E68-E83.
- Hof C, Rahbek C and Araújo MB (2010) Phylogenetic signals in the climatic niches of the world's amphibians. Ecography 33:242-250.
- Kembel SW, Cowan PD, Helmus MR, Cornwell WK, Morlon H, Ackerly DD, Blomberg SP and Webb CO (2010) Picante: R tools for integrating phylogenies and ecology. Bioinformatics 26:1463-1464.
- Kuhn I, Nobis MP and Durka W (2009) Combining spatial and phylogenetic eigenvector filtering in trait analysis. Glob Ecol Biogeogr 18:745-758.
- Losos JB (2008) Phylogenetic niche conservatism, phylogenetic signal and the relationship between phylogenetic relatedness and ecological similarity among species. Ecol Lett 11:995-1003.
- Martins EP (1996) Phylogenies, spatial autoregression and the comparative method: A computer simulation test. Evolution 50:1750-1765.
- Martins EP (2000) Adaptation and the comparative method. Trends Ecol Evol 15:296-299.
- Martins EP and Garland T (1991) Phylogenetic analyses of the correlated evolution of continuous characters: A simulation study. Evolution 45:534-557.
- Martins EP, Diniz JAF and Housworth EA (2002) Adaptive constraints and the phylogenetic comparative method: A computer simulation test. Evolution 56:1-13.
- Pagel M (1999) Inferring the historical patterns of biological evolution. Nature 401:877-84.
- Pavoine S, Ollier S, Pontier D and Chessel D (2007) Testing for phylogenetic signal in phenotypic traits: New matrices of phylogenetic proximities. Theor Pop Biol 73:79-91.
- Peres-Neto PR (2006) A unified strategy for estimating and controlling spatial, temporal and phylogenetic autocorrelation in ecological models. Oecologia Brasiliensis 10:105-119.
- Peres-Neto PR and Legendre P (2010) Estimating and controlling for spatial autocorrelation in the study of ecological communities. Glob Ecol Biogeogr 19:174-184.
- Revell LJ, Harmon LJ and Collar DC (2008) Phylogenetic signal, evolutionary process, and rate. Syst Biol 57:591-601.
- Rohlf FJ (2001) Comparative methods for the analysis of continuous variables: Geometric interpretations. Evolution 55:2143-2160.
- Safi K and Pettorelli N (2010) Phylogenetic, spatial and environmental components of extinction risk in carnivores. Glob Ecol Biogeogr 19:352-362.
- Staggemeier VG, Diniz-Filho JAF and Morellato LPC (2010) The shared influence of ecology and phylogeny on the reproductive patterns of Myrtaea (Myrtaceae). J Ecol 98:1409-1421.
Publication Dates
-
Publication in this collection
02 Aug 2012 -
Date of issue
2012
History
-
Received
30 Nov 2011 -
Accepted
18 Apr 2012