

Amide proton transfer-weighted MRI for predicting histological grade of hepatocellular carcinoma: comparison with diffusion-weighted imaging
Introduction
Hepatocellular carcinoma (HCC) is the most common primary malignant tumor of the liver and has high mortality and morbidity rates (1,2). It has been shown that the histological grade of HCC can predict long-term survival before local treatment or liver transplantation, and is an independent predictor of postoperative recurrence (3). Therefore, accurate prediction of histological grade is critical to clinical decision-making and prognosis. Magnetic resonance imaging (MRI) has been used for the grading of HCC in the last 20 years. The application of MRI in HCC grading has developed rapidly, in which the most important and widely used is diffusion-weighted imaging (DWI). Several studies showed that the apparent diffusion coefficient (ADC) values from DWI can improve the value of MRI in grading of HCC (4-6). In general, lower ADC values are predictive of worse histological grades of HCCs. However, the ADC value indirectly reflects the histological grade of the tumor by reflecting the movement and diffusion of water molecules between the tumor tissues, and it does not reflect the material changes in the tumor parenchyma. In addition, universally accepted consensus about the DWI sequence appropriate choice of b values could not be reached (7), so that the accuracy of the ADC values from DWI in grading HCC is restricted. Therefore, it is essential to find a novel and reliable imaging method that can improve the accuracy of the grading of HCC.
In recent years, amide proton transfer-weighted (APTw) imaging has been introduced as a novel contrast mechanism in the field of molecular imaging (8,9). Based on the chemical exchange saturation transfer (CEST) principle, APTw MRI can indirectly detect cellular mobile proteins, without any exogenous contrast agent injection, through the exchange between amide protons and bulk water protons, thereby diagnosing the disease (10). APTw MRI has been applied to brain tumors, stroke (11-14), and several other diseases (15-18). A number of previous studies have successfully applied APTw MRI to detecting glioma (19,20), grading glioma (21-25), assessing tumor response to treatments (26-29), as well as predicting genetic markers in glioma (30-32). These findings caused us to seek the value of APTw MRI in predicting the histological grade of HCC. Some previous studies have shown that APTw MRI can detect liver composition changes between after-meal and overnight-fast conditions and assess the scan-rescan reproducibility in liver scanning (33,34), which confirmed the feasibility of APTw MRI in the liver. To our knowledge, no studies have been reported to evaluate the clinical potential of APTw MRI in predicting the histological grade of HCC.
In this study, we hypothesized that APTw MRI may be useful for grading HCC. This is based on the fact that high-grade HCC typically shows a higher tumor cell proliferation and cellular density, leading to overall elevated mobile protein levels, and thus, an increased APTw value (10). The aim of this study was to prospectively evaluate the potential feasibility and capability of APTw MRI to predict the histological grade of HCC, compared with widely used DWI.
Methods
Patients
This prospective study was approved by the institutional review board. All patients were required to sign the informed consents prior to being recruited. Between May 2017 and April 2018, a total of 70 consecutive patients suspected of having malignant hepatic lesions based on previous CT or ultrasonography examinations were enrolled. Thirty-eight patients were excluded for various reasons: (I) with MR contraindications (n=5); (II) with low image quality, small lesions (<1 cm), and previous HCC surgery (n=15); and (III) no pathological results, non-HCC, or the time interval between MR imaging and pathology >14 days (35) (n=18). Finally, 32 patients with pathologically confirmed HCCs were included for analysis, including 25 men and 7 women (mean age, 63.3±11.9 years; range, 30–76 years). All tumors were histologically classified from grade 1 to 4 according to the major Edmondson-Steiner grade on the final pathologic reports. We defined high-grade (Edmondson-Steiner grades 3 and 4) and low-grade (grades 1 and 2) HCCs, based on the fact that there are significant differences in survival between these two HCCs (36,37). The characteristics of the included patients are shown in Table 1.

Full table
MR imaging
All patients were instructed to fast for 6–8 h prior to the MR examination. The studies were carried out using a 3.0 T MR system (Achieva Intera 3.0 T, Philips Medical Systems, Best, the Netherlands) with an eight-channel, phased-array torso coil. Routine liver MRI was performed with the following sequences: breath-hold, transverse T1-weighted in-phase and opposed-phase, dual gradient-echo sequence [repetition time (TR) =241.25 ms, echo time (TE) =1.15/2.3 ms, matrix =320×320, field of view (FOV) =360 mm × 360 mm, slice thickness =6 mm, slice interval =1.5 mm]; a turbo-spin-echo sequence with coronal and transverse T2-weighted imaging (T2WI; TR =1,614 ms/1,457 ms, TE =70 ms/80 ms, matrix =512×512, FOV =360 mm × 360 mm, slice thickness =6 mm, slice interval =1.5 mm); and DWI (TR =3,000 ms, TE =54 ms, matrix =192×192, FOV =360 mm × 360 mm, slice thickness =6 mm, slice interval =1.5 mm) with two b values (0, 1,000 s/mm2). The total scanning time of the routine sequences was approximately seven minutes.
An APTw pulse sequence was applied on one T2WI slice that showed a single section through the largest cross-section of a solid tumor. APTw imaging was based on a single-shot, turbo-spin-echo sequence: TR, 4 sec; turbo-spin-echo factor, 63; field of view, 256 mm × 384 mm; reconstructed matrix 256×256; and slice thickness, 6 mm. Localized high-order shimming was performed to reduce B0 field inhomogeneity. We used a pulse-train radiofrequency (RF) irradiation (saturation duration, 200 ms ×4; inter-pulse delay, 10 ms; power level, 2 µT). The APTw imaging was performed with a multi-offset, multi-acquisition protocol. The 31 offsets were 0, ±0.25,±0.5, ±0.75, ±1, ±1.5, ±2, ±2.5, ±3.0 [2], ±3.25 [4], ±3.5 [8], ±3.75 [4], ±4 [2], ±4.5, ±5.0, and ±6.0 ppm, and the values in parentheses were the number of acquisitions, which was 1 if not specifically noted (38). The saturated image at the offset of 15.6 ppm was also acquired to assess the conventional MT imaging. The total acquisition time for the APTw imaging procedure was 4 minutes and 21 seconds. The duration of a total MR examination was about 12 minutes.
Baseline clinical characteristics of patients
For the morphological evaluation of HCCs, one observer who did not participate in drawing regions of interest (ROIs) recorded the following characteristics of the HCCs: the tumor size and the clinical data, such as age, sex, etiology of liver disease, and biochemical factors [including serum alpha-fetoprotein (AFP), alanine transaminase (ALT), and aspartate aminotransferase (AST) levels] were collected from medical records.
Image analysis
The APTw image data were post-processed using Interactive Data Language (IDL, ITT Visual Information Solutions, Boulder, CO, USA). The normalized saturated signal intensity curve (Ssat/S0) was calculated with 31 different frequency offsets (−6 to 6 ppm), and the Z-spectrum was then plotted (8,9). The voxel-wise Z-spectrum was fitted by a 12th-order polynomial model, and the fitted curve was interpolated to a finer resolution of 1 Hz. Further, as previously reported (39), the original Z-spectrum was corrected for the residual B0 inhomogeneity effects through the centering of the Z-spectrum. As usual, the magnetization transfer ratio (MTR) and the MTR asymmetry (MTRasym) were defined as follows:
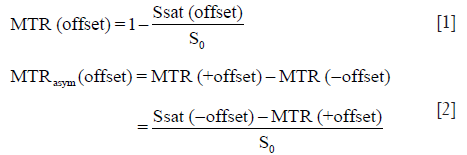
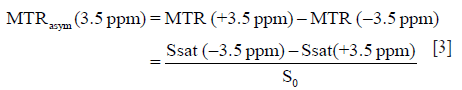
in which Ssat and S0 are the signal intensities with and without selective RF irradiation, respectively. The S0 image was acquired for the signal normalization. Specifically, the APTw image was constructed with the MTRasym at the offsets of ±3.5 ppm with respect to the water signal (8,9):
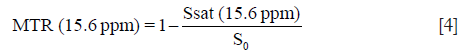
In this study, the APTw images were displayed by rainbow colors, and a display window (-5%, +5%) was used. In addition, the conventional MT imaging was quantified as follows:
The ROI image analysis was performed by two observers (Observer 1, YL and Observer 2, WJ, with three and five years of experience in abdominal imaging diagnosis, respectively) who were blinded to the clinical and histological information. Observer 1 performed a second measurement after one week. By using the T2WI image as an anatomical reference, ROIs of approximately 200–700 mm2 were placed manually in the solid component of the tumor for each patient. Large cystic cavities, large areas of necrosis, calcification, or hemorrhage, or large vessels were excluded from the ROI selection. The Z-spectrum and MTRasym spectrum data, APTw values, and ADC values were recorded for each ROI.
Statistical analysis
The inter- and intra-observer agreement for measures from the two observers were analyzed by calculation of the intraclass correlation coefficients (ICCs). ICC ≥0.75 indicated excellent concordance; 0.60–0.74, good; 0.40–0.59, fair; and ≤0.40, poor (35). An independent t-test was used to compare continuous variables. Categorical variables were compared by χ2 test. Receiver operating characteristic (ROC) curves and areas under the ROC curves (AUCs), with 95% confidence intervals (CIs), were generated for the significant parameters. The optimal cutoff value and the corresponding sensitivity and specificity values were calculated. In addition, the correlations between APTw or ADC values and the histological grades of HCC were evaluated by the Spearman correlation analyses. SPSS (version 20.0 for Windows, IBM Corporation, USA) and MedCalc 15.8 were used for statistical analysis. P<0.05 was considered to indicate statistical significance.
Results
Z-spectrum and APTw image characteristics
Figure 1 shows the ROI-averaged Z-spectra, and the corresponding MTRasym spectra for two typical high- and low-grade HCC cases. The Z-spectra for both cases were very smooth in the offset range from −6 to 6 ppm. The Z-spectrum (−6 to 6 ppm) of the high-grade HCC was higher than that of the low-grade HCC (Figure 1A). Notably, the MTRasym (3.5 ppm) was significantly higher for the high-grade HCC than for the low-grade HCC (Figure 1B).

Representative images of T2WI, DWI, ADC, APTw and hematoxylin and eosin (H&E)-stained pathological sections that were obtained from low- and high-grade HCCs are depicted in Figures 2 and 3.


Quantitative imaging analysis
The ICCs between the two observers were 0.856 (95% CI: 0.726–0.927) for APTw values and 0.936 (95% CI: 0.874–0.968) for ADC values. The ICCs of intra-observer were 0.750 (95% CI: 0.726–0.927) for APTw values, and 0.800 (95% CI: 0.782–0.935) for ADC values. Figure 4 shows the APTw values of the high- and low-grade HCCs as determined by the two observers.

Because several measurements are highly reproducible, the APTw and ADC values for the high- and low-grade HCCs from the first measurement of Observer 1 were statistically compared. As listed in Table 2, the APTw values were higher in the high-grade HCC [grades 3 and 4, (2.76±1.38)%] than in the low-grade HCC [grades 1 and 2, (1.59±0.79)%; P=0.034]. Meanwhile, the ADC values were lower in the high-grade HCC [(0.53±0.21)×10−3mm2/s] than in the low-grade HCC [(0.79±0.18)×10−3mm2/s; P=0.010].

Full table
Diagnostic performance analysis
The ROC analyses demonstrated the good diagnostic performance of the APTw, ADC values, and their combination in differentiating high- from low-grade HCCs from the first measurement of Observer 1, with AUCs of 0.814 for APTw, 0.745 for ADC, and 0.822 for their combination, as showed in Figure 5. Corresponding sensitivity, and specificity values were detailed in Table 3. The optimal APTw cutoff value was 2.30%, and the corresponding sensitivity and specificity in the prediction of high-grade HCC were 92.3% and 68.4%, respectively. The optimal ADC value was 0.60×10⁻³mm2/s, and the corresponding sensitivity and specificity of ADC in the prediction of high-grade HCC were 84.6% and 73.7%, respectively. The sensitivity and specificity of the combination of both in the prediction of high-grade HCC were 100.0% and 68.4%, respectively.


Full table
Correlation with the histological grades
Significant correlations were found between APTw values and histological grades (r=0.534; P=0.002), as well as between ADC values and histological grades (r=−0.417; P=0.018).
Discussion
This study assessed the differences between the APTw and ADC values for the high- and low-grade HCCs. The results demonstrated significantly higher APTw values (P=0.034), but significantly lower ADC values (P=0.010), in the high- than in the low-grade HCC. Moderate correlations were found between APTw values and histological grades (r=0.534; P=0.002), as well as between ADC values and histological grades (r=−0.417; P=0.018). The significance of APTw imaging is that endogenous protein information in tissue is obtained indirectly through the bulk water signal used in MRI. Notably, an egg white phantom experiment showed that the APTw signal mostly reflects mobile proteins (40). Theoretically, the effect of APTw in tumor is primarily correlated with the tissue content of labile amide protons of mobile proteins (10,41). The application of APTw imaging to brain tumors has clearly (9,19-26) demonstrated that high APTw values are associated high cellularity and proliferation.
We found a significant increase in APTw values in the high-grade HCC, agreeing with those previous results in other malignancies (21,22). After the effects of conventional MT and direct water saturation were minimized in the Z-spectra, the upward shift in the MTRasym spectrum [including MTRasym (3.5 ppm), namely APTw] for high-grade HCC may be attributable to many factors, such as a higher tumor cell proliferation rate and cellular density. Despite differences in APTw values between high- and low-grade HCC, the liver was heterogeneous on the APTw image, as shown in Figures 2D and 3D. Similar to other MRI sequences, APTw MRI is prone to some confounding signal contributions that may mislead and confuse its interpretation (10). In the two cases presented above, the intrahepatic blood vessels showed hyperintensity on APTw images, perhaps because the mobile proteins in the blood generate strong endogenous APTw signals (10). Fortunately, on standard structural MRI sequences (such as T2w, FLAIR, and T1w), the areas of large necrosis, hemorrhages, or large vessels were often evident. By referring to routine structural MR images, APTw images could identify “hyperintensity artifacts”, such as necrosis, hemorrhages, and vessels, which was necessary for accurate interpretation. This might be the reason that APTw imaging had lower specificity in identifying the high- from low-grade HCC. On APTw images (Figures 2D and 3D), compared with the normal liver parenchyma that removed intrahepatic blood vessels, the low-grade HCC signal was generally lower, with only a few patchy high signals, which might be related to blood vessels or necrosis, but the high-grade HCC signal was overall higher, which might be associated with increased blood vessels in high-grade tumors (35).
Our results were consistent with the previous studies demonstrating lower ADC values for high-grade HCC than for low-grade HCC (4-6). Moderate correlations were found between APTw values and histological grades, which was superior to ADC values. Theoretically, ADC was correlated to tumor grade and reflected tumor cellular-level water diffusion. However, APTw, based on detection cellular mobile proteins, was correlated to tumor grade and provided a different aspect of the tumor microenvironment, namely the protein and peptide concentrations. Compared to the sensitivity of ADC, the sensitivity of the combination of both MRI parameters increased from 84.6% to 100.0% in the prediction of high-grade HCC. Furthermore, according to AUC analysis, APTw might yield better diagnostic performance in predicting the histological grade of HCC compared to ADC (0.814 and 0.745). The combination of both MRI parameters increased AUC of ADC from 0.888 to 0.910, although the two were not statistically significant. Therefore, we have reason to conclude that APTw MRI combined with DWI is more conducive to accurately and comprehensively reflect the characteristics of HCC (42).
There were several limitations to our study. First, the 2D APTw imaging sequence used allowed only one single-slice acquisition. This might influence the obtained APTw values, especially in more heterogeneous tumors. A 3D imaging acquisition sequence used in the brain (43,44) should be optimized and applied to the liver in the future. Second, the semi-quantitative APTw metrics, namely MTRasym (3.5 ppm), was used in this study. APTw is not pure due to other contributions, such as the upfield nuclear Overhauser effect of aliphatic protons and even some other CEST effects around 3.5 ppm. To more accurately quantify the APT effect, more complicated APT imaging acquisition or analysis approaches may be used in the future (45-49). Third, APTw may be affected some tissue parameters, particularly conventional MT and water T1 (50,51). Fortunately, no difference in MTR (15.6 ppm) between high- from low-grade HCCs [(13.2±7.0)% vs. (13.1±13.4)%, P=0.998] was found; moreover, APTw was reportedly insensitive to water T1 under the saturation power 2 µT used in this study (52-54). Fourth, this study did not include CT or MR enhancement details in HCC patients, which resulted in an inability to perform an accurate liver imaging reporting and data system (LI-RADS) classification of HCC. We should further add the HCC patient information and analyze the link between APTw imaging and LI-RADS in next step. Fifth, the pathologic features, including the proliferation index and microvascular density, were not analyzed, which limited the further correlation between APTw value and pathologic features. Finally, our sample size was relatively small. A large prospective cohort study that includes detailed pathologic information, CT or MR enhancement sequence and a fully developed 3D APTw imaging acquisition is needed in the future.
In conclusion, our preliminary study has demonstrated that APTw imaging can be used to differentiate high- from low-grade HCCs at the protein level. The APTw imaging signal may be a useful imaging biomarker that complements DWI for more accurate and comprehensive HCC characterization.
Acknowledgments
Funding: This study was supported by grants from the National Natural Science Foundation of China (81771826, 81361120392, and 81401404), Beijing Municipal Natural Science Foundation (7154235 and 7162171), and Beijing Hospital Nova Project (BJ-2016-037).
Footnote
Conflicts of Interest: The authors have no conflicts of interest to declare.
Ethical Statement: All procedures performed were in accordance with the ethical standards of the institutional committee and with the 1964 Helsinki Declaration and its later amendments.
References
- Clark T, Maximin S, Meier J, Pokharel S, Bhargava P. Hepatocellular Carcinoma: Review of Epidemiology, Screening, Imaging Diagnosis, Response Assessment, and Treatment. Curr Probl Diagn Radiol 2015;44:479-86. [Crossref] [PubMed]
- Parkin DM. Global cancer statistics in the year 2000. Lancet Oncol 2001;2:533-43. [Crossref] [PubMed]
- Tamura S, Kato T, Berho M, Misiakos EP, O'Brien C, Reddy KR, Nery JR, Burke GW, Schiff ER, Miller J, Tzakis AG. Impact of histological grade of hepatocellular carcinoma on the outcome of liver transplantation. Arch Surg 2001;136:25-30; discussion 31. [Crossref] [PubMed]
- Heo SH, Jeong YY, Shin SS, Kim JW, Lim HS, Lee JH, Koh YS, Cho CK, Kang HK. Apparent diffusion coefficient value of diffusion-weighted imaging for hepatocellular carcinoma: correlation with the histologic differentiation and the expression of vascular endothelial growth factor. Korean J Radiol 2010;11:295-303. [Crossref] [PubMed]
- Nishie A, Tajima T, Asayama Y, Ishigami K, Kakihara D, Nakayama T, Takayama Y, Okamoto D, Fujita N, Taketomi A, Yoshimitsu K, Honda H. Diagnostic performance of apparent diffusion coefficient for predicting histological grade of hepatocellular carcinoma. Eur J Radiol 2011;80:e29-33. [Crossref] [PubMed]
- Nakanishi M, Chuma M, Hige S, Omatsu T, Yokoo H, Nakanishi K, Kamiyama T, Kubota K, Haga H, Matsuno Y, Onodera Y, Kato M, Asaka M. Relationship between diffusion-weighted magnetic resonance imaging and histological tumor grading of hepatocellular carcinoma. Ann Surg Oncol 2012;19:1302-9. [Crossref] [PubMed]
- Yamada I, Aung W, Himeno Y, Nakagawa T, Shibuya H. Diffusion coefficients in abdominal organs and hepatic lesions: evaluation with intravoxel incoherent motion echo-planar MR imaging. Radiology 1999;210:617-23. [Crossref] [PubMed]
- Zhou J, Payen JF, Wilson DA, Traystman RJ, van Zijl PC. Using the amide proton signals of intracellular proteins and peptides to detect pH effects in MRI. Nat Med 2003;9:1085-90. [Crossref] [PubMed]
- Zhou J, Lal B, Wilson DA, Laterra J, van Zijl PC. Amide proton transfer (APT) contrast for imaging of brain tumors. Magn Reson Med 2003;50:1120-6. [Crossref] [PubMed]
- Zhou J, Heo HY, Knutsson L, van Zijl PCM, Jiang S. APT-weighted MRI: Techniques, current neuro applications, and challenging issues. J Magn Reson Imaging 2019;50:347-64. [Crossref] [PubMed]
- Zhou J, van Zijl PC. Defining an Acidosis-Based Ischemic Penumbra from pH-Weighted MRI. Transl Stroke Res 2011;3:76-83. [Crossref] [PubMed]
- Sun PZ, Zhou J, Sun W, Huang J, van Zijl PC. Detection of the ischemic penumbra using pH-weighted MRI. J Cereb Blood Flow Metab 2007;27:1129-36. [Crossref] [PubMed]
- Harston GW, Tee YK, Blockley N, Okell TW, Thandeswaran S, Shaya G, Sheerin F, Cellerini M, Payne S, Jezzard P, Chappell M, Kennedy J. Identifying the ischaemic penumbra using pH-weighted magnetic resonance imaging. Brain 2015;138:36-42. [Crossref] [PubMed]
- Heo HY, Zhang Y, Burton TM, Jiang S, Zhao Y, van Zijl PCM, Leigh R, Zhou J. Improving the detection sensitivity of pH-weighted amide proton transfer MRI in acute stroke patients using extrapolated semisolid magnetization transfer reference signals. Magn Reson Med 2017;78:871-80. [Crossref] [PubMed]
- Li C, Peng S, Wang R, Chen H, Su W, Zhao X, Zhou J, Chen M. Chemical exchange saturation transfer MR imaging of Parkinson's disease at 3 Tesla. Eur Radiol 2014;24:2631-9. [Crossref] [PubMed]
- Yuan J, Chen S, King AD, Zhou J, Bhatia KS, Zhang Q, Yeung DK, Wei J, Mok GS, Wang YX. Amide proton transfer-weighted imaging of the head and neck at 3 T: a feasibility study on healthy human subjects and patients with head and neck cancer. NMR Biomed 2014;27:1239-47. [Crossref] [PubMed]
- Li C, Wang R, Chen H, Su W, Li S, Zhao X, Zhou J, Qiao J, Lou B, Song G, Chen M. Chemical Exchange Saturation Transfer MR Imaging is Superior to Diffusion-Tensor Imaging in the Diagnosis and Severity Evaluation of Parkinson's Disease: A Study on Substantia Nigra and Striatum. Front Aging Neurosci 2015;7:198. [Crossref] [PubMed]
- Wang R, Li SY, Chen M, Zhou JY, Peng DT, Zhang C, Dai YM. Amide proton transfer magnetic resonance imaging of Alzheimer's disease at 3.0 Tesla: a preliminary study. Chin Med J (Engl) 2015;128:615-9. [Crossref] [PubMed]
- Zhou J, Zhu H, Lim M, Blair L, Quinones-Hinojosa A, Messina SA, Eberhart CG, Pomper MG, Laterra J, Barker PB, van Zijl PC, Blakeley JO. Three-dimensional amide proton transfer MR imaging of gliomas: Initial experience and comparison with gadolinium enhancement. J Magn Reson Imaging 2013;38:1119-28. [Crossref] [PubMed]
- Jones CK, Schlosser MJ, van Zijl PC, Pomper MG, Golay X, Zhou J. Amide proton transfer imaging of human brain tumors at 3T. Magn Reson Med 2006;56:585-92. [Crossref] [PubMed]
- Choi YS, Ahn SS, Lee SK, Chang JH, Kang SG, Kim SH, Zhou J. Amide proton transfer imaging to discriminate between low- and high-grade gliomas: added value to apparent diffusion coefficient and relative cerebral blood volume. Eur Radiol 2017;27:3181-9. [Crossref] [PubMed]
- Zhang J, Zhu W, Tain R, Zhou XJ, Cai K. Improved Differentiation of Low-Grade and High-Grade Gliomas and Detection of Tumor Proliferation Using APT Contrast Fitted from Z-Spectrum. Mol Imaging Biol 2018;20:623-31. [Crossref] [PubMed]
- Togao O, Yoshiura T, Keupp J, Hiwatashi A, Yamashita K, Kikuchi K, Suzuki Y, Suzuki SO, Iwaki T, Hata N, Mizoguchi M, Yoshimoto K, Sagiyama K, Takahashi M, Honda H. Amide proton transfer imaging of adult diffuse gliomas: correlation with histopathological grades. Neuro Oncol 2014;16:441-8. [Crossref] [PubMed]
- Zou T, Yu H, Jiang C, Wang X, Jiang S, Rui Q, Mei Y, Zhou J, Wen Z. Differentiating the histologic grades of gliomas preoperatively using amide proton transfer-weighted (APTW) and intravoxel incoherent motion MRI. NMR Biomed 2018. [Crossref] [PubMed]
- Jiang S, Eberhart CG, Zhang Y, Heo HY, Wen Z, Blair L, Qin H, Lim M, Quinones-Hinojosa A, Weingart JD, Barker PB, Pomper MG, Laterra J, van Zijl PCM, Blakeley JO, Zhou J. Amide proton transfer-weighted magnetic resonance image-guided stereotactic biopsy in patients with newly diagnosed gliomas. Eur J Cancer 2017;83:9-18. [Crossref] [PubMed]
- Zhou J, Tryggestad E, Wen Z, Lal B, Zhou T, Grossman R, Wang S, Yan K, Fu DX, Ford E, Tyler B, Blakeley J, Laterra J, van Zijl PC. Differentiation between glioma and radiation necrosis using molecular magnetic resonance imaging of endogenous proteins and peptides. Nat Med 2011;17:130-4. [Crossref] [PubMed]
- Desmond KL, Mehrabian H, Chavez S, Sahgal A, Soliman H, Rola R, Stanisz GJ. Chemical exchange saturation transfer for predicting response to stereotactic radiosurgery in human brain metastasis. Magn Reson Med 2017;78:1110-20. [Crossref] [PubMed]
- Wang S, Tryggestad E, Zhou T, Armour M, Wen Z, Fu DX, Ford E, van Zijl PC, Zhou J. Assessment of MRI parameters as imaging biomarkers for radiation necrosis in the rat brain. Int J Radiat Oncol Biol Phys 2012;83:e431-6. [Crossref] [PubMed]
- Jiang S, Eberhart CG, Lim M, Heo HY, Zhang Y, Blair L, Wen Z, Holdhoff M, Lin D, Huang P, Qin H, Quinones-Hinojosa A, Weingart JD, Barker PB, Pomper MG, Laterra J, van Zijl PCM, Blakeley JO, Zhou J. Identifying Recurrent Malignant Glioma after Treatment Using Amide Proton Transfer-Weighted MR Imaging: A Validation Study with Image-Guided Stereotactic Biopsy. Clin Cancer Res 2019;25:552-61. [Crossref] [PubMed]
- Jiang S, Rui Q, Wang Y, Heo HY, Zou T, Yu H, Zhang Y, Wang X, Du Y, Wen X, Chen F, Wang J, Eberhart CG, Zhou J, Wen Z. Discriminating MGMT promoter methylation status in patients with glioblastoma employing amide proton transfer-weighted MRI metrics. Eur Radiol 2018;28:2115-23. [Crossref] [PubMed]
- Jiang S, Zou T, Eberhart CG, Villalobos MAV, Heo HY, Zhang Y, Wang Y, Wang X, Yu H, Du Y, van Zijl PCM, Wen Z, Zhou J. Predicting IDH mutation status in grade II gliomas using amide proton transfer-weighted (APTw) MRI. Magn Reson Med 2017;78:1100-9. [Crossref] [PubMed]
- Paech D, Windschuh J, Oberhollenzer J, Dreher C, Sahm F, Meissner JE, Goerke S, Schuenke P, Zaiss M, Regnery S, Bickelhaupt S, Baumer P, Bendszus M, Wick W, Unterberg A, Bachert P, Ladd ME, Schlemmer HP, Radbruch A. Assessing the predictability of IDH mutation and MGMT methylation status in glioma patients using relaxation-compensated multipool CEST MRI at 7.0 T. Neuro Oncol 2018;20:1661-71. [Crossref] [PubMed]
- Deng M, Chen SZ, Yuan J, Chan Q, Zhou J, Wang YX. Chemical Exchange Saturation Transfer (CEST) MR Technique for Liver Imaging at 3.0 Tesla: an Evaluation of Different Offset Number and an After-Meal and Over-Night-Fast Comparison. Mol Imaging Biol 2016;18:274-82. [Crossref] [PubMed]
- Chen SZ, Yuan J, Deng M, Wei J, Zhou J, Wang YX. Chemical exchange saturation transfer (CEST) MR technique for in-vivo liver imaging at 3.0 tesla. Eur Radiol 2016;26:1792-800. [Crossref] [PubMed]
- Wang WT, Yang L, Yang ZX, Hu XX, Ding Y, Yan X, Fu CX, Grimm R, Zeng MS, Rao SX. Assessment of Microvascular Invasion of Hepatocellular Carcinoma with Diffusion Kurtosis Imaging. Radiology 2018;286:571-80. [Crossref] [PubMed]
- Zhou L, Rui JA, Ye DX, Wang SB, Chen SG, Qu Q. Edmondson-Steiner grading increases the predictive efficiency of TNM staging for long-term survival of patients with hepatocellular carcinoma after curative resection. World J Surg 2008;32:1748-56. [Crossref] [PubMed]
- Zhou L, Rui JA, Wang SB, Chen SG, Qu Q, Chi TY, Wei X, Han K, Zhang N, Zhao HT. Factors predictive for long-term survival of male patients with hepatocellular carcinoma after curative resection. J Surg Oncol 2007;95:298-303. [Crossref] [PubMed]
- Song G, Li C, Luo X, Zhao X, Zhang S, Zhang Y, Jiang S, Wang X, Chen Y, Chen H, Gong T, Zhou J, Chen M. Evolution of Cerebral Ischemia Assessed by Amide Proton Transfer-Weighted MRI. Front Neurol 2017;8:67. [Crossref] [PubMed]
- Zhou J, Blakeley JO, Hua J, Kim M, Laterra J, Pomper MG, van Zijl PC. Practical data acquisition method for human brain tumor amide proton transfer (APT) imaging. Magn Reson Med 2008;60:842-9. [Crossref] [PubMed]
- Zhou J, Yan K, Zhu H. A simple model for understanding the origin of the amide proton transfer MRI signal in tissue. Appl Magn Reson 2012;42:393-402. [Crossref] [PubMed]
- Yan K, Fu Z, Yang C, Zhang K, Jiang S, Lee DH, Heo HY, Zhang Y, Cole RN, Van Eyk JE, Zhou J. Assessing Amide Proton Transfer (APT) MRI Contrast Origins in 9 L Gliosarcoma in the Rat Brain Using Proteomic Analysis. Mol Imaging Biol 2015;17:479-87. [Crossref] [PubMed]
- Law BKH, King AD, Ai QY, Poon DMC, Chen W, Bhatia KS, Ahuja AT, Ma BB, Ka-Wai Yeung D, Fai Mo FK, Wang YX, Yuan J. Head and Neck Tumors: Amide Proton Transfer MRI. Radiology 2018;288:782-90. [Crossref] [PubMed]
- Zhu H, Jones CK, van Zijl PC, Barker PB, Zhou J. Fast 3D chemical exchange saturation transfer (CEST) imaging of the human brain. Magn Reson Med 2010;64:638-44. [Crossref] [PubMed]
- Zhao X, Wen Z, Zhang G, Huang F, Lu S, Wang X, Hu S, Chen M, Zhou J. Three-dimensional turbo-spin-echo amide proton transfer MR imaging at 3-Tesla and its application to high-grade human brain tumors. Mol Imaging Biol 2013;15:114-22. [Crossref] [PubMed]
- Lee JS, Regatte RR, Jerschow A. Isolating chemical exchange saturation transfer contrast from magnetization transfer asymmetry under two-frequency rf irradiation. J Magn Reson 2012;215:56-63. [Crossref] [PubMed]
- Zu Z, Janve VA, Xu J, Does MD, Gore JC, Gochberg DF. A new method for detecting exchanging amide protons using chemical exchange rotation transfer. Magn Reson Med 2013;69:637-47. [Crossref] [PubMed]
- Jin T, Wang P, Zong X, Kim SG. MR imaging of the amide-proton transfer effect and the pH-insensitive nuclear overhauser effect at 9.4 T. Magn Reson Med 2013;69:760-70. [Crossref] [PubMed]
- Heo HY, Zhang Y, Jiang S, Lee DH, Zhou J. Quantitative assessment of amide proton transfer (APT) and nuclear overhauser enhancement (NOE) imaging with extrapolated semisolid magnetization transfer reference (EMR) signals: II. Comparison of three EMR models and application to human brain glioma at 3 Tesla. Magn Reson Med 2016;75:1630-9. [Crossref] [PubMed]
- Heo HY, Zhang Y, Lee DH, Hong X, Zhou J. Quantitative assessment of amide proton transfer (APT) and nuclear overhauser enhancement (NOE) imaging with extrapolated semi-solid magnetization transfer reference (EMR) signals: Application to a rat glioma model at 4.7 Tesla. Magn Reson Med 2016;75:137-49. [Crossref] [PubMed]
- Zaiss M, Bachert P. Chemical exchange saturation transfer (CEST) and MR Z-spectroscopy in vivo: a review of theoretical approaches and methods. Phys Med Biol 2013;58:R221-69. [Crossref] [PubMed]
- Zhang XY, Wang F, Li H, Xu JZ, Gochberg DF, Gore JC, Zu ZL. Accuracy in the quantification of chemical exchange saturation transfer (CEST) and relayed nuclear Overhauser enhancement (rNOE) saturation transfer effects. NMR Biomed 2017;30:e3716. [Crossref] [PubMed]
- Lee DH, Heo HY, Zhang K, Zhang Y, Jiang S, Zhao X, Zhou J. Quantitative assessment of the effects of water proton concentration and water T1 changes on amide proton transfer (APT) and nuclear overhauser enhancement (NOE) MRI: The origin of the APT imaging signal in brain tumor. Magn Reson Med 2017;77:855-63. [Crossref] [PubMed]
- Heo HY, Lee DH, Zhang Y, Zhao X, Jiang S, Chen M, Zhou J. Insight into the quantitative metrics of chemical exchange saturation transfer (CEST) imaging. Magn Reson Med 2017;77:1853-65. [Crossref] [PubMed]
- Zu Z. Towards the complex dependence of MTRasym on T-1w in amide proton transfer (APT) imaging. NMR Biomed 2018;31:e3934. [Crossref] [PubMed]

