


GPR40 is a G protein–coupled receptor regulating free fatty acid–induced insulin secretion. We generated transgenic mice overexpressing the hGPR40 gene under control of the mouse insulin II promoter and used them to examine the role of GPR40 in the regulation of insulin secretion and glucose homeostasis.
Normal (C57BL/6J) and diabetic (KK) mice overexpressing the hGPR40 gene under control of the insulin II promoter were generated, and their glucose metabolism and islet function were analyzed.
In comparison with nontransgenic littermates, hGPR40 transgenic mice exhibited improved oral glucose tolerance with an increase in insulin secretion. Although islet morphologic analysis showed no obvious differences between hGPR40 transgenic and nontransgenic mice, isolated islets from hGPR40 transgenic mice had enhanced insulin secretion in response to high glucose (16 mmol/l) compared with those from nontransgenic mice, and they both had similar low glucose (3 mmol/l)-stimulated insulin secretion. In addition, hGPR40 transgenic islets significantly increased insulin secretion against a naturally occurring agonist palmitate in the presence of 11 mmol/l glucose. hGPR40 transgenic mice were also found to be resistant to high-fat diet–induced glucose intolerance, and hGPR40 transgenic mice harboring KK background showed augmented insulin secretion and improved oral glucose tolerance compared with nontransgenic littermates.
Our results suggest that GPR40 may have a role in regulating glucose-stimulated insulin secretion and plasma glucose levels in vivo and that pharmacological activation of GPR40 may provide a novel insulin secretagogue beneficial for the treatment of type 2 diabetes.
Free fatty acids (FFAs) serve not only as nutrients but also as cell signaling mediators (1), and they are implicated in several metabolic disorders, including diabetes. Elevated circulating FFAs cause insulin resistance and impair glucose metabolism in liver, muscle, adipose tissue, and pancreatic β-cells (2). In pancreatic β-cells, prolonged exposure to elevated levels of fatty acids together with high levels of glucose impairs β-cell function (3,4) and induces cell death (5). In contrast to the toxic effects that accompany chronic exposure, in acute treatment FFAs play an essential role to amplify glucose-stimulated insulin secretion (6,7).
GPR40 was identified as a receptor for medium- and long-chain FFAs and is preferentially expressed at high levels in rodent primary β-cells, β-cell lines (8,,–11), and human islets (12,13). Several reports have shown that GPR40 is mainly coupled with Gαq/Gα11, which activates phosholipase C (PLC), resulting in the formation of inositol 1,4,5-triphosphate and induction of calcium release from endoplasmic reticulum (11,14,–16). In fact, FFAs increase intracellular calcium concentration via GPR40 and lead to glucose-dependent augmentation of insulin secretion (8,,–11,15,17).
Although several studies have shown the important role of GPR40 in FFA-induced insulin secretion, the involvement of GPR40 in FFA-induced lipotoxicity in β-cells remains controversial. Steneberg et al. (18) reported that overexpression of GPR40 in β-cells under the control of insulin promoter factor 1 (IPF-1)/pancreatic and duodenal homeobox factor 1 (PDX-1) promoter lead to β-cell dysfunction, hypoinsulinemia, and diabetes. In contrast, studies of GPR40 knockout mice showed that GPR40 did not play a role in the mechanism by which chronic treatment with fatty acids impaired insulin secretion (19,20). Furthermore, both acute and chronic treatment by small-molecule agonists of GPR40 caused enhancement of glucose-stimulated insulin secretion and improved glucose tolerance (20,–22). Together, these reports suggested that a GPR40 agonist might not be harmful to β-cells but, in fact, may prove beneficial for the treatment of type 2 diabetes.
To clarify the function of GPR40 in pancreatic β-cells more extensively, we generated transgenic mice overexpressing the human GPR40 (hGPR40) gene under control of the insulin II promoter and examined the role of GPR40 in the regulation of insulin secretion and glucose homeostasis. We found that hGPR40 transgenic mice displayed improved glucose tolerance with augmented insulin secretion both in regular and high-fat–diet feeding conditions. Moreover, even when insulin resistance was reinforced in diabetic KK mice, overexpression of hGPR40 in this background also improved glucose tolerance with increasing insulin secretion. Thus, our findings indicated that GPR40 has a role in regulating glucose-stimulated insulin secretion and plasma glucose levels in vivo, and they supported the concept that GPR40 agonists might be effective insulin secretagogues for the treatment of type 2 diabetes.
RESEARCH DESIGN AND METHODS
Generation of hGPR40 transgenic mice.
The transgene consisted of 0.7 kbp of mouse insulin II gene promoter, followed by 2.2 kbp of the hGPR40 gene, including the 3′ noncoding region (8), and the complete 2.9-kbp fragment was purified and microinjected into the fertilized eggs of C57BL/6J mice (CLEA Japan, Tokyo) (23). The transgenic mice obtained were maintained by crossing with C57BL/6J mice, and the transgenic founder mice were identified by PCR analyses of tail DNA using the hGPR40 gene–specific primers 5′-GGAGTGTGGTGCTTAATCCGCTGGT-3′ and 5′-AGACTGCCTCCTCCTTCCCGTAAGTACAA-3′. When examining the hGPR40 transgenic mice harboring KK hybrid background, hGPR40 transgenic mice were crossed with mice harboring a KK background, and the mice obtained contained almost 50% KK background (hGPR40 transgenic × KK). The transgene was identified by PCR analyses of tail DNA using the hGPR40-specific primers described above. Age- and sex-matched littermates were used as control mice throughout the study, and all experiments were conducted using male mice, unless otherwise stated. The mice were fed with a regular diet containing 11.5 kcal% fat (CE-2; CLEA Japan) and were housed in colony cages and maintained on a 12-h light/dark cycle with free access to water and food. When examining the effects of high-fat–diet feeding, mice were fed with a high-fat diet containing 60 kcal% fat (D12492; Research Diets, New Brunswick, NJ) from 8 weeks of age. Plasma glucose levels were automatically analyzed by Dri-Chem (FujiFilm Medical, Tokyo), and plasma nonesterified fatty acids (NEFAs) were determined using a Wako test (Wako Pure Chemical Industries, Osaka, Japan). Plasma insulin levels were measured by enzyme-linked immunosorbent assay (Morinaga Institute of Biological Science, Tokyo). All procedures were conducted according to the experimental animal care use committee of Takeda Pharmaceutical.
Oral glucose tolerance test.
Mice were orally administered glucose at a dose of 1 g/kg body wt for C57BL/6J mice or 2 g/kg body wt for KK hybrid mice after an overnight fast. In the case of C57BL/6J mice, blood samples were obtained at time 0 (just before glucose load), and 7.5, 15, 30, 60, and 120 min after glucose administration, followed by plasma preparation by centrifugation. For KK hybrid mice, blood samples were collected at 10 min instead of 7.5 and 15 min. Plasma glucose and insulin levels were measured as described above.
Insulin tolerance test.
Insulin was injected intraperitoneally at 0.5 units/kg body wt (Novo Nordisk, Bagsværd, Denmark) after an overnight fast. Blood samples were obtained at time 0 (just before insulin injection) and 30, 60, and 120 min after insulin injection, followed by plasma preparation by centrifugation. Plasma glucose level was measured as described above.
Preparation of islets.
Islets were isolated from pancreata by collagenase digestion (24). The solution of 183 units · mg−1 · kg−1 collagenase (Wako Pure Chemical Industries) dissolved in Hanks' balanced salt solution (Invitrogen, Carlsbad, CA) containing 10 μg/ml DNase I (Roche Diagnostics, Indianapolis, IN) and 0.2% BSA (Wako Pure Chemical Industries) was injected into the common bile duct. The pancreas was removed and incubated at 37°C for 20 min and washed three times with Hanks' balanced salt solution, and islets were hand-collected under a microscope. Freshly purified islets were used for gene expression experiments. For insulin secretion experiments, purified islets were used after overnight culture in RPMI 1640 medium containing 5.5 mmol/l glucose and 10% fetal bovine serum in a humidified atmosphere containing 5% CO2/95% air at 37°C.
RNA extraction and gene expression analysis.
Total RNA was extracted from the isolated islets, liver, subcutaneous adipose tissue, muscle, brain, and kidney using an RNeasy Mini kit (Qiagen, Tokyo), and reverse transcription was performed with random hexamer and reverse transcriptase (GE Healthcare, Chalfont St. Giles, U.K.). Quantitative real-time PCR analyses were performed using a Prism 7700 sequence detector (Applied Biosystems, Foster City, CA), following the manufacture's instructions. The primers were as follows: 5′-GCCCGCTTCAGCCTCTCT-3′ and 5′-GAGGCAGCCCACGTAGCA-3′ with 5′-FAM-TCTGCCCTTGGCCATCACAGCCT-TAMRA-3′ TaqMan probe for the hGPR40 gene, 5′-GGGCCTCTGGAAAGGGACT-3′ and 5′-ACCAGCTCAGCACAGTTGACA-3′ with 5′-FAM-TCCCAATGTTGCCCGTAATGCCA-TAMRA-3′ TaqMan probe for the mouse uncoupling protein 2 (UCP2) gene, and 5′-CGTGAAAAGATGACCCAGATCA-3′ and 5′-CACAGCCTGGATGGCTACGT-3′ with 5′-FAM-TGAGACCTTCAACACCCCAGCCATG-TAMRA-3′ TaqMan probe for the mouse actin gene. The mouse GPR40, insulin II, GLUT2, and glucokinase genes were quantified by gene expression assays (Mm00809442_m1, Mm00731595_gH, Mm00446224_m1, and Mm00439129_m1, respectively; Applied Biosystems).
Insulin secretion assay.
A group of five islets was preincubated in Krebs-Ringer bicarbonate buffer (KRBH) containing 0.2% BSA and 1 mmol/l glucose for 30 min at 37°C and then incubated for another 1 h in KRBH containing glucose. When examining the effect of the fatty acids, sodium palmitate (Chem Service, West Chester, PA) was conjugated with FFA-free BSA (Sigma Aldrich, St. Louis, MO) at final palmitate and BSA concentrations of 1 mmol/l and 0.2%, respectively. The conjugated palmitate was added to KRBH containing 11 mmol/l glucose and incubated for 1 h. At the end of the incubation period, the amount of insulin in the culture supernatant was determined with enzyme-linked immunosorbent assay as described above. Residual islets were sonicated and used to determine the DNA content (Quant-iT Picogreen dsDNA assay kit; Invitrogen).
Immunohistochemistry of pancreas.
Formalin-fixed, paraffin-embedded tissue sections (thickness 4 μm) of pancreas were immunostained using an avidin-biotin detection system (Ventana Medical Systems, Tucson, AZ) and an M.O.M. immunodetection kit (Vector Laboratories, Burlingame, CA), according to the manufacturer's instructions. Anti-insulin antibody (1:200; MP Biomedicals, Morgan Irvine, CA), anti-glucagon antibody (1:2; Zymed, South San Francisco, CA), anti-GLUT2 antibody (1:200; Chemicon International, Temecula, CA), and anti-proinsulin antibody (ready-to-use; Lab Vision, Fremont, CA) were used as primary antibodies. When examining the β-cell area, the area of the islets was traced manually and analyzed with Win Roof software (Mitani, Fukui, Japan). We analyzed >20 islets per pancreas for the average calculation.
Statistical analysis.
Statistical analysis was performed using SAS system version 8.2 (SAS Institute, Cary, NC). All values were expressed as the means ± SE. Statistical significance between groups was analyzed by Student's t test.
RESULTS
Improved glucose tolerance in hGPR40 transgenic mice harboring normal background.
To investigate the role of the GPR40 gene in pancreatic β-cells, we generated mice overexpressing hGPR40 cDNA under control of the mouse insulin II promoter (Fig. 1,A). Two transgene-expressing lines, named hGPR40 transgenic 47M and 23F, were established by microinjection of the construct into C57BL/6J oocytes. High expression levels of the hGPR40 gene were confirmed in isolated islets from both transgenic lines (male) at 9 weeks of age (Fig. 1 B). The expression levels of hGPR40 mRNA were >10 times higher than those of the endogenous mouse GPR40 gene in both of the two lines. The 47M line showed 2.8 times higher expression levels of the hGPR40 mRNA in islets than the 23F line. Expression of the hGPR40 gene was extremely low in other tissues; slight expression was found in kidney in the 47M line, but the expression level in kidney in the 23F line was extremely low. These transgenic lines appeared generally normal, reproduced successfully, and showed Mendelian inheritance characteristics.

Generation and characterization of hGPR40 transgenic mice. A: A DNA construct for microinjection to generate transgenic mice for the mouse insulin II promoter and hGPR40 gene. The box denotes the coding region of hGPR40 cDNA. B: Human and mouse GPR40 mRNA levels from hGPR40 transgenic (47M, 23F, n = 3) and nontransgenic mice (n = 3) by quantitative real-time PCR analyses. mRNA levels of actin were used as an internal control. A, subcutaneous adipose tissue; B, brain; Is, islet; K, kidney; L, liver; M, muscle; NonTg, nontransgenic; Tg, transgenic.
Generation and characterization of hGPR40 transgenic mice. A: A DNA construct for microinjection to generate transgenic mice for the mouse insulin II promoter and hGPR40 gene. The box denotes the coding region of hGPR40 cDNA. B: Human and mouse GPR40 mRNA levels from hGPR40 transgenic (47M, 23F, n = 3) and nontransgenic mice (n = 3) by quantitative real-time PCR analyses. mRNA levels of actin were used as an internal control. A, subcutaneous adipose tissue; B, brain; Is, islet; K, kidney; L, liver; M, muscle; NonTg, nontransgenic; Tg, transgenic.
Neither hGPR40 transgenic line (47M and 23F) showed significant differences in body weight, plasma glucose, plasma insulin, or NEFA levels compared with nontransgenic mice in the fed state on a regular diet (Table 1). However, fasting plasma glucose levels were lower in hGPR40 transgenic than in nontransgenic mice. To assess the glucose homeostasis in these mice more precisely, oral glucose tolerance and insulin tolerance tests were performed, and the area under the curve (AUC) for glucose and insulin was calculated. AUC0–120 min of plasma glucose after glucose load in both lines of hGPR40 transgenic mice was significantly lower than that in nontransgenic mice (Fig. 2,A, B, and E). In parallel with improvement of glucose tolerance, insulin responses to glucose at the early phase were higher in both hGPR40 transgenic lines than in nontransgenic mice (Fig. 2,C and D), and AUC0–30 min of plasma insulin was significantly increased in both lines of hGPR40 transgenic mice compared with nontransgenic mice (Fig. 2,F). Whole-body insulin sensitivity was assessed by the insulin tolerance test, and no apparent differences were observed between hGPR40 transgenic and nontransgenic mice (Fig. 2 G and H).
Metabolic parameters in hGPR40 transgenic (47M and 23F) mice fed a regular diet or a high-fat diet
| Body weight (g) | Plasma glucose (mg/dl) | Plasma insulin (ng/ml) | Plasma NEFA (mEq/l) | |
|---|---|---|---|---|
| Regular diet | ||||
| Fed | ||||
| Nontransgenic | 28.8 ± 0.4 | 170.0 ± 4.1 | 1.54 ± 0.30 | 0.33 ± 0.08 |
| Transgenic(47M) | 27.5 ± 0.6 | 153.6 ± 6.2 | 1.61 ± 0.43 | 0.24 ± 0.06 |
| Nontransgenic | 28.7 ± 0.4 | 187.6 ± 9.8 | 1.43 ± 0.38 | 0.37 ± 0.08 |
| Transgenic (23F) | 28.1 ± 0.3 | 161.4 ± 8.1 | 1.46 ± 0.38 | 0.41 ± 0.06 |
| Fasted | ||||
| Nontransgenic | 24.3 ± 0.4 | 106.0 ± 4.8 | 0.19 ± 0.04 | 1.35 ± 0.06 |
| Transgenic (47M) | 22.9 ± 0.6 | 84.5 ± 4.4* | 0.23 ± 0.05 | 1.00 ± 0.07 |
| Nontransgenic | 24.0 ± 0.3 | 117.7 ± 5.0 | 0.21 ± 0.03 | 1.07 ± 0.07 |
| Transgenic (23F) | 23.6 ± 0.3 | 89.9 ± 5.2* | 0.24 ± 0.05 | 0.98 ± 0.07 |
| High-fat diet | ||||
| Fed | ||||
| Nontransgenic | 49.9 ± 0.7 | 215.6 ± 8.1 | 18.87 ± 3.52 | 0.52 ± 0.04 |
| Transgenic (47M) | 49.6 ± 1.0 | 212.8 ± 9.9 | 16.17 ± 2.95 | 0.49 ± 0.03 |
| Fasted | ||||
| Nontransgenic | 46.0 ± 0.6 | 173.8 ± 5.6 | 2.88 ± 0.31 | 0.80 ± 0.04 |
| Transgenic (47M) | 45.4 ± 0.9 | 133.3 ± 4.5* | 3.07 ± 0.39 | 0.80 ± 0.04 |
All parameters were measured in the fed and fasted states at 16 weeks of age on a regular diet. The hGPR40 transgenic (47M) and nontransgenic mice were fed a high-fat diet containing 60 kcal% fat for 12 weeks. All parameters were measured in the fed and fasted state at 20 weeks of age. All values are the means ± SE, n = 7–10 per genotype. *P ≤ 0.01 vs. nontransgenic mice by Student's t test.
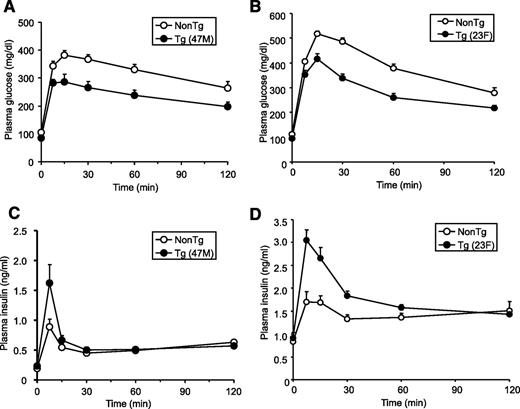

Improved glucose tolerance in hGPR40 transgenic mice harboring C57BL/6J background. Oral glucose tolerance testing was conducted in nontransgenic and hGPR40 transgenic on a regular diet. Glucose was administered orally at 1 g/kg body wt. Panels show plasma glucose and plasma insulin in the 47M line at 16 weeks of age (n = 8) (A and C) and in the 23F line at 15 weeks of age (n = 10) (B and D). Data in panel E represent the AUC0–120 min of the plasma glucose shown in panels A and B, and data in panel F represent the AUC0–30 min of the plasma insulin shown in panels C and D. G and H: Insulin tolerance test for nontransgenic and hGPR40 transgenic mice. Insulin was injected intraperitoneally at 0.5 units/kg. Panels show plasma glucose on regular diet at 14–15 weeks of 47M (n = 13–15) (G) and 23F (n = 5–7) (H), respectively. All values are the means ± SE. **P ≤ 0.01, *P ≤ 0.05 vs. nontransgenic mice by Student's t test. NonTg, nontransgenic; Tg, transgenic.
Improved glucose tolerance in hGPR40 transgenic mice harboring C57BL/6J background. Oral glucose tolerance testing was conducted in nontransgenic and hGPR40 transgenic on a regular diet. Glucose was administered orally at 1 g/kg body wt. Panels show plasma glucose and plasma insulin in the 47M line at 16 weeks of age (n = 8) (A and C) and in the 23F line at 15 weeks of age (n = 10) (B and D). Data in panel E represent the AUC0–120 min of the plasma glucose shown in panels A and B, and data in panel F represent the AUC0–30 min of the plasma insulin shown in panels C and D. G and H: Insulin tolerance test for nontransgenic and hGPR40 transgenic mice. Insulin was injected intraperitoneally at 0.5 units/kg. Panels show plasma glucose on regular diet at 14–15 weeks of 47M (n = 13–15) (G) and 23F (n = 5–7) (H), respectively. All values are the means ± SE. **P ≤ 0.01, *P ≤ 0.05 vs. nontransgenic mice by Student's t test. NonTg, nontransgenic; Tg, transgenic.
Islet structure and β-cell function in vitro.
We next examined whether hGPR40 overexpression affects islet structure. At 16 weeks of age, immunohistochemical analysis of pancreas sections with antibodies against insulin, glucagon, GLUT2, and proinsulin showed no apparent differences between hGPR40 transgenic (47M and 23F) and nontransgenic mice (Fig. 3,A). β-Cell areas of 47M and 23F lines were almost the same as those of nontransgenic mice (Fig. 3,B). To further examine the effects of the hGPR40 overexpression on islet function, isolated islets from hGPR40 transgenic (47M and 23F) mice and nontransgenic mice at 9 weeks of age were stimulated with glucose or glucose plus palmitate in vitro, and secreted insulin was measured. Basal insulin secretion at low glucose concentration (3 mmol/l) was similar between hGPR40 transgenic and nontransgenic islets, but isolated islets from hGPR40 transgenic mice had enhanced insulin secretion in response to high glucose (16 mmol/l) compared with islets from nontransgenic mice (Fig. 3,C). Similar results were obtained when using islets isolated from the 23F line (Fig. 3,D). Stimulation with palmitate, one of the naturally occurring agonists of GPR40, significantly increased insulin secretion in islets of hGPR40 transgenic mice compared with those of nontransgenic mice at 11 mmol/l glucose, indicating that the expressed hGPR40 might be functional in β-cells of hGPR40 transgenic mice (Fig. 3 E). These results suggest that the quantity of insulin secretion was more enhanced than that of insulin synthesis in hGPR40 transgenic mice islets.
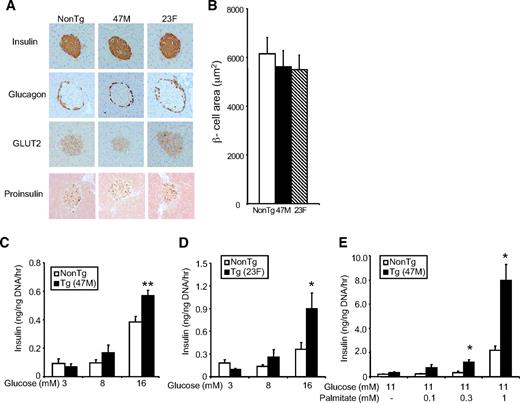
Islet structure and β-cell function of hGPR40 transgenic mice and nontransgenic mice. A: Islet morphology of hGPR40 transgenic (47M and 23F) and nontransgenic mice at 16 weeks of age. The sections were stained with anti-insulin, -glucagon, -GLUT2, and -proinsulin antibodies, respectively. B: β-Cell area was measured as the stained area for anti-insulin antibody. C and D: Glucose-stimulated insulin secretion in isolated islets from hGPR40 transgenic and nontransgenic mice. E: Palmitate-stimulated insulin secretion in isolated islets from hGRP40 transgenic (47M) mice and nontransgenic mice. Islets were isolated at 9 weeks from hGPR40 transgenic and nontransgenic mice fed regular diet. Five islets with similar sizes from each group (four batches in each group) were used. All values are the means ± SE. **P ≤ 0.01, *P ≤ 0.05 vs. nontransgenic mice by Student's t test. NonTg, nontransgenic; Tg, transgenic. (A high-quality digital representation of this figure is available in the online issue.)
Islet structure and β-cell function of hGPR40 transgenic mice and nontransgenic mice. A: Islet morphology of hGPR40 transgenic (47M and 23F) and nontransgenic mice at 16 weeks of age. The sections were stained with anti-insulin, -glucagon, -GLUT2, and -proinsulin antibodies, respectively. B: β-Cell area was measured as the stained area for anti-insulin antibody. C and D: Glucose-stimulated insulin secretion in isolated islets from hGPR40 transgenic and nontransgenic mice. E: Palmitate-stimulated insulin secretion in isolated islets from hGRP40 transgenic (47M) mice and nontransgenic mice. Islets were isolated at 9 weeks from hGPR40 transgenic and nontransgenic mice fed regular diet. Five islets with similar sizes from each group (four batches in each group) were used. All values are the means ± SE. **P ≤ 0.01, *P ≤ 0.05 vs. nontransgenic mice by Student's t test. NonTg, nontransgenic; Tg, transgenic. (A high-quality digital representation of this figure is available in the online issue.)
Effects of high-fat–diet feeding on glucose homeostasis in hGPR40 transgenic mice.
Because GPR40 is the receptor for medium- and long-chain FFAs (8,–10), and a previous report suggested the involvement of GPR40 in FFA-induced lipotoxicity in β-cells (18), we next explored the function of GPR40 in vivo under high-fat–diet conditions. hGPR40 transgenic mice (47M) were exposed to high-fat diet (containing 60 kcal% fat) for 9–12 weeks from 8 weeks of age. When nontransgenic mice were exposed to high-fat diet, body weight, plasma glucose, insulin, and NEFA levels in the fed state were increased compared with regular diet (Table 1). There were no obvious differences in body weight and plasma parameters in the fed state between hGPR40 transgenic and nontransgenic mice, but fasting plasma glucose levels were significantly reduced in hGPR40 transgenic mice in high-fat–diet conditions compared with those observed in regular diet conditions (Table 1). Oral glucose tolerance testing showed improved glucose tolerance (Fig. 4,A and C) and augmented insulin secretion in response to glucose (Fig. 4,B and D) in hGPR40 transgenic mice compared with nontransgenic mice. No apparent difference in insulin sensitivity or in epididymal adipose tissue weight was observed between hGPR40 transgenic and nontransgenic mice (Fig. 4 E and F). These results indicate that improved glucose tolerance with increased insulin secretion in hGPR40 transgenic mice was maintained under conditions of high-fat–diet–induced insulin resistance.
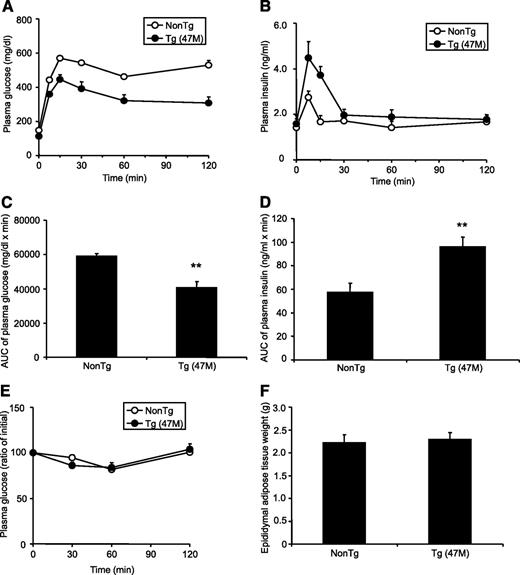
Effects of high-fat–diet feeding on glucose homeostasis in hGPR40 transgenic mice. The hGPR40 transgenic (47M) and nontransgenic mice were fed on 60 kcal% fat diet from 8 weeks of age. Oral glucose tolerance testing was used for hGPR40 transgenic mice and nontransgenic mice. Glucose was administered orally at 1 g/kg body wt. A and B: Plasma glucose (A) and plasma insulin (B) at 17 weeks of age, respectively. Data in panel C represent the AUC0–120 min of plasma glucose shown in panel A, and data in panel D represent the AUC0–30 min of plasma insulin shown in panel B. E: Insulin tolerance test for nontransgenic and hGPR40 transgenic mice. Insulin was injected intraperitoneally at 0.5 units/kg. Plasma glucose of high-fat–diet–fed mice at 20 weeks of age. F: Epididymal adipose tissue weight at 20 weeks of age. All values are the means ± SE (n = 10). **P ≤ 0.01 vs. nontransgenic mice by Student's t test. NonTg, nontransgenic; Tg, transgenic.
Effects of high-fat–diet feeding on glucose homeostasis in hGPR40 transgenic mice. The hGPR40 transgenic (47M) and nontransgenic mice were fed on 60 kcal% fat diet from 8 weeks of age. Oral glucose tolerance testing was used for hGPR40 transgenic mice and nontransgenic mice. Glucose was administered orally at 1 g/kg body wt. A and B: Plasma glucose (A) and plasma insulin (B) at 17 weeks of age, respectively. Data in panel C represent the AUC0–120 min of plasma glucose shown in panel A, and data in panel D represent the AUC0–30 min of plasma insulin shown in panel B. E: Insulin tolerance test for nontransgenic and hGPR40 transgenic mice. Insulin was injected intraperitoneally at 0.5 units/kg. Plasma glucose of high-fat–diet–fed mice at 20 weeks of age. F: Epididymal adipose tissue weight at 20 weeks of age. All values are the means ± SE (n = 10). **P ≤ 0.01 vs. nontransgenic mice by Student's t test. NonTg, nontransgenic; Tg, transgenic.
Improved glucose tolerance in hGPR40 transgenic mice harboring a diabetic genetic background.
The effects of overexpression of GPR40 in pancreatic β-cells were examined in genetically diabetic mice. Mice harboring KK background and, exhibiting obesity, glucose intolerance, and insulin resistance (25) were selected as mates, and male hGPR40 transgenic (47M) and nontransgenic mice were crossed to female mice harboring KK background. Although the mice obtained had a hybrid genetic background harboring ∼50% each of KK and C57BL/6J, the nontransgenic mice obtained (nontransgenic × KK mice) showed heavier body weight and higher plasma insulin levels than nontransgenic C57BL/6J mice at 16 weeks of age fed with regular chow (body weight 28.8 ± 0.4 vs. 38.9 ± 0.57 g, plasma insulin 1.54 ± 0.30 vs. 5.79 ± 1.83 ng/ml for nontransgenic C57BL/6J vs. nontransgenic × KK, respectively; n = 7–10). hGPR40 gene expression level in islets of hGPR40 transgenic × KK mice was >10 times higher than that of the mouse gene (Fig. 5,A). The hGPR40 transgenic × KK mice did not show significant differences in body weight, plasma glucose, and insulin levels compared with nontransgenic × KK mice at 10 weeks of age (Table 2). Oral glucose tolerance testing at 12 weeks of age revealed improved glucose tolerance and increased insulin secretion in hGPR40 transgenic × KK mice compared with nontransgenic × KK mice (Fig. 5,B–E). We next examined the insulin secretion in response to glucose in vitro using islets from hGPR40 transgenic × KK and nontransgenic × KK mice at 12 weeks of age. Although basal insulin secretion from islets in response to a low glucose concentration (3 mmol/l) was closely similar between hGPR40 transgenic × KK and nontransgenic × KK mice, insulin secretion against high glucose stimulation (16 mmol/l) was 3.5-fold higher in hGPR40 transgenic × KK islets compared with nontransgenic × KK islets (Fig. 5,F). Stimulation with 1 mmol/l palmitate produced more enhanced insulin secretion in islets of hGPR40 transgenic × KK mice than in islets of nontransgenic × KK mice at 11 mmol/l glucose (Fig. 5 G).
Metabolic parameters in hGPR40 transgenic mice crossed with KK mice fed regular diet
| Regular diet crossed with KK | Body weight (g) | Plasma glucose (mg/dl) | Plasma insulin (ng/ml) |
|---|---|---|---|
| Nontransgenic | 33.8 ± 0.7 | 200.1 ± 5.8 | 2.18 ± 0.58 |
| Transgenic | 33.3 ± 0.5 | 208.5 ± 5.9 | 3.65 ± 0.76 |
| Regular diet crossed with KK | Body weight (g) | Plasma glucose (mg/dl) | Plasma insulin (ng/ml) |
|---|---|---|---|
| Nontransgenic | 33.8 ± 0.7 | 200.1 ± 5.8 | 2.18 ± 0.58 |
| Transgenic | 33.3 ± 0.5 | 208.5 ± 5.9 | 3.65 ± 0.76 |
The hGPR40 transgenic (47M) mice harboring C57BL/6J and KK background were used for analyses. All parameters were measured in the fed state at 10 weeks of age. All values are the means ± SE; n = 8–10 per genotype.

Improved glucose tolerance in hGPR40 transgenic mice harboring diabetic KK background on regular diet. A: Human and mouse GPR40 mRNA levels in islets from hGPR40 transgenic × KK and nontransgenic × KK mice (n = 3) by quantitative real-time PCR analyses. mRNA levels of actin were used as an internal control. B–E: Oral glucose tolerance test for hGPR40 transgenic mice and nontransgenic mice harboring hybrid background. Glucose was administered orally at 2 g/kg body wt. B and C: Plasma glucose (B) and plasma insulin (C) at 12 weeks of age on regular diet. Data in panel D represent the AUC0–120 min of plasma glucose shown in panel B, and data in panel E represent the AUC0–30 min of plasma insulin shown in panel C. F and G: Glucose- and palmitate-stimulated insulin secretion in isolated islets from hGPR40 transgenic × KK and nontransgenic × KK mice. Islets were isolated from regular diet–fed mice at 12 weeks. Five islets with similar sizes from each group (four batches in each group) were used. All values are means ± SE (n = 8–10). **P ≤ 0.01, *P ≤ 0.05 vs. nontransgenic mice by Student's t test. NonTg, nontransgenic; Tg, transgenic.
Improved glucose tolerance in hGPR40 transgenic mice harboring diabetic KK background on regular diet. A: Human and mouse GPR40 mRNA levels in islets from hGPR40 transgenic × KK and nontransgenic × KK mice (n = 3) by quantitative real-time PCR analyses. mRNA levels of actin were used as an internal control. B–E: Oral glucose tolerance test for hGPR40 transgenic mice and nontransgenic mice harboring hybrid background. Glucose was administered orally at 2 g/kg body wt. B and C: Plasma glucose (B) and plasma insulin (C) at 12 weeks of age on regular diet. Data in panel D represent the AUC0–120 min of plasma glucose shown in panel B, and data in panel E represent the AUC0–30 min of plasma insulin shown in panel C. F and G: Glucose- and palmitate-stimulated insulin secretion in isolated islets from hGPR40 transgenic × KK and nontransgenic × KK mice. Islets were isolated from regular diet–fed mice at 12 weeks. Five islets with similar sizes from each group (four batches in each group) were used. All values are means ± SE (n = 8–10). **P ≤ 0.01, *P ≤ 0.05 vs. nontransgenic mice by Student's t test. NonTg, nontransgenic; Tg, transgenic.
Gene expression of factors regulating insulin secretion in islets isolated from hGPR40 transgenic mice.
To investigate the molecular mechanisms for enhanced insulin secretion in response to high-glucose stimulation in hGPR40 transgenic mice in vitro (Figs. 3,C and D and 5,F) and in vivo (Figs. 2, 4, and 5), gene expression levels of factors regulating insulin secretion were compared between islets from hGPR40 transgenic (47M) and nontransgenic mice after high-fat diet feeding for 9 weeks. The gene expression levels of insulin II, GLUT2, and glucokinase were found to be almost the same between islets of hGPR40 transgenic and nontransgenic mice (Fig. 6). We also examined the gene expression levels of UCP2, which negatively regulates insulin secretion in β-cells (26,–28), and the expression level of UCP2 did not change between hGPR40 transgenic and nontransgenic mice (Fig. 6).

Gene expression profiles in islets from hGPR40 transgenic and nontransgenic mice. The hGPR40 transgenic (47M) and nontransgenic mice were fed on 60 kcal% fat diet for 9 weeks. In each group, the islets from more than three mice were collected, and mRNA levels of indicated genes were estimated by quantitative real-time PCR analyses in duplicate. mRNA levels of actin were used as an internal control. Ratios in hGPR40 transgenic mice were with respect to values in nontransgenic mice. All values are the means ± SE (n = 3–4). Gck; glucokinase; NonTg, nontransgenic; Tg, transgenic.
Gene expression profiles in islets from hGPR40 transgenic and nontransgenic mice. The hGPR40 transgenic (47M) and nontransgenic mice were fed on 60 kcal% fat diet for 9 weeks. In each group, the islets from more than three mice were collected, and mRNA levels of indicated genes were estimated by quantitative real-time PCR analyses in duplicate. mRNA levels of actin were used as an internal control. Ratios in hGPR40 transgenic mice were with respect to values in nontransgenic mice. All values are the means ± SE (n = 3–4). Gck; glucokinase; NonTg, nontransgenic; Tg, transgenic.
DISCUSSION
In this study, we have shown that overexpression of the hGPR40 gene using insulin II promoter resulted in improved glucose tolerance with augmented insulin secretion, and the phenotype of hGPR40 transgenic mice was not altered by high-fat–diet feeding or by gene transfer into a diabetic background. We found extremely high expression in pancreatic islets in two independent lines, but slight expression was detected in kidney in the 47M line. Both 47M and 23F hGPR40 transgenic mice showed the same phenotype, and therefore it is unlikely that the expression in kidney may affect the phenotype of hGPR40 transgenic mice. The hGPR40 transgenic mice showed slightly lower plasma glucose levels than nontransgenic mice in the fasted state but not in the fed state. These results might reflect the differential activation of GPR40 between the fasted and the fed state because natural ligands of GPR40 were FFAs (8,–10), and FFA levels were significantly increased after an overnight fast in mice. In the fasted state, GPR40 may be more strongly activated than in the fed state, resulting in enhanced insulin secretion and reduced plasma glucose levels. In fact, fasting insulin levels tended to increase more in hGPR40 transgenic mice than in nontransgenic mice.
Isolated islets from hGPR40 transgenic mice significantly secreted insulin when stimulated with palmitate, a natural ligand of GPR40, and glucose per se. Although we do not have direct evidence for GPR40 protein expression level, it was proposed that GPR40 activation by fatty acids stimulated the Gαq-PLC signaling pathway, involving activation of PLC and production of inositol 1,4,5-triphosphate, which leads to release of calcium from the endoplasmic reticulum (11,14,–16). Glucose and fatty acids could also augment insulin secretion through pathways involving protein kinase C (29,30). The mechanism of enhanced glucose-stimulated insulin secretion observed in hGPR40 transgenic mice islets remains unclear so far, so further studies will be needed to clarify the precise mechanism.
Steneberg et al. (18) reported that the GPR40 transgenic mice driven by the IPF-1/PDX-1 promoter had impaired β-cell function, hypoinsulinemia, and glucose intolerance, suggesting the involvement of GPR40 in FFA-induced toxicity in β-cells. In contrast, our hGPR40 transgenic mice did not develop diabetes, even after high-fat–diet feeding for 8–12 weeks. The reason for the discrepancy remains unknown. Although we may need further examination, the possible explanations are below. First is the different promoters used for the production of transgenic mice. The temporal pattern of expression of IPF-1/PDX-1 during development was different from that of insulin II (31). Transgenes of GPR40 regulated by the IPF-1/PDX-1 promoter might be expressed in pancreatic progenitors in the early embryonic stage, and these expression patterns might be influenced to the phenotype. Second, it may be caused by the difference in genetic background of each transgenic mouse. Third, the difference in GPR40 gene levels between our transgenic mice and Steneberg's mice might be a factor. In addition, our preliminary results showed that the hGPR40 transgenic mice maintained improved glucose tolerance with increased insulin secretion when fed a high-fat diet for a long period (>50 weeks), without changes in body weight and plasma parameters, including plasma insulin levels (data not shown). Therefore, our results suggest that activation of GPR40 function might not cause lipotoxicity. Latour et al. (19) and Tan et al. (20) demonstrated that islets from GPR40 knockout mice were as sensitive to fatty acid inhibition of insulin secretion on prolonged exposure as islets from wild-type animals, and they concluded that GPR40 does not play a role in the mechanisms by which fatty acids chronically impair insulin secretion. Moreover, Kebede et al. (32) reported that GPR40 knockout mice showed fasting hyperglycemia and were not protected from high-fat–diet–induced insulin resistance. Although further studies will be needed to clarify the relationship between GPR40 and lipotoxicity, these observations are consistent with our findings. Furthermore, small-molecule agonists of GPR40 have been reported (20,–22), and GPR40 agonists could enhance glucose-stimulated insulin secretion and improve glucose tolerance both acutely and chronically. Results from these reports indicate that activation of GPR40 might be beneficial for glucose control in type 2 diabetes without lipotoxicity, and the phenotypes of our hGPR40 transgenic mice strongly support this conclusion.
Obesity commonly induces insulin resistance and causes an increase in the requirement of insulin secretion from the pancreas, and the enhancement of this phenomenon further exacerbates obesity and insulin resistance. The molecular mechanism of this phenomenon is unclear, but it may be related to increased production and secretion of nonesterified fatty acids and metabolically harmful adipokines by insulin-resistant adipocytes during obesity (33,–35). In our results, hGPR40 transgenic mice fed a high-fat diet did not show significant differences in body weight, adipose tissue weight, and plasma insulin level. Moreover, when insulin resistance was reinforced by crossing with KK background–harboring mice, hGPR40 transgenic × KK mice did not show significant differences in body weight and plasma insulin level from nontransgenic × KK mice. Therefore, activation of GPR40 may not cause sustained hyperinsulinemia but may enhance glucose-stimulated insulin secretion essentially in the prandial period.
The M3 muscarinic acetylcholine receptor subtype couples with Gαq in pancreatic β-cells (36–37). It has been reported that overexpressed M3 muscarinic receptors in pancreatic β-cells showed almost the same phenotype as the hGPR40 transgenic mice (38), and the potentiation of Gαq signaling in pancreatic β-cells may lead to the maintenance of proper insulin release and glucose homeostasis in vivo.
In conclusion, our results demonstrate that GPR40 may play an important role in the regulation of glucose-stimulated insulin secretion and glucose homeostasis. Our observation indicates that GPR40 might be concerned with an overt increase in insulin secretion in the presence of elevated glucose, such as during the postprandial period, and that specific agonists may be useful as novel insulin secretagogues with low risk of hypoglycemia.
The costs of publication of this article were defrayed in part by the payment of page charges. This article must therefore be hereby marked “advertisement” in accordance with 18 U.S.C. Section 1734 solely to indicate this fact.
Please see accompanying commentary, p. .
ACKNOWLEDGMENTS
No potential conflicts of interest relevant to this article were reported.
We are thankful to Shuji Hinuma, Nobuhiro Suzuki, Hisao Kasuga, and Yasuaki Itoh for their helpful support. Thanks are also due to Ronald E. Law and Nicholas Hird for critical reading of the manuscript; Yoshiyuki Tsujihata, Yusuke Moritoh, and Ryo Ito for valuable discussions and comments; and Kazuhiro Hosono for his technical support.
