


Epigenetic processes are primary candidates when searching for mechanisms that can stably modulate gene expression and metabolic pathways according to early life conditions. To test the effects of gestational diabetes mellitus (GDM) on the epigenome of the next generation, cord blood and placenta tissue were obtained from 88 newborns of mothers with dietetically treated GDM, 98 with insulin-dependent GDM, and 65 without GDM. Bisulfite pyrosequencing was used to compare the methylation levels of seven imprinted genes involved in prenatal and postnatal growth, four genes involved in energy metabolism, one anti-inflammatory gene, one tumor suppressor gene, one pluripotency gene, and two repetitive DNA families. The maternally imprinted MEST gene, the nonimprinted glucocorticoid receptor NR3C1 gene, and interspersed ALU repeats showed significantly decreased methylation levels (4–7 percentage points for MEST, 1–2 for NR3C1, and one for ALUs) in both GDM groups, compared with controls, in both analyzed tissues. Significantly decreased blood MEST methylation (3 percentage points) also was observed in adults with morbid obesity compared with normal-weight controls. Our results support the idea that intrauterine exposure to GDM has long-lasting effects on the epigenome of the offspring. Specifically, epigenetic malprogramming of MEST may contribute to obesity predisposition throughout life.
Epidemiological studies in humans and experimental work in various animal models suggest that adverse intrauterine conditions during fetal development can be associated with negative health outcomes later in life, particularly increased rates for many metabolic diseases (1,2). According to the developmental origins hypothesis (3), different prenatal environmental experiences have long-lasting effects on the setting of metabolic pathways and, thus, influence disease susceptibility. This requires a molecular mechanism for gene–environment interactions that can permanently alter gene expression regulation in exposed individuals. Accumulating evidence suggests that epigenetic changes induced by environmental factors can stably modulate gene expression and provide a link between early life conditions and susceptibility to complex disease (4,5).
The prevalence of type 2 diabetes mellitus and obesity is increasing in most populations worldwide. In addition to overnutrition and physical inactivity, prenatal factors appear to make a significant contribution to the metabolic disease epidemic. It is well-known that the offspring of diabetic and/or obese mothers who are exposed to high concentrations of glucose, free fatty acids, and amino acids in utero are at increased life-long risk for development of metabolic disorders (6,7). Gestational diabetes mellitus (GDM) presents during pregnancy in women without pregestational diabetes and typically disappears again after delivery. It affects 3–10% of all pregnancies in developed countries and is associated with adverse consequences not only during fetal development (i.e., hypoxemia, visceromegaly, and macrosomia) but also later in life (8,9). Studies of discordant siblings born before and after the development of diabetes in the mother demonstrated a significantly higher risk for metabolic disorders in the offspring who were exposed to a hyperglycemic intrauterine environment (6).
Studies of the epigenetic effects of an adverse prenatal environment focused on maternal undernutrition. Famine at the approximate time of conception has been associated with persistent blood methylation changes of multiple genes, i.e., the anti-inflammatory cytokine IL10 and the peptide hormone leptin (LEP), which plays an essential role in regulation of the body weight (10). Later-life phenotypic consequences of prenatal famine exposure include an increased risk for obesity, coronary artery disease, accelerated cognitive aging, and schizophrenia (11–13). To explore the epigenetic effects of fetal overnutrition, which is a more frequent problem in Western societies, we have analyzed the methylation levels of 14 candidate genes for metabolic reprogramming and two repetitive DNA families in newborns of mothers with and without GDM. Recently, decreased methylation levels of the adiponectin gene in fetal placenta have been associated with mothers’ blood glucose levels (14).
Genomic imprinting results in the preferential expression of one of the two parental alleles. Imprinted genes, including the paternally methylated H19 and MEG3 genes and the maternally methylated LIT1, MEST, NESPAS, PEG3, and SNRPN genes, are essential for the regulation of human fetal and placental growth, somatic differentiation, as well as neurologic and behavioral functions (15,16). The nonimprinted glucocorticoid receptor NR3C1 is a transcription factor that is involved in many cellular processes. Epigenetic programming of NR3C1 (i.e., by diet and early maternal care) has been associated with long-term effects on metabolism, stress response, and behavior in both rats (17,18) and humans (19,20). Feeding pregnant rats a protein-restricted diet altered methylation and expression of the peroxisome proliferator–activated receptor α (PPARA) gene, an essential transcription factor for lipid metabolism (21). NDUFB6 is a nuclear-encoded subunit of the mitochondrial NADH ubiquinone oxidoreductase. Epigenetic factors are important for NDUFB6 expression in human skeletal muscle and insulin sensitivity (22). Promoter methylation can inactivate tumor suppressor genes such as APC that prevent neoplastic transformation in normal cells (23). The transcription factor OCT4 is the key gene for maintaining pluripotency in mammalian cells (24). Interspersed ALU and LINE1 repeats comprise 10 and 17% of the human genome (25), respectively, and can be used as surrogate markers for genome-wide methylation changes (26). In somatic tissues, most retrotransposon-derived elements are densely methylated to prevent retrotransposition activity (27).
RESEARCH DESIGN AND METHODS
Umbilical cord blood and chorionic villi samples (CVS) from newborns of 88 mothers with dietetically treated gestational diabetes (D-GDM group), 98 with insulin-dependent GDM (I-GDM group), and 65 without GDM (non-GDM group) were collected by obstetricians at the Municipal Clinics, Moenchengladbach, Germany. Tissue samples were immediately frozen at −80°C until further use. Informed written consent was obtained from all mothers participating in the study, which was approved by the ethics committee of the Medical Faculty at Würzburg University. None of the mothers with GDM had type 1 or 2 diabetes before pregnancy.
GDM was diagnosed between gestational weeks 24 and 27 by an elevated fasting (for 8–12 h) plasma glucose (>95 mg/dL) and a pathological oral glucose tolerance test (>180 mg/dL at 1 h and/or >155 mg/dL at 2 h after drinking a solution with 75 g glucose). Glucose levels were determined with the hexokinase method on a Cobas 8000 modular analyzer (Roche Diagnostics, Mannheim, Germany). HbA1c was measured by high-performance liquid chromatography (TOSOH Bioscience, Stuttgart, Germany). After diagnosis, women received dietary counseling by a diabetologist. Following the recommendations of the German Society of Gynecology and Obstetrics and the American Diabetes Association, they were advised to consume a diet consisting of approximately 45% carbohydrate, 30–35% fat, and up to 20% protein. Protein intake was limited to approximately 0.8 g per kilogram of body weight. The patients were not allowed to fast. If dietary treatment did not decrease glucose (<92 mg/dL after fasting, <140 mg/dL at 1 h, and <120 mg/dL at 2 h after meals) and HbA1c levels (<6%), then patients were treated with the basis bolus insulin and, rarely, insulin pump therapy. In addition, insulin was recommended in cases of polyhydramnion or fetal macrosomia.
Blood samples of 37 obese adults (10 males and 27 females) with a BMI >35 kg/m2 and 37 sex-matched and age-matched controls with BMI <25 kg/m2 were obtained with approval of the ethics committee of the Medical Council of Rhineland-Palatinate. All subjects were Caucasians from Southwestern Germany. Mean age (and SD) of the obese patients who were examined before bariatric surgery at University Medical Centre, Mainz, Germany, was 36 ± 10 years. The BMI was 48.3 ± 8.1 kg/m2 and waist-to-hip ratio was 0.96 ± 0.11. Systolic blood pressure was 147 ± 22 mmHg and diastolic blood pressure was 92 ± 11 mmHg. Fasting plasma glucose was 108 ± 42 mg/dL and HbA1c was 6.5 ± 1.3%. The triglyceride level was 224 ± 135 mg/dL, HDL cholesterin was 45.5 ± 12.3 mg/dL, and LDL cholesterin was 126 ± 33 mg/dL. Approximately 30% of the patients had manifest type 2 diabetes, and 70% used drugs for hypertonia, hyperlipidemia, and/or hyperglycemia. White blood cell types of one adult control were separated by magnetic activated cell sorting using the Whole Blood Column Kit and a QuadroMACS Separator (Miltenyi Biotec, Bergisch Gladbach, Germany).
Bisulfite pyrosequencing.
Genomic DNA was isolated with the DNeasy blood and tissue kit (Qiagen, Hilden, Germany) and bisulfite conversion was performed with the Epitect 96 bisulfite kit (Qiagen). Bisulfite pyrosequencing was performed on a PyroMark Q96 MD pyrosequencing system with the PyroMark Gold Q96 CDT reagent kit (Qiagen). Gene-specific PCR and sequencing primers (Table 1) were designed using the PyroMark Assay Design 2.0 software (Qiagen). We estimate that at least 10,000 mainly evolutionarily young ALU and the majority of approximately 4,000 full-length LINE1 repeats are amplified by the consensus primers used (25,26). The PCR reaction mixture consisted of 2.5 µL 10× buffer, 20 mmol/L MgCl2, 0.5 μL 10 mmol/L dNTP mix, 1 μL (10 pmol) of each primer, 0.2 μL (1 unit) FastStart Taq DNA Polymerase (Roche Diagnostics), 18.8 μL PCR-grade water, and 1 μL (∼100 ng) of bisulfite-converted DNA. Amplifications were performed with an initial denaturation step at 95°C for 5 min, 35 cycles of 95°C for 30 s, primer-specific annealing temperature for 30 s, and 72°C for 45 s, and a final extension step at 72°C for 5 min. The Pyro Q-CpG software (Qiagen) was used for data analysis. In our experience, the average methylation difference between technical replicates (including bisulfite conversion, PCR, and pyrosequencing) is approximately 1 percentage point.

Bisulfite plasmid sequencing.
Classical bisulfite plasmid sequencing was performed to determine the methylation patterns of individual MEST DNA molecules. The 161-bp fragment (chromosome 7: 130,132,756–130,132,917 bp; Ensembl release 61) amplified by forward primer 5′-TTTTGGTGYGATTTAAAGGATAGGTTTTAG-3′ and reverse primer 5′-AATACCTAAATCTTAAAATCCTAAACTACACC-3′ contains 10 CpG (cytosine-phosphatidyl-guanine) sites and a cytosine/guanine-SNP (rs2301335) to distinguish the two parental alleles. It is approximately 500 bp downstream of the pyrosequencing target region in the same CpG island. PCR products were cloned into pCR2.1-TOPO vector using T4-DNA ligase, the TA cloning kit, and One Shot TOP10 chemically competent Escherichia coli (Invitrogen, Karlsruhe, Germany). Plasmid DNA of individual clones was isolated with the ZR Plasmid Miniprep Classic Kit (Zymo Research, Irvine, CA). Clones were sequenced using dye terminator cycle sequencing with M13 primers on an ABI 3730 automated sequencer.
Statistical testing.
Statistical analyses were performed with the software package R version 2.14.0. For all blood and placenta samples, a gene-wise Kruskal-Wallis nonparametric ANOVA was calculated. Pair-wise (Spearman) correlations were calculated for all single CpG methylation measurements in a given cis-regulatory region. Correlations of the methylation profiles with the maternal HbA1c and gestational age were performed using the Spearman correlation coefficient (ρ); a two-sided statistical test has been used to compute P values based on the algorithm AS 89 as implemented in R (28). Analogously, the correlation between maternal BMI, birth weight, and gene methylation was tested. For normally distributed data, multivariate parametric ANOVA models including the covariates maternal age, BMI, and birth weight were calculated to account for potential confounding effects. Subsequent post hoc tests between the three different groups (D-GDM, I-GDM, and non-GDM) were performed using Tukey honest significant difference method. For percentages in the very low or high ranges, where normality assumption might be violated, nonparametric tests (Kruskal-Wallis ANOVA and Wilcoxon rank-sum test) were performed. All P values were multiple testing–corrected using the Holm method (29). Only P < 0.05 was considered to be significant.
RESULTS
Table 2 shows anthropometric and metabolic parameters of the studied groups. Mothers with GDM had a significantly (P < 0.001) higher prepregnancy BMI (27.1 ± 6.6 kg/m2 in D-GDM and 30.2 ± 7.4 kg/m2 in I-GDM) than the controls (23.4 ± 3.7 kg/m2). Average weight gain during pregnancy and gestational age were similar in all groups. HbA1c was significantly (P = 0.012) higher in mothers with I-GDM (5.7 ± 0.5) than in mothers with D-GDM (5.4 ± 0.4). Birth weight was significantly (P = 0.012) increased in the GDM groups (3,346 ± 457 g in D-GDM and 3,438 ± 607 g in I-GDM) compared with controls (3,285 ± 457 g). There was a trend toward higher placenta weight in I-GDM (565 ± 141) than in D-GDM (516 ± 104 g) and controls (513 ± 100 g).

Gene-specific methylation changes associated with GDM.
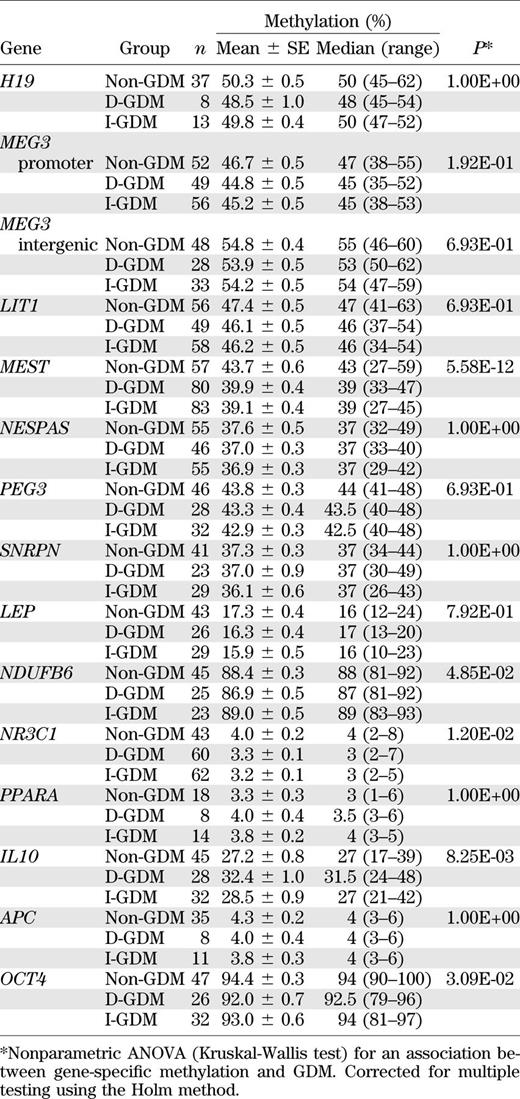
Quantitative bisulfite pyrosequencing was used to determine the methylation levels of 14 candidate genes for metabolic programming (Table 1). Because individual CpGs usually do not maintain methylation states that differ from those of the neighboring CpGs (30), the average methylation of all analyzed sites was used as a gene-specific epigenetic marker. Table 3 presents the methylation values of all studied genes in blood samples. Variable numbers of individuals with D-GDM, with I-GDM, and without GDM were analyzed per gene. Some measurements did not pass the quality criteria for bisulfite pyrograms (implemented in the Pyro Q-CpG software). Because of limited amounts of DNA, methylation data were first obtained in a subset of samples and the most promising candidate genes were then tested in the remaining samples. In an exploratory analysis of all genes to identify candidates susceptible to epigenetic programming, we used the Kruskal-Wallis nonparametric ANOVA, which cannot include covariates. A parametric ANOVA could not be applied because genes with very high (i.e., OCT4) or low (i.e., NR3C1) methylation values would violate the normality assumption. Between-group comparisons revealed a significant difference in 5 of the 14 studied loci, namely MEST (P = 5.58E-12), IL10 (P = 8.25E-03), NR3C1 (P = 0.012), OCT4 (P = 0.031), and NDUFB6 (P = 0.049). All P values (throughout the manuscript) have been corrected for multiple testing. Mean methylation of the imprinted MEST gene was 39.9 and 39.1% in D-GDM and I-GDM, respectively, and 43.7% in the control group. Mean methylation of the glucocorticoid receptor NR3C1 was 3.3 and 3.2% in the two GDM groups, compared with 4% in controls. Thus, GDM was associated with decreased blood MEST and NR3C1 methylation. Mean methylation of IL10 was 32.4% in D-GDM, 28.5% in I-GDM, and 27.2% in controls, and that of NDUFB6 was 86.9% in D-GDM, 89% in I-GDM, and 88.4% in controls, suggesting epigenetic changes in the D-GDM group, compared with I-GDM and controls. Pair-wise Spearman correlations were calculated to test whether individual CpG sites in a given region were correlated with each other. The average correlation between the five CpGs in the MEST differentially methylated region was 0.82, and that of the three sites in the IL10 promoter was 0.88. Therefore, the average methylation value of all region-specific sites can be used for ANOVA. For NR3C1, OCT4, and NDUFB6, the average pair-wise correlations were 0.37, 0.39, and 0.25, respectively. When the eight sites in the NR3C1 promoter were tested separately, CpG 1 (P = 6.80E-06), CpG 2 (P = 6.41E-04), CpG 4 (P = 4.70E-07), CpG 5 (P = 0.006), and CpG 7 (P = 0.017) showed highly significant between-group differences.
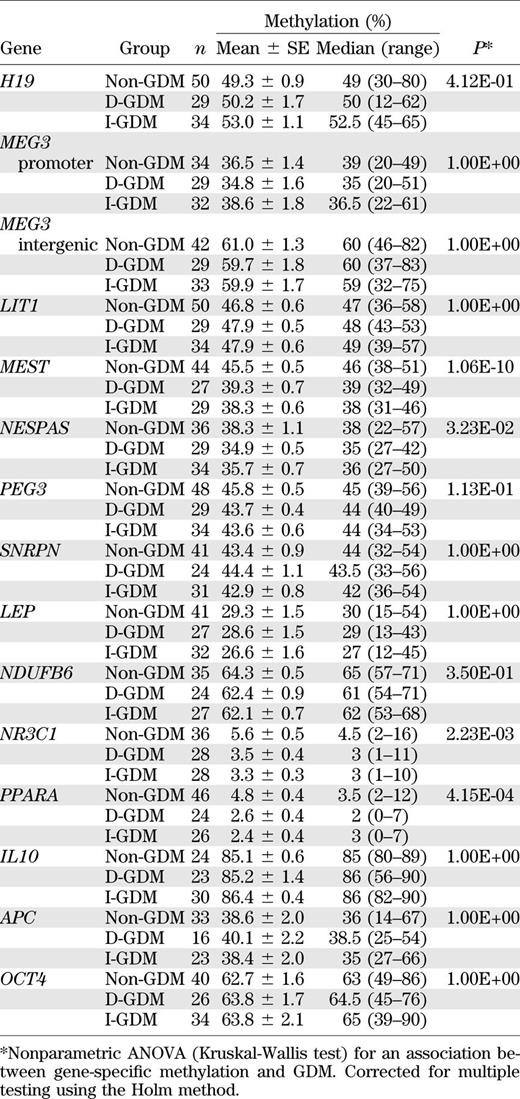
Similar methylation analyses were performed in fetal placenta (Table 4). MEST (P = 1.06E-10), PPARA (P = 4.15E-04), NR3C1 (P = 2.23E-03), and NESPAS (P = 0.032) showed significant between-group differences. GDM was associated with decreased placenta methylation values in all four genes. The most dramatic difference was observed for MEST, which showed a mean methylation of 39.3 and 38.3% in D-GDM and I-GDM, respectively, and showed a mean methylation of 45.5% in controls. Mean PPARA methylation was 2.6% in D-GDM and 2.4% in I-GDM, compared with 4.8% in controls. Mean NR3C1 methylation was 3.5 and 3.3% in D-GDM and I-GDM but 5.6% in controls. Mean NESPAS methylation was 34.9 and 35.7% in the two GDM groups and 38.3% in controls. The average pair-wise correlations between the five analyzed CpGs in MEST, the three CpGs in PPARA, the eight CpGs in NR3C1, and the four CpGs in NESPAS were 0.82, 0.67, 0.60, and 0.78, respectively. For NR3C1, single-site ANOVAs revealed a highly significant between-group difference for CpG 2 (P = 0.004), CpG 3 (P = 0.001), CpG 5 (P = 2.81E-04), CpG 6 (P = 0.001), CpG 7 (P = 0.002), and CpG 8 (P = 0.002).
Pair-wise comparisons revealed a significant MEST methylation difference between D-GDM and controls (P = 3.71E-08 for blood and P = 3.60E-09 for CVS), as well as between I-GDM and controls (P = 2.00E-10 and P = 1.58E-08, respectively), but not between the two GDM groups. Similarly, pair-wise comparisons of NR3C1 methylation values revealed a significant difference between D-GDM and controls (P = 0.008 for blood and P = 0.001 for CVS) and between I-GDM and controls (P = 0.001 for both tissues), but not between D-GDM and I-GDM.
Relaxation of MEST imprinting.
MEST is expected to be methylated on the maternal but not on the paternal allele. Bisulfite plasmid sequencing of a SNP-containing segment in the studied MEST promoter revealed 51% (20/39) methylated alleles in two informative GDM blood samples and 53% (21/39) in two controls. Approximately 90% (70/78) of alleles in both groups showed the correct parent-specific methylation imprints. Four maternal alleles were aberrantly demethylated and four paternal alleles were aberrantly methylated. The rate of single CpG methylation errors (excluding abnormal alleles) was comparable in GDM (4.5%; 17/375) and control samples (5.9%; 21/355). Similar results were obtained in one GDM and one control CVS sample (data not shown).
Repeat methylation.
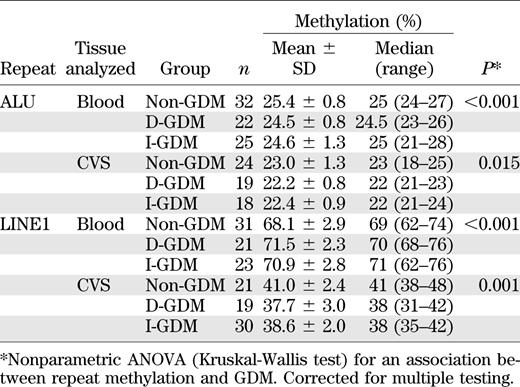
To assess genome-wide changes in DNA methylation, we analyzed interspersed ALU and LINE1 elements (Table 5). In both analyzed tissues, ALU repeats showed ∼1 percentage point lower methylation in the GDM groups than in controls (P < 0.001 for blood and P = 0.015 for CVS). LINE1 methylation was ∼3 percentage points higher in blood and 3 percentage points lower in CVS of newborns of mothers with GDM (P < 0.001 and P = 0.001, respectively).
Between-tissue differences.
Most studied gene loci showed significant methylation differences between tissues. In the three patient groups, mean methylation of the imprinted MEG3 promoter ranged from 44.8 to 46.7% in cord blood and from 34.8 to 38.6% in CVS (Wilcoxon test; P = 4.15E-11). In contrast, the intergenic differentially methylated region showed a higher methylation in CVS than in blood (59.7–61.0% vs. 53.9–54.8%; P = 3.58E-07). Mean SNRPN methylation was 36.1–37.3% in blood and 42.9–44.4% in CVS (P = 1.55E-10). Tissue differences were even larger for the nonimprinted genes LEP (15.9–17.3% in blood and 26.6–29.3% in CVS; P = 5.51E-14), NDUFB6 (86.9–89.0% in blood and 62.1–64.3% in CVS; P = 6.00E-12), IL10 (27.2–32.4% in blood and 85.1–86.4% in CVS; P = 3.15E-12), APC (3.8–4.3% in blood and 38.4–40.1% in CVS; P = 4.34E-07), and OCT4 (92.0–94.4% in blood and 62.7–63.8% in CVS; P = 1.22E-15). Both interspersed repeats showed significantly (P < 0.001) lower methylation in CVS (22.2–23.0 for ALU and 37.7–41.0 for LINE1) than in blood (24.5–25.4% and 68.1–71.5%, respectively).
Effects of confounding factors.
BMI-related parameters and birth weight significantly differed between GDM and controls; all other anthropometric and metabolic parameters were comparable between groups (Table 2). To exclude that the observed MEST methylation differences were mainly associated with BMI (or other possible confounding factors) instead of GDM, we used multivariate parametric ANOVA models including maternal age, prepregnancy BMI, and birth weight. For fetal MEST methylation, BMI was the only significant (P = 0.037 in blood and P = 1.04E-07 in CVS) confounding factor. However, even after correction, the MEST methylation difference between GDM and non-GDM samples remained highly significant (P = 3.93E-12 for blood and P = 9.72E-13 for CVS). We used a nonparametric ANOVA model to confirm the significant association between GDM and NR3C1 methylation in cord blood (P = 0.0001) and CVS (P = 0.001). Gene-wise correlations of HbA1c, an indicator of the maternal blood glucose level, with the CVS and blood methylation levels did not show a significant effect on any of our studied genes. Similarly, there was no significant correlation between gestational age and MEST or NR3C1 methylation levels. Most genes, including MEST and NR3C1, did not show significant associations of DNA methylation with fetal sex. Only MEG3 and LEP methylation differed significantly (P < 0.01 and P = 0.04) between male and female cord blood samples; NDUFB6 showed a trend difference in CVS.
Adult BMI and MEST methylation.
To support the hypothesis that fetal programming of MEST contributes to adult obesity, we compared the methylation levels in peripheral blood of 37 obese adults and 37 sex-matched and age-matched controls. Consistent with the observed hypomethylation in newborns of mothers with GDM, Wilcoxon rank-sum test showed a significantly (P = 1.46E-06) lower MEST methylation in obese individuals (38.7 ± 3.7%; range, 34–47) than in normal-weight controls (42 ± 2.1%; range, 39–50). When tested separately, all five CpG sites showed a highly significant between-group difference. NR3C1 methylation was similar (range, 0–4%) in both groups. In one adult control, MEST and NR3C1 methylation were determined in specific white blood cell types. MEST showed 40% methylation in CD3-positive T cells, 41.5% in CD19-positive B cells, 39% in CD15-positive granulocytes, and 39% in CD14-positive monocytes. NR3C1 methylation was 2.5, 2, 3.5, and 3%, respectively.
DISCUSSION
The main goal of our study was to identify gene-specific epigenetic changes in the offspring of mothers with GDM. MEST and NR3C1 exhibited highly significant methylation differences between GDM and controls in two different tissues, making them primary candidates for metabolic reprogramming. Other genes (i.e., OCT4, PPARA, and NESPAS) showed GDM-associated changes in only one analyzed tissue. Although false-positive results are extremely unlikely, the limited number of analyzed samples for some genes does not allow us to exclude false-negative results, particularly when the expected effect size is small. ALU repeats were significantly hypomethylated in both GDM tissues. ALU methylation has been used as a biomarker to associate genome-wide epigenetic changes with different epidemiological risk factors and health outcomes (31). The majority of genes contain ALU repeats in promoters and/or first exons (25), which may play a role in the regulation of transcription (32). Overall, GDM appears to interfere with the mechanisms controlling methylation patterns both at specific loci and at interspersed repeats.
Because epigenomes can differ between tissues (33), methylation changes in blood and CVS may not necessarily reflect events in the target tissues (i.e., fat, hypothalamus, liver, skeletal muscle, and/or pancreatic islets) for fetal metabolic programming. When analyzing whole blood or fetal placenta, it is also difficult to exclude minor differences in cell composition between groups. Although whole and differential blood cell counts varied to some extent among individuals, all parameters were within the normal range for newborns. A previous study did not find an association between ALU methylation and blood cell count (34), suggesting that other factors are responsible for ALU hypomethylation in GDM blood. We found very similar MEST and NR3C1 methylation levels in different white blood cells, making it unlikely that variations in the differential cell count distort the results. Blood of newborns of mothers with GDM may contain a higher amount of nucleated erythrocytes than that of controls (35). However, because of the 50-fold to 100-fold excess of white blood cells, this also is not a likely explanation for the observed between-group methylation differences. ALU repeats as well as MEST and NR3C1 exhibited methylation changes acting in the same direction in tissues from different (embryonal and extraembryonal) layers. These epigenetic signatures in blood and CVS may eventually reveal information on genes susceptible to metabolic reprogramming in the target tissues.
Human MEST is endowed with two promoters that use alternative first exons. The MEST promoter studied here is differentially methylated on the maternal chromosome in cord blood, CVS, and other tissues. It controls monoallelic (paternal) expression of isoform 1, which is specifically upregulated in fat tissue of obese individuals (36). The isoforms controlled by the other promoters may show biallelic expression in adult lymphocytes (37). MEST methylation was 4–7 percentage points lower in offspring of mothers with GDM. This could be attributable to single CpG errors (i.e., individual methylated CpGs in overall demethylated paternal and/or single unmethylated CpGs in overall methylated maternal alleles) or to the presence of entirely methylated paternal and/or hypomethylated maternal alleles in addition to alleles with normal methylation imprints. Although our sequence analysis of a limited number of plasmids did not allow any group comparisons, it clearly demonstrated relaxation of imprinting in both newborn tissues. The rate of single CpG errors that may be attributable to stochastic methylation errors (biological variation) or bisulfite conversion errors (technical variation) was similar to that in other studies (38,39). We propose that aberrantly (de)methylated alleles in a percentage of cells are at least partly responsible for the observed MEST methylation variation. Our finding that obese adults displayed lower blood methylation levels of the imprinted MEST gene than normal-weight controls supports the hypothesis that alterations in MEST regulation contribute to the life-long risk of development of obesity and other metabolic disorders. Knockout mice revealed that Mest not only acts as a fetal and placental growth factor but also plays a role in adult behavior, particularly maternal care (40). Loss of Mest imprinting was associated with increased organ and body weight (41). Mest belongs to a group of genes that were upregulated by early postnatal overnutritional environment of mice (42). Variations of Mest expression in genetically identical mice (before overnutrition) correlated with the development of diet-induced obesity (43). Mest overexpression (particularly of isoform 1) in transgenic mice resulted in the enlargement of adipocytes and fat mass expansion (44).
The 5′ untranslated region of exon 1 of the glucocorticoid receptor NR3C1 encodes different splice variants that are fused to exon 2 in a tissue-specific manner. We studied the human exon 1F promoter (orthologous to rat exon 17), which is highly expressed in the hippocampus. This neuron-specific NR3C1 1F promoter was hypomethylated (mean, 3.3–5.6%) in all analyzed patient samples. First, it has been shown in the rat model that maternal diet (17) and behavior (18) can reprogram the NR3C1 17 promoter in the offspring. In humans, increased NR3C1 1F methylation in blood and brain, respectively, has been associated with prenatal exposure to maternal depression (19) and childhood abuse (20). Although with small effect size (∼1–2 percentage points), our results revealed highly significant methylation differences between newborns of mothers with GDM and newborns of mothers without GDM. Fetal NR3C1 programming could be attributable to an increased maternal–fetal exchange of circulating glucocorticoids. At the individual level, it may be difficult to phenotypically distinguish between 3 and 5% NR3C1 methylation. However, a recent study of monozygotic twins who were discordant for recurrent tumors demonstrated that relatively small differences (<10 percentage points) in the constitutive methylation of a tumor suppressor gene may have dramatic phenotypic consequences (39). We propose that similar to genome-wide association studies with genetic markers, even a minor methylation difference between newborns of mothers with GDM and newborns of mothers without GDM, can uncover genes that may play a major role in the etiopathogenesis of the studied disease.
In fetal cord blood, two genes, IL10 and NDUFB6, showed significant methylation differences between D-GDM and I-GDM, with the I-GDM group resembling controls. The anti-inflammatory cytokine IL10 can be induced by exercise and may protect against chronic low-grade systemic inflammation in type 2 diabetes (45). Similar to famine exposure in utero (10), specific dietetic measures in D-GDM may be associated with increased IL10 methylation in the offspring. Reduced methylation of NDUFB6 also could reflect lifestyle factors in D-GDM. However, we cannot exclude that these epigenetic signatures are specific for blood cells.
Our bisulfite pyrosequencing assays revealed GDM-associated methylation changes in 2 of 14 genes for metabolic programming. Hypomethylation of ALU repeats suggests that the epigenetic effects of GDM affect multiple loci. Therefore, an important next step is genome-wide studies of DNA methylation profiles by microarrays or next-generation sequencing. Although the number of analyzed samples meets the current standards in epigenetic studies, it is desirable to increase sample size in the next few years to reach genetic study standards. To detect small between-group differences in DNA methylation, which may well be biologically relevant, we need more statistical power. Epidemiological data link GDM to an increased risk for metabolic disorders in later stages of life. Although the observed alterations in DNA methylation patterns at birth may contribute to the different health outcomes by permanently changing the regulation of essential genes, so far this evidence is circumstantial. Rodent studies and the observed MEST hypomethylation in obese adults argue in favor of the notion that decreased MEST methylation in newborns of mothers with GDM is a risk factor for development of obesity later in life. However, large prospective studies will be needed to prove that such epigenetic changes are associated with changes in disease end points.
See accompanying commentary, p. .
ACKNOWLEDGMENTS
No potential conflicts of interest relevant to this article were reported.
N.E.H., G.P., E.S., T.M., M.K., M.A., and H.L. researched the data. N.E.H. and T.H. wrote the manuscript. M.D., T.M., and U.Z. reviewed manuscript. U.Z. contributed to discussion. T.H. edited manuscript. T.H. is the guarantor of this work and, as such, had access to all the data in the study and takes responsibility for the integrity of the data and the accuracy of the data analysis.
The authors thank Cordula Neuner (Institute of Human Genetics, Würzburg University) for excellent technical assistance.
