
Inventory Management Practices during COVID 19 Pandemic to Maintain Liquidity Increasing Customer Service level in an Industrial Products Company in Mexico
Volume 5, Issue 6, Page No 613-626, 2020
Author’s Name: Ignacio Alvarez-Placenciaa), Diana Sánchez-Partida, Patricia Cano-Olivos, José-Luis Martínez-Flores
View Affiliations
Department of Logistics and Supply Chain Management, UPAEP University, 17 Sur 901, Barrio de Santiago, CP 72410 Puebla, Puebla, México
a)Author to whom correspondence should be addressed. E-mail: ignacio.alvarez@upaep.edu.mx
Adv. Sci. Technol. Eng. Syst. J. 5(6), 613-626 (2020); ![]() DOI: 10.25046/aj050675
DOI: 10.25046/aj050675
Keywords: Customer Service, Inventory Control, Delivery Performance, Lean Manufacturing

Export Citations
This work presents the development and improvement obtained by implementing inventory managing practices during the COVID 19 pandemic in a Mexican company, a leader in the industrial sector to overcome the effects on the Company’s economies due to constrained market to maintain liquidity and preserve employment by increasing customer service level ensuring the availability of the finished product and improving the delivery time in the distribution center, from the receipt of the customer’s order, order picking, shipment preparation, invoicing and final delivery to the customer. The areas involved are Commercial, Demand and Materials Planning, Purchasing, Manufacturing, Logistics, and Operations of the Distribution Center. The deployment process considered an ABC study, analysis of the historical demand, product inventory coverage days, analysis of the lead time components of the distribution center, to implement a minimum and maximum inventory control policy for the product portfolio A and manufacture products classified as B and C on a make to order basis, an audit was performed of its distribution center, to identify opportunities for improvement in their processes to reduce the time of delivery to the customer.
The Company was not in compliance with the level of customer service with an 89% performance due to the low availability of the finished product inventory, affecting the customer’s delivery time in the distribution center with a time of 5 hours versus the goal of 90 minutes per event.
The implementation of the improvement achieved an increase in the level of service up to 5% starting the fourth quarter of 2019, the savings in inventory optimization at an annual base represented USD 530,785.00 (Five hundred thirty thousand seven hundred eighty-five dollars), and the Company has implemented this good practice nationwide in its other Manufacturing Plants and Distribution Centers as part of the strategic corporate policy deployment.
Received: 01 September 2020, Accepted: 26 October 2020, Published Online: 24 November 2020
1. Introduction
In recent years, the demand of electrical energy increases, which reduces the reserves of the conventional resources and increases the global warming, therefore the use of renewable energies is the only way to reduce the dependence on fossil fuels and ensure the energy security. In fact, photovoltaic energy is the most popular renewable energy source, however, the output power relies on weather conditions and the load. This led the researchers to present various algorithms that make photovoltaic modules operates in the maximum power point. Thus a various Maximum Power Point Tracking algorithms with different degrees of complexity and precision have been proposed in the literature [1–3]. The perturb and the observe, and incremental conductance [4], methods are often used due to their simplicity and ease of implementation, however their main drawback is the fluctuations around the point of maximum power.
Thus to overcome the oscillations issues and increase the performance of the tracking a combination between direct control methods and the nonlinear commands has been employed by the researchers.
In [5], Authors propose a maximum power point tracking controller for hybrid Photovoltaic – Wind energy system. The controller is developed by the combination of perturb & observe and Sliding Mode. P&O loop is used for the computation of the reference voltage, while Sliding Mode is designed to track this voltage by generating the control signal. The proposed method exhibits good convergence speed, but the main disadvantage is the oscillations around maximum power point.
In [6], Authors present a control of a single-phase Photovoltaic inverter using backstepping algorithm which track the desired voltage generated by Perturb and Observe method and adjust the duty cycle in order to operate in maximum power point. The error between the output and reference voltage was eliminated quickly, but some fluctuations have been observed in the desired operating point.
In [7], Authors propose a maximum power point tracking controller for Photovoltaic system. The controller is developed by the combination of Sliding Mode and Artificial Neural Network (ANN). The ANN is employed to generate the reference voltage, while Sliding Mode is designed to track this voltage by generating the control signal. The proposed method presents good performance; however, some oscillations is noticed around maximum power point.
In order to overcome fluctuation issues around maximum power point, this paper proposes a hybrid method, which consists of a backstepping controller combined to the Artificial Neural Network (ANN). The ANN is employed to generate the reference voltage, while backstepping controller is designed to adjust the duty cycle of the converter in order to track the desired voltage, which corresponds to the voltage of the Maximum Power Point, (Fig1).
In contrast of previous methods which adopt single diode model, the photovoltaic modelling was carried out using double diode model, as the modelling using single diode degrade at low irradiance. In addition the present work doesn’t rely on any simplification which can compromise the accuracy of the controller modelling, furthermore the SEPIC converter was employed since it offer more advantages instead of the traditional converter.
The present paper is organized as follows. In Section 2, the modelling of the PV system is presented. The Section 3, presents the design of the proposed controller. The simulations and discussions are illustrated in Section 4.
2. Modelling of PV system
The Photovoltaic system proposed in this paper consists of a photovoltaic module connected to a resistive load through a Single ended primary converter as shown in Figure 1.

Figure 1: Illustration of the proposed Photovoltaic system.
Where Vout, Vc2, VPV are the output voltage, the voltage across the capacitor C2, and the photovoltaic voltage respectively, Ipv and IL1 are the photovoltaic and inductor 1 currents, While G and T are respectively the irradiation and the Temperature.
The datasheet parameters of the polycrystalline photovoltaic module KD 245 GH are presented in Table 1.
Table 1: PV module datasheet
| Parameter | Value |
| Short-circuit current (Isc) | 8.91(A) |
| Open circuit voltage (Voc) | 36.9 (V) |
| Maximum current (Im ) | 8.23 (A) |
| Maximum voltage (Vm) | 29.8 (V) |
| Number of cells in series (Ns) | 60 |
| Temperature coefficient of current ( ki) | 5.35×10⁻³ (A/K) |
| Temperature coefficient of voltage (KV) | -0.133(V/K) |
2.1. Modelling of the SEPIC converter
The SEPIC is an acronym of (single ended primary inductor converter), which is a DC-DC converter capable to operate as boost or buck mode [8], that offer the possibility to raise or decrease the voltage at the output [9]. In addition the SEPIC converter makes the PV system operate at its maximum power point with ‘weak current ripples [10]. Furthermore it can work on any operating point by changing the duty cycle [11]. The converter is modelled mathematically based on these states [12] as shown in figure 2.
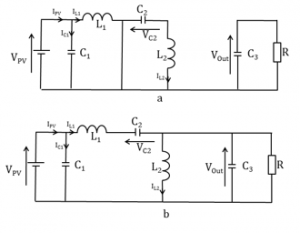
Figure 2: SEPIC converter circuit, (a) Equivalent circuit switch is ON (b) switch is OFF
When the commutator is on (u=1) as shown in figure 2-a. The capacitor C3 supplies energy to the load and the energy stored in the inductances increases, the inductor L1 is alimented from the input while the inductor L2 is feeded from the capacitor C2. The representation of state space can be described as
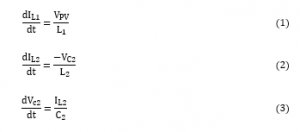
When the commutator is off (u=0) as shown in figure 2-b. The two inductors are discharged and the energy stored in the capacitors increases. The representation of state space can be written as:

The combination between the two state spaces can be expressed as:
where u=(0 or 1)
2.2. Modelling of the Photovoltaic module
In this work the modelling of a solar module is developed based on double diode model which is illustrated in figure 3, where the first diode describes the saturation currents due to diffusion mechanism, while the second diode describes the current due to recombination in the depletion zone.
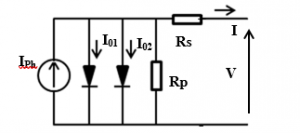
Figure 3: Illustration of the double diode model.
The output current of a solar cell is represented by:
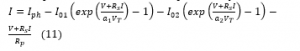
The unknown parameters such as: a1,a2,I01,I02,Iph,Rs and Rp. are extracted using a combination between the equation of three main operating points which are, the open circuit voltage, the short circuit current and the maximum power point. The objective is to find the equations of I01, I02, Rp and Iph which depend only of Rs, a1 and a2. The value of series resistance (Rs) and ideality factors (a1,a2) are obtained using a fast iteration by adjusting simulated and datasheet powers [13]. The extracted parameters are illustrated in Table 2.
The extracted parameters are integrated in a MATLAB algorithm to plot V-I and V-P curves as shown in Figs. 4, the simulation allow to predict the behaviour of the photovoltaic modules in different meteorological condition, thus when the temperature increases the open circuit voltage decrease while the short circuit current increase slightly which result a loss of generated power. On the other hand, when the solar irradiance increases both short circuit current and the open circuit voltage increase which raise the generated power.
Table 2: Extracted Parameters of KD 245GH module
| Parameter | Value |
| a1 | 1.005879 |
| a2 | 1.994120 |
| Iph (A) | 8.931164 |
| I01 (A) | 3.906668×10⁻¹⁰ |
| I02 (A) | 1.094485×10-06 |
| Rs (Ω) | 0.286199 |
| Rp (Ω) | 120.495147 |
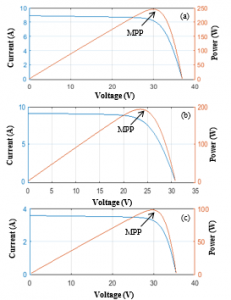
Figure 4: Generated current and power at 25°C – 1000 W/m² (a), 75°C – 1000 W/m² (b) and 25°C – 400 W/m² (c)
3. Proposed controller:
Figure 1 presents the schematic drawing of the proposed controller, it consists of a combination between Artificial Neural Network and backstepping controller. The ANN loop generates a voltage reference for every solar irradiation and temperature, which correspond to the maximum power point voltage, while the backstepping controller tracks the generated reference by adjusting the duty cycle.
3.1. Artificial Neural Network
Artificial neural network is a computational processing model based on artificial intelligence that is meant to simulate the functioning of a human brain , which consists of processing units interconnected by nodes [14]. The ANN architecture consists of three layers as shown in Figure 5, The input layer receives various forms and structures of information based on an internal weighting system, the hidden layer is where artificial neurons get an ensemble of weighted inputs and generates an output via an activation function, while and the output layer receives data from hidden layer and gives the results of the ANN [15, 16].

Figure 5: Proposed Neural network hierarchy
In this work the input layer was designed with two neurons, irradiation and the temperature, a database of 158 cases was created by increasing the irradiance by a step of 5 K from 278 K to 333 K and changing the irradiance for each temperature from 200 to 1050 W/m². The hidden layer was created with 100 neurons as shown in Figure 5. The output layer has only one neuron which corresponds to the voltage at maximum power of the 158 pair irradiance temperature.
3.2. Integral backstepping
The backstepping controller is designed to track the reference voltage generated by the artificial neural network by adjusting the duty cycle of the converter. The control law is generated based on Lyapunov stability analysis. The design of the controller is as follows:
The tracking error is defined as the difference between photovoltaic and reference voltages:
![]()
An integral action is added in order to improve the
tracking precision as follow:
![]()
The tracking error becomes:

To guarantee the asymptotic stability, the Lyapunov function has to be negative definite derivative:

The second error represents the difference between the inductor and the desired current:
The derivative of photovoltaic current with respect to the time can be expressed as:
![]()
By differentiating the equation (11) with respect to the voltage the derivative of photovoltaic current is obtained:

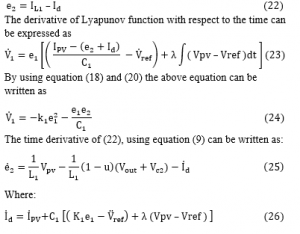
In order to guarantee the asymptotic stability of the system and the convergence of the errors e1 and e2 to zero, a composite Lyapunov function V2 is defined as:

4. Simulation results
In order to study the performance of the proposed method, a simulation was carried out in Matlab software. The parameters of the simulation are illustrated in Table 3.
Table 3: Parameters of the SEPIC
| Parameter | Value |
| Inductor 1 (L1) | 2.5 mH |
| Inductor 2 (L2) | 2.5 mH |
| Capacitor 1 (C1) | 4500 uF |
| Capacitor 2 (C2) | 79 µF |
| Capacitor 3 (C3) | 2400 µF |
| Constant (λ ) | 1 |
| Constant (K1 ) | 104 |
|
Constant (K2 ) Load resistor (R) |
104 50Ω |
| Switching frequency (f) | 7 KHz |
The system being simulated into different temperature and irradiation condition as shown in Figure 6, During the first case the [0s, 20s], the PV module is consider operating under the irradiation of the maximum power point while the temperature was raised to 318 K to simulate the temperature effect. In the second case [20s, 40s], the irradiation drop smoothly from 1000 W/m² to 600 W/m² while the temperature decrease between two consecutive levels from 318 k to 307 K. In the last case [40s, 60s], the temperature is considered constant in 298K while the irradiation increase among two successive stage to reach 1000 W/m² thus the PV module is considered operating in the maximum power point.
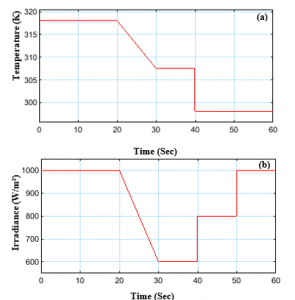
Figure 6: Temperature (a) and Irradiation (b)
Figure 7 shows that the variations in temperature and irradiation cause a slight variation in voltage and a large variation in current and power. By comparing the proposed method with the method proposed by [7] it can be seen that the proposed method bring reach the reference voltage in 25 ms, Figure (b), with high accuracy, in contrast the proposed method in [7] reaches the desired voltage with a delay of 60 ms with large oscillations. In addition the obtained curves exhibit fast and good reactions when sudden variation in temperature and irradiance occurs.
Figure 8 shows the output current, voltage and power of the PV module generated at the output of the SEPIC converter using the proposed method with the result proposed by [7]. As can be seen from the figures (a), (b) and (c), the obtained curves using sliding mode controller present large oscillations and the use of the proposed method allow reducing significantly the magnitude of the fluctuation, which guarantees good performance in the maximum point tracking.
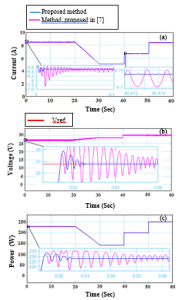
Figure 7: Photovoltaic Current (a), Voltage (b) and Power (c), Input.
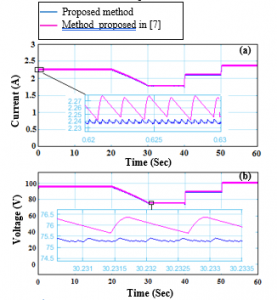

Figure 8: SEPIC output Current (a), Voltage (b) and Power (c).
5. Conclusion
In this paper an integral backstepping controller for maximum power point tracking is proposed. In order to increase the performance of tracking the controller was developed by combining backstepping controller and artificial neural network (ANN). The photovoltaic modelling was carried out using double diode model as the modelling using single diode degrade at low irradiance, and in order to reduce the current ripples the single ended primary inductor converter (SEPIC) has been employed. The simulation has been done in Matlab/Simulink software, the results show that the proposed method tracks the reference voltage with good accuracy and fast convergence speed, in addition the photovoltaic power reaches maximum power in less than 25 ms. Furthermore the obtained curves show that there are no oscillations in the output voltage, current and power. Thus the proposed method presents a fast and stable reaction when the environmental conditions changes, which confirms the effectiveness and the stability of the proposed method.
Conflict of Interest
The authors declare no conflict of interest.
- B. Keyte, D.A. Locher, The Complete Lean Enterprise: Value Stream Mapping for Administrative and Office Processes, CRC Press, 2004.
- R. Martichenko, K. Von Grabe, Building a Lean Fulfillment Stream, Lean Enterprise Institute, 2010.
- M. Imai, Kaizen: La clave de la ventaja competitiva japonesa, Compañía Editorial Continental, 2000.
- J.P. Womack, D.T. Jones, Lean Thinking: Banish Waste and Create Wealth in Your Corporation, Simon & Schuster, 1996.
- J.K. Liker, The Toyota Way: 14 Management Principles from the World’s Greatest Manufacturer, McGraw-Hill, 2004.
- S. Emmett, Excellence in warehouse management, Wiley, 2005.
- M. Malindzakova, D. Zimon, “Design Supply Cycle for Inventory Management,” TEM Journal, 8(3), 894-899, 2019, doi: 10.18421/TEM83-29.
- S. Kumar, D. Choe, S. Venkataramani, “Achieving customer service excellence using Lean Pull Replenishment,” International Journal of Productivity and Performance Management, 62(1), 85-109, 2012, doi: 10.1108/17410401311285318.
- L. Cuatrecasas-Arbós, J. Fortuny-Santos, P. Ruiz-de-Arbulo-López, C. Vintró-Sanchez, “Monitoring processes through inventory and manufacturing lead time,” Industrial Management & Data Systems, 115(5), 951-970, 2015, doi: 10.1108/IMDS-12-2014-0375.
- R. Rodríguez-Méndez, D. Sánchez-Partida, J.L. Martínez-Flores, E. Arvizu-Barrón, “A case study: SMED & JIT methodologies to develop continuous flow of stamped parts into AC disconnect assembly line in Schneider Electric Tlaxcala Plant,” IFAC-Papersonline, 48(3), 1399-1404, 2015, doi: https://doi.org/10.1016/j.ifacol.2015.06.282.
- D. Sánchez-Partida, R. Rodríguez-Méndez, J.L. Martínez-Flores, S.O. Caballero-Morales, “Implementation of Continuous Flow in the Cabinet Process at the Schneider Electric Plant in Tlaxcala, Mexico,” Interfaces, 48(6), 566-577, 2018, doi: 10.1287/inte.2018.0966.
- Y. Ge, Y. Ye, “A bibliometric analysis of inventory management research based on knowledge mapping,” The Electronic Libray, 37(1), 127-154, 2018, doi: 10.1108/EL-11-2017-0241.
- Y. Lin, B. Liang, X. Zhu, “The effect of inventory performance on product quality: The mediating effect of financial performance,” International Journal of Quality and Reliability Management, 35(10), 2227-2247, 2018, doi: 10.1108/IJQRM-08-2017-0162.
- N.A. Karim, A. Nawawi, A.S. Salin, “Inventory control weaknesses – a case study of lubricant manufacturing Company,” Journal of Financial Crime, 25(2), 436-449, 2018, doi: 10.1108/JFC-11-2016-0077.
- R.H. Teunter, M.Z. Babai, A.A. Syntetos, “ABC Classification: Service Levels and Inventory Costs,” Production and Operations Management, 19(3), 343-352, 2009, doi: 10.1111/j.1937-5956.2009.01098.x.
- J. Shook, T. Narusawa, Kaizen express: Fundamentals for your Lean Journey, The Lean Enterprise Institute, 2009.
- D. Kumar, D. Kumar, “Managing the essential medicines stock at rural healthcare systems in India,” International Journal of Health Care Quality Assurance, 31(8), 950-965, 2018, doi: 10.1108/IJHCQA-12-2016-0186.
- E.M. Goldratt, J. Cox, The Goal: A Process of Ongoing Improvement, North River Press, 1986.
- E.M. Goldratt, J. Cox, The Race, North River Press, 1986.
- G. Richards, S. Grinsted, The logistics and supply chain toolkit, Kogan Page Limited, 2016.
- K.B. Ackerman, Auditing Warehouse Performance, Ackerman Publications, 2003.
- H. Singh, A. Singh, “Application of lean manufacturing using value stream mapping in an auto-parts manufacturing unit,” Journal of Advances in Management Research, 10(1), 72-84, 2018, doi: 10.1108/09727981311327776.
- T.M. Kubiak, D.W. Benbow, The certified Six Sigma Black Belt Handbook, American Society for Quality, 2009.