Phosphorus partition, phytic acid concentration and grains productivity of beans cultivars as a response to phosphate nutrition
Ritieli Baptista Mambrin1, Darlene Sausen2, Diogo Moura1, Ivan Ricardo Carvalho3, Vinícius Jardel Szareski4 and Giordano Gelain Conte4
1Centro De Ensino Superior Riograndense, Marau, RS, Brasil.
2Universidade Federal do Rio Grande do Norte, Parnamirim, RN, Brasil.
3Universidade Regional do Noroeste do Estado do Rio Grande do Sul, Ijuí, RS, Brasil.
4Universidade Federal de Pelotas, Capão do Leão, RS, Brasil.
Abstract
The objectives of this work were to evaluate the phosphorus partition in tissues, in different growth stages, the phytic acid concentration in grains and the beans yield, as a response to the phosphorus supply in the culture environment, and the analysis of the association between these characters. The experiments were conducted in non-acclimatized greenhouse. The data was submitted to variance analysis, considering all the effects as fixed, with exception of the error, which was considered random. Since it was significant the effect of the triple interaction phosphorus concentration x genotype x growing season (C x G x E), it was realized the deployment of it in three double interactions with the use of complex variance. The phosphorus values in common bean leaves at initial growing stages are close to the ones found in grains. For the genotypes Pérola and IPR88 Uirapurú, the highest phosphorus values in plants tissues and of phytic acid occurred in phosphorus concentrations in the nutritive solution between 1.38 and 2.00 mmol L-1. Phosphorus concentrations in the nutritive solution between 1.37 and 1.96 mmol L-1 result in higher phosphorus concentration in leaves at third trifoliate leaf, in stem at flowering, in leaves, stem and legumes at legumes filling and grains at maturation. Also, higher phytic acid concentration in grains, at the fall-winter and spring-summer seasons. The evaluation of phosphorus concentration in the vegetal tissues from the legume filling stage is promising and allows indirect selection to grains productivity.
Highlighted Conclusion
The concentration of P in plant tissues during the legume filling stage is promising and allows indirect genetic selection to grains productivity.
Communications in Plant Sciences | 2021 | vol.11 | p.046-056
DOI: 10.26814/cps2021006 | Article code: cps2021006
Keywords: Phaseolus vulgaris L., Growth stages, Phosphorus concentration, Correlation analysis
Correspondence to: Ivan Ricardo Carvalho <carvalho.irc@gmail.com>

Submission on September 17, 2020 | First Publication on August 18, 2021 | Open Access
Authors declared no conflict of interest
Article licensed under a Creative Commons Attribution-NonCommercial 4.0 International
Phosphorus partition, phytic acid concentration and grains productivity of beans cultivars as a response to phosphate nutrition
INTRODUCTION
The common bean (Phaseolus vulgaris L.) is present in the daily diet of most Brazilians, being one of the principal protein sources, collaborating to the adequate ingestion of minerals, such as iron, calcium, zinc and phosphorus (Hefni et al. 2010; Carvalho et al. 2016). The phosphorus (P) is a necessary element to the human health equilibrium, and its deficiency is capable of causing serious problems, as defects in the neural tube in babies, several forms of dementia and cardiovascular problems in adults, also the skeleton and hematological neuromuscular abnormality (Khanal et al. 2013).
Healthy individuals normally possess a hexogen source of phosphorus above the daily amounts recommended, due to the high availability of this mineral in the food (Oliveira 2007). Therefore, the situations of lack of this mineral from food ingestion are rare. Although, elderly people, or those that have nutritional restriction or have a condition that prevents the absorption or increasing the nutrients excretion, it is not uncommon to occur phosphorus deficiency (Khanal et al. 2013). In the chronic alcoholism, the reduction of food ingestion and nutrients absorption, as well the increase in the phosphorus excretion in the urination, are factors that contributes to the mineral deficiency (Oliveira 2007).
However, the increase in the phosphorus concentration in the plant and/or grains of common bean must be associate to high yield, since it is a highly valued characteristic and one of the goals of breeding programs. The plant growth, the grains yield and the nutritional status of beans are affected by several factors, highlighting the phosphate fertilizing realized in the cultivation system (Pereira et al. 2011). The amount of phosphorus in the vegetal tissue reflects its nutritional status, and it is influenced by genetic and environmental factors (Silva 2006; Rigo et al. 2018). Since the minerals concentration and grains yield diverge according to the cultivar and the conditions in which it is cultivated, the different minerals exigency will be inconstant.
It is known that the ingestion of 86 g of cooked beans contain 120 mg of phosphorus, being this amount enough to furnish the daily amounts necessary by an adult person, which varies from 0.8 g to 1.2 g (Monteiro and Vannucchi 2010). Even though exists genetic variability among cultivars, the common bean presents high phosphorus concentration on its grains, varying from 4.5 to 7.2 g kg-1 of dry matter (DM) (Mesquita et al. 2007).
Common bean plants absorb phosphorus until its growing cycle is finished, and the nutrient maximum accumulation occurs in the shoot, at the grain physiologic maturity (Vieira et al. 2009; Szareski et al. 2016). The phosphorus concentrates mostly in grains, and it happens, according to Stauffer and Sulewski (2004), because this mineral is linked to metabolic processes in the plant, and because it is mobile, it stays concentrated in active growing areas. Pegoraro et al. (2014) evaluating the growth thru the biomass production and nutrient absorption in the yield compounds and shoot of bean, concluded that, until the 30 days after emergence, the leaves were responsible for the relative accumulation of, approximately, 80% of the absorbed phosphorus. However, from the beginning of reproductive stages the nutrient proportion in the leaves starts to decrease until the physiologic maturation, where the grains are responsible for the highest macronutrient accumulation.
The phosphorus in the bean grains is linked to organic reserve compounds such as the phytates, which are involved in the regulation of the amid synthesis during the grains filling (Coelho et al. 2002). The phytates are salts derived from phytic acid, being the principal phosphorus format in the cereals and leguminous grains, representing, approximately, 70% of the phosphate content (Fantini et al. 2008). Its presence can reduce the digestive exploitation of nutrient as calcium, zinc, phosphorus, iron and cupper, due to its ability to form chelates with divalent ions, forming soluble complexes resistant to the action of the intestinal tract (Benevides et al. 2011; Vargas et al. 2018). Although, recently it has been demonstrated that phytates also present benefic effects, working as anti-oxidant and anti-carcinogenic (Delfino et al. 2010).
The phosphorus bioavailability in the common bean grains can vary according to the called anti-nutritional factors, as the phytates (Barrueto-Gonzalez 2008). The unavailability of the element occurs due to the absence of the phytase enzyme in the digestive tract, causing that the phytate to not be broken and, in this manner, the phosphorus is not released and absorbed by the human organism (Brinch-Pederson et al. 2007). The phytates can reach concentrations of 2% of the bean seeds total mass (Israel et al. 2006). However, these values can variate according to the genotypes, and it is also affected by environmental conditions, and the amount of available phosphorus to the plant absorption (Ariza-Nieto et al. 2007).
The knowledge of the variation in the bean plant chemical composition during the several growth stages, constitute a high valued characteristic to the clarification of basic problems in the human nutrition, in the fertilization, and as a tool to explore the higher yield thru genetic breeding. For common beans, it was not found studies in the literature that evaluated the phosphorus nutrition, in different growing seasons, considering the distribution of this mineral in the tissues, as well, the phytic acid concentration in grains, with the intent to comprehend the real biological value.
As said, the main objectives of this work were to evaluate the phosphorus partition in tissues, in different growth stages, the phytic acid concentration in grains and the beans yield, as a response to the phosphorus supply in the culture environment, and the analysis of the association between these characters.
MATERIAL AND METHODS
The experiments were conducted in non-acclimatized greenhouse of the Department of Phytotechny of the Federal University of Santa Maria (UFSM), in the municipality of Santa Maria, Rio Grande do Sul, Brazil (latitude 29º42´S, longitude 53º49´W and 95 m of altitude). The experimental design was totally randomized with plots sub-sub-divided in bands, using three repetitions. The main plots were constituted of five phosphorus concentrations supplied to the plants by fertigation (0.5, 0.9, 1.3, 1.9 and 2.3 mmol L-1). The sub-plots were composed by two common bean cultivars, Pérola and IPR88 Uirapurú. The sub-sub-plots were organized in two growing seasons, fall-winter (sowing in March 28, 2013) and spring-summer (sowing in September 02, 2013).
It was used five closed soilless cultivating devices, which were built and described by Domingues et al. (2014). In each device it was distributed 48 polypropylene containers with 4 L of capacity, filled with 5 cm of gravel and medium sand (granulometry of 1.2 to 2.4 mm), previously washed with sodium hypochlorite at 1%. Four seeds were sown per container and, in the stage with primary leaves opened (V2) it was realized the paring, keeping only two plants per container.
The plants were fertigated with nutritive solution, and the supplied phosphorus concentration varied from a device to other, being: 57.51, 103.52, 149.54, 218.55 and 264.57 mg L-1 of NH4H2PO4, equivalent to 0.5, 0.9, 1.3, 1.9 and 2.3 mmol L-1 of phosphorus, respectively. In order to maintain the ionic equilibrium, there was the nitrogen concentration change (NH4NO3), that were, 80 mg L-1, 64 mg L-1, 48.4 mg L-1, 24 mg L-1 and 8 mg L-1. The other macronutrients (KNO3 – 404.40 mg L-1, Ca (NO3)2 – 318.74 mg L-1, MgSO4 – 197.12 mg L-1) and micronutrients (Na2MoO4 – 0.03 mg L-1, H3BO3 – 0.26 mg L-1, CuSO4 – 0.06 mg L-1, MnSO4 – 0.50 mg L-1, ZnSO4 – 0.22 mg L-1 and iron chelate -1.0 mg L-1), possessed equivalent amounts in the various devices.
The solutions were individually supplied, in three daily shifts of fertigation in the fall-winter season, and five shifts in the spring-summer season, with 15 minutes of duration each. The solutions pH was kept in 5.5 to 6.5 range, being added NaOH or H2SO4 in the 1N concentration. The electric conductivity (CE) was preserved in 1.0 to 1.5 mS range, by addition of water or aliquots of new nutritive solution, when presented a deviation superior to 10% in relation to its initial value.
For the determination of the phosphorus concentration in the vegetal tissues, in the growth stages of third trifoliate leaf (V4), flowering (R6) and legumes filling (R8), characterized according to the phenological scale describe by Fernandez et al. (1982), were harvested three plants of each cultivar, in every repetition. It was fractioned in leaves, stem and legume, separately conditioned in paper bags, and dried in kiln of forced air (60 to 70 ºC), until the obtaining of constant mass. The rest of plants were conducted until maturation (R9), when it was determined the phosphorus concentration in grains.
The samples of leaves and stems in the growth stages of V4, R and R8, legumes at R8 and grains at R9 were grinded with the assistance of an analytic knife micro grinder (Q298A21; QUIMIS, SÃO PAULO, BRAZIL). It was grinded until obtaining a flour with particles of approximately 1 mm. Aliquots of 0.5g of flour were reserved, and then were assimilated in 5 ml of acid solution composed of nitric acid (HNO3) (ULTRAPURO, PROQUÍMIOS, RIO DE JANEIRO, BRAZIL) and perchloric acid (HClO4) (ULTRAPURO, VETECQUÍMICAFINA, RIO DE JANEIRO, BRAZIL), in the volumetric proportion of 3:1, according to the method described by Souza et al. (2012). The phosphorus concentration, expressed in g kg-1 of sample dry matter, was determined with a reading from optical emission spectrophotometer (AA-7000; SHIMADZU, SÃO PAULO, BRAZIL), with wave length of 660 nm.
From the samples of the flour of beans at R9 it was quantified the phytic acid concentration, in two repetitions. For it, the methodology described by Latta and Eskin (1980) was followed and used the sodium phytate solution as pattern.
The initial extraction of the phytic acid was realized in aliquots of 2,0 g of bean flour, being added 40 ml of HC1 2.4% (0,65 N). After 1 hour and 30 minutes in fast agitation in water bath (500/D; SERVYLAB, RIO GRANDE DO SUL, BRAZIL) and 10 minutes in centrifugal (MTDIIIPlus; LOGEN SCIENTIFIC, LAGOS, NIGERIA) in 3500 rpm, it was realized the supernatant filtering. It was transferred to a glass column, previously prepared with glass wool and 0.5 g of “bio-rad” resin, which was activated which the addition of 15 ml of deionized water, 15 ml of NaCl 0,1M solution and 15 ml of NaCl 0.7M solution. After the passage of this last one in the column, it was collected to proceed the phytate determination. In this eluate was added 1 ml of reagent of color of Wade (0.03% FeCl3 6H2O and 0.3% sulfosalicylic acid in H20 deionized) and, after run 15 minutes, it was realized a reading of the phytic acid (mg kg-1 of dry matter – DM) in spectrophotometer UV/visible, in band of 500 nm (SP-220; BIOESPECTRO, SÃO PAULO, BRAZIL).
The data was submitted to variance analysis, considering all the effects as fixed, with exception of the error, which was considered random. Since it was significant the effect of the triple interaction phosphorus concentration x genotype x growing season (C x G x E), it was realized the deployment of it in three double interactions with the use of complex variance. When occurred the significance of the phosphorus concentration supplied in the fertigation, it was realized the regression analysis, adjusting it to the equation of higher significant degree. In the cases where there was significance of genotype or growing season, it was used the F test, at 5% of probability to compare means.
The Pearson correlation analysis was estimated thru the phenotypic matrix among the ten evaluated characters. The significance of the coefficients was evaluated by t test (value of p ≤ 0.005). The statistics were realized with the use of Microsoft® Office Excel and the softwares Sisvar (Ferreira 2011), Genes (Cruz 2013) and Sigma Plot (Sigmaplot 2012).
RESULTS AND DISCUSSION
According to the variance analysis (data not shown), it was possible to evidence the significant interaction of phosphorus concentration x genotype x growing season (C x G x E) to the phosphorus concentration in leaves and stem at R6, leaves in R8 and grains at R9. In this manner, it is deducted that the simple effect of a single isolate factor was not the same in all levels than the other factors. Until this moment, in the researches involving common beans, it was not found similar works to this, which study the effect of triple interaction. However, for the soybean culture, De Paula (2011), observed significant triple interaction to phosphorus concentration x genotype x growing season to phytic acid in grains, diverging from the results found in this study.
For the characters that the triple interaction (C x G x E) was not significant – phosphorus concentration in leave at V4 and stem at R8 and phytic acid concentration in grains, it was observe significance from the double interaction phosphorus concentration x genotype. This interaction represents the fact of the alteration of the phosphorus concentration supplied in the fertigation modifies the beans genotypes answer to the phosphorus and phytate accumulation in plants and grains of beans. Cunha et. al (2014), in a similar manner, studying the effect of phosphate fertilizing in bean cultivars, concluded that the phosphorus concentration in leaves was influenced by the interaction phosphorus doses x cultivars. The same to Coelho et al. (2002), researching nutritive solution to compare eleven bean genotypes in relation to the phosphorus concentration in grains and phytic acid, showed significant interaction phosphorus concentration x genotype to phytic acid.
Considering the phosphorus concentration in leaves at V4, in stem at R8 and in legumes at R8, and the phytic acid concentration in grains, there was significance to the interaction phosphorus concentration x growing season (C x E). In this manner, it was verified that the environmental conditions during the cultivation of common beans plants influenced the phosphorus and phytic acid accumulation in the vegetal tissues. However, in beans experiments conducted to evaluate the phosphorus effect and its partition in vegetal tissues, normally, were conducted in field condition and/or in only one growing season (Petrilli 2007; De Paula 2011; Cunha et al. 2014), making difficult the comparing of the results obtained in this work.
Similarly to the exposed previously, there was no significant triple interaction, although the interaction genotype x growing season (G x E) was significant to the phosphorus concentration in leaves at V4, in stem at V4 and R8, in legumes at R8 and to concentration in grains. It represents the genetic variability expression because of the environmental variations that occurred in different growing seasons (Storck et al. 2011).
The coefficient of variation values (CV) oscillated from 4.3% (phytic acid concentration in grains) to 14.7% (phosphorus concentration at R8). Pereira et al. (2011), researching 34 bean genotypes from the University of Santa Catarina germplasm, obtained CV values inferior to 10% to phosphorus concentration and phytic acid in grains in experiments with nutritive solution.
By observing the general means, of the phosphorus concentration in plants tissues, it is possible to perceive that in the initial developing stages occurs higher nutrient accumulation in leaves, when compared to the accumulation in the stem (developing stages of V4 and R6). As the development cycles advance, the phosphorus continues to concentrate in the leaves (stage R8), although, in lower amounts, and afterwards in grains (stage R9). It occurs because, in common beans, the phosphorus concentration in leaves and stem lower with the plant maturity, once the concentration is high in the petiole and stem in the begging of growth and then gradually reduces until the end of the cycle (Hanway and Weber 1971).
In this manner, the phosphorus concentration value observed in bean leaves in initial growth stages are very close to the ones found in grains. In this manner, the use of young bean leaves as source of phosphorus in the human diet must be better evaluated. The consummation of common bean green leaves is common in some African countries (Lamb et al. 1985), it is due to the previous knowledge about its high protein, iron and fiber concentration, overcoming values found in grains (Fonseca et al. 2002). Although, it is still not found researches in literature that have evaluated the usage of bean leaves as source of phosphorus in human diet.
Quadratic answers due to the phosphorus concentration supplied in fertigation were obtained in common bean cultivars, for the characters phosphorus concentration in leaves at V4 (Figure 1A), in stem at R6 (Figure 1C), in leaves at R8 (Figure 1D) and in grains at R9 (Figure 2B), and the phytic acid concentration in grains (Figure 2C). In these cases, respectively, the lower values to phosphorus concentration in tissues, grains yield and phytic acid were verified in phosphorus concentration of 0,5 mmol L-1 supplied by fertigation. However, the higher responses for these characters occurred in concentrations of: 2.30 mmol L-1 – Pérola and 2.17 mmol L-1 – IPR88 Uirapurú (Figure 1A); 1.96 mmol L-1 – Pérola and 1.95 mmol L-1 – IPR88 Uirapurú (Figure 1C); 2.17 mmol L-1 – Pérola and 2.30 mmol L-1 – IPR88 Uirapurú (Figure 1D); 1.59 mmol L-1 – Pérola and 1.58 mmol L-1 – IPR88 Uirapurú (Figure 2B); and 1.87 mmol L-1 – Pérola and 1.73 mmol L-1 – IPR88 Uirapurú (Figure 2C).
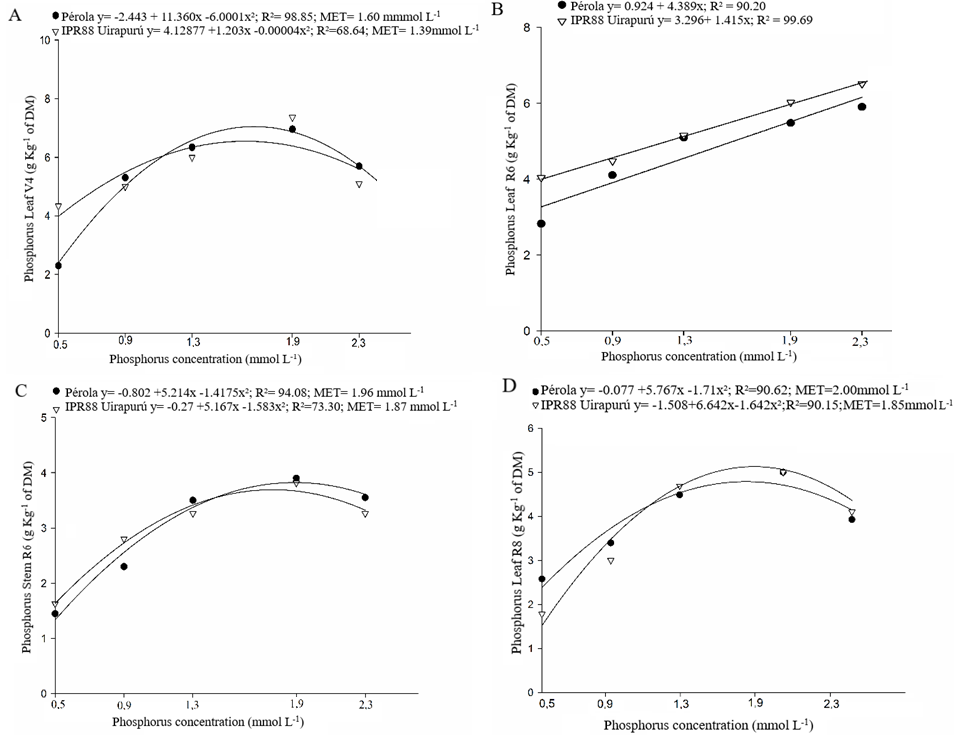
Figure 1. Phosphorus concentration in leaves at third trifoliolate leaf – V4 (A), leaves and stem at flowering – R6 (B) and (C), in leaves at legume filling – R8 (D), obtained in five phosphorus concentration in the nutritive solution to the cultivation of two common bean genotypes (Pérola and IPR88 Uirapurú).
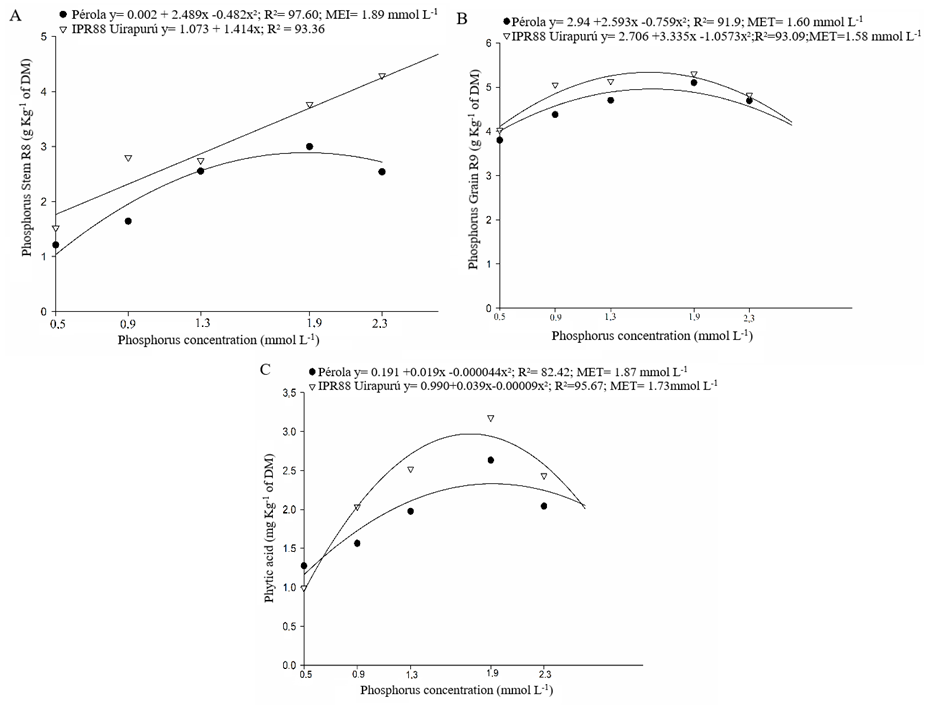
Figure 2. Phosphorus concentrations: in the stem at legume filling growing stage – R8 (A), and at grains in maturation – R9 (B); and phytic acid concentration in grains at maturation – R9 (C), obtained in five phosphorus concentrations in the nutritive solution to the cultivation of two common bean genotypes (Pérola and IPR88 Uirapurú).
In phosphorus values higher and lower to the points of maximum technic efficiency, there was lower absorption and nutrient accumulation in the vegetal tissues. This fact can be justified by the localized form in which the nutrient was made available to the plants, once it is a nutritive solution. Besides, the high phosphorus foliar concentration, in initial growing stages, can explain the increase in the grain productivity, observed in this condition (Floss 2011). It is affirmative considering the reports in the literature about the strict correlation among the nutrient foliar content and the bean productivity (Silva et al. 2010).
To the moment, it was not found in literature, researches about the phosphorus concentration influence available in the nutritive solution, in the nutrient concentration in vegetal tissues, grains productivity and phytic acid in grains of bean plants. However, in field conditions, Santos et al. (2011) found diverging results to the ones obtained in this work, in the evaluation of the answers of common bean plants to the fertilization with different phosphorus doses in the soil. The authors concluded that the nutrient content in the shoot (leaves and stem) presents a linear answer due to phosphorus doses. As well, Petrilli (2007) realizing a research about the nutrient accumulation in leaves, grains and grains yield in the cultivar Pérola, under effect of different doses and modes of phosphorus application on soil, alleged that the phosphorus amount in grains and its yield increased with the increment of phosphorus doses, presenting a linear ascension. These differences of answers are because there is disparity of the field cultivation to the cultivation in controlled environment.
For the characters phosphorus concentration in leaves at R6 (Figure 1B) and stem at R8 (Figure 2A), the cultivar IPR88 Uirapurú presented a linear answer due to the phosphorus concentration increase supplied in the fertigation. In this manner, it was not possible to estimate the phosphorus concentration that proportionated the higher phosphorus accumulation in leaves and stem to the cultivar IPR88 Uirapurú in these phonological stages.
The phosphorus concentration of 1.60 mmol L-1 to the cultivar Pérola and of 1.58 mmol L-1 to the cultivar IPR88 Uirapurú, used in the fertigation, guaranteed the higher nutrient accumulation in the bean grains (Figure 2B). It was not the highest concentrations made available to the plants, but even though, it was the ones that propitiate the highest phosphorus concentration in the grains. This fact can be seen as promising to genetic breeding, once it can be an indicative of the efficiency of the nutrient usage, making necessary the realization of more depth studies about efficiency and response of these cultivars on phosphorus usage. Thus, it may be possible to obtain a product with the best nutritional quality, which can be supplied to the population at reduced costs.
The search for food that can furnish the nutritional and protein shortage, with quality and low cost, is an imminent necessity (Ribeiro 2010). The phosphorus concentration increase in common bean grains is benefic to the human nutrition, due to the delicate link of its bioavailability (Oliveira 2007). In addition, it brings significant contributions to the agricultural production, because the phosphorus is necessary to the embryo formation, reserve organs and the seeds chemical composition, consequently, affecting its quality and productive potential (Oliveira et al. 2014). It also increases the nutrient availability at initial stages of symbiotic infection and nodules formation, particularly under conditions of low phosphorus availability.
The concentrations of 1.87 mmol L-1 to the cultivar Pérola and of 1.73 mmol L-1 to the cultivar IPR Uirapurú, supplied in the fertigation, propitiated the higher phytic acid concentrations in grains (Figure 2C). In relation to seeds, the search for high phytic acid concentrations becomes important once they are secondary phosphorus reserves used as subside in vital functions of seeds, mostly in the germination (Silva et al. 2011a). It is known that during the storage, fermentation, germination, processing and digesting of grains and seeds, the phytic acid can be partially dephosphorylated, producing pentaphosphate (IP5), tetraphosphate (IP4), triphosphate (IP3) and possibly, inositol diphosphate (IP2) and monophosphate (IP1), by action of endogen phytases (Benevides et al. 2011). However, only IP5 has negative effect in the mineral bioavailability. In this manner, the phytic acid increase, which normally increases with the rise of phosphorus in grains, is not an indicative that the phosphorus is little available to the human absorption.
The behavior of bean cultivars can be expressed by a second-degree equation, in both growing season (season 1 and 2), to the characters of phosphorus concentration in leaves at V4 (Figure 3A), in stem at R6 (Figure 3C), in leaves at R8 (Figure 3E), in stem at R8 (Figure 3D), in legumes at R8 (Figure 4A), in grains at R9 (Figure 4B), and phytic acid concentration in grains (Figure 4C). For these characters, phosphorus concentrations in the nutritive solution of 1.37 to 2.29 mmol L-1 propitiated the maximum technical efficiency. In researches about the phosphorus usage in common bean genotypes, Silva et al. (2014) observed an adjust in a polynomial model of second degree to phosphorus accumulation in shoot (leaves and stem) on common bean plants, where the concentration of 2.37 mmol-1 in the nutritive solution was the best one.
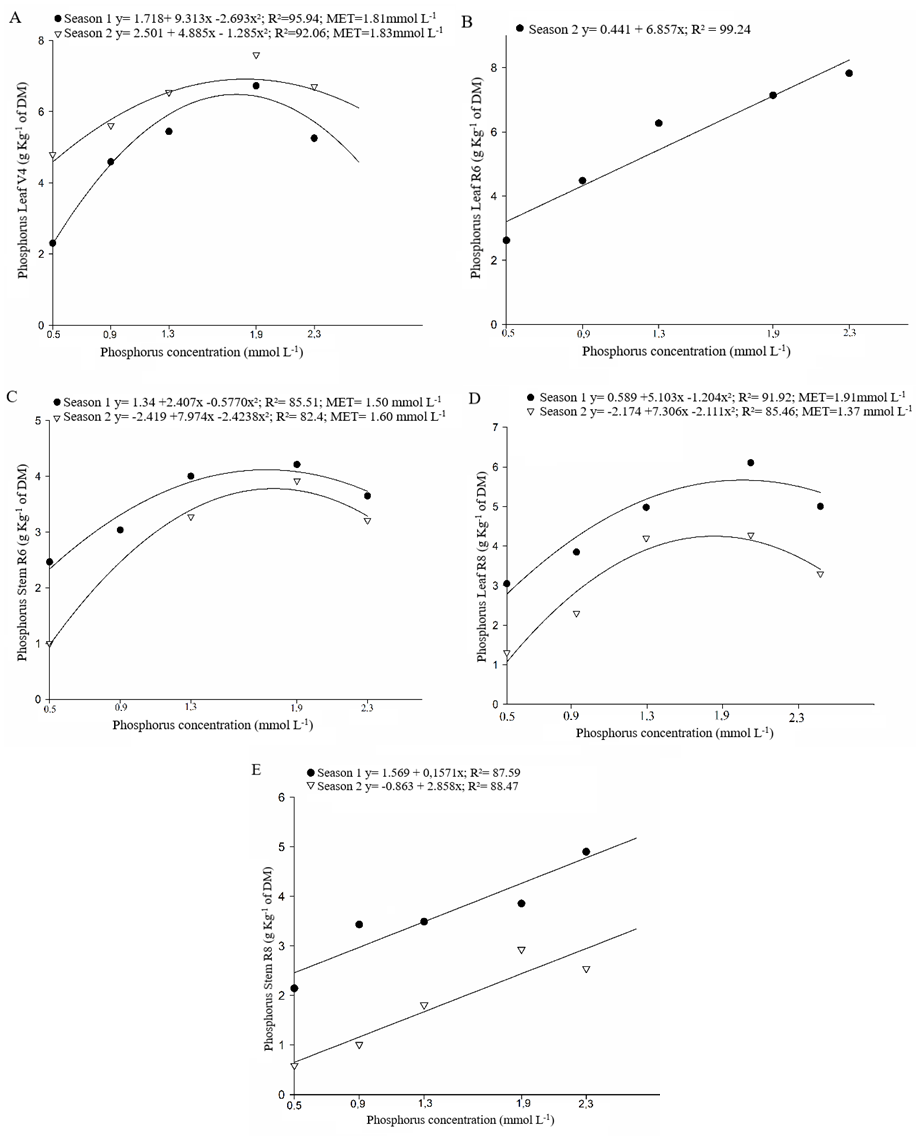
Figure 3. Phosphorus concentration: in leaves at developing stage of third trifoliate leaf – V4 (A), in leaf and stem at flowering – R6 (B) and (C), in leaf and stem at legume filling – R8 (D) and (E), obtained in five phosphorus concentrations in the nutritive solution, in growing seasons of fall-winter (season 1) and spring-summer (season 2).
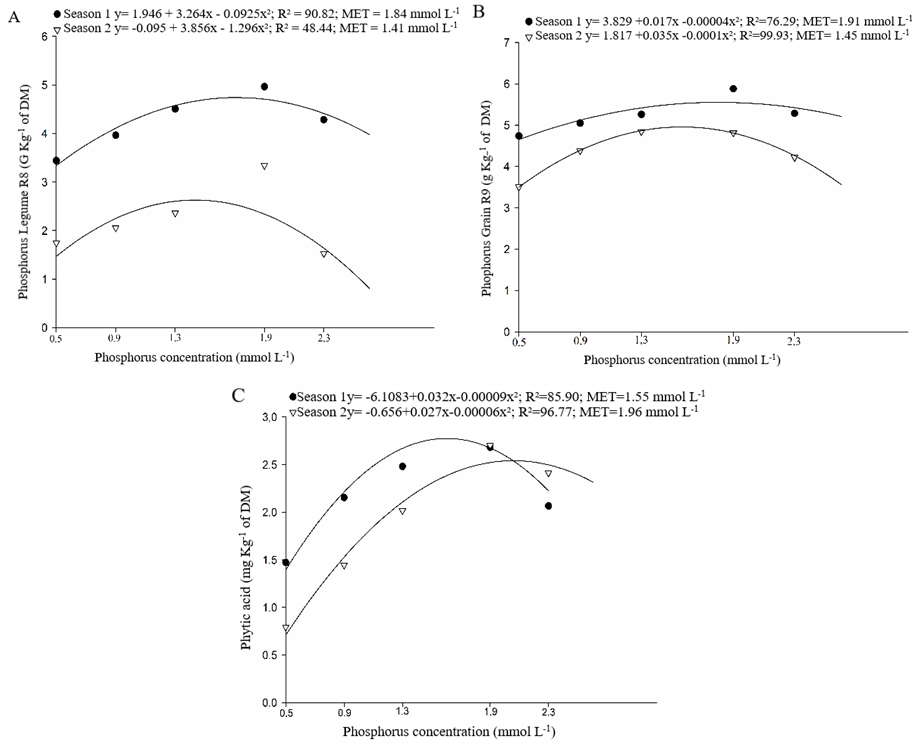
Figure 4. Phosphorus concentration: in legumes at developing stage of legume filling – R8 (A), in grains at maturation – R9 (B) and phytic acid in grains at maturation – R9 (C), obtined in five phosphorus concentration in nutritive solution, in growing seasons of fall-winter (season 1) and spring summer (season 2).
Carvalho et al. (2014) evaluating different bean cultivars, under the effect of phosphorus doses combination on soil, verified significance to the interaction phosphorus concentration x growing season to the phosphorus accumulation in the shoot and grains in plants of the cultivar Pérola. Although, diverging from results found in this study, the same authors concluded that the cultivar IPR88 Uirapurú did not differ between the first and second growing season, for this character. Observing the Figures 4A, 4B and 4C it is noted the difference of the growing season on the averages of phosphorus accumulation in legumes, in grains, and phytic acid, where, for all the characters, the fall-winter (season 1) cultivation was the most favorable.
At the Table 1 it was observed that for the characters phosphorus concentration in leaves at V4 and leaves at R6, which means, in the initial growing stage, when occurred difference among two cultivars, the IPR88 Uirapurú presented the highest means. As the plants advanced in its cycle, for the characters phosphorus in leaves, in stem and legumes at R8, in grains at R9, grains yield and phytic acid concentration in grains, when there was difference among cultivars, the Pérola highlighted with higher values.
Table 1. Mean values obtained to phosphorus concentration: in leaves and stem at third trifoliate leaf – V4 (P Leaf V4, g Kg-1 of DM; P Stem V4, g Kg-1 of DM), in leaves and stem at flowering – R6 (P Leaf R6, g Kg-1 of DM; P Stem R6, g Kg-1 of DM), in leaves, stem and legumes at legumes filling – R8 (P Leaf R8, g Kg-1 of DM; P Stem R8, g Kg-1 of DM; P Legume R8, g Kg-1 of DM), in grains at maturation – R9 (P G R9, g Kg-1 of DM); grains yield (Yield, g plant-1) and phytic acid concentration in grains (Phytic acid, mg Kg-1 of DM) obtained to tow bean genotypes (Pérola e IPR88 Uirapurú), cultivate under different phosphorus concentrations in the nutritive solution, at fall-winter (season 1) and spring-summer (season 2) seasons.
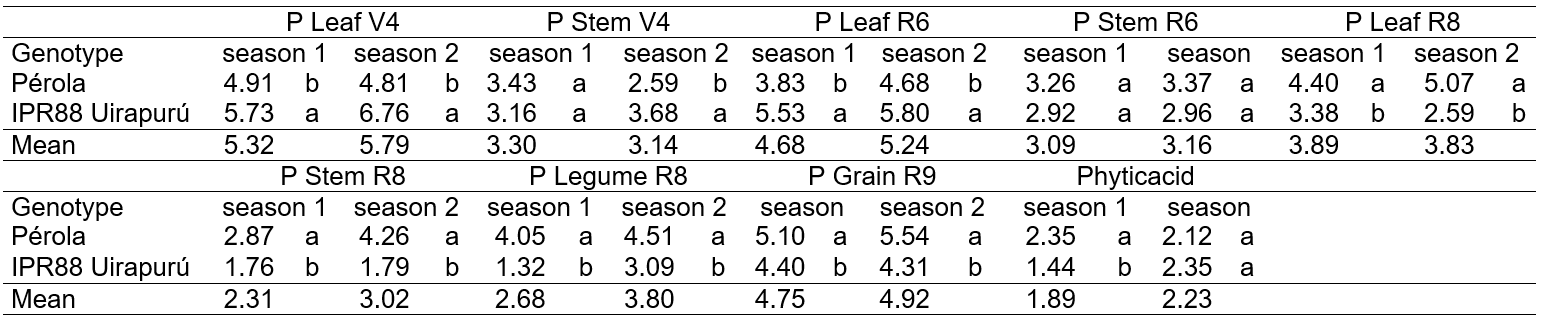
* Means followed by the same letter in vertical constitute the same group statistically homogeneous, by F test (value of p ≤0.05).
This distinct behavior among genotypes, due to changes on the environment (growing seasons), express the existent genetic variability among the two bean cultivars analyzed. Pereira et al. (2011) establish the existence of genetic variability among common bean cultivars to phosphorus accumulation in grains with variation of 2.84 to 5.87 g kg-1, as well, Coelho et al. (2002) found genetic variability to phytic acid concentrations, with values between 0.7 to 1.48 mg kg-1 of DM. The phytic acid in grains of leguminous plants can represent from 50 to 70% of total phosphorus, being that the variations in its values are because of the genotype and environmental conditions (Silva et al. 2011b).
The Pearson coefficients of correlation varied from 0.58 (phosphorus concentration in leaves at R6 and grains productivity) to 0.99 (phosphorus concentration in legumes at R8 and phosphorus concentration in grains at R9) (Table 2). The grains yield presented correlation estimates of high magnitude to the characters: phosphorus concentration in leaves at R8 (r=0.93), in legumes at R8 (r=0.97) and phosphorus concentration in grains at R9 (r=0.94). In addition, it was observed that these characters coefficients presented positive linear association, indicating that in order to have an increase in grains yield, it must maximize the phosphorus concentrations in tissues, from the legumes filling stage, which means, in more advanced growing stages. In this manner, the evaluation of phosphorus concentration in vegetal tissue on R8 stage, can be promising for allowing indirect selection, with the aim to obtain genetic gains on the grains yield.
Table 2. Pearson correlation estimates to phosphorus concentration in leaves at third trifoliate leaf (V4) (PLeaf V4) and stem at V4 (PStem V4); in leaves at flowering (R6) (PLeaf R6) and in stem at R6 (PStem R6) in leaves in legumes filling (R8) (PLeaf R8), in stem at R8 (PStem R8) and legumes at R8 (PLegume R8); in grains at maturation (R9) (PGrains R9); phytic acid concentration in grains (Phyt. Ac.) and grains yield (Yield) at R9, evaluated in five phosphorus concentrations in the nutritive solution, to two bean genotypes cultivated in two sowing seasons.
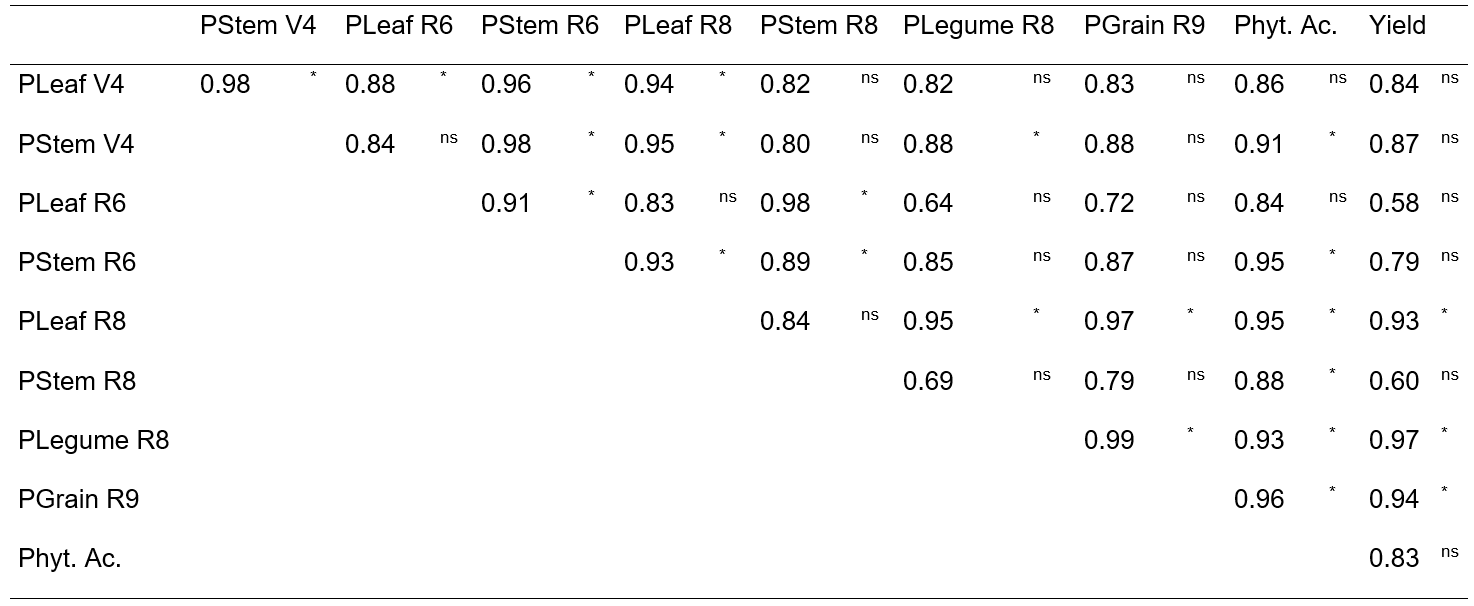
* Significant by t test at 5% level of probability; ns= non-significant.
It occurs, because, besides the dominant effect of phosphorus supply in initial developing phases, it is important that its supplying continues, also, in the afterward phases. It is necessary to guarantee the continuous furnishing of phosphorus until the grain maturation phase, in order to allow the functioning of the carbohydrates translocation mechanism so it do not reduce the grains yield (Grant et al. 2001; Ferrari et al. 2016). The phosphorus used in the grain formation can be supplied from the soil absorption, same by the redistribution and internal accumulation of the element in leaves and stem.
Strong positive correlation among the phosphorus concentration in grains and phytic acid concentration (r=0.96) can be observed (Table 2), indicating that increasing the phosphorus concentration, the phytic acid increases as well. It does reiterate the idea that, the phytic acid found itself widely distributed in most leguminous and cereal grains, presenting as primary phosphorus reserve, acting as energetic reserve (Rosset 2007). Silva et al. (2011a), evaluating the effect of phosphate fertilizing on the yield, phosphorus concentration and phytic acid in common bean grains, found arbitrary responses from the present study. For these authors, it was not observed significant correlation among the characters. In the present study, the correlation significance between the phosphorus concentration in grains and phytic acid concentration represents that this phosphorus its part of the phytic acid molecule. Considering seeds, this element could exert its physiologic function, serving as phosphorus backup that will be released during germination.
In summary, the phosphorus values in common bean leaves at initial growing stages are close to the ones found in grains. For the genotypes Pérola and IPR88 Uirapurú, the highest phosphorus values in plants tissues and of phytic acid occurred in phosphorus concentrations in the nutritive solution between 1.38 and 2.00 mmol L-1. Phosphorus concentrations in the nutritive solution between 1.37 and 1.96 mmol L-1 result in higher phosphorus concentration in leaves at third trifoliate leaf, in stem at flowering, in leaves, stem and legumes at legumes filling and grains at maturation. Also, higher phytic acid concentration in grains, at the fall-winter and spring-summer seasons. The evaluation of phosphorus concentration in the vegetal tissues from the legume filling stage is promising and allows indirect selection to grains productivity.
Acknowledgements
To the National Council for Scientific and Technological Development (CNPq) and to Coordination for the Improvement of Higher Level -or Education- Personnel (CAPES), for the scholarships granted.
References
- Ariza-Nieto M et al. 2007. Screening of iron bioavailability patterns in eight bean (Phaseolus vulgaris L.) genotypes using the CaCO-2 cell in vitro model. Journal of Agricultural and Food Chemistry 55:7950-7956.
- Barrueto-Gonzalez NB. 2008. Bioavailability of minerals from leguminous sources. Revista Simbio-Logias 1:174-183.
- Benevides CMJ et al. 2011. Antinutritional factors in foods: a review. Segurança Alimentar e Nutricional 18:67-79.
- Brinch-Pederson H et al. 2007. Molecular genetic approaches to increasing mineral availability and vitamin content of cereals. Journal Cereal Science 46:308-326.
- Carvalho JJ et al. 2014. Nutrient content and accumulation in common bean grains under no-tillage, under water deficit. Irriga 1:104-117.
- Carvalho IR et al. 2016. Genetic variability among common black bean (Phaseolus vulgaris L.,) accessions in southern Brazil. Australian Journal of Crop Science 10:1474-1483.
- Coelho CM et al. 2002. Seed phytate content and phosphorus uptake and distribution in dry bean genotypes. Plant Physiology 14:51-58.
- Cruz CD. 2013. GENES – a software package for analysis in experimental statistics and quantitative genetics. Acta Scientiarum. Agronomy 35:271-276.
- Cunha DA et al. 2014. Phosphorus fertilization and yield of common bean and castor in intercropping. Biosciensce Journal 30:617-628.
- De Paula SA. 2011. Influence of cultivation temperature and soil phosphorus doses on biochemical composition in soybean seeds. Dissertation (Master), Universidade Federal de Viçosa, Viçosa.
- Delfino RA et al. 2010. Interaction of polyphenols and proteins and the effect on protein digestibility of common bean (Phaseolus vulgaris L.) Pérola cultivar. Ciência e Tecnologia de Alimentos 30:308-312.
- Domingues LS et al. 2014. Selection of common beanlines for calcium use efficiency. Revista Ciência Agronômica 45:767-776.
- Fantini AP et al. 2008. Availability of iron in food mixtures with addition of foods with high content of vitamin C and cysteine. Ciência e Tecnologia de Alimentos 28:435-439.
- Ferrari M et al. 2016. Morphological and yield components of wheat due to the splitting and sources nitrogen. Australian Journal of Basic and Applied Sciences 10:242-249.
- Fernandez F et al. 1982. Etapas de desarollo de la planta de frijol comum. Centro Nacional de Agricultura Tropical, 26 p.
- Ferreira DF. 2011. Sisvar: a computer statiscal analysis system. Ciência e Agroecologia 35:1039-1042.
- Floss EL. 2011. Fisiologia das plantas cultivadas. UPF: Passo Fundo.
- Fonseca SV et al. 2002. Green leaves of common beans in human nutrition: sensorial evaluation, nitrogen fertilization and defoliation. Bragantia 61:161-167.
- Grant CA et al. 2001. The importance of phosphorus in early plant development. Informações Agronômicas: ESALQ, 95:16.
- Hanway JJ and Weber CR. 1971. N, P, and K percentages in soybean (Glycine max (L.) Merrill) plant parts. Agronomy Journal 63:286-290.
- Hefni M et al. 2010. Folate content in foods commonly consumed in Egypt. Food Chemistry 121:540-545.
- Israel DW et al. 2006. Genetic variability for phytic acid phosphorus and inorganic phosphorus in seeds of soybeans in maturity groups V, VI, and VII. Crop Science 4:67-71.
- Khanal S et al. 2013. Quantitative Trait Loci Analysis of Folate Content in Dry Beans, Phaseolus vulgaris L. International Journal of Agronomy 9:1-9.
- Lamb EM et al. 1985. Survey of bean genotypes grown in Rwanda. Annual Report of the Bean Improvement Cooperative 2:17-18.
- Latta M and Eskin M 1980. Simple and rapid colorimetric method for phytate determination. Journal of Agricultural and Food Chemistry 28:1313-1315.
- Mesquita FR et al. 2007. Bean (Phaseolus vulgaris L.) lines: chemical composition and protein digestibility. Ciência e Agroelogia, Lavras, 31(4): 1114 – 1121.
- Monteiro TH and Vannucchi H. 2010. Funções plenamente reconhecidas de nutrientes: fósforo. International life sciences institute do Brasil. 15: 6-10.
- Oliveira TC. 2007. Fósforo: função, metabolismo e recomendações. Revista Digital de Nutrição 1:1- 4.
- Oliveira TC et al. 2014. Phosphorus influence on physiological quality of common bean seeds stored under natural conditions. BioScience Journal 30:303-310.
- Pegoraro RF et al. 2014. Growth and nutrient uptake for the common bean in the winter season. Revista Caatinga 273:41-52.
- Pereira T et al. 2011. Diversity in nutrient content of common bean seeds in the state of Santa Catarina. Acta Scientiarum Agronomy 33:477-485.
- Petrilli LRT. 2007. Rates and ways of phosphorus application on “perola” commom bean production and nutrition. Dissertation (Master) – Universidade Estadual Paulista, Botucatu.
- Ribeiro ND. 2010. Potential for increasing the nutritional quality in common beans through plant breeding. Semina: Ciências Agrárias 31:1367-1376.
- Rigo GA et al. 2018. Effects of macronutrients in the physiological quality of soybean seeds. Journal of Agricultural Science 10:312-318.
- Rosset M. 2007. Phytic Acid and Minerals Distribution during Soymilk and Tofu. Dissertation (Masters) – Universidade Estadual de Londrina, Londrina.
- Santos JL et al. 2011. Bean plants response to phosphate fertilizer in cerrado soils with different land use history. Revista Brasileira de Ciência do Solo 35:193-202.
- Sigmaplot. 2012. Sigmaplot version 12. Scientific Software Solutions Internationals, San Jose, CA, 2012.
- Silva PRC. 2006. Processo de produção de adubos foliares. Salvador: Serviço Brasileiro de Respostas Técnicas, Rede de Tecnologia da Bahia.
- Silva AM et al. 2010. Response of cowpea (Vigna unguiculata (L.) Walp.) to phosphorus fertilization levels and application forms in Yellow Latosol of Roraima State/Brazil. Acta Amazônica 40:31-36.
- Silva A et al. 2011a. Seed phytate and protein content in beans depending on the application of basalt powder. Acta Scientiarum Agronomy 33:147-152.
- Silva HP et al. 2011b. Quality of Helianthus annuus L. seeds as a function of phosphate and location in the inflorescence. Ciência Rural 41:1160-1165.
- Silva DA et al. 2014. Efficiency in the use of phosphorus by common bean genotypes. Scientia Agrícola 71:232-239.
- Souza DM et al. 2012. Application of chemometric methods to the optimization of extraction of Ca, Mg, K, Fe, Zn, Cu and Mn in Brachiaria sp. leaves. Química Nova 35:1-5.
- Stauffer MD and Sulewski G. 2004. Fósforo – Essencial para a vida In: Yamada T, Abdalla SRS. (Ed.). Fósforo na Agricultura Brasileira. Piracicaba: Potafos. pp.1-12.
- Storck L et al. 2011. Experimentação vegetal. 3. ed. Federal University of Santa Maria. Santa Maria.
- Szareski VJ et al. 2016. Phenotype stability of soybean genotypes for characters related to the physiological quality of seeds produced under different environmental conditions. Australian Journal of Basic and Applied Sciences 10:279-289.
- Vargas RL et al. 2018. Macronutrients and micronutrients variability in soybean seeds. Journal of Agricultural Science 10:209-222.
- Vieira NMB et al. 2009. Accumulation of macronutrients by different common bean cultivars grown in different plant densities in no-tillage crop system. Annual Report of the Bean Improvement Cooperative 52:132-133.
