
Blood Protein Markers of Neocortical Amyloid-β Burden: A Candidate Study Using SOMAscan Technology
Abstract
Background: Four previously reported studies have tested for association of blood proteins with neocortical amyloid-β burden (NAB). If shown to be robust, these proteins could have utility as a blood test for enrichment in clinical trials of Alzheimer’s disease (AD) therapeutics.
Objective: This study aimed to investigate whether previously identified blood proteins also show evidence for association with NAB in serum samples from the Australian Imaging, Biomarker and Lifestyle Flagship Study of Ageing (AIBL). The study considers candidate proteins seen in cohorts other than AIBL and candidates previously discovered in the AIBL cohort.
Methods: Our study used the SOMAscan platform for protein quantification in blood serum. Linear and logistic regressions were used to model continuous NAB and dichotomized NAB respectively using single proteins as a predictor. Multiple protein models were built using stepwise regression techniques and support vectors machines. Age and APOE ɛ4 carriage were used as covariates for all analysis.
Results: Of the 41 proteins previously reported, 15 AIBL candidates and 20 non-AIBL candidates were available for testing. Of these candidates, pancreatic polypeptide (PPY) and IgM showed a significant association with NAB. Notably, IgM was found to associate with continuous NAB across cognitively normal control subjects.
Conclusions: We have further demonstrated the association of PPY and IgM with NAB, despite technical differences between studies. There are several reasons for a lack of significance for the other candidates including platform differences and the use of serum rather than plasma samples. To investigate the possibility of technical differences causing lack of replication, further studies are required.
INTRODUCTION
The pathology of AD is characterized by three features in the brain: the aggregation of amyloid-β (Aβ) into plaques, the presence of hyperphosphorylated tau in the form of tangles, and the occurrence of neuron loss leading to brain atrophy [1, 2]. There is debate as to how these processes interact to cause symptomatic AD. A popular theory is the amyloid cascade hypothesis: that Aβ deposition is central to disease development [3]. Studies show that Aβ plaques begin to develop up to 20 years prior to clinical diagnosis with their growth reaching a plateau as clinical symptoms arise [4, 5]. The presence of AD pathology can be investigated through characteristics that are informative of AD diagnosis; endophenotypes. Measurements of analytes in cerebrospinal fluid (CSF) and molecular imaging by positron emission tomography (PET) scans are examples of endophenotypes that are biomarkers for AD. The disadvantages of the procedures involved in attaining these measurements include their invasive or expensive nature and that they require specialized administration.
Existing treatments for AD provide short-term symptomatic relief, in a subset of patients, and trials of potential disease modifying treatments are failing [6]. Two suggestions have been made to address this shortcoming: the use of Aβ as a companion diagnostic in tertiary prevention trials (those investigating disease modifying or symptomatic treatments) and in secondary prevention trials (investigating treatments to prevent the disease from occurring in the first place). Firstly, we consider the use of a companion diagnostic in a normal clinical trial. To date, trials of Aβ targeting drugs have recruited patients with a clinical AD or mild cognitive impairment (MCI) diagnosis and unknown brain Aβ burden [7–10]. As Aβ PET scans became more readily available, toward the end of such trials, Aβ burden was measured and it was discovered that some of these AD patients had low Aβ burden (the target pathology). For example, in a trial of Bapineuzumab, a humanized anti-Aβ monoclonal antibody, approximately 14% of subjects had low Aβ burden [9]. Consequently, it has been suggested that Aβ PET or CSF measures are used as a companion diagnostic, with elevated brain Aβ becoming an eligibility requirement for Aβ-lowering trials. A panel of blood biomarkers could enable cost-effective enrichment and identification of trial participants with Aβ pathology for subsequent confirmatory Aβ CSF tests or PET scans.
A second use of a blood-based biomarker would be in recruitment for secondary prevention trials. It is hypothesized that the brains of people recruited with a diagnosis of AD or MCI are often too damaged for medication to have an effect. Treatments could have a higher chance of success in subjects with no clinical symptoms, under the assumption that it is easier to delay, rather than reverse, the development of AD pathology. Aisen et al. expand on this idea stating that there has been no medical advancements in the last decade in terms of treating AD [11]. They suggest basing recruitment of patients into clinical trials on the presence of biomarker defined pre-symptomatic AD; three such trials had begun by the end of 2014. As above, using a blood biomarker as an enrichment filter for PET scans and CSF markers could increase the efficiency of clinical trial recruitment by reducing screen failures. A simple blood test has the greatest potential impact in streamlining secondary prevention studies as screen failure rates due to low Aβ are expected to be higher (∼78.1% versus ∼12% ) in asymptomatic individuals than in subjects with AD (Ossenkoppele et al. and Jansen et al., unpublished results).
Consequently, there is high demand for a blood-based biomarker of AD pathology [12]. It has been shown that measures of Aβ in the brain are highly negatively correlated with those in the CSF [13]. However, overall, studies of blood Aβ do not show similar correlations [14]. It is therefore necessary to search for other analytes within the blood that may be associated with Aβ in the brain. Recent studies provide some evidence that proteins in blood show such a link to other AD endophenotypes and to Aβ burden in the brain [15–19]. However, there is a need to investigate these results further in independent datasets of a larger size, using different technologies and different biological samples. We begin to address this here.
This study aimed to further test findings in the literature of proteins in blood plasma associating with brain Aβ burden [15–17, 19]. We used a radioactive marker of Aβ, [11C]-Pittsburgh compound B (PiB), combined with PET scanning to quantify the amount of brain Aβ burden and the SOMAscan proteomics platform [20] for quantification of protein in blood samples.
With over 1,000 protein analytes, the SOMAscan proteomics platform has been used in high-throughput biomarker discovery studies. For example, in AD research it has been used by Sattlecker et al. and Zhao et al. to discover potential plasma biomarkers of AD diagnosis, MRI measures, and/or rate of cognitive decline [18, 21]. In this study we focused our approach on candidate-based analysis, selecting only proteins previously found to associate with NAB. This was done to ensure that there was sufficient statistical power to detect weaker signal that could have been missed had the entire SOMAscan panel been used. This analysis was repeated within just the cognitively normal control subjects to evaluate whether this test would have utility to enrich for Aβ-positivity in secondary prevention trials.
MATERIALS AND METHODS
Cohort
AIBL is a prospective, longitudinal study of subjects aged over 60 years. The dual center study recruits subjects with an AD diagnosis as well as both control subjects and those with MCI with the aim of identifying factors that lead to subsequent AD development. Details of study design and enrolment are given elsewhere [17]. The present study comprised a subset of 198 subjects from AIBL, enriched for controls.
Proteomics
Blood draws (80 ml) were taken after overnight fasting and serum was collected in Sarsedt s-monovette tubes. The samples were centrifuged at 1,800 g for 15 min at 20°C and immediately frozen at −80°C. They were stored (long-term) in liquid nitrogen [22]. Protein levels in the blood serum were analyzed using the SOMAscan platform (SomaLogic Inc, Boulder, CA). The methods used in this assay are outlined in detail by Kraemer et al. but, in brief, proteins were measured using Slow Off-rate Modified Aptamer (SOMAmer)-based capture arrays using a sample of less than 10μL per run [23]. SOMAmers are nucleotides that have been chemically modified to address two issues: hard to capture proteins and non-specific binding. Firstly, the nucleotides are given protein-like properties resulting in high affinity for hard to capture proteins. Secondly, aptamers with slow dissociation rates are used allowing disruption of non-specific binding. These nucleotides are used to transform a protein signal to a nucleotide signal that can be quantified using relative florescence on microarrays. For full quantification details of this assay, see Gold et al. [20]. This study used SOMAscan Version 2 which captured information on 1,001 proteins and protein complexes.
Quality control was performed at the sample and SOMAmer level, and involved the use of control SOMAmers on the microarray and calibration samples. Hybridization controls measured sample-by-sample variation in hybridization while the median signal over all SOMAmers measured technical variability. Scale factors of these two metrics were used to normalize across all samples with acceptance criteria of 0.4 to 2.5 based on historic trends. SOMAmer by SOMAmer calibration occurred through the repeated measurement of calibration samples. Historic values were used to generate a calibration scale factor the acceptance criterion for which was: 95% of SOMAmers must have a calibration scale factor within 0.4 of themedian.
Imaging
The measures of NAB used in this study were collected by PiB PET scans. The PiB imaging methodology is detailed elsewhere [24]. Each scan was spatially normalized by Rowe et al. to a customized PiB-PET template in the Montreal Neurological Institute reference space using Statistical Parametric Mapping 8 (SPM8; Wellcome Trust Centre for Neuroimaging, London, UK). Standardized uptake value ratios (SUVRs) were then created by computing the ratio of PiB retention in the whole brain to that in the grey matter [25].
Identification of candidate blood protein markers of brain Aβ burden
We identified candidate proteins through a search of the literature for studies investigating the relationship between blood proteomics and Aβ burden in the brain. Any proteins identified as significant in the study conclusions were selected and matched to the AIBL SOMAscan data using the UniProt ID.
Statistical analysis
All statistical analysis was performed in R (version 3.1.1) [26].
Differences in proteomic signal between platforms and sample types
As the candidates were selected based on their association with NAB in plasma, we aimed to confirm that serum is an appropriate surrogate by comparing proteomic signal from the SOMAscan platform between blood plasma and serum samples using age as an outcome. We also studied differences between the SOMAscan platform and Myriad’s Rules Based 415 Medicine Multi-analytes Profile (RBM MAP), one of the discovery proteomics platforms. To do so, we used proteomic data generated using the RBM MAP platform from the original publication of a blood biomarker in the AIBL study; methods described by Burnham et al. [17].
Menni et al. have studied associations of age with protein levels from plasma samples using the TwinsUK cohort and SOMAscan version 3 [27]. Running random intercept linear regression, adjusting for family relatedness, identified proteins associated with chronological age. We performed a similar analysis using standard linear regression on our serum samples from the AIBL cohort. Within each cohort (TwinsUK and AIBL) the proteins were ranked by p-value from the regressions and the R package OrderedList was used to compare the rank of proteins present on both versions of the platform [28].
To assess the concordance of proteomic signal between SOMAscan and RBM MAP, we implemented an identical method. OrderedList was used to compare lists of proteins ranked according to their associations with age and gender.
Analysis overview
An overview of the analysis is given in Fig. 1. Proteins discovered in studies other than AIBL [15, 16] were analyzed separately to proteins discovered in AIBL using different biological samples (serum instead of plasma) [17, 19]. This split was implemented as the association of a non-AIBL candidate with NAB in AIBL would provide a fully independent replication of those findings, whereas the association of an AIBL candidate with NAB would only show that the marker could also be measured using SOMAmers on serum samples. Each analysis tested the protein levels against the continuous endpoint of SUVR as well as a dichotomized high/low NAB endpoint. A cut off of 1.3 was used to distinguish between high and low NAB [17]. Use of a continuous endpoint gives increased power in statistical analysis in comparison to a categorical measure [29]. Additionally, each analysis studied all samples and control samples alone.
Subjects were randomly split into a training (66% ) and test set (34% ) using the createDataPartition function in the R package caret [30]. The split ensured that a range of values of NAB were present in each set for the continuous analysis by splitting the subjects into groups based on NAB percentiles and sampling within these groups. For the dichotomized analysis, the split ensured that the proportion of high and low NAB was similar between the two sets by sampling within the high and low groups.
Data pre-processing
Data pre-processing was performed separately for each analysis. In both cases, all protein data was subject to a natural logarithm transformation so each protein followed an approximate normal distribution. Per sample, per protein outliers were then identified as values lying outside of 6 standard deviations (SD) of the mean protein value and were set to missing. Any sample with more than 20% missing data was removed. Missing data in the train and test sets was imputed separately using 10 nearest neighbors.
In some cases, there were multiple SOMAscan probes available for one UniProt ID. In this instance, a principal components analysis (PCA) was performed across these probes and only the first principal component (PC1) was included in the analysis. This was performed on all samples and on control samples alone, and separately for train and test sets. Additionally, the colinearity of such probe sets was investigated using Pearson’s correlation coefficients.
Single protein analysis
Models were built using the training set. The continuous and dichotomized NAB endpoints were regressed against age, APOE ɛ4 load and each protein in turn using linear and logistic regression, respectively. Age and APOE ɛ4 load, defined as the number of ɛ4 alleles in a subjects genotype, were included as they were statistically significant in this population (see Table 2).
In all cases, Benjamini Hochberg corrected p-values from the full model fit (q-values) were tested against a significance level of 0.1, to account for false discovery. Although the hypothesis tests performed were not independent, the Benjamini Hochberg correction gave an acceptable approximation of the false discovery rate [31].
Model fit was assessed by exploring the residuals of each model to ensure normality, constant variance, zero expectation, and independence. For logistic regression models, deviance residuals were used.
Each model was used to predict NAB in the test set and model statistics were calculated. These were R2 and root mean squared error (RMSE) for linear regression and accuracy, sensitivity and specificity for logistic regression. For each model, statistic permutation testing was run with 1,000 permutations of the NAB values, to create a non-parametric, empirical p-value. In each permutation, the relationship between NAB endpoint, age, and APOE ɛ4 load was maintained. Benjamini Hochberg corrected p-values (q-values) were tested against a significance level of 0.1.
Multiple protein analysis
The primary multiple protein analysis was parametric. Models were built using the training set. As in the single protein analysis, continuous and dichotomized NAB endpoints were regressed against age, APOE ɛ4 load, and all proteins together (15 non-AIBL candidates and 20 AIBL candidates) using linear and logistic regression respectively. The models were then simplified using stepwise regression based on Akaike’s Information Criteria (AIC). Simplified linear regression models were examined for variable importance using the Lindemann, Merenda, and Gold (LMG) measure [32]. This metric represents the R2 of an individual regressor by averaging over all orders of regressors. Each model was used to predict on the test set and create model statistics with associated empirical p-values, as detailed previously. Model fit was assessed in the same manner as for the single protein analysis.
As a secondary multiple protein analysis we investigated the possibility of non-linear associations and interactions by performing a non-parametric multiple protein analysis using support vector machines (SVMs) in the R package kernlab [33]. We used an SVM with radial kernel to build models in the training set. The train function from the R package caret was used to estimate model parameters: The kernel parameter (sigma) was directly estimated and regularization parameter (C) was tuned using 25 bootstraps. RMSE was used as the optimization metric for continuous NAB while kappa was used for the dichotomized endpoint. Each model was used to predict on the test set.
RESULTS
Cohort demographics
For this study, we used SOMAscan data generated on serum samples from the AIBL cohort. Table 2 summarizes the demographics of this population. As expected, characteristic features of AD such as Mini-Mental State Examination score and Clinical Dementia Rating were significantly associated with continuous NAB and significantly different between high and low NAB groups. Age and APOE ɛ4 load (defined as the number of APOE ɛ4 alleles in a subject’s genotype) were also significant and hence accounted for in all analyses.
Overall, demographics in the control population mirrored those across all samples and hence the same terms were covaried for in the control only analyses (see Supplementary Table 1). As expected, measures of APOE ɛ4 were not significant in this sub-population.
Differences in proteomic signal between platforms and sample types
We began by comparing proteomic signal associated with age in plasma samples from the TwinsUK cohort and serum samples from AIBL. 975 SOMAscan probes matched between the Twins UK (Version 3, 1,129 SOMAmers) and AIBL (Version 2, 1,001 SOMAmers) datasets mapped using SOMAscan ID. Comparison of the protein lists ranked by association with age gave a significance of similarity p-value of <0.001. The analyses were not adjusted for any covariates.
We also made a comparison between the SOMAscan platform and RBM MAP platform using samples from the AIBL cohort. The RBM MAP data contained 151 proteins, 119 of which could be mapped to a UniProt ID. All 1,001 proteins on the SOMAscan panel were mapped to a UniProt ID. There were 88 proteins that overlapped between the two datasets, mapped by UniProt ID. Comparison of the protein lists ranked by association with age gave a significance of similarity p-value of 0.162. An identical analysis with proteins ranked by association with gender gave a significance of similarity p-value of 0.201.
Identification of candidate blood protein markers of brain Aβ burden
We identified four previous studies investigating a proteomic signal in the blood associated with Aβ burden in the brain. Previously reported studies used blood plasma whereas this study uses blood serum samples. Thambisetty et al. discovered six proteins associated with brain Aβ burden in a group of non-demented, older individuals [15]. Kiddle et al. used data from the Alzheimer’s Disease Neuroimaging Initiative (ADNI) in a discovery analysis to find 16 proteins associated with brain Aβ burden [16]. Significant proteins from these two papers that were also present in the AIBL SOMAscan data [15] are termed non-AIBL candidates and are given in Table 1.
Additionally, two discovery analyses have already been performed on AIBL subjects using different protein measurement technologies; RBM MAP [17] and mass spectrometry [19]. Respectively, these studies highlighted 8 and 17 proteins (a prioritized set) as being significantly associated with NAB. The proteins that were also present in the AIBL SOMAscan data [20] are termed AIBL candidates and are given in Table 1. See Supplementary Figure 1 for an overview of protein numbers.
In some cases, there were multiple SOMAscan aptamers for one UniProt ID: C3 (P01024) had six matches in the AIBL SOMAscan dataset, APOE (P02649) had three, and Fibrinogen ([P02671, P02675, P02679]) had two. All are accounted for in this analysis using PCA as detailed previously. Eleven of the 41 proteins were not present on the SOMAscan panel. AβPP was included as an additional protein of interest as Aβ 1–42 is not present on the SOMAscan panel.
Data pre-processing
There was no observed pattern in the missing data nor in the demographics of the subjects with data set to missing so it was assumed the data were missing at random. No subjects were removed during data pre-processing.
The protein data was generated in one batch and the PET scans were performed using one model of machine. Table 3 gives details of the proteins that were collapsed into their first principal component, as detailed previously. In all cases, PC1 accounted for at least 75% of the total variation. The only probe leading to correlations of less than 0.75 for UniProt ID P01024 was that of C3d.
Discovery analysis
Discovery analysis was applied across the entire SOMAscan platform in an attempt to find predictors of dichotomized as well as continuous NAB. Variable selection techniques that included linear and logistic regression and SVMs yielded no predictive models with efficacy of estimating NAB above that of a model built on age and APOE ɛ4 carriage alone. The results of linear and logistic regression methods to predict continuous and dichotomized NAB are given in Supplementary Table 2.
Single protein analysis
Residual plots indicated a reasonable model fit in all cases. We outline below single proteins that pass multiple testing with a q-value of less than 0.1.
Non-AIBL candidates
When modeling dichotomized NAB, logistic regression analysis showed that PPY was significantly associated with PiB positivity across all samples, passing multiple testing corrections (β= 2.959, p = 0.001, q = 0.013). Figure. 2 shows the fit of this model in the training data. See Supplementary Table 3 for full results.
AIBL candidates
In control samples, IgM was significant in a linear model with a q-value of 0.044 (β=−0.282, p = 0.002). Mirroring the non-AIBL candidate results, PPY was significant in a logistic regression model whenconsidering the dichotomized endpoint in all samples (q = 0.018). Figures 2 and 3 show the fit of these models in the training data. See Supplementary Table 4 for full results.
The analysis of continuous NAB against IgM in control subjects was repeated including a flag for presence of diabetes as a covariate (n = 72). IgM had an estimate similar to that previously stated (β=−0.232) and showed a nominally significant p-value (p = 0.027). The presence of diabetes flag was not significant (β= 0.127, p = 0.586).
Multiple protein analysis
Continuous NAB
In linear regression analysis across all subjects models of both non-AIBL candidates and AIBL candidates showed improved RMSE (0.490 and 0.497) and R2 (0.245 and 0.226) values over a model of age and APOE alone (RMSE = 0.500 and R2 = 0.219). The model of non-AIBL candidates achieved significant empirical p-values for RMSE and R2 through permutation testing with p-values of 0.041 and 0.043, respectively. Model statistics achieved in parametric analysis outperformed those from SVM modeling.
Protein models in control samples created through regression analysis did not outperform a model of age and APOE alone. However, all SVM models showed lower RMSE and higher R2 values than the demographic only model and in most cases alsooutperformed the parametric methods. For further details of the multiple protein analysis of continuous NAB, see Table 5.
Dichotomized NAB
In parametric analysis across all subjects, the model of AIBL candidates gave a higher accuracy (0.612) than a model of age and APOE alone (0.567). This was driven by an increase in specificity; 0.583 compared with 0.389 in the age and APOE only model. Specificity gave a significant permutation p-value of 0.026.
The model of non-AIBL candidates also showed increased specificity at 0.444 compared to 0.389 in the age and APOE only model. SVM analysis gave increased specificity and decreased sensitivity over parametric analysis in all three models leading to a marginal increase in overall accuracy.
In control samples, logistic regression analysis of AIBL candidates gave improved accuracy and sensitivity compared with the model of age and APOE alone (0.675 and 0.444, respectively, compared with 0.650 and 0.333). The model in non-AIBL candidates also showed increased sensitivity at 0.500. Non-parametric analysis showed improved accuracy over regression analysis in the protein based models driven by an increase in sensitivity. For further details of the multiple protein analysis of dichotomized NAB, see Table 4.
DISCUSSION
In this study, we investigated blood proteins shown in the literature to be associated with Aβ burden in the brain, using serum samples from AIBL. No proteins were found to pass multiple testing corrections in a discovery analysis so we implemented a candidate based approach.
Two candidate proteins (PPY and IgM) showed association with NAB in the single protein analysis of the AIBL serum SOMAscan dataset. Both had already been identified as significant in the AIBL plasma RBM MAP dataset by Burnham et al. [17].
PPY passed multiple testing corrections for single protein analysis in all samples for the dichotomized endpoint. This provides further evidence for claims made by Chiam et al. who found PPY to be the most replicated blood protein marker of AD [34]. The direction of association (positive) matched that of Burnham et al. [17], providing some evidence for concordance of the SOMAscan platform with RBM MAP for this protein despite technical differences. This is also consistent with Sattlecker et al. who used SOMAscan to show that plasma PPY levels increase with disease progression in subjects from the combined AddNeuroMed, Alzheimer’s Research UK/Maudsley BRC Dementia Case Registry research cohorts [18]. However, the estimate was in the opposite direction to that described by Kiddle et al. [16]. This could suggest a complex relationship of PPY with NAB that we may be unable to describe fully with the statistical approaches applied here. Alternatively, the variation in direction could be due to lower statistical power in Kiddle et al. (n = 71) or cohort differences, perhaps differences between Americans and Australians or disease stage. Indeed, Lunnon et al. have previously shown that disease associated markers, albeit gene expression markers, can frequently change direction of effect depending on disease stage [35]. The subjects used by Kiddle et al. from ADNI were at a much later disease stage (with only three controls) than the subjects used here.
Doecke et al. have previously shown PPY to be associated with AD diagnosis in the AIBL cohort [36]. Similarly, PPY was found to be associated with diagnosis in ADNI and the Texas Alzheimer’s Research Consortium [37, 38]. However, there has been discussion around whether this effect could be a pharmacological response to the use of acetylcholinesterase inhibitors. Unfortunately, we were unable to examine this in the AIBL cohort but the possibility of medication confounding should be investigated in further studies. Chiam et al. use data from the AddNeuroMed study to suggest the effect of acetylcholinesterase inhibitor use is not significant on PPY (Chiam et al., unpublished results).
Additionally, IgM was seen to replicate at the single protein level in control samples only. IgM is an antibody produced by B-cells that appears early in the course of an infection. This pathway of immune response has been linked to AD in previous studies [35]. Furthermore, IgM has been associated with diabetes [39]. When a presence of diabetes flag is included in the IgM model it is not significant. Additionally, the p-value of IgM remains nominally significant at 0.027 indicating that it is unlikely that this significant association is a result of disease confounding.
There were 29 candidates that gave non-significant results. These were: C3, APOE, Fibrinogen, Haptoglobin, Albumin, α1-antitrypsin, α2-macroglobin, APOA1, C4, Chemokine Ligand 13, Clusterin, Factor B, Factor H, Gelsolin, Hemopexin, HRG, IgG, IL13, IL17, IL3, Leptin, MIP1α, MMP9, Plasminogen, Transferrin, SAP, VCAM1, vWF, and APP.
Some of these proteins showed significant q-values for model statistics (such as R2 and accuracy based on permutation testing) although they were not significant in the parametric model. This indicates that greater sample size is needed for future studies of this nature in order to reduce the variation of statistics such as R2 and hence give a more reliable estimate.
Multiple protein models constructed in this study gave mixed success in explaining variation in brain Aβ burden. Although some provided increased accuracyor R2 over models of age and APOE ɛ4 number alone, the differences were minimal and largely no greater than those provided by some single protein models. LMG variable importance scores from linear regression models also emphasized that age and APOE ɛ4 number were the most important variables. Consequently, given a larger sample size, an analysis stratified by APOE genotype could be used to reveal more complex relationships between APOE and protein markers.
The four studies that contributed candidates for this analysis used blood plasma samples. However, due to sample availability, we performed SOMAscan analysis on blood serum samples. It is possible that this tissue difference is responsible for the non-replication of some of the candidates; however, there are studies suggesting analyte specific consistency across sample type. O’Bryant et al. show that some blood-based markers of AD, including pancreatic polypeptide, are consistent between plasma and serum [38]. Furthermore, our comparison of ranked lists of proteins associated with age between blood serum (AIBL) and plasma (Twins UK) showed a high level of concordance on the SOMAscan platform.
Differences between the proteomic approaches used here (SOMAscan) and in the literature (Myriad RBM, 2DGE, and mass spectrometry) could be driving the disparity in results between these studies. We see non-significant p-values for similarity when comparing ranked lists of proteins associated with age and gender between SOMAscan and RBM MAP. Due to the similarity in signal between the Twins UK plasma samples and AIBL serum samples (detailed above), this difference is likely platform-driven. While SOMAscan measures the availability of a 3D shape and charge epitope, mass spectrometry measures mass to charge ratio. RBM MAP uses antibodies that could be measuring alternative versions or conformations of proteins to those measured by SOMAscan. It is likely the SOMAscan platform would show the highest correlation with other immunoassays. This is consistent with the observation that we see the most agreement between AIBL plasma RBM MAP candidates and our findings here using serum SOMAscan (PPY and IgM). A study examining the similarities and differences observed when running samples across these platforms would be useful when interpreting results such as these.
The primary analysis used in this study follows a parametric, linear approach following that of three out of the four studies cited. Burnham et al. used a non-linear, non-parametric analysis. We investigated the potential ability to detect interactions and non-linear relationships, and consequently improve model performance, by building SVM models. These non-parametric models found slightly improved results suggesting that non-linearity and interactions could be important in the relationship between blood proteomics and NAB and should be considered in further studies.
Throughout the analysis presented here we included APOE ɛ4 number (0, 1, 2) as a covariate. We did not include the APOE genotype itself due to small numbers of samples in the ɛ2ɛ4 and ɛ4ɛ4 groups. We investigated whether grouping subjects with an ɛ2ɛ4 genotype with subjects with an ɛ3ɛ4 genotype was appropriate given that the ɛ2 allele has been found to be protective and consequently subjects of the two genotypes could behave differently. Exploratory analysis of the PPY and IgM results suggest that the general trend between the ɛ3ɛ4 and ɛ2ɛ4 groups is similar and consequently it is reasonable to combine them in our analysis. Supplementary Figures 2 and 3 illustrate this.
It is clear that the sample size used in our analysis limits the power of any conclusions. An additional factor limiting interpretation of these findings is how representative the cohort used here is compared to potential clinical trial recruitment populations, both in terms of diagnostic groups and prevalence of high Aβ burden. Differences in prevalence between this cohort and the target populations can lead to inflated estimates of positive predictive value, the proportion of test positives that are true positives [40]. This should be addressed in further work through study of larger and more representative cohorts.
A known disadvantage of stepwise regression analysis is a tendency to over fit to the training data. Several of the multiple protein models created failed to outperform age and APOE ɛ4 number in test data which could be a suggestion that the stepwise models are over fitting to the training data. Alternatively, this may provide evidence that the candidates considered here provide minimal predictive information on NAB, above that of age and APOE ɛ4 load, when measured in serum samples using SOMAscan. Studies of larger cohorts will allow this to be investigated further.
It is promising that we show for the first time that IgM predicts NAB in asymptomatic individuals. However, we note that the majority of candidates investigated in this study had been selected from populations with a variety of diagnoses. Thus, the lack of significance of association with NAB for most candidates in asymptomatic subjects was not unexpected. In further work it would be interesting to perform a discovery analysis on control subjects alone and identify proteins that are found to link with Aβ burden pre-symptomatically. The proteins identified byThambisetty et al. are from a control population but of small sample size (n = 57) [15].
We were surprised to detect a signal for fibrinogen from the SOMAscan technology. Currently it is thought that there should be no fibrinogen present in blood serum samples. This may reflect issues of specificity with the fibrinogen SOMAmer or the presence of low concentrations of fibrinogen in serum samples beneath detection thresholds of other assays. We note that this has been reported before in a study of tuberculosis [41]. As SOMAscan is a relatively novel protein quantification technology, more work is needed to qualify how it compares with other platforms and to identify the binding sites of SOMAmers.
There is a clear link between the development of Aβ plaques in the brain and AD but this relationship is not exclusive. That is to say, it is not always the case that high NAB indicates AD or vice versa; there are examples of elderly subjects with high Aβ burden and no cognitive impairment [42]. While this could be explained by misdiagnosis and Aβ starting a slow AD process in motion, the alternative hypothesis would be that Aβ is not causally related to late onset AD. However, while the focus of AD clinical trials is predominately anti-Aβ, it is logical to find markers relevant to those trials. Furthermore, Aβ burden is appearing in new diagnostic criteria for AD [43]. More work is needed to thoroughly understand the role of brain Aβ burden in AD to validate the use mechanistic action of Aβ, it would be interesting to study a cohort of subjects with Aβ positivity of a model of Aβ burden as a diagnostic biomarker. To investigate the prior to the development of MCI or AD. Unfortunately, the current study did not have a sufficient number of samples (n = 5) meeting this criterion to perform such analysis. The need for cohorts of this type is clear in order to advance understanding of the clinical relevance of Aβ.
If the model statistics achieved in this study are shown to be robust across relevant, larger, and independent populations, these models could be beneficial in acting as a cost-effective enrichment filter between the general population and those predicted to have high NAB. Using a relevant simple blood test as a pre-screening tool could reduce the PET and CSF screening failure rate and hence the cost of trials.
CONCLUSIONS
In this study we investigated blood proteins previously found to be associated with Aβ burden in the brain using serum samples from AIBL and the SOMAscan proteomics technology. Two candidate proteins (PPY and IgM) showed association with NAB in the AIBL serum SOMAlogic dataset. Notably, IgM was found to associate with continuous NAB across control subjects, suggesting it may have utility for predicting Aβ-positive asymptomatic individuals. There are several reasons for a lack of significance for the other candidates including platform differences and the use of serum rather than plasma samples. To investigate the possibility of technical differences causing lack of further replication, further studies are required.
ACKNOWLEDGMENTS
We thank all the participants who took part in this study and the clinicians who referred participants. The AIBL study (http://www.AIBL.csiro.au) is a collaboration between CSIRO, Edith Cowan University (ECU), The Florey Institute of Neuroscience and Mental Health (FINMH), National Ageing Research Institute (NARI) and Austin Health. It also involves support from CogState Ltd., Hollywood Private Hospital, and Sir Charles Gairdner Hospital. The study received funding support from CSIRO, the Science and Industry Endowment Fund (www.SIEF.org.au), NHMRC and Dementia Collaborative Research Centres (DCRC), Alzheimer’s Australia (AA), Alzheimer’s Association, and the McCusker Alzheimer’s Research Foundation.
This work was supported by the Alzheimer’s Society, the NIHR Biomedical Research Centre for Mental Health and Biomedical Research Unit for Dementia at the South London, Maudsley NHS Foundation Trust and Kings College London. The research leading to these results has received support from the Innovative Medicines Initiative Joint Undertaking under grant agreement number 115372, resources of which are composed of financial contribution from the European Union’s Seventh Framework Programme (FP7/2007-2013) and EFPIA companies’ in kind contribution. SOMAscan and SOMAmer are trademarks of SomaLogic, Inc.
Sally Nelson and Steven Williams are employees of SomaLogic, Inc, and the proteomic assay reported in this manuscript was performed by them using reagents supplied by SomaLogic, Inc. Steven Kiddle is supported by an MRC Career Development Award in Biostatistics (MR/L011859/1). A portion of this work was funded by GE Healthcare and Janssen R&D. The views expressed are those of the author(s) and not necessarily those of the NHS, the NIHR, Department of Health, GEHC and Janssen.
Authors’ disclosures available online (http://j-alz.com/manuscript-disclosures/15-0020r1).
Appendices
The supplementary material is available in the electronic version of this article: http://dx.doi.org/10.3233/JAD-150020.
References
1 | Blennow K, de Leon M, Zetterberg H(2006) Alzheimer’s diseaseLancet368: 387403 |
2 | Querfurth H, LaFerla F (2011) (2010) Alzheimer’s disease. N Engl J Med 362, 329-344. Erratum in N Engl J Med 364, 588 |
3 | Hardy J, Higgins G(1992) Alzheimer’s disease: The amyloid cascade hypothesisScience256: 184185 |
4 | Villemagne V, Pike K, Ch&etelat G, Ellis K, Mulligan R, Bourgeat P, Ackermann U, Jones G, Szoeke C, Salvado O, Martins R, O’Keefe G, Mathis C, Klunk W, Ames D, Masters C, Rowe C(2011) Longitudinal assessment of Aβ and cognition in aging and Alzheimer diseaseAnn Neurol69: 181192 |
5 | Jack C, Knopman D, Jagust W, Petersen R, Weiner M, Aisen P, Shaw L, Vemuri P, Wiste H, Weigand S, Lesnick T, Pankratz V, Donohue M, Trojanowski J(2013) Personal view- tracking pathophysiological processes in Alzheimer’sdisease: An updated hypothetical model of dynamic biomarkersLancet Neurol12: 207216 |
6 | Corbett A, Ballard C(2012) New and emerging treatments for Alzheimer’s diseaseExpert Opin Emerg Drugs17: 147156 |
7 | Doody R, Raman R, Farlow M, Iwatsubo T, Vellas B, Joffe S, Kieburtz K, He F, Sun X, Thomas R, Aisen P, Siemers E, Sethuraman G, Mohs R(2013) A phase 3 trial of semagacestat for treatment of Alzheimer’s diseaseN Engl JMed369: 341350 |
8 | Doody R, Thomas R, Farlow M, Iwatsubo T, Vellas B, Joffe S, Kieburtz K, Raman R, Sun X, Aisen P, Siemers E, Liu-Seifert H, Mohs R(2014) Phase 3 trials of solanezumab for mild-to-moderate Alzheimer’s diseaseN EnglJ Med370: 311321 |
9 | Salloway S, Sperling R, Fox N, Blennow K, Klunk W, Raskind M, Sabbagh M, Honig L, Porsteinsson A, Ferris S, Reichert M, Ketter N, Nejadnik B, Guenzler V, Miloslavsky M, Wang D, Lu Y, Lull J, Tudor I, Liu E, Grundman M, Yuen E, Black R, Brashear H(2014) Two phase 3 trials of bapineuzumab in mild-to-moderate Alzheimer’s diseaseN Engl J Med370: 322333 |
10 | Shneider L, Mangialasche F, Andreasen N, Feldman H, Giacobini E, Jones R, Mantua V, Mecocci P, Pani L, Winblad B, Kivipelto M(2014) Clinical trials and late-stage drug development for Alzheimer’s disease: An appraisal from1984 to 2014J Intern Med275: 251283 |
11 | Aisen P, Vellas B, Hampel H(2013) Moving towards early clinical trials for amyloid-targeted therapy in Alzheimer’s diseaseNat Rev Drug Discov12: 324324 |
12 | Bazenet C, Lovestone S(2012) Plasma biomarkers for Alzheimer’s disease: Much needed but tough to findBiomark Med6: 441454 |
13 | Perrin R, Fagan A, Holtzman D(2009) Multimodal techniques for diagnosis and prognosis of Alzheimer’s diseaseNature461: 916922 |
14 | Koyama A, Okereke O, Yang T, Blacker D, Selkoe D, Grodstein F(2012) Plasma amyloid-β as a predictor ofdementia and cognitive declineArch Neurol69: 824831 |
15 | Thambisetty M, Tripaldi R, Riddoch-Contreas J, Hye A, An Y, Campbell J, Sojkova J, Kinsey A, Lynham S, Zhou Y, Ferrucci L, Wong D, Lovestone S, Resnick S(2010) Proteome-based plasma markers of brain amyloid-beta depositionin non-demented older individualsJ Alzheimers Dis22: 10991109 |
16 | Kiddle S, Thambisetty M, Simmons A, Riddoch-Contreras J, Hye A, Westman E, Pike I, Ward M, Johnston C, Lupton M, Lunnon K, Soininen H, Kloszewska I, Tsolaki M, Vellas B, Mecocci P, Lovestone S, Newhouse S, Dobson R(2012) Plasma based markers of [11C] PiB-PET brain amyloid burdenPLoS One7: e44260 |
17 | Burnham S, Faux N, Wilson W, Laws S, Ames D, Bedo J, Bush A, Doecke J, Ellis K, Head R, Jones G, Kiiveri H, Martins R, Rembach A, Rowe C, Salvado O, Macaulay S, Masters C, Villemagne V(2014) A blood-based predictor forneocortical Aβ burden in Alzheimer’s disease: Results from the AIBL studyMol Psychiatry19: 519526 |
18 | Sattlecker M, Kiddle S, Newhouse S, Proitsi P, Nelson S, Williams S, Johnston C, Killick R, Simmons A, Westman E, Hodges A, Soininen H, Kłoszewska I, Mecocci P, Tsolaki M, Vellas B, Lovestone S, Dobson RConsortium t A(2014) Alzheimer’s disease biomarker discovery using SOMAscan multiplexed protein technologyAlzheimersDement10: 724734 |
19 | Ashton N, Kiddle S, Graf J, Ward M, Baird A, Hye A, Westwood S, Wong K, Dobson R, Rabinovici G, Miller B, RosenH , Torres A, Zhang Z, Thurfjell L, Covin A, Hehir C, Baker D, Bazenet C, Lovestone SThe AIBL, Research, Group(2015) Blood protein predictors of brain amyloid for enrichment in clinical trials?Alzheimers Dement(Amst)1: 4860 |
20 | Gold L, Ayers D, Bertino J, Bock C, Bock A, Brody E, Carter J, Dalby A, Eaton B, Fitzwater T, Flather D, Forbes A, Foreman T, Fowler C, Gawande B, Goss M, Gunn M, Gupta S, Halladay D, Heil J, Heilig J, Hicke B, Husar G, Janjic N, Jarvis T, Jennings S, Katilius E, Keeney T, Kim N, Koch T, Kraemer S, Kroiss L, Le N, Levine D, Lindsey W, Lollo B, Mayfield W, Mehan M, Mehler R, Nelson S, Nelson M, Nieuwlandt D, Nikrad M, Ochsner U, Ostroff R, OtisM , Parker T, Pietrasiewicz S, Resnicow D, Rohloff J, Sanders G, Sattin S, Schneider D, Singer B, Stanton M, Sterkel A, Stewart A, Stratford S, Vaught J, Vrkljan M, Walker J, Watrobka M, Waugh S, Weiss A, Wilcox S, Wolfson A, Wolk S, Zhang C, Zichi D(2010) Aptamer-based multiplexed proteomic technology for biomarker discoveryPLoS One5: e15004 |
21 | Zhao X, Lejnine S, Spond J, Zhang C, Ramaraj T, Holder D, Dai H, Weiner R, Laterza O(2015) A candidate plasmaprotein classifier to identify Alzheimer’s diseaseJ Alzheimers Dis43: 549563 |
22 | O’Bryant S, Gupta V, Henriksen K, Edwards M, Jeromin A, Lista S, Bazenet C, Soares H, Lovestone S, Hampel H, Montine T, Blennow K, Foroud T, Carrillo M, Graff-Radford N, Laske C, Breteler M, Shaw L, Trojanowski J, SchupfN , Rissman R, Fagan A, Oberoi P, Umek R, Weiner M, Grammas P, Posner H, Martins Rand for the STAR-B and BBBIGworking groups(2014) Guidelines for the standardization of preanalytic variables for blood-based biomarkerstudies in Alzheimer’s disease researchAlzheimers Dement10.1016/j.jalz.2014.08.099 |
23 | Kraemer S, Vaught J, Bock C, Gold L, Katilius E, Keeney T, Kim N, Saccomano N, Wilcox S, Zichi D, Sanders G(2011) From SOMAmer-based biomarker discovery to diagnostic and clinical applications: A SOMAmer-based, streamlined multiplex proteomic assayPLoS One6: e26332 |
24 | Rowe C, Ellis K, Rimajova M, Bourgeat P, Pike K, Jones G, Fripp J, Tochon-Danguy H, Morandeau L, O’Keefe G, Price R, Raniga P, Robins P, Acosta O, Lenzo N, Szoeke C, Salvado O, Head R, Martins R, Masters C, Ames D, Villemagne V(2010) Amyloid imaging results from the Australian Imaging, Biomarkers and Lifestyle (AIBL) study of agingNeurobiol Aging31: 12751283 |
25 | Lopresti B, Klunk W, Mathis C, Hoge J, Ziolko S, Lu X, Meltzer C, Schimmel K, Tsopelas N, DeKosky S, Price J(2005) Simplified quantification of Pittsburgh compound B amyloid imaging PET studies: A comparative analysisJ Nucl Med46: 19591972 |
26 | RCore Team. (2014) R: A Language and Environment for Statistical Computing. R Foundation for Statistical Computing, Vienna, Austria |
27 | Menni C, Kiddle SJ, Mangino M, Viñuela A, Psatha M, Steves C, Sattlecker M, Buil A, Newhouse S, Nelson S, Williams S, Voyle N, Soininen H, Kloszewska I, Mecocci P, Tsolaki M, Vellas B, Lovestone S, Spector TD, Dobson R, Valdes AM(2014) Circulating proteomic signatures of chronological ageJ Gerontol A Biol Sci Med Sci10.1093/gerona/glu121 |
28 | Yang X, Scheid S, Lottaz C(2008) OrderedList: Similarities of Ordered Gene ListsR package version 1.36.0 |
29 | Altman D, Royston P(2006) Statistics Notes: The cost of dichotomising continuous variablesBMJ Open332: 10801080 |
30 | Kuhn J, Contributions fromWing J, Weston S, Williams A, Keefer C, Engelhardt A, Cooper T, Mayer Z, theRCore TeamBenesty M, Lescarbeau R, Ziem A, Scrucca L(2014) caret: Classification and Regression TrainingR package version 6.0-35 |
31 | Benjamini Y, Yekutieli D(2001) The control of the false discovery rate in multiple testing under dependencyAnn Stat29: 11651188 |
32 | Grömping U(2006) Relative importance for linear regression in R: The package relaimpoJ Stat Softw17: 127 |
33 | Karatzoglou A, Smola A, Hornik K, Zeileis A(2004) kernlab – An S4 package for kernel methods in RJ-Stat Softw11: 120 |
34 | Chiam J, Dobson R, Kiddle S, Sattlecker M(2015) Are blood-basedprotein biomarkers for Alzheimer’s disease also involved in otherbrain disorders? A systematic reviewJ Alzheimers Dis43: 303314 |
35 | Lunnon K, Ibrahim Z, Proitsi P, Lourdusamy A(2012) Mitochondrial dysfunction and immune activation aredetectable in early Alzheimer’s disease bloodJ Alzheimers Dis30: 685710 |
36 | Doecke J, Laws S, Faux N, Wilson W, Burnham S, Lam C, Mondal A, Bedo J, Bush A, Brown B, De Ruyck K, Ellis K, Fowler C, Gupta V, Head R, Macaulay S, Pertile K, Rowe C, Rembach A, Rodrigues M, Rumble R, Szoeke C, Taddei K, Taddei T, Trounson B, Ames D, Masters C, Martins Rthe Alzheimer’s Disease Neuroimaging Initiative and Australian Imaging Biomarker and Lifestyle Research, Group(2012) Blood-based protein biomarkers for diagnosis of AlzheimerdiseaseArch Neuro69: 1318 |
37 | Soares H, Potter W, Pickering E, Kuhn M, Immermann F, Shera D, Ferm M, Dean R, Simon A, Swenson F, Siuciak J, Kaplow J, Thambisetty M, Zagouras P, Koroshetz W, Wan H, Trojanowski J, Shaw Land the Biomarkers Consortium Alzheimer’s Disease Plasma Proteomics Project(2012) Biomarkers associated with the apolipoprotein E genotype andAlzheimer diseaseArch Neurol69: 13101317 |
38 | O’Bryant SE, Xiao G, Barber R, Huebinger R, Wilhelmsen K, Edwards M, Graff-Radford N, Doody R, Diaz-Arrastia Rfor the Texas Alzheimer–s Research & Care Consortium,for the Alzheimer–s Disease Neuroimaging, Initiative(2011) A blood-based screening tool for Alzheimer’s disease that spans serum and plasma: Findings from TARC and ADNIPLoS One6: e28092 |
39 | Decraene T, Vandewalle C, Pipeleers D, Gorus fand the Belgian Diabetes Registry(1992) Increased concentrations of total IgM at clinical onset of type 1 (insulin-dependent) diabetes: Correlation with IgM binding to cellsClin Chem38: 1762767 |
40 | Mayeux R(2004) Biomarkers: Potential uses and limitationsNeuroRx1: 182188 |
41 | De Groote M, Nahid P, Jarlsberg L, Johnson J, Weiner M, Muzanyi G, Janjic N, Sterling D, Ochsner U(2013) Elucidating novel serum biomarkers associated with pulmonary tuberculosis treatmentPLoS One8: e61002 |
42 | Snowdon D(1997) Aging and Alzheimer’s disease: Lessons from the Nun studyGerontologist37: 150156 |
43 | Dubois B, Feldman H, Jacova C, Hampel H, Molinuevo J, Blennow K, DeKosky S, Gauthier S, Selkoe D, Bateman R, Cappa S, Crutch S, Engelborghs S, Frisoni G, Fox N, Galasko D, Habert M, Jicha G, Nordberg A, Pasquier F, Rabinovici G, Robert P, Rowe C, Salloway S, Sarazin M, Epelbaum S, de Souza L, Vellas B, Visser P, Schneider L, Stern Y, Scheltens P, Cummings J(2014) Advancing research diagnostic criteria for Alzheimer’s disease: The IWG-2criteriaLancet Neurol13: 614629 |
Figures and Tables
Fig.1
Overview of data analysis.
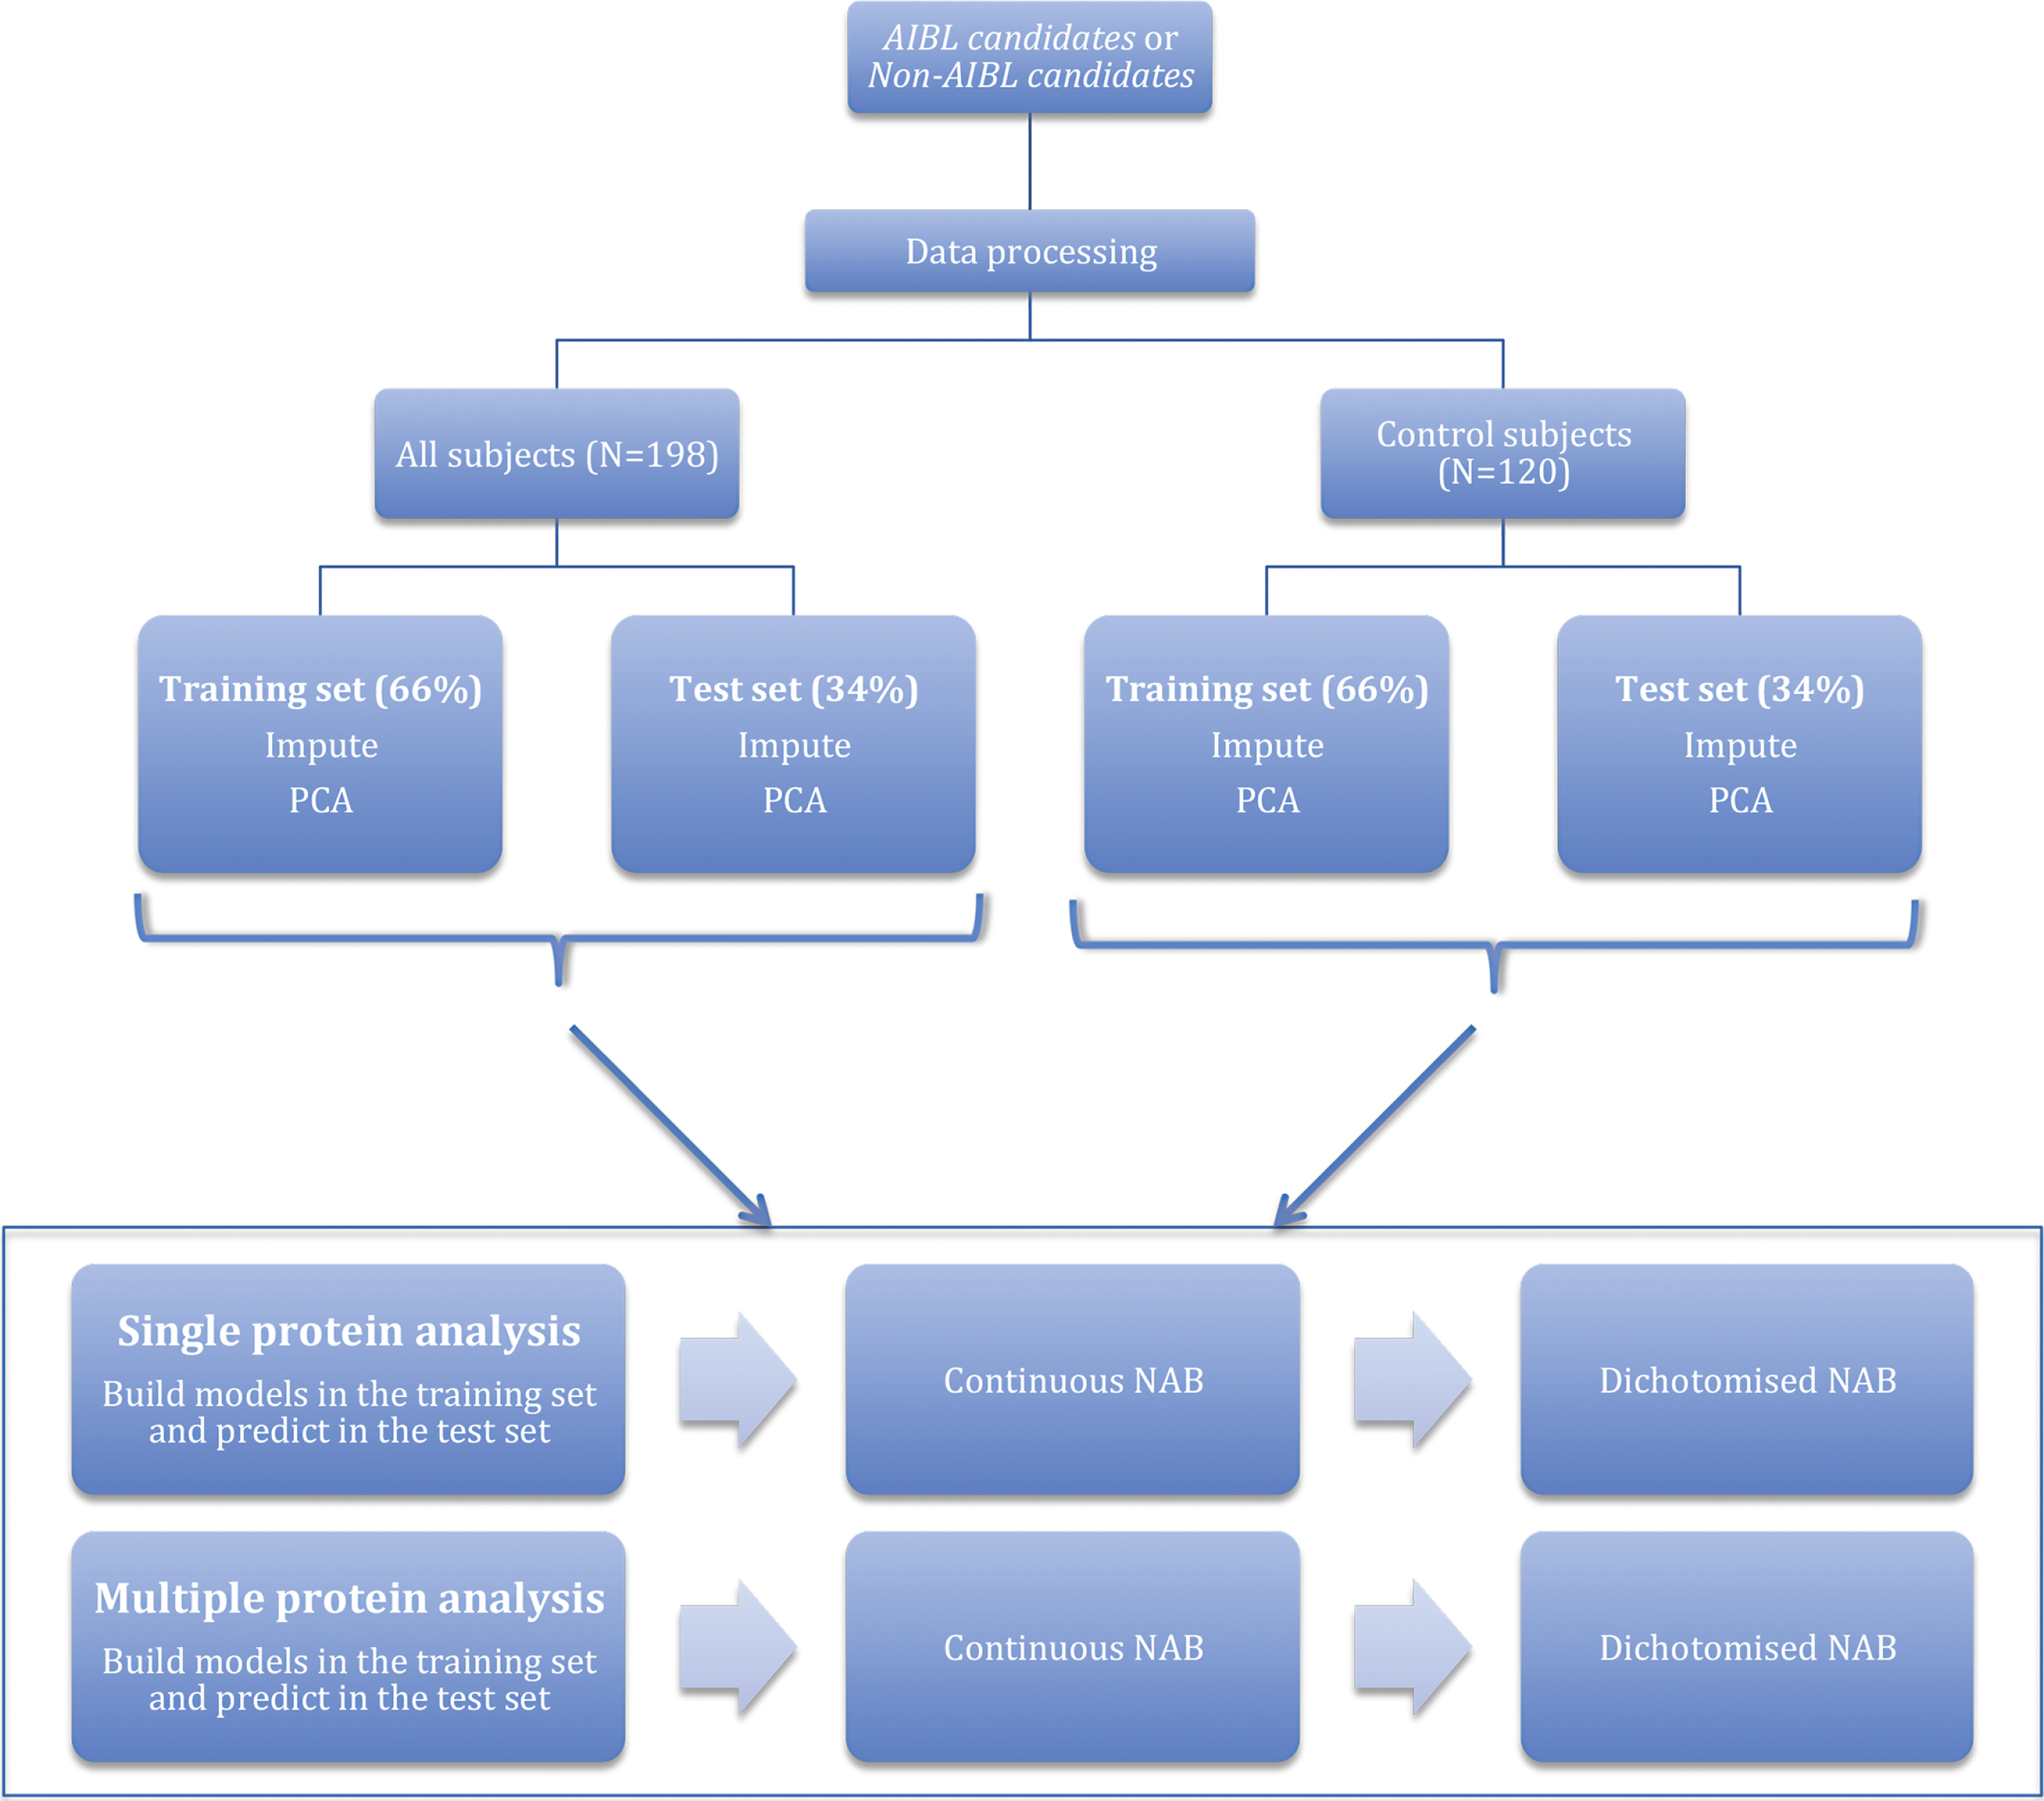
Fig.2
Regression fit for PPY modeling dichotomized NAB in all samples: training data.
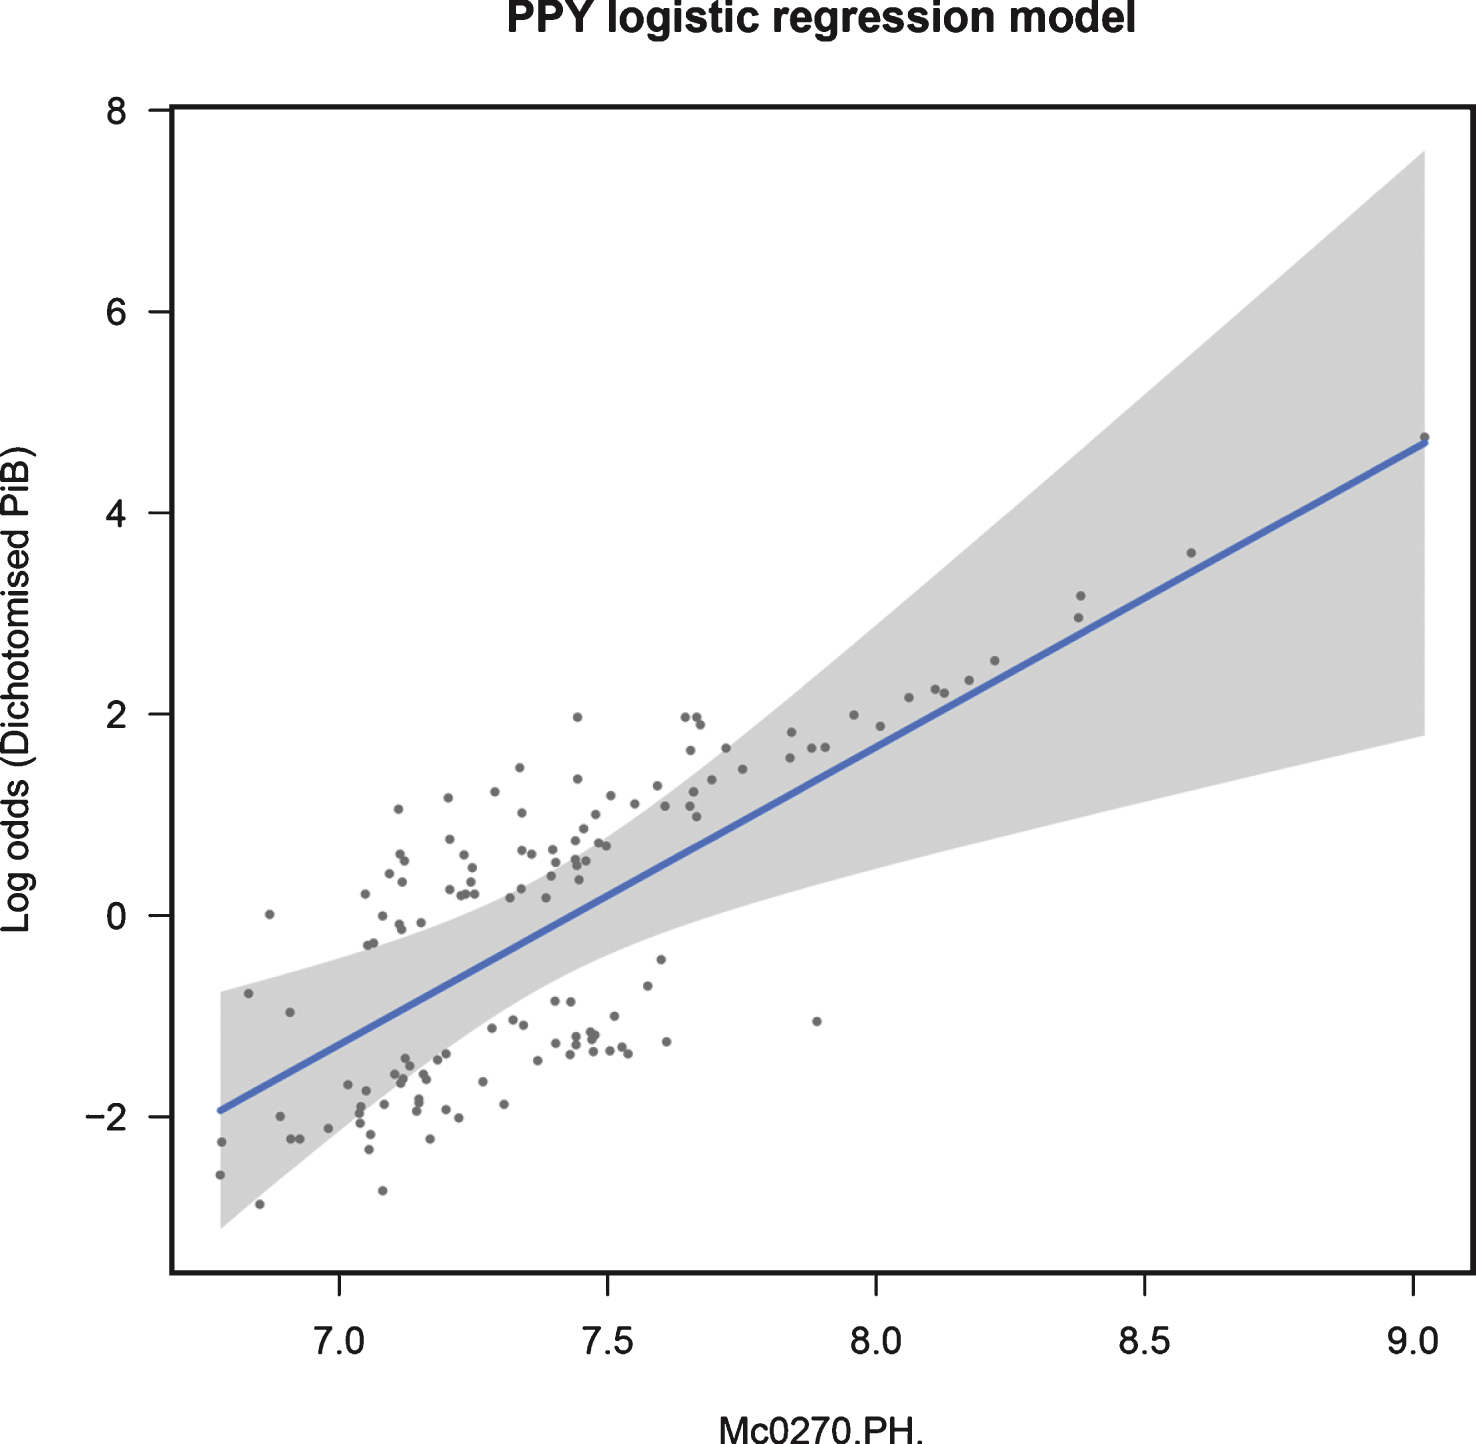
Fig.3
Regression fit for IgM modeling continuous NAB in control samples: training data.
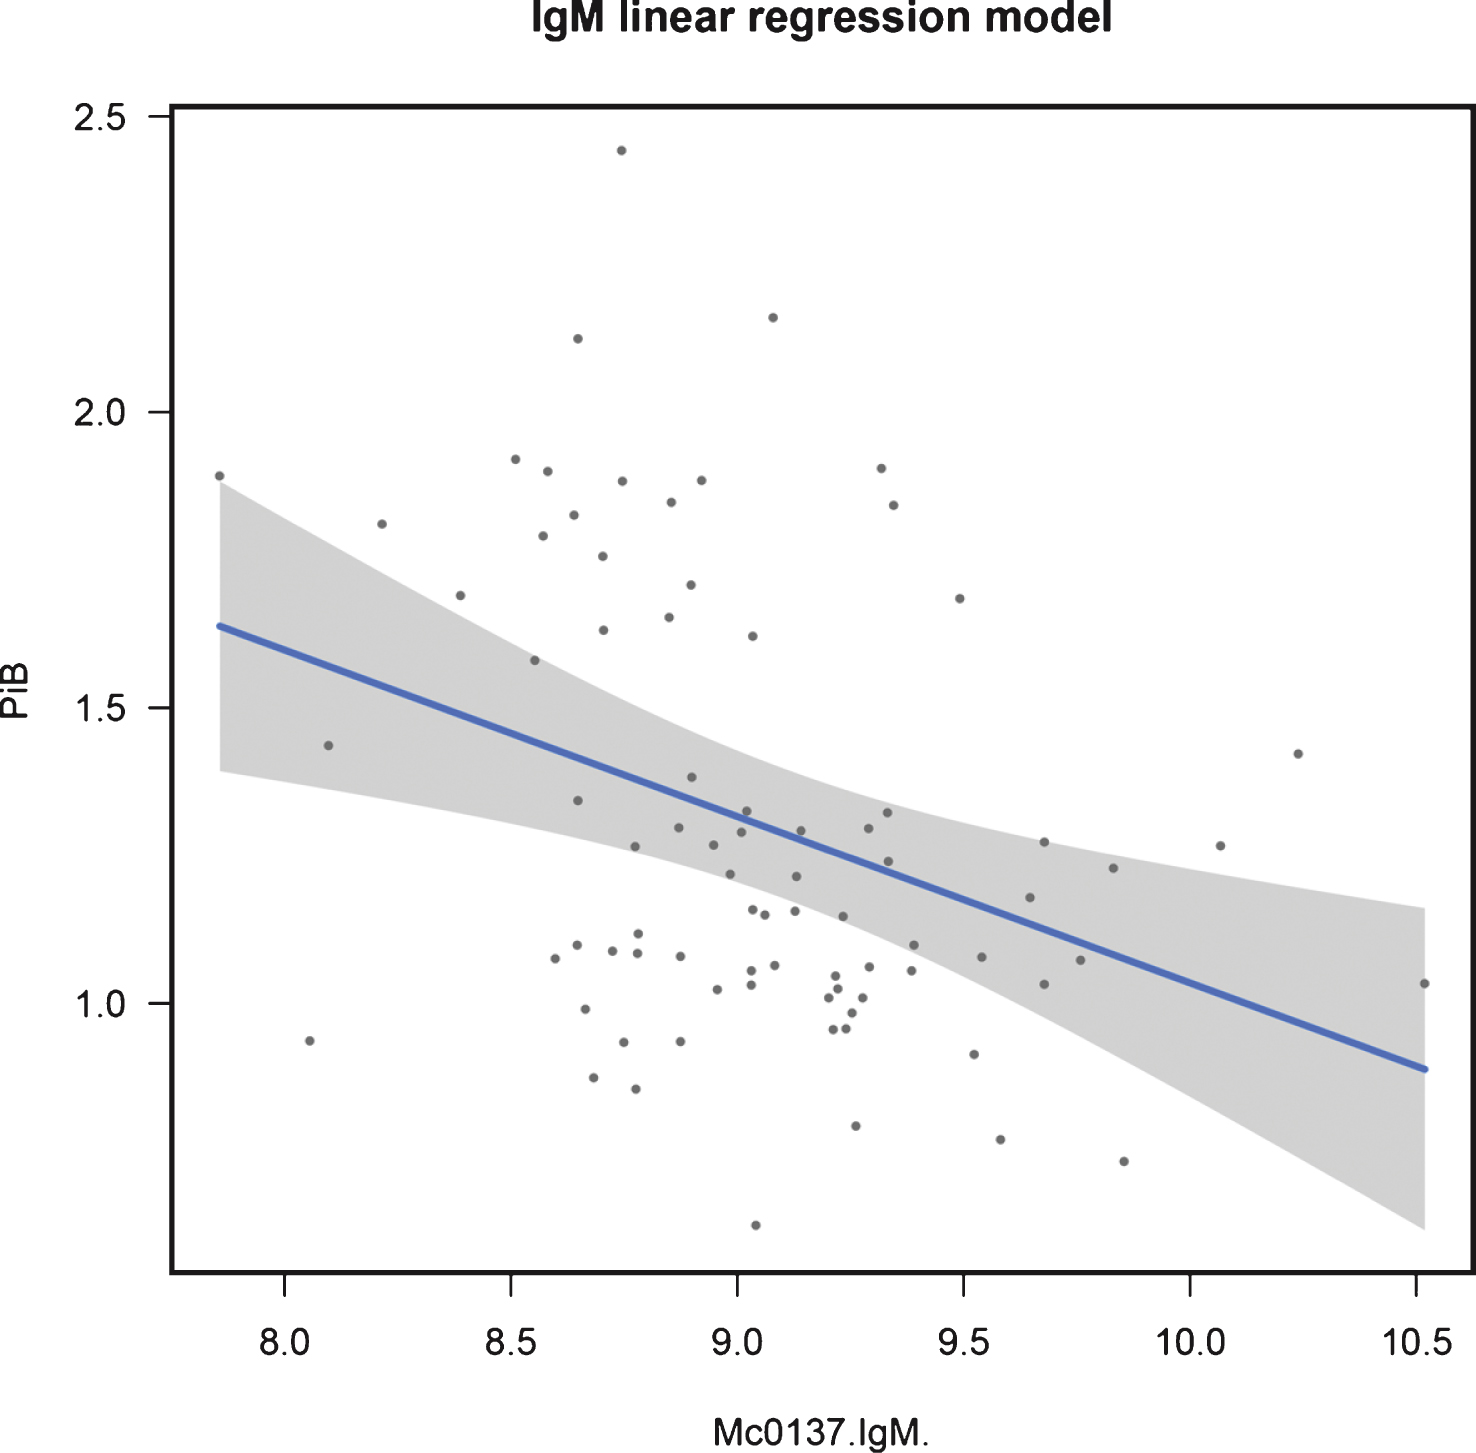
Table 1
Candidate proteins
| Protein | Gene |
UniProt ID |
Ashton et al. [19] |
Burnham et al. [25] |
Kiddle et al. [24] |
Thambisetty et al. [23] | Total | Comments |
| Complement C3 | C3 | P01024 | X | X | X | 3 | 5 probes present. | |
| Apolipoprotein E | APOE | P02649 | X | X | 2 | 3 probes present. | ||
| Fibrinogen (α, β, γ) | FG | P02671, | X | X | 2 | 3 probes present. Separate | ||
| P02675, P02679 | signal from α and γ chains [19] | |||||||
| Haptoglobin | HP | P00738 | X | X | 2 | |||
| Pancreatic Polypeptide | PPY | P01298 | X | X | 2 | |||
| Aβ 1 - 42 | X | 1 | Not present in AIBL SOMAscan. | |||||
| Albumin | ALB | P02768 | X | 1 | ||||
| Alpha 1 Antitrypsin | SERPINA1 | P01009 | X | 1 | ||||
| Alpha 2 Macroglobin | A2M | P01023 | X | 1 | ||||
| Apolipoprotein A | LPA | P08519 | X | 1 | Not present in AIBL SOMAscan. | |||
| Apolipoprotein A1 | APOA1 | P02647 | X | 1 | ||||
| Apolipoprotein A4 | APOA4 | P06727 | X | 1 | Not present in AIBL SOMAscan. | |||
| Apolipoprotein L1 | APOL1 | O14791 | X | 1 | Not present in AIBL SOMAscan. | |||
| AXL Receptor Tryosine Kinase | AXL | P30530 | X | 1 | Not present in AIBL SOMAscan. | |||
| C-Peptide | INS | P01308 | X | 1 | Not present in AIBL SOMAscan. | |||
| C4b Binding Protein Alpha Chain | C4BPA | P0C0L4 | X | 1 | ||||
| Chemokine Ligand 13 | CXCL13 | O43927 | X | 1 | ||||
| Clusterin | CLU | P10909 | X | 1 | ||||
| Complement Factor B | CFB | P00751 | X | 1 | ||||
| Complement Factor H | CFH | P08603 | X | 1 | ||||
| Complement Factor H | CFHR1 | Q03591 | X | 1 | Not present in AIBL SOMAscan. | |||
| Related Protein 1 | ||||||||
| Cortisol | (N/A) | (N/A) | X | 1 | Not present in AIBL SOMAscan. | |||
| Free Thyroxine | (N/A) | (N/A) | X | 1 | Not present in AIBL SOMAscan. | |||
| Gelsolin | GSN | P06396 | X | 1 | ||||
| Hemopexin | HPX | P02790 | X | 1 | ||||
| Histidine-rich Glycoprotein | HRG | P04196 | X | 1 | ||||
| Ig Gamma 1 Chain C Region | IGHG1 | P01857 | X | 1 | ||||
| Immunoglobulin E | (N/A) | (N/A) | X | 1 | Not present in AIBL SOMAscan. | |||
| Immunoglobin M 1 | IGHM | P01871 | X | 1 | ||||
| Interleukin 13 | IL13 | P35225 | X | 1 | ||||
| Interleukin 17 | IL17 | Q16552 | X | 1 | ||||
| Interleukin 3 | IL3 | P08700 | X | 1 | ||||
| Leptin | LEP | P41159 | X | 1 | ||||
| Macrophage Inflammatory | CCL3 | P10147 | X | 1 | ||||
| Protein (1α) | ||||||||
| Matrix Metalloproteinase 9 Total | MMP9 | P14780 | X | 1 | ||||
| Plasminogen | PLG | P00747 | X | 1 | ||||
| Serotransferrin | TF | P02787 | X | 1 | ||||
| Serum Amyloid p-Component | APCS | P02743 | X | 1 | ||||
| Vascular Cell Adhesion Protein | VCAM1 | P19320 | X | 1 | ||||
| Vitronectin | VTN | P04004 | X | 1 | Not present in AIBL SOMAscan. | |||
| Von Willebrand Factor | VWF | P04275 | X | 1 | ||||
| Amyloid-β Protein Precursor | AβPP | P05067 | 0 | Included as an alternative to Aβ 1 - 42 | ||||
Table 2
Population demographics
|
Total n = 198 |
Overall p -value |
High NAB n = 107 |
Low NAB n = 91 |
High/Low p -value | |
| Gender (% female) | 50 | 0.96 | 49 | 52 | 0.78 |
| APOE status (% of APOE ɛ4 positive) | 51 | <0.001 | 61 | 50 | 0.004 |
| APOE ɛ4 load (% with loads 0; 1; 2) | 49; 43; 8.1 | <0.001 | 39; 48; 13 | 60; 37; 2.2 | 0.002 |
| Median age [IQR] (years) | 72 [14] | <0.001 | 76 [11] | 68 [12] | <0.001 |
| Median MMSE score [IQR] | 28 [3.0] | <0.001 | 28 [4.0] | 29 [2.0] | <0.001 |
| Global CDR status (% >0) | 44 | <0.001 | 64 | 21 | <0.001 |
| Clinical diagnosis (% with diagnosis | 14; 26; 61 | 0.28 | 25; 35; 40 | 0; 15; 85 | <0.001 |
| AD; MCI; Control) |
Individuals were positive for APOE ɛ4 if at least one APOE ɛ4 allele was seen in their genotype. APOE ɛ4 load was the number of ɛ4 alleles seen in a subject’s genotype. IQR, inter-quartile range; MMSE, Mini-Mental State Examination; CDR, Clinical Dementia Rating. Overall p-value: Result of the Kendall tau test for dependence between SUVR and the demographics variable. High/low p-value: Kruskal Wallis Chi-Squared was used to test between high and low groups for continuous data. High/low p-value: Fishers exact was used to test between high and low groups for categorical data.
Table 3
Candidate proteins of the same UniProt ID
| UniProt ID | Proteins |
Minimum-Maximum Correlation |
| P01024 | C3; C3adesArg; C3b; | 0.468 –0.964 |
| iC3b; C3a; C3d | ||
| P02671 | Fibrinogen; D-dimer | 0.651 |
| P02649 | APOE; APOE3; APOE4 | 0.787 –0.894 |
Table 4
Multiple protein analysis: dichotomized NAB
| Population | Candidates | Method | Test data | |||||
| Accuracy |
Accuracy Empirical p -value | Sensitivity |
Sensitivity Empirical p -value | Specificity |
Specificity Empirical p -value | |||
| All | Non-AIBL | Logistic regression | 0.522 | 0.833 | 0.613 | 0.941 | 0.444 | 0.352 |
| [Age, APOE ɛ4 number, IL13, PPY, | ||||||||
| APOE PC1, C3 PC1] | ||||||||
| SVM | 0.54 | – | 0.5 | – | 0.58 | – | ||
| AIBL | Logistic regression | 0.612 | 0.119 | 0.645 | 0.78 | 0.583 | 0.026 | |
| [Age, APOE ɛ4 number, BLC, | ||||||||
| Clusterin, PPY, C4, Hemopexin] | ||||||||
| SVM | 0.63 | – | 0.59 | – | 0.67 | – | ||
| Age and | Logistic regression | 0.567 | – | 0.774 | – | 0.389 | – | |
| APOE | [Age and APOE ɛ4 number] | |||||||
| SVM | 0.61 | – | 0.57 | – | 0.66 | – | ||
| Controls | Non-AIBL | Logistic regression | 0.575 | 0.693 | 0.5 | 0.053 | 0.636 | 0.963 |
| [Age, APOE ɛ4 number, vWF, PPY, | ||||||||
| APOE PC1, C3 PC1, Fibrinogen | ||||||||
| PC1] | ||||||||
| SVM | 0.65 | – | 0.7 | – | 0.63 | – | ||
| AIBL | Logistic regression | 0.675 | 0.083 | 0.444 | 0.217 | 0.864 | 0.155 | |
| [Age, IgM, BLC, Alpha-2-Macroglobulin, | ||||||||
| PPY, Gelsolin, Factor B, Hemopexin] | ||||||||
| SVM | 0.7 | – | 1 | – | 0.65 | – | ||
| Age and | Logistic regression | 0.65 | – | 0.333 | – | 0.909 | – | |
| APOE | [Age and APOE ɛ4 number] | |||||||
| SVM | 0.55 | – | NA ** | – | 0.55 | – | ||
PC1, First Principal Component; SVM, Support Vector Machine. **All samples are predicted to have low NAB.
Table 5
Multiple protein analysis: continuous NAB
| Population | Candidates | Method | Test data | |||
| R2 |
R2
Empirical p -value | RMSE |
RMSE Empirical p -value | |||
| All | Non-AIBL | Linear regression | 0.245 | 0.043 | 0.49 | 0.041 |
| [Age, APOE ɛ4 number, | ||||||
| Albumin PPY] | ||||||
| SVM | 0.15 | – | 0.52 | – | ||
| AIBL | Linear regression | 0.226 | 0.061 | 0.497 | 0.058 | |
| [Age, APOE ɛ4 | ||||||
| number, BLC, C4] | ||||||
| SVM | 0.15 | – | 0.53 | – | ||
| Age and APOE | Linear regression | 0.219 | – | 0.5 | – | |
| [Age and APOE ɛ4 number] | ||||||
| SVM | 0.1 | – | 0.53 | – | ||
| Controls | Non-AIBL | Linear regression | 0.241 | 0.215 | 0.356 | 0.226 |
| [Age, APOE ɛ4 number, | ||||||
| vWF, PPY, Plasmingen] | ||||||
| SVM | 0.23 | – | 0.36 | – | ||
| AIBL | Linear regression | 0.17 | 0.371 | 0.392 | 0.537 | |
| [Age, APOE ɛ4 number, | ||||||
| IgM, BLC, Alpha-2-Macroglobulin, | ||||||
| HRG, Factor B, Hemopexin] | ||||||
| SVM | 0.25 | – | 0.36 | – | ||
| Age and APOE | Linear regression | 0.273 | – | 0.349 | – | |
| [Age and APOE ɛ4 number] | ||||||
| SVM | 0.02 | – | 0.41 | – | ||
PC1, First Principal Component; SVM, Support Vector Machine.

