
Excess Costs Associated with Possible Misdiagnosis of Alzheimer’s Disease Among Patients with Vascular Dementia in a UK CPRD Population
Abstract
Background: Prior diagnosis of Alzheimer’s disease (AD) among patients later diagnosed with vascular dementia (VaD) has been associated with excess costs, suggesting potential benefits of earlier rule-out of AD diagnosis.
Objective: To investigate whether prior diagnosis with AD among patients with VaD is associated with excess costs in the UK.
Methods: Patients with a final VaD diagnosis, continuous data visibility for≥6 months prior to index date, and linkage to Hospital Episode Statistics data were retrospectively selected from de-identified Clinical Practice Research Datalink data. Patients with AD diagnosis before a final VaD diagnosis were matched to similar patients with no prior AD diagnosis using propensity score methods. Annual excess healthcare costs were calculated for 5 years post-index, stratified by time to final diagnosis.
Results: Of 9,311 patients with VaD, 508 (6%) had prior AD diagnosis with a median time to VaD diagnosis exceeding 2 years from index date. Over the entire follow-up period, patients with prior AD diagnosis had accumulated healthcare costs that were approximately GBP2,000 higher than those for matched counterparts (mostly due to higher hospitalization costs). Cost differentials peaked particularly in the period including the final VaD diagnosis, with excess costs quickly declining thereafter.
Conclusion: Potential misdiagnosis of AD among UK patients with VaD resulted in substantial excess costs. The decline in excess costs following a final VaD diagnosis suggests potential benefits from earlier rule-out of AD.
INTRODUCTION
The Alzheimer’s Society in the UK estimates that 1 in 14 (∼7%) of the UK population aged 65 years or over currently has some form of dementia [1]. Alzheimer’s disease (AD) is the most common cause of dementia, accounting for approximately 62% of all dementias in the UK, followed by vascular dementia (VaD) at 17% and mixed dementia at 10% [1]. Other less common causes of dementia include dementia with Lewy bodies (4%) and frontotemporal dementias (2%). The Society also estimates that the annual cost of care for individuals with dementia in the UK exceeds GBP26 billion, 44% of which is accounted for by ‘unpaid’, informal care provided by family members and other caregivers [1].
The diagnosis and management of patients with dementia can be challenging due to potential overlap in the clinical presentations of various dementia etiologies [2]. Indeed, the rate of misdiagnosis for multiple types of dementia is substantial in both clinical and research settings, even when strict diagnostic criteria are used, as shown by neuropathological and neuroimaging evaluations [3–5]. In a recent assessment of US Medicare beneficiaries who were eventually diagnosed with VaD, Hunter et al. found that a substantial proportion (17%) had previously been misdiagnosed with AD [6]. Hence, additional testing may be necessary to accurately diagnose the cause of any cognitive impairment detected by clinical assessment [7]. An accurate and timely diagnosis is an important first step for patients, families, physicians, and policy makers alike, as it helps ensure that the patient’s prognosis, treatment, and overall management are appropriate.
The above-mentioned study by Hunter et al. [6] evaluated the medical costs among patients eventually diagnosed with VaD who had been previously misdiagnosed with AD compared with costs among similar matched patients with no prior AD diagnosis [6]. Those with a history of AD diagnosis incurred significantly higher medical costs until a final diagnosis of VaD, following which the costs for the two groups eventually converged. Because of limitations in the data source, this US study was unable to include information relating to use of prescription drugs. The primary objectives of the present study were to evaluate the patterns of resource use and costs, including those associated with prescription drug use, in patients with VaD and prior AD diagnosis versus those with no prior AD diagnosis, and to determine whether a potential misdiagnosis of AD among patients with a final diagnosis of VaD is associated with excess costs in the UK.
MATERIALS AND METHODS
Data sources
The study was conducted using data from the Clinical Practice Research DataLink (CPRD), which provides information about medical diagnoses (based on Read codes), laboratory testing, and medications prescribed by primary care physicians for over5 million active beneficiaries [8]. In addition, for about 55% of the beneficiaries in CPRD, detailed records on hospitalizations, including medical diagnoses (based on International Classification of Diseases 10th revision [ICD-10] coding) and procedures, were obtained from Hospital Episodes Statistics (HES) data [9]. Mortality data were obtained from the Office of National Statistics (ONS) [9]. The study protocol and statistical analysis plan were developed a priori and approved by the Independent Scientific Advisory Committee for MHRA Database Research (protocol number 13_160R).
Healthcare cost data were not directly available from the CPRD or HES datasets. These were estimated as the product of frequency of use of a particular medical service (as observed in CPRD/HES) and the unit cost associated with that service. Specifically, the unit costs for medical services used by patients in the primary care setting were obtained from the annually published Unit Costs of Health & Social Care publication, prepared by the Personal Social Services Research Unit (PSSRU) [10]. The unit costs for hospitalizations were estimated using the unit costs associated with healthcare resource groups for various hospital spells (a spell consisted of one or more consecutive and/or overlapping hospitalization episodes), as obtained from the National Schedule of Reference Costs for UK National Health Service (NHS) trusts and NHS foundation trusts [11]. The unit costs for referrals and laboratory/diagnostic tests were also estimated using the National Schedule of Reference Costs for NHS. Finally, prescription medication use in the study was captured as recorded in the CPRD [8], and the unit costs of these medications were estimated using data from First Databank [12].
All costs were estimated in 2013 British pounds (GBP), adjusting for inflation using the Consumer Price Inflation Reference Tables published by the ONS [13]; analyses were conducted from the perspective of the UK NHS.
Study sample
A cohort of patients with a diagnosis of VaD was identified as follows: First, all patients with a diagnosis of dementia (AD, VaD, frontotemporal dementia, dementia with Lewy bodies, normal-pressure hydrocephalus, and Parkinson’s dementia) or any diagnosis or symptom code for cognitive decline (other than the specific dementias mentioned above, e.g., senile dementia, presenile dementia, unspecified dementia) were identified from CPRD data using Read and ICD-10 codes (Fig. 1; see Supplementary Tables 1 and 2 for relevant Read and ICD-10 codes) and linked to HES data. Then those patients with a VaD diagnosis in their most recent dementia record were selected for inclusion in the study. In order to eliminate patients with mixed dementias to as great an extent as possible, those with records of concomitant or interspersed diagnoses for different types of dementia between their first and last diagnoses were excluded: Specifically, to be included in the study, patients were required to have no other dementia diagnoses (including AD) after the most recent VaD diagnosis over up to 5 years of follow up. Additionally, patients with multiple records of VaD were required to have no diagnosis for another type of dementia between their first and last VaD diagnoses; the first of the two consecutive diagnoses was defined as the final diagnosis of VaD (Fig. 2). Among the patients with VaD selected for the study, the index date was defined as the date of the first VaD diagnosis or an earlier observed diagnosis of a dementia-like condition or cognitive decline, in order to follow patients from the first observed evidence of dementia symptom onset. Patients were additionally required to have data available for 6 months prior to and including their index date (baseline period), and were followed until censored (see Fig. 2).
The primary aim of this analysis was to study the differences in medical resource use and costs for patients with a final diagnosis of VaD who were previously diagnosed with AD relative to those with no prior AD diagnosis. Therefore, patients with a final diagnosis of VaD were separated into two groups based on the presence or absence of AD diagnosis prior to final diagnosis of VaD (Fig. 1).
Outcomes and analytical approach
Baseline patient characteristics
Information was collected on the following patient characteristics during the baseline period: Patient demographics, comorbidity profile (using the Charlson Comorbidity Index [CCI], calculated as detailed in Khan et al. [14] and Quan et al. [15]), and healthcare resource use (including medication use, clinician visits, hospitalizations, and referrals to specialists). These characteristics were compared between patients with VaD with and without prior AD diagnosis using Chi-squared tests for categorical variables and Wilcoxon rank-sum tests for continuous variables.
Propensity score matching
To account for observable confounding factors, the two groups were matched using propensity score techniques. First, the likelihood of being diagnosed with AD based on observed baseline characteristics was estimated using logistic regression models, with indicator of AD as the dependent variable and patient demographics, year of index date, medication use, and medical resource use as the independent variables. The two groups were then matched 1:1 using a propensity score-based ‘optimal’ matching method employing a caliper equal to one-fourth of the standard deviation of the propensity scores [16, 17]. To enable evaluation of excess medical resource use and costs associated with prior AD diagnosis over time, patients were also matched on length of follow-up. In particular, comparator patients were required to have at least the same length of follow-up (in full years) as their matched cases.
Following matching, patient characteristics were re-evaluated using McNemar’s tests for categorical variables and Wilcoxon signed rank tests for continuous variables to determine whether observable differences remained between the matched cohorts.
Time to final diagnosis of vascular dementia
The time from index date to final diagnosis of VaD (in months) was estimated for both cohorts (prior to matching) using Kaplan–Meier survival analyses;log-rank tests were used to detect any statistical significance between cohorts. Additionally, the proportional hazard of delay in a final diagnosis of VaD due to the presence of prior AD diagnosis was estimated before matching using a Cox proportional hazard model that accounted for various baseline patient characteristics.
Healthcare utilization and costs
Annual frequencies of medical services used over time were compared between matched pairs for up to 5 years post-index. The following categories of resource use were evaluated: Clinical, surgical, telephone, and home consultations; referrals to psychiatrists, neurologists, or gerontologists; hospitalizations; laboratory and diagnostic testing; and medication use. The proportions of patients in each group with any resource use in each category were compared using McNemar’s tests for matched pairs. Consultations and number of prescription medications were approximately log-normally distributed, while the rest of the outcomes followed an approximate negative binomial distribution. As such, paired t-tests were used to evaluate the statistical significance of differences in the numbers of consultations and prescription medications following log transformations, whereas generalized linear models with a negative binomial distribution and log link were used for other outcome measures.
Annual incremental costs (in GBP, year 2013 values) paid by the NHS to providers for medical services and prescription drugs used by patients with VaD and prior AD diagnosis, relative to their matched controls, were estimated for up to 5 years post-index. Annual excess costs in the years leading up to and following final diagnosis of VaD were also estimated for up to 5 years post-index. To avoid annualization of partial years that might be disproportionately affected by end-of-life care, the analysis for each year of follow-up included only those patients observable for the complete year.
The approach used to estimate the costs associated with each category of resource use is given in Supplementary Table 3. If no use was recorded for any resource, costs were assumed to be zero. Total medical costs were estimated as the sum of costs across all places of service examined. Total healthcare costs were estimated as the sum of medical costs and prescription drug costs. The statistical significance of differences in costs between the two groups was evaluated using bias-corrected bootstrapping.
Sensitivity analyses
Sensitivity analyses were conducted to determine the generalizability of the propensity score-matching analysis (i.e., whether the exclusion of a subset of patients from the analysis, because of matching, affected findings) using multivariate modeling of the entire pre-match sample. Risk-adjusted healthcare costs were estimated for the full sample (before matching) using generalized linear regression models with a log link and a gamma distribution of the error term. Another sensitivity analysis was conducted in which the index date was redefined as the date of first AD diagnosis for patients with prior AD, and as the date of final diagnosis of VaD for those with no prior AD. The analyses were conducted for this reoriented sample using similar baseline and follow-up periods as those used for the core sample (i.e., a 6-month baseline period prior to the new index date was used to evaluate patient characteristics and conduct propensity score matching, and annual follow-up periods continued until the end of data availability or the patient’s death). A final sensitivity analysis was conducted to assess whether the presence of depression could impact excess costs by estimating excess costs among a subset of VaD patients with no indication of depression (identified using Read codes, ICD-10 codes, or prescriptions for antidepressant medication) during the 6 months prior to their index date. All models accounted for the same set ofbaseline patient characteristics included in the propensity score-matching analysis.
All analyses were performed using SAS version 9.3 (SAS Institute, Cary, NC, USA).
RESULTS
Sample characteristics
Of the 9,311 patients with VaD selected for inclusion in the study, 508 (6%) had AD diagnosis prior to final diagnosis of VaD (Fig. 2). For patients with prior AD diagnosis, median time to final diagnosis of VaD was approximately 2 years, compared with approximately 2 months for those with no prior AD diagnosis (Fig. 3). Prior AD diagnosis was a significant predictor of delay in VaD diagnosis, even after accounting for other patient characteristics (hazard ratio = 0.54, 95% confidence interval [CI]: 0.49–0.59; p < 0.0001). Of note, nearly 40% of the patients with no prior AD diagnosis were diagnosed with VaD at the index date.
Before matching, patients with prior AD diagnosis were significantly younger at the index date than patients with no prior AD diagnosis (79.9 years versus 81.4 years; p < 0.0001). In addition, patients with prior AD diagnosis had longer follow-up (3.9 years versus 2.8 years; p < 0.0001) and lower rates of comorbidities (CCI: 0.3 versus 0.5; p < 0.0001) and were less likely to use medical services (in allcategories) or medications (in most categories) at baseline than those with no prior AD diagnosis (Table 1). Baseline differences were largely eliminated following propensity score matching (Table 1). The matched samples consisted of 502 matched pairs, reflecting approximately 99% of the patients with prior AD diagnosis.
Healthcare resource use and costs over time
Healthcare resource use
The mean number of consultations per patient per year remained stable over time in both matched groups (Table 2). By comparison, the mean number of referrals to specialists decreased in both groups over time, particularly for those with prior AD diagnosis, who had significantly fewer referrals in years 4 and 5 post-index relative to their matched counterparts. The mean number of days hospitalized decreased for both groups at a similar rate during the first 3 years post-index; however, during years 4 and 5, those with prior AD diagnosis had a significantly higher number of days hospitalized than the matched counterparts. Numbers of hospital admissions from the emergency department were also higher in patients with prior diagnosis of AD during years 3–5, but did not differ significantly from those in patients without prior AD diagnosis.
In terms of medications, use of a number of classes of drug increased from baseline during the follow-up period, and their usage differed significantly between patients with and without prior AD diagnosis. For example, drugs for the treatment of dementia were used by ∼1% of patients in the total sample at baseline (Table 1) and by 16–26% of patients with prior AD diagnosis and 3–6% of patients with no prior AD diagnosis for each year of follow-up. Similarly, in patients with prior AD diagnosis, antipsychotic use increased from 5% at baseline to 20–26% for each year of follow-up, and in patients with no prior AD diagnosis this usage increased from 3% at baseline (matched population) to 14–21% for each year of follow-up. Respective increases in statin use were 28% to 35–44% and 31% (matched population) to 42–54%.
Patients with prior AD diagnosis had a significantly higher utilization of medications for dementia (in terms of number of patients with at least one prescription and the mean number of prescriptions) than patients with no prior AD diagnosis for each year of the study. In terms of number of patients with at least one prescription, patients with prior AD diagnosis also had a significantly higher utilization of antipsychotics during years 1 and 3, and a lower utilization of statins during years 1, 2, and 4, than patients without this diagnosis (p < 0.05 for all). Anti-parkinsonian drug use (number of patients with at least one prescription)was higher in patients with prior AD diagnosis than those with no prior AD diagnosis at year 3, and was the only other type of drug usage to differ significantly between the two patient groups during follow-up. Overall, however, the number of all-cause prescriptions was similar across the two groups over time (Table 2). Significant differences in the mean numbers of laboratory and non-imaging diagnostic tests conducted over time appeared only after year 3, with patients with no prior AD diagnosis requiring significantly (p < 0.05) higher numbers of biochemistry, microbiology, and non-imaging diagnostic tests in year 4 (data not shown) and higher numbers of microbiology tests in year 5 (data not shown).
Healthcare costs
Over the entire follow-up period, mean total healthcare costs were significantly higher in patients with prior AD diagnosis than in those with no prior AD diagnosis (GBP20,179 versus GBP17,896, p < 0.05 [Table 3]). In each year post-index, patients with prior AD diagnosis had higher total healthcare costs than those without prior AD diagnosis, although the differences were only statistically significant in year 3 (GBP4,080 versus GBP3,273, p < 0.05) (see Fig. 4). Medical costs accounted for more than 85% of total healthcare costs in both groups, primarily due to the cost of hospitalizations. Despite similar numbers of prescriptions overall, patients with prior AD diagnosis had significantly higher medication costs than their matched counterparts. Examination of the results by time to VaD diagnosis reveals important variation. In particular, patients with prior AD diagnosis incurred significantly higher healthcare costs in the period including their final diagnosis of VaD than patients with no prior AD diagnosis. Excess healthcare costs for patients with prior AD diagnosis peaked at approximately GBP3,000 per patient per year when stratified by time to final diagnosis (Fig. 5). Following final diagnosis of VaD, the costs of patients with prior AD diagnosis tended to converge with the costs of patients with no prior AD diagnosis.
Sensitivity analyses
Sensitivity analyses confirmed the generalizability of these findings and that the results were robust with regard to study index date and presence of depression. With respect to the effect of the propensity score-matching analysis, patients with prior AD diagnosis continued to have significantly higher healthcare costs, but only up until the time they received a final diagnosis.
DISCUSSION
The results of this study suggest that 6% of patients with VaD in the UK are possibly initially misdiagnosed as having AD. While lower than other existing estimates (17% [6]), this figure still represents asubstantial number of patients given the prevalence of VaD (about 1.2% of the elderly UK population) [1]. For half of the patients with a prior AD diagnosis, a final diagnosis of VaD may have been delayed for at least 2 years after initial presentation with symptoms of cognitive decline, leaving patients subject to extended periods of possibly suboptimal care. Patients with VaD and prior AD diagnosis incurred higher levels of medical resource utilization and associated costs over time.
There are two potential explanations for the finding that patients with VaD and prior AD diagnosis incurred higher levels of medical resource utilization and associated costs than those with no prior AD diagnosis. The first is that, despite removing patients with diagnosis patterns suggestive of mixed VaD and AD during the sample selection, the study sample continued to capture patients with mixed VaD and AD, and that these patients are simply more complex than patients with VaD alone, their treatment requiring higher levels of medical resource use and costs. A second possibility is that the study captured patients with VaD who were initially diagnosed with AD, and that the excess resource utilization and costs are due to clinical care associated with this initial AD diagnosis. For example, physicians with lower confidence in a certain diagnosis may increase the frequency with which they interact with their patients to collect additional data. Similarly, if patients with VaD are initially diagnosed with AD they may possibly receive therapy that is inappropriate and, hence, suboptimal for their condition; as a result, they (and their caregivers) may be more likely to return to their physicians to seek further evaluation. If their symptoms are not optimally treated, these patients may also be at increased risk of accidental injury.
The two hypotheses need not be mutually exclusive, but the analysis of costs stratified by time to VaD diagnosis is useful in determining which is more likely. As detailed above, while the overall medical resource use and costs over time are somewhat higher among patients with VaD and prior AD diagnosis, these findings mask important variation. The stratified analysis reveals a strong correlation between the timing of the change in diagnosis from AD to VaD and spikes in excess costs. These spikes are not consistent with a profile of patients who are more complex, as such patients would be expected to incur higher costs over extended periods of time. Rather, the spikes in excess costs are consistent with a more thorough evaluation of the patients around the time that their VaD diagnosis is resolved. The fact that excess costs quickly dissipate in subsequent years suggests that once a final diagnosis of VaD was made these patients no longer required medical care above and beyond that received by their matched counterparts.
These findings are largely consistent with those of the aforementioned US study [6], which used data from Medicare beneficiaries with VaD and similarly found a strong correlation between the timing of the final diagnosis of VaD and spikes in excess costs. However, unlike the US study, excess costs in our study are more concentrated in the period in which the VaD diagnosis is resolved, rather than gradually increasing leading up to the period of final diagnosis of VaD.
Furthermore, our findings illustrate that a prior AD diagnosis in a patient with VaD can impact treatment. For example, use of drugs for the treatment of dementia was significantly higher in patients with prior AD diagnosis than in those with no prior AD diagnosis. These medications (e.g., acetylcholinesterase inhibitors and memantine) have proven efficacy in patients with AD [18] and hence their use in patients initially diagnosed with AD is unsurprising; however, their effects on cognition in patients with VaD have been shown to be weaker, and of uncertain clinical significance [18–20]. In addition, current National Institute for Health and Care Excellence (NICE) guidelines recommend the use of acetylcholinesterase inhibitors and memantine in patients with AD but not VaD [21]. Hence, a prior AD diagnosis in a patient with VaD may result in possibly suboptimal care and incur significant unnecessary costs.
In the matched cohorts, about 30% of patients were prescribed statins during the baseline period, irrespective of prior AD diagnosis in our study. This proportion increased to 35–44% in patients with prior AD diagnosis and 42–54% of patients without prior AD diagnosis, and is slightly higher than the 23% of patients aged 75 years and over who were prescribed statins for primary prevention in a recent retrospective cross-sectional study conducted in a typical primary care population at 19 general practices in the UK [22]. This could suggest that statins were additionally being used to prevent and/or slow the progression of AD/VaD in our patient population. Although NICE does not currently recommend the use of statins for the primary prevention of dementia [21], it has been postulated that treatment with lipid-lowering drugs, such as statins, could lessen the risk of dementia and/or slow progression of the disease [23], particularly VaD [24]. The results of studies have been conflicting [23, 25], but many researchers consider there is growing evidence that statins may potentially reduce the incidence of dementia [26].
Also of note is our finding that, at baseline, up to 7% of patients with or without prior AD diagnosis were prescribed an antipsychotic, increasing in each year of follow-up to 20–26% in patients with prior AD diagnosis and to 14–21% in patients with no prior AD diagnosis. The vast majority of antipsychotic prescriptions in individuals with dementia are considered inappropriate [27], and antipsychotics are not currently recommended for use in patients with AD or VaD [21]. In support of the UK Government’s commitment to reduce the inappropriate prescribing of antipsychotic medication for people with dementia, recent audit data indicate a 52% reduction in the number of people with dementia receiving an antipsychotic prescription between 2008 and 2011 [28]. Nevertheless, the audit found that 7% of people with dementia were still being prescribed antipsychotic medication, a figure in line with that reported during the baseline period of this study.
Study strengths and limitations
This study used CPRD data linked with HES and ONS, thereby incorporating patients’ hospitalization and mortality information together with clinical records and medication data. Further, the study design ascertained that patients with clear patterns of potential mixed dementia (i.e., with intertwined records of multiple dementia etiologies) were not included in the analyses. In addition, comparing the costs of patients with prior AD diagnosis with those of matched controls with no prior AD diagnosis allowed us to quantify the incremental costs associated with potential misdiagnosis of AD in a patient with VaD. To our knowledge, this is the first study to do so in the UK CPRD population.
Limitations of this study include its reliance on the Read codes and ICD-10 codes used within the CPRD and HES administrative records datasets, respectively. These codes are retrieved from electronic health records and hospital admission records and do not contain information necessary to confirm clinical diagnoses, severity of illness, or physician interpretation. Hence, it is possible that patients with mixed dementia were not fully excluded from the study cohort, leading to greater variability in the results. It is also possible that patients with AD developing an abrupt decline in cognitive function following a stroke may have been categorized as having VaD. However, as the presence of both of these types of patients among the study cohort would have blurred potential differences between patients with VaD with and without prior AD diagnosis, we consider it likely that the difference in estimated costs between the two groups identified in this study would be an underestimation rather than an overestimation.
Additionally, records within CPRD contain information only about medications prescribed and not medications dispensed. As a result, the findings related to medication use and costs rely on an assumption that all medications prescribed are dispensed and used as indicated. Prescription medication use in the study was captured as recorded in the CPRD; hence, no information on the rationale for medication prescription is available. Over-the-counter medications, out-of-pocket expenses, and informal care are also not captured within the CPRD framework.
With regard to costs, the analyses are based on applying the reference unit costs provided by the NHS to the resource utilization observed in the data. The CPRD data do not capture actual reimbursements from the NHS to providers of medical services. In addition, the accumulated cost figures need to be treated with caution since sample sizes changed from one year to another, making interpretation difficult; also, the potential differential relation between attrition and outcomes across cohorts may differ over time.
Finally, the propensity score-matching approach effectively controls for observed differences within the dataset but cannot address unobserved heterogeneity in patient characteristics across cohorts. It is also possible that matching patients on length of follow-up, thereby requiring that comparator patients have at least the same length of follow-up as their matched cases, could introduce bias if prior diagnosis of AD was associated with differential mortality. Consequently, we evaluated the predictors of mortality among the sample of patients with VaD using a Cox proportional hazard model. Controlling for other observable characteristics, we found that prior AD diagnosis was not a significant predictor of time to death (hazard ratio = 0.99, 95% CI 0.87–1.12). Therefore, based on these findings, we assumed that requiring matched pairs to have similar lengths of follow-up would not bias the analysis.
CONCLUSIONS
The substantial excess costs associated with the potential misdiagnosis of AD among patients with VaD—and the decline of those costs following the final diagnosis of VaD—suggest potential value for timely and accurate diagnosis. Technologies that support earlier rule-out of AD in patients with cognitive decline, such as amyloid positron emission tomography tracers, need to be further evaluated in this context. Given that some portion of the excess medical resource use and costs (including possible suboptimal care) estimated in this study can be avoided through earlier rule-out of AD among patients with VaD, such technologies, when used according to current UK guidelines, may be associated with substantial cost offsets from the NHS perspective.
ACKNOWLEDGMENTS
The authors would like to acknowledge Julie von Ziegenweidt and Annie Burden (Research in Real Life, UK) for assistance with processing and interpretation of CPRD data, and Gillian Gummer and Caroline Spencer (Rx Communications, Mold, UK) for medical writing assistance with the preparation of this article, funded by Eli Lilly and Company.
Authors’ disclosures available online (http://j-alz.com/manuscript-disclosures/15-0685r2).
Appendices
The supplementary material is available in the electronic version of this article: http://dx.doi.org/10.3233/JAD-150685.
REFERENCES
[1] | Alzheimer’s, Society (2014) Dementia UK: Update. Second edition, http://alzheimers.org.uk/site/scripts/download_info.php?downloadID=1491, Accessed June 25, 2015. |
[2] | Armstrong RA , Lantos PL , Cairns NJ ((2005) ) Overlap between neurodegenerative disorders. Neuropathology 25: , 111–124. |
[3] | Beach TG , Monsell SE , Phillips LE , Kukull W ((2012) ) Accuracy of the clinical diagnosis of Alzheimer disease at National Institute on Aging Alzheimer Disease Centers, 2005-2010. J Neuropathol Exp Neurol 71: , 266–273. |
[4] | Phung TK , Andersen BB , Kessing LV , Mortensen PB , Waldemar G ((2009) ) Diagnostic evaluation of dementia in the secondary health care sector. Dement Geriatr Cogn Disord 27: , 534–542. |
[5] | Petrovitch H , White LR , Ross GW , Steinhorn SC , Li CY , Masaki KH , Davis DG , Nelson J , Hardman J , Curb JD , Blanchette PL , Launer LJ , Yano K , Markesbery WR ((2001) ) Accuracy of clinical criteria for AD in the Honolulu-Asia Aging Study, a population-based study. Neurology 57: , 226–234. |
[6] | Hunter CA , Kirson NY , Desai U , Cummings AK , Faries DE , Birnbaum HG ((2015) ) Medical costs of Alzheimer’s disease misdiagnosis among US Medicare beneficiaries. Alzheimers Dement 11: , 887–895. |
[7] | Galvin JE , Sadowsky CH ((2012) ) NINCDS-ADRDA: Practical guidelines for the recognition and diagnosis of dementia. J Am Board Fam Med 25: , 367–382. |
[8] | The Clinical Practice Research DataLink, http://www.cprd.com/home/, Accessed on February 5, 2015. |
[9] | Health & Social Care Information Centre (2014) Linked mortality data from Hospital Episode Statistics and the Office for National Statistics, http://www.hscic.gov.uk/hesonsmortality, Accessed on February 5, 2015. |
[10] | Personal Social Services Research Unit (2012) (PSSRU), Unit costs of health and social care 2012, http://www.pssru.ac.uk/project-pages/unit-costs/2012/, Accessed on June 25, 2015. |
[11] | UK Department of Health. National schedule of reference costs 2012-13 for NHS trusts and NHS foundation trusts. Available at: https://www.gov.uk/government/publications/nhs-reference-costs-2012-to-2013, Last updated January 22, 2015, Accessed on June 25, 2015. |
[12] | First Databank, www.fdbhealth.co.uk, Accessed February 5, 2015 |
[13] | Office for National Statistics, Consumer price inflation reference tables, January 2014, http://www.ons.gov.uk/ons/tomy/index.html?nscl=Consumer+Prices+Index#tab-data-tables, Accessed on June 25, 2015. |
[14] | Khan NF , Perera R , Harper S , Rose PW ((2010) ) Adaptation and validation of the Charlson Index for Read/OXMIS coded databases. BMC Fam Pract 11: , 1. |
[15] | Quan H , Sundararajan V , Halfon P , Fong A , Burnand B , Luthi JC , Saunders LD , Beck CA , Feasby TE , Ghali WA ((2005) ) Coding algorithms for defining comorbidities in ICD-9-CM and ICD-10 administrative data. Med Care 43: , 1130–1139. |
[16] | Austin PC ((2011) ) An introduction to propensity score methods for reducing the effects of confounding in observational studies. Multivariate Behav Res 46: , 399–424. |
[17] | D’Agostino RB Jr ((1998) ) Tutorial in biostatistics: Propensity score methods for bias reduction in the comparison of a treatment to a non-randomized control group. Statist Med 17: , 2265–2281. |
[18] | Perera G , Khondoker M , Broadbent M , Breen G , Stewart R ((2014) ) Factors associated with response to acetylcholinesterase inhibition in dementia: A cohort study from a secondary mental health care case register in London. PLoS One 9: , e109484. |
[19] | Kavirajan H , Schneider LS ((2007) ) Efficacy and adverse effects of cholinesterase inhibitors and memantine in vascular dementia: A meta-analysis of randomised controlled trials. Lancet Neurol 6: , 782–792. |
[20] | European Medicines Agency. http://www.ema.europa.eu/ema/. Accessed on December 1, 2015. |
[21] | National Institute for Care and Excellence (2006) NICE Clinical Guideline 42, Dementia. Supporting people with dementia and their carers in health and social care, http://www.nice.org.uk/guidance/cg42/resources/guidance-dementia-pdf. Accessed on December 1, 2015 |
[22] | Sheppard JP , Singh S , Fletcher K , McManus RJ , Mant J ((2012) ) Impact of age and sex on primary preventive treatment for cardiovascular disease in the West Midlands, UK: Cross sectional study. BMJ 345: , e4535. |
[23] | McGuinness B , Craig D , Bullock R , Malouf R , Passmore P ((2014) ) Statins for the treatment of dementia. Cochrane Database Syst Rev 7: , CD007514. |
[24] | Giannopoulos S , Katsanos AH , Kosmidou M , Tsivgoulis G ((2014) ) Statins and vascular dementia: A review. J Alzheimers Dis 42: (Suppl 3), S315–S320. |
[25] | Swiger KJ , Manalac RJ , Blumenthal RS , Blaha MJ , Martin SS ((2013) ) Statins and cognition: A systematic review and meta-analysis of short- and long-term cognitive effects. Mayo Clin Proc 88: , 1213–1221. |
[26] | Shah NP , Swiger KJ , Martin SS ((2015) ) Impact on cognitive function-are all statins the same?. Curr Atheroscler Rep 17: , 466. |
[27] | Bannerjee S (2009) The use of antipsychotic medication for people with dementia: Time for action. A report for the Minister of State for Care Services, http://psychrights.org/research/digest/nlps/BanerjeeReportOnGeriatricNeurolepticUse.pdf, Accessed on December 10, 2014. |
[28] | Health and Social Care Information Centre (2012) National Dementia & Antipsychotic Prescribing Audit 2012, http://www.hscic.gov.uk/catalogue/PUB06624/nati-deme-anti-pres-audi-summ-rep.pdf, Accessed on December 10, 2014. |
Figures and Tables
Fig.1
Derivation of study cohorts. *To reduce the likelihood of mixed dementias, patients with multiple vascular dementia (VaD) diagnoses were removed if they had an indication of other types of dementia (e.g., dementia with Lewy bodies) between their first and last VaD diagnoses. AD, Alzheimer’s disease; CPRD, Clinical Practice Research Datalink; HES, Hospital Episode Statistics; ICD-10, International Classification of Diseases.
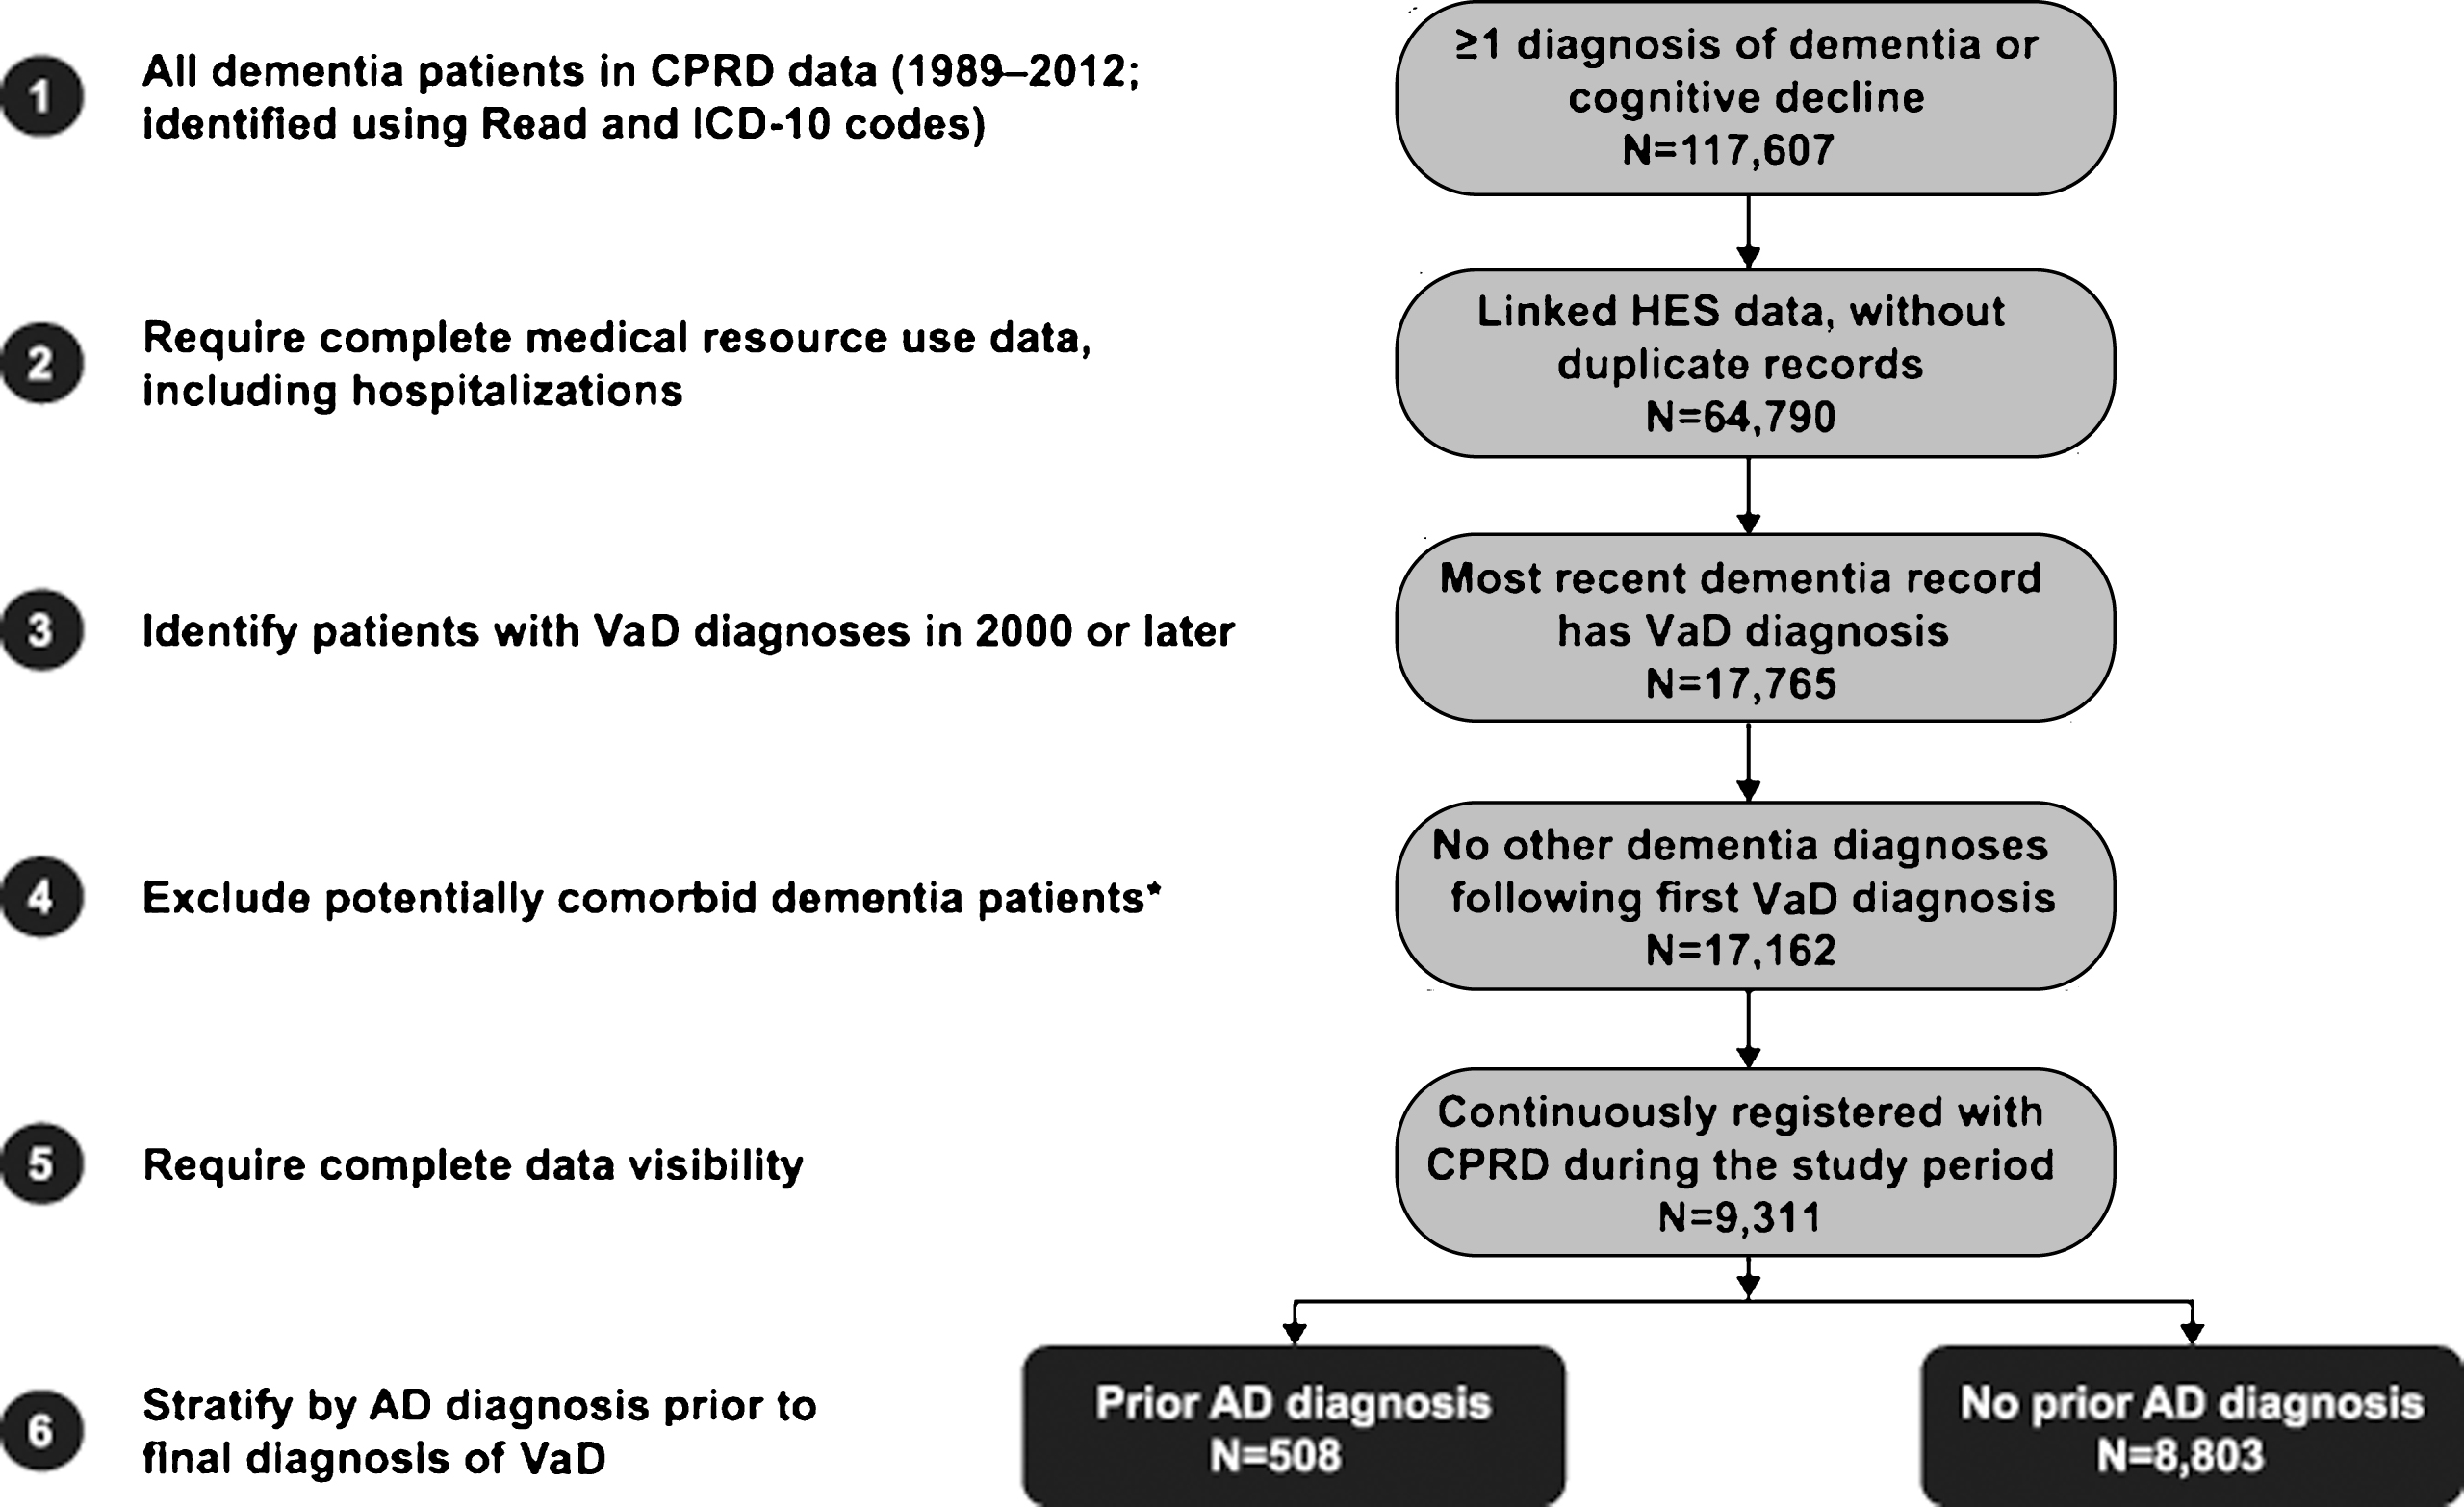
Fig.2
Study design. AD, Alzheimer’s disease; VaD, vascular dementia.
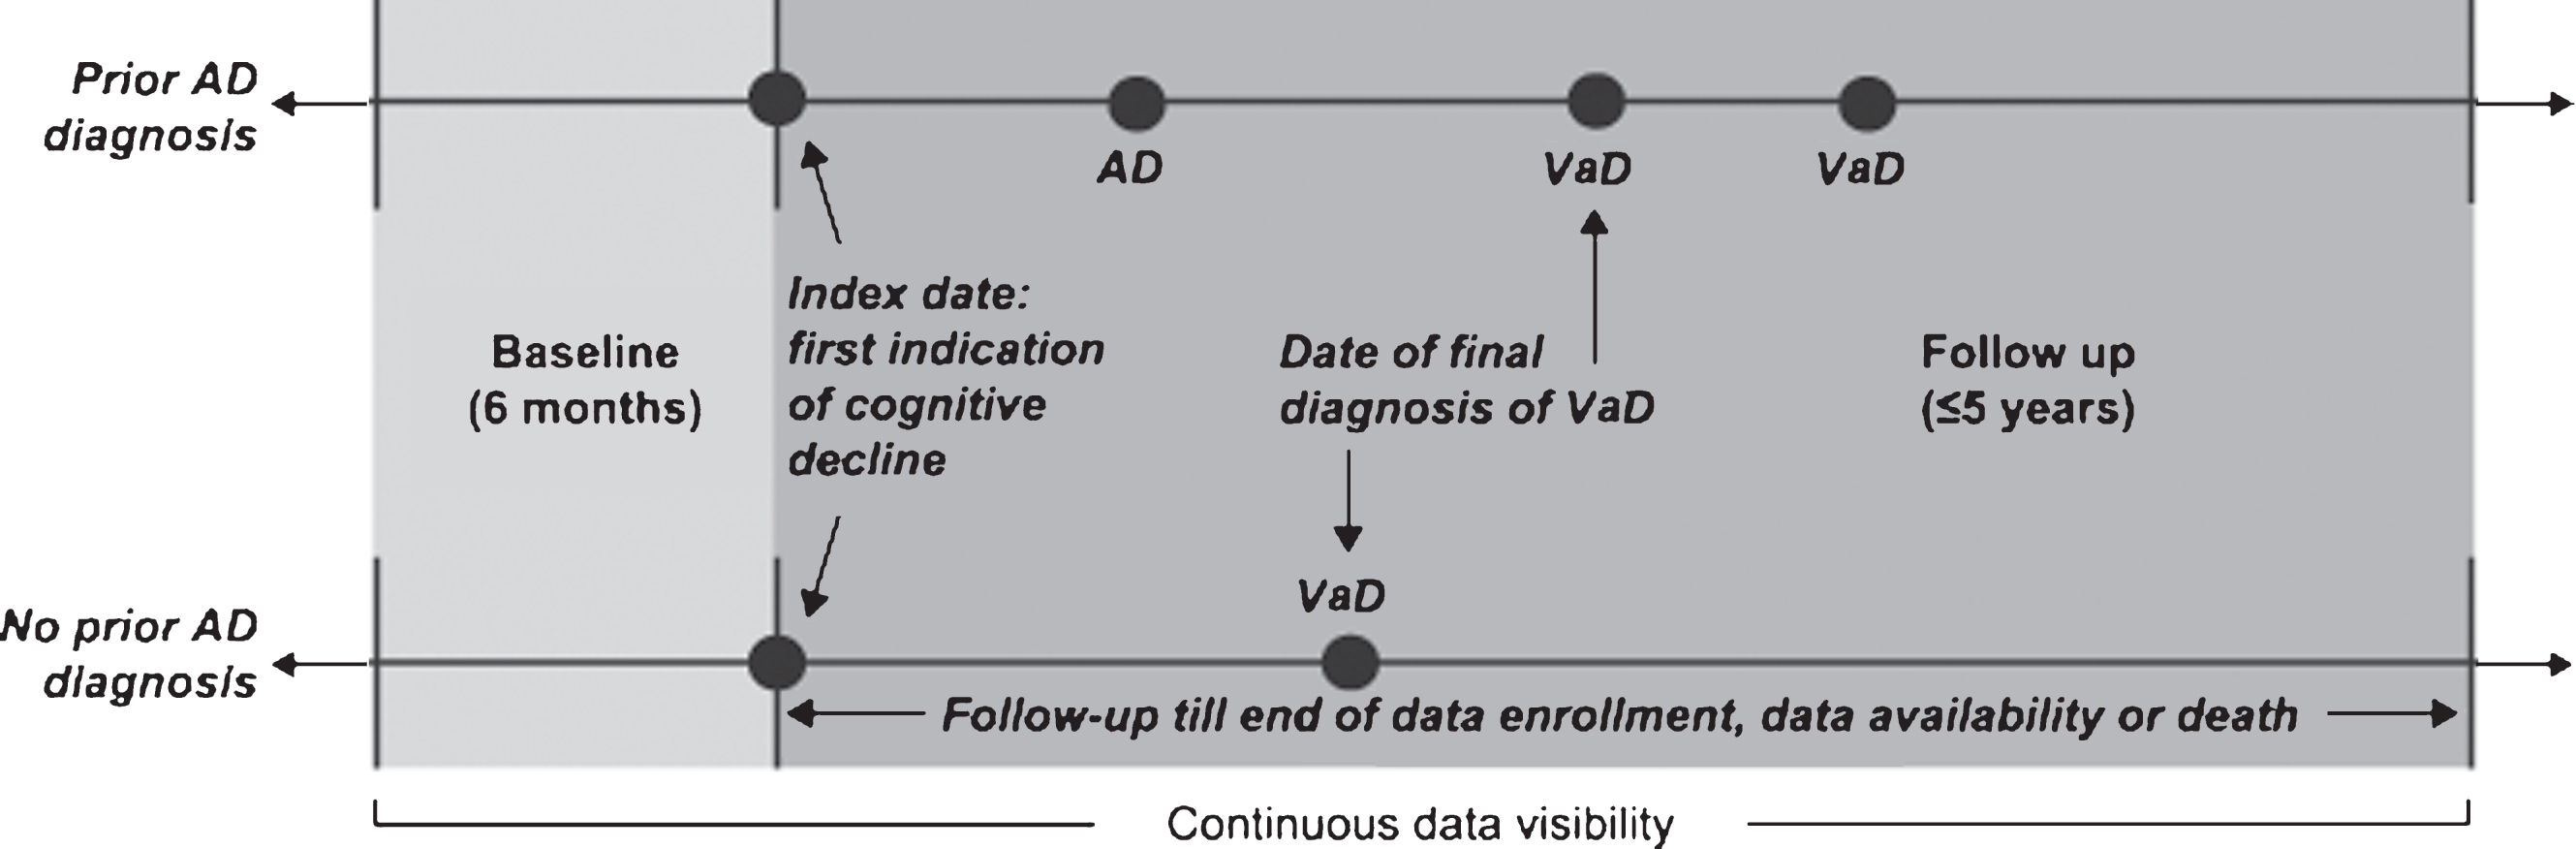
Fig.3
Time to vascular dementia (VaD) diagnosis in patients with and without prior Alzheimer’s disease (AD) diagnosis prior to propensity score matching. IQR, interquartile range.
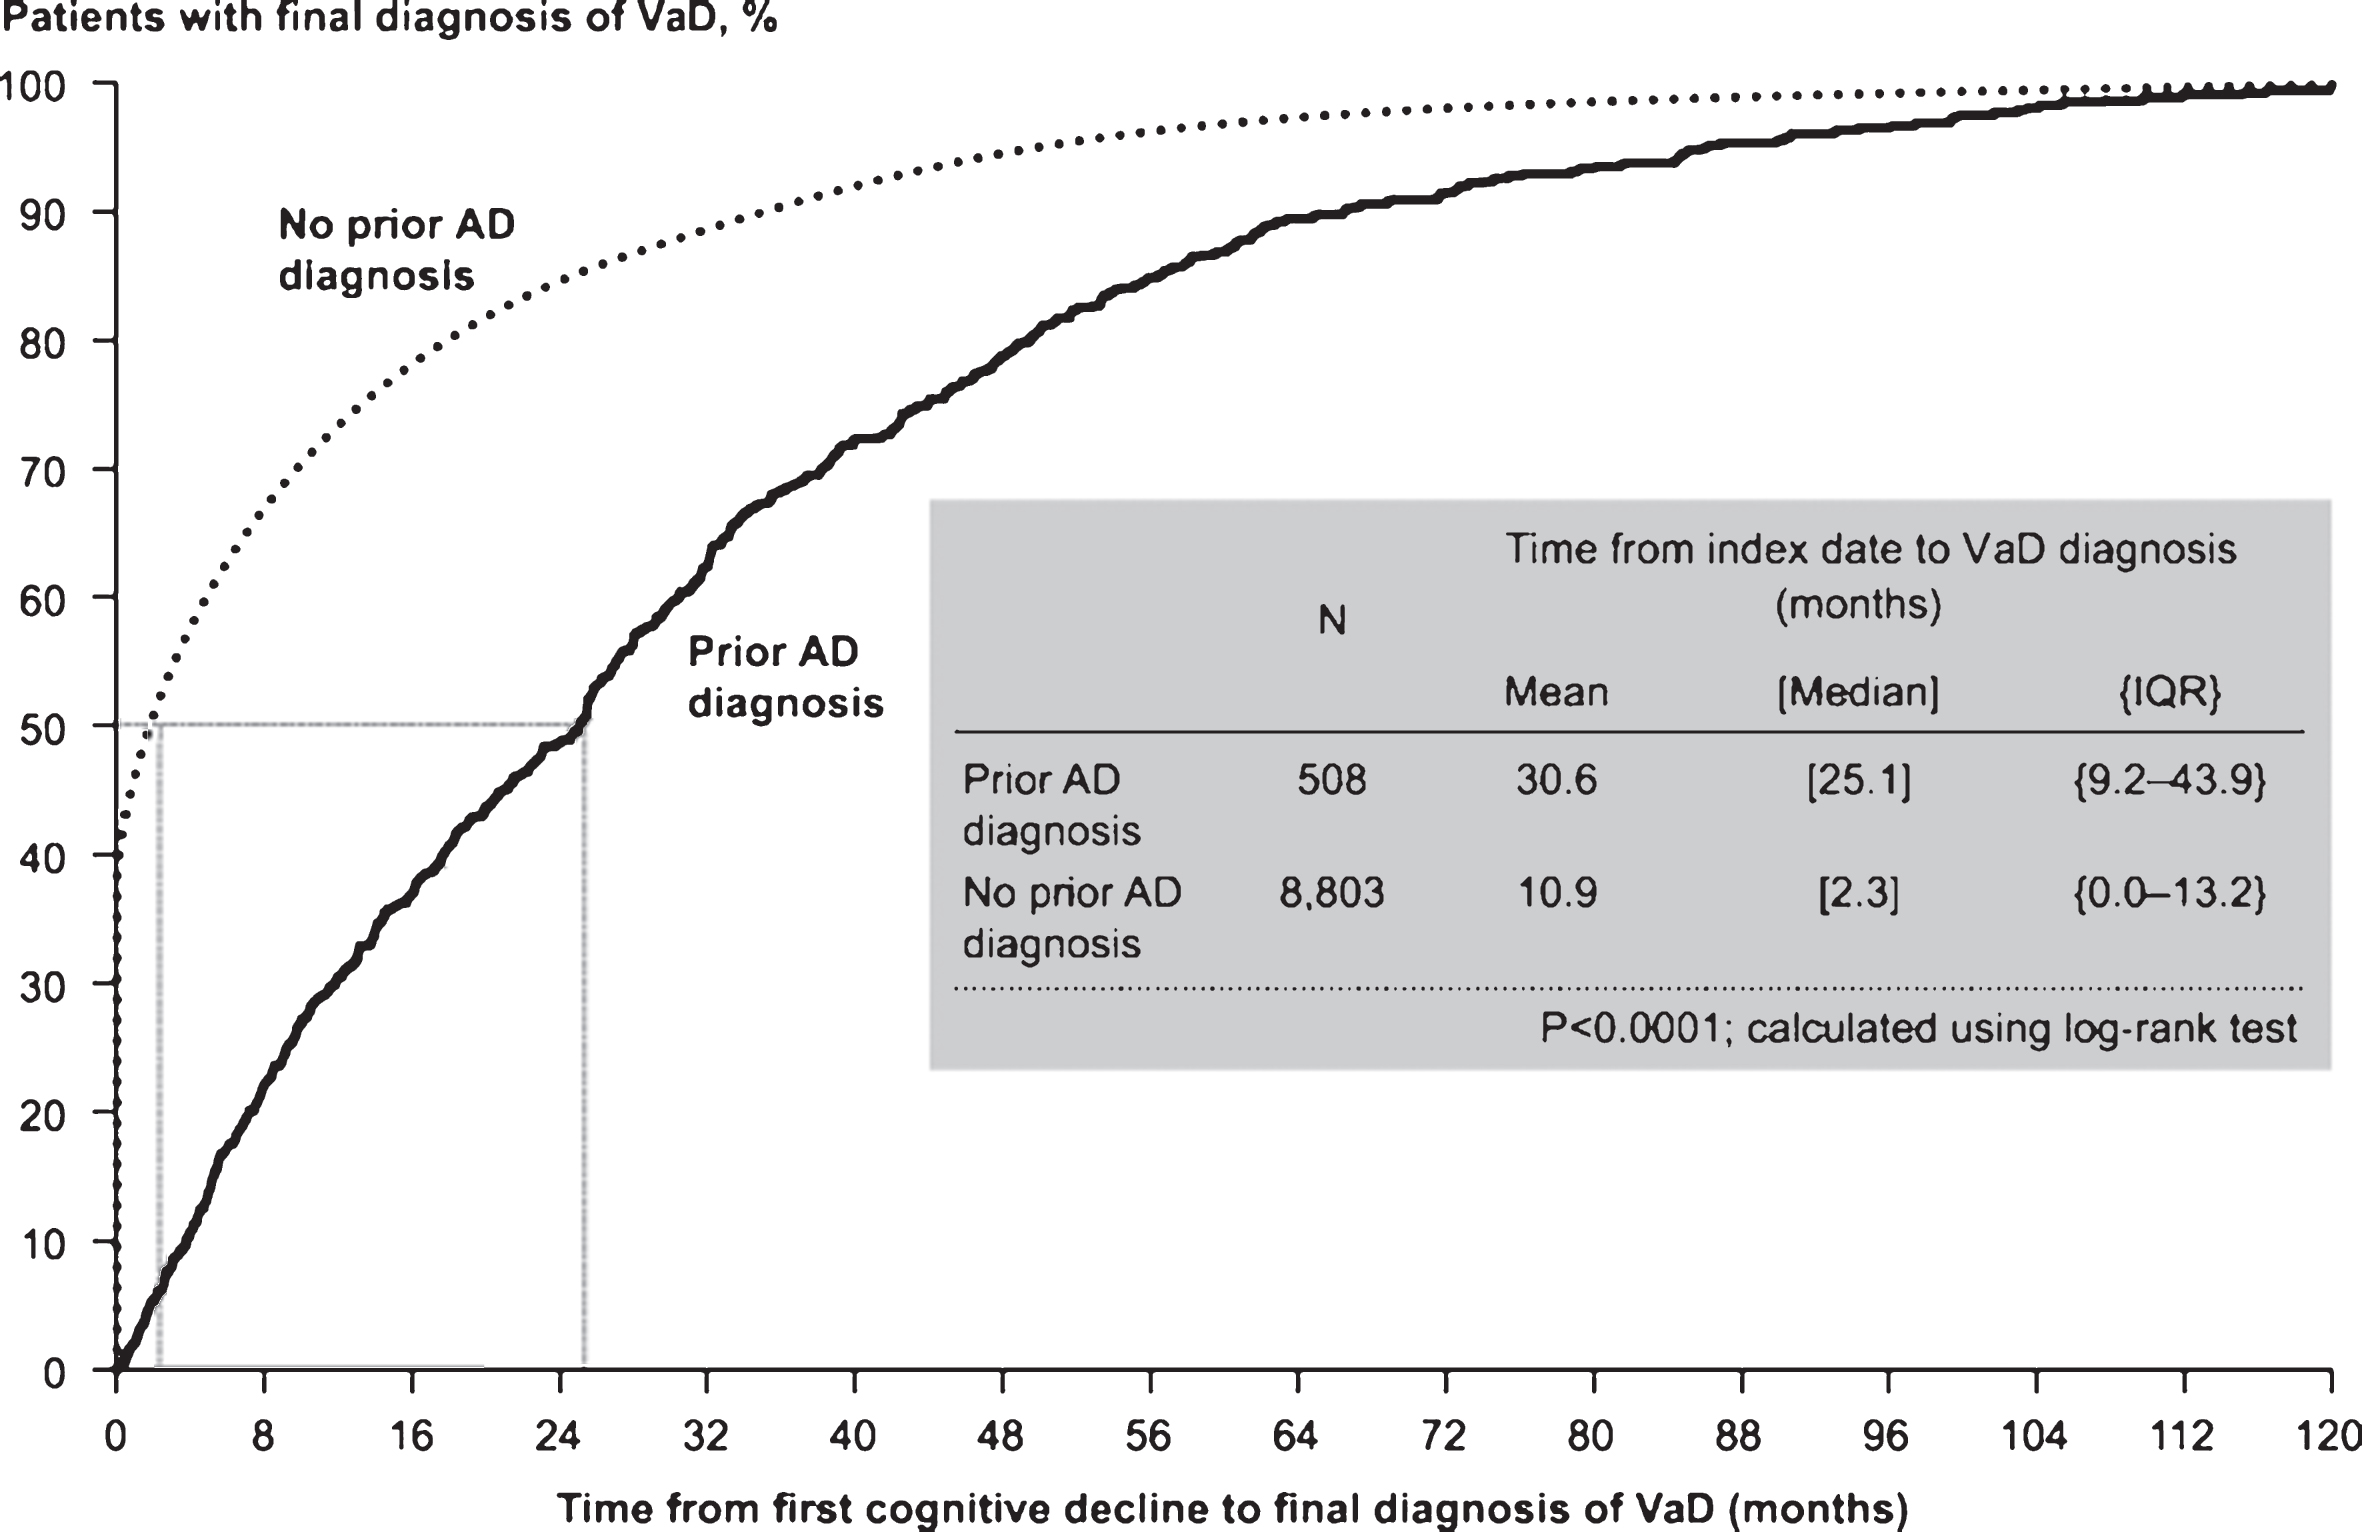
Fig.4
Mean total healthcare costs over time. All costs were estimated in 2013 British pounds (GBP). AD, Alzheimer’s disease. *p < 0.05.
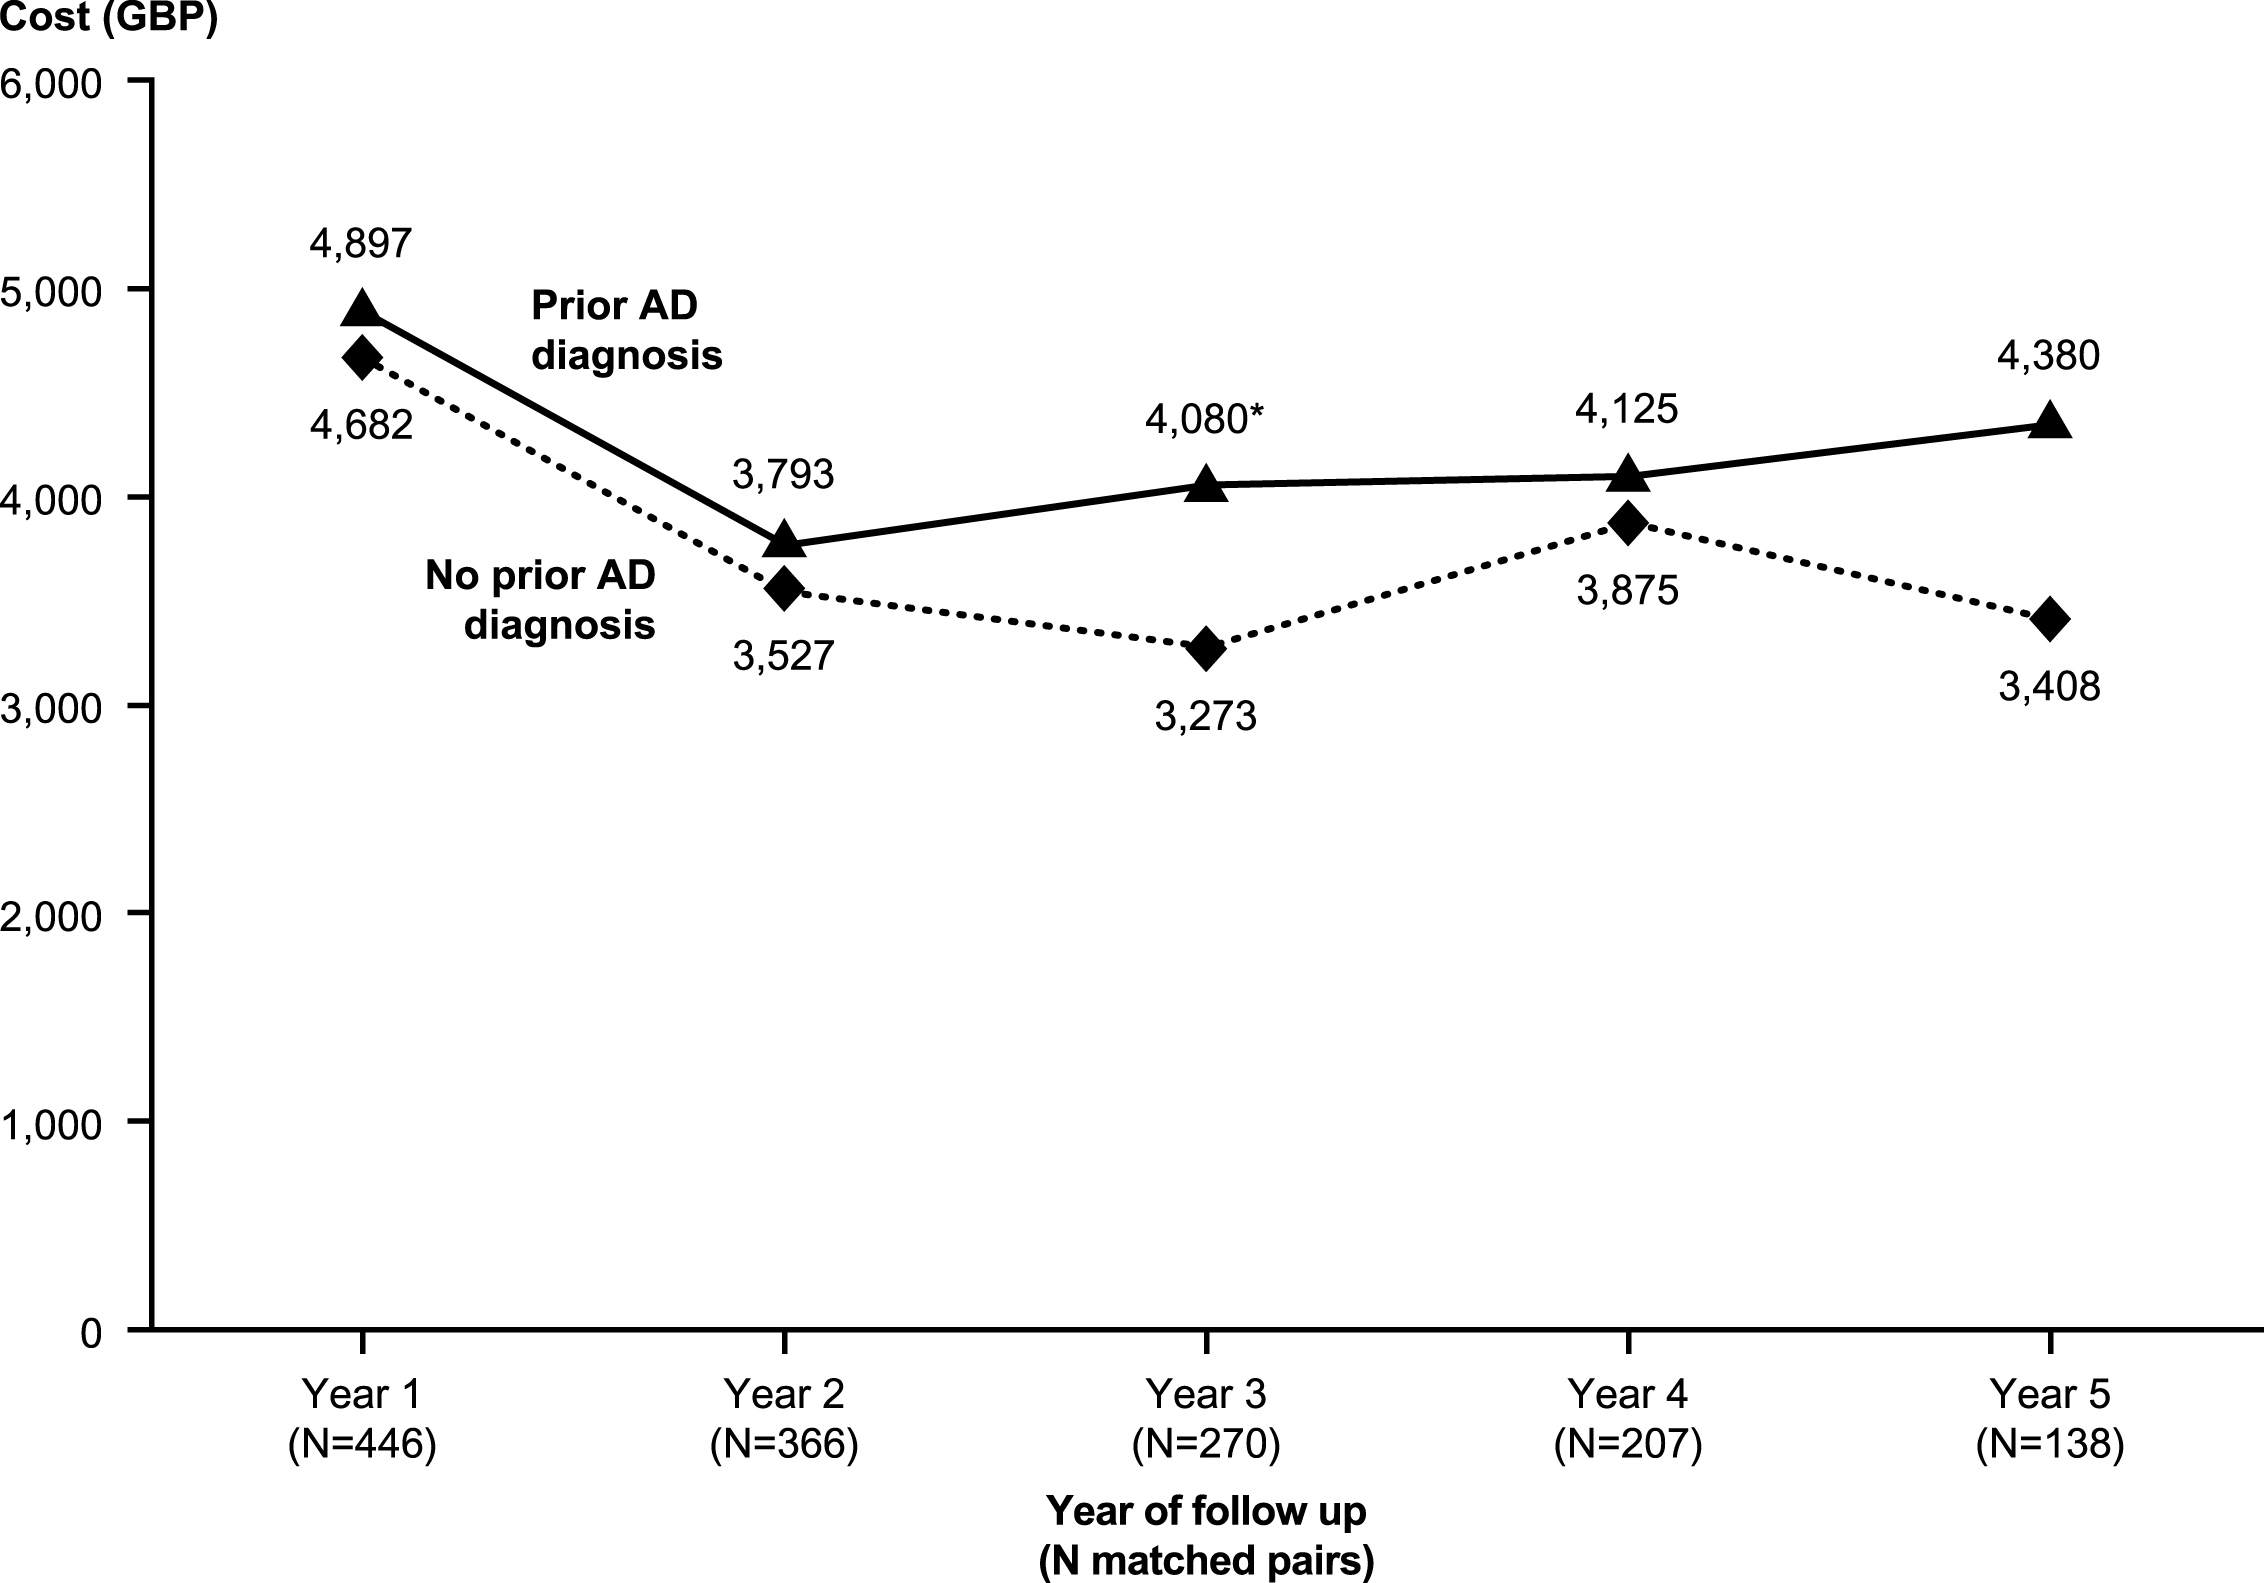
Fig.5
Excess annual costs during the follow-up period among matched patients with and without prior diagnosis of Alzheimer’s disease: Stratified by time to vascular disease diagnosis. All costs were estimated in 2013 British pounds (GBP). * p < 0.05.
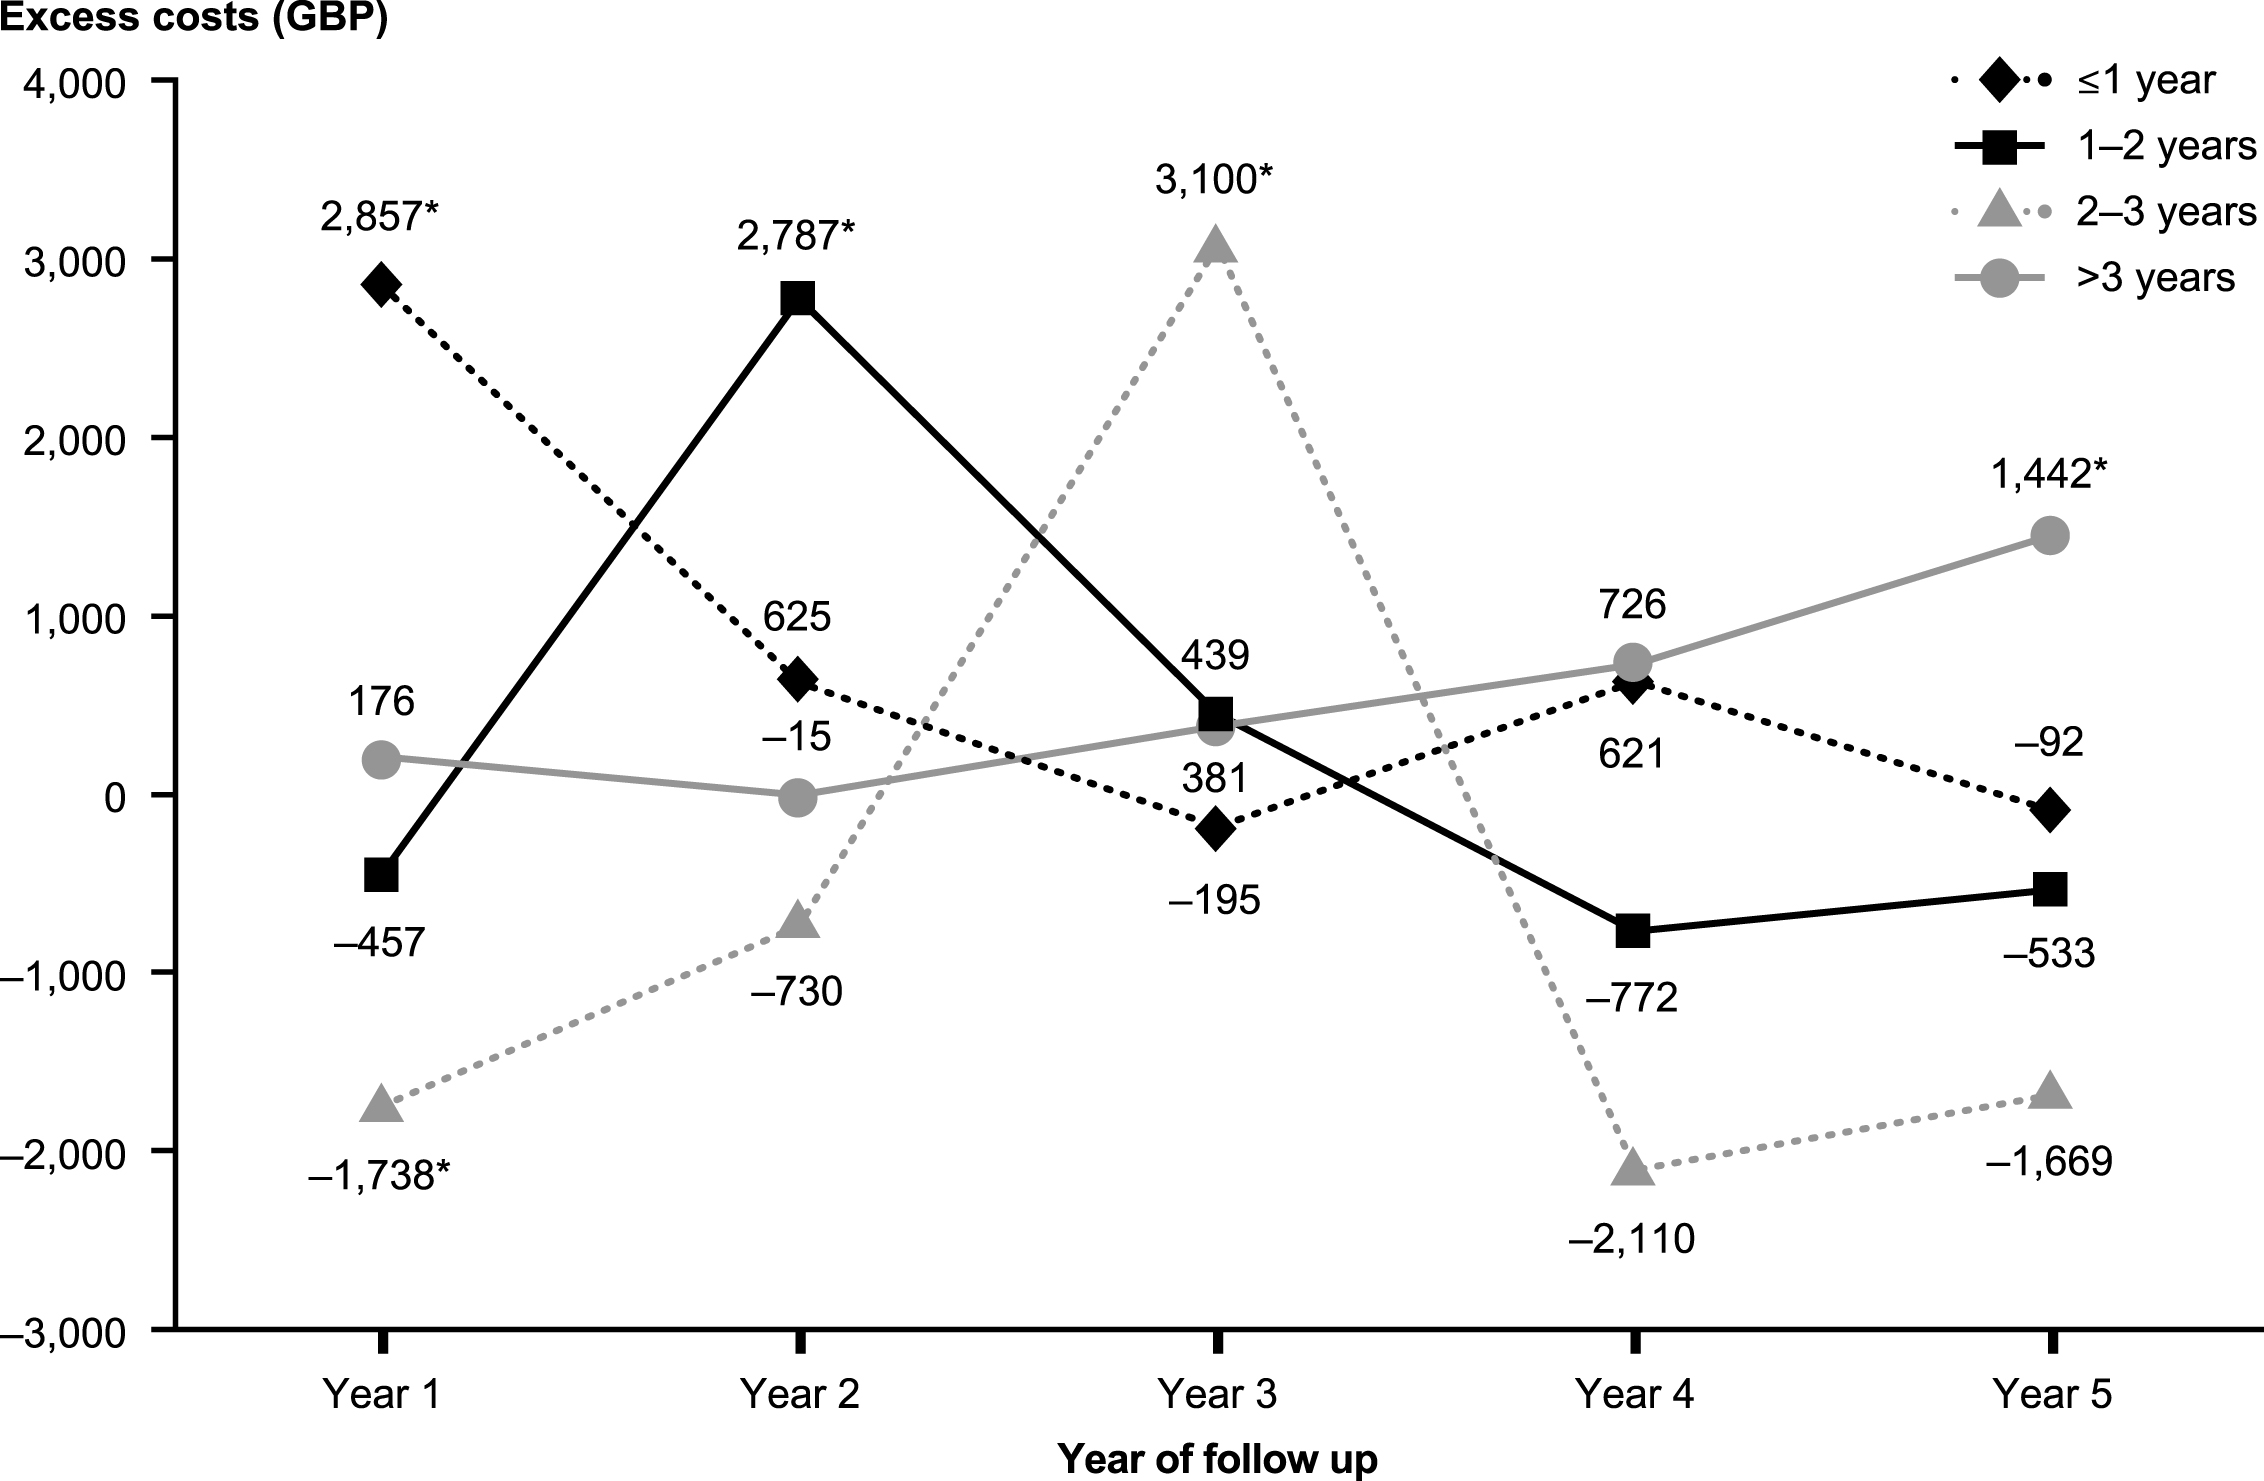
Table 1
Patient characteristics at baseline (during 6 months before the index event) before and after matching
| Selected characteristics | Pre-match | Post-match | ||||
| Prior AD diagnosis (n = 508) | No prior AD diagnosis (n = 8,803) | p-value1 | Prior AD diagnosis (n = 502) | No prior AD diagnosis (n = 502) | p-value1 | |
| Age, years, mean (SD) | 79.9 (7.4) | 81.4 (7.3) | <0.0001 | 79.9 (7.4) | 79.4 (7.7) | 0.2623 |
| Male, % | 39 | 40 | 0.5070 | 39 | 39 | 0.8985 |
| Charlson Comorbidity Index, mean (SD)2 | 0.3 (0.7) | 0.5 (1.0) | <0.0001 | 0.2 (0.6) | 0.3 (0.7) | 0.1108 |
| Years of follow-up, mean (SD) | 3.9 (2.8) | 2.8 (2.4) | <0.0001 | 3.9 (2.7) | 3.8 (2.6) | 0.3511 |
| Medical resource use, % with≥1: | ||||||
| Hospitalization | 19 | 29 | <0.0001 | 19 | 20 | 0.9270 |
| Emergency department visit | 10 | 17 | 0.0003 | 10 | 11 | 0.9093 |
| Clinician visit | 94 | 97 | 0.0010 | 94 | 94 | 1.0000 |
| Referral to specialist | 33 | 41 | 0.0003 | 33 | 36 | 0.3496 |
| Visit for diagnostic imaging | 4 | 7 | 0.0039 | 4 | 4 | 0.7150 |
| Medication use, % with≥1 script for: | ||||||
| Any medication | 93 | 96 | 0.0004 | 92 | 92 | 0.6276 |
| Antihypertensive agents | 59 | 70 | <0.0001 | 58 | 57 | 0.5596 |
| Analgesics | 37 | 43 | 0.0034 | 37 | 38 | 0.8394 |
| Statins | 28 | 38 | <0.0001 | 28 | 31 | 0.1821 |
| Dementia agents | 1 | <1 | 0.0015 | <1 | 0 | – |
| Antidepressants | 21 | 26 | 0.0092 | 21 | 21 | 0.7503 |
| Antipsychotic agents | 5 | 7 | 0.0156 | 5 | 3 | 0.2498 |
| NSAIDs | 18 | 16 | 0.3446 | 17 | 17 | 0.9334 |
| Antidiabetes agents | 11 | 13 | 0.1262 | 11 | 12 | 0.7029 |
| Antiparkinsonian agents | 1 | 2 | 0.2003 | 1 | 1 | 0.7055 |
| Other | 85 | 92 | <0.0001 | 85 | 88 | 0.1470 |
1Statistical significance was evaluated using Wilcoxon rank sum tests for continuous variables and Chi-squared tests for categorical variables. p < 0.05 was considered statistically significant; values that differ significantly are indicated by bold type. 2Calculated using previously validated Read and ICD-10 codes [15] and Read codes [14]. See Supplementary Table 2 for a complete list of ICD-10 diagnosis codes. AD, Alzheimer’s disease; ICD-10, International Classification of Diseases, 10th revision; NSAIDs, nonsteroidal anti-inflammatory drugs; SD, standard deviation.
Table 2
Healthcare resource use by year of follow-up1,2
| Year of follow-up | Prior AD diagnosis | No prior AD diagnosis | p-value3 |
| No. of consultations | |||
| Year 1 | 37.2 (22.4) | 36.1 (20.9) | 0.5328 |
| Year 2 | 35.2 (21.8) | 33.7 (20.7) | 0.6157 |
| Year 3 | 35.0 (22.7) | 34.0 (19.8) | 0.8501 |
| Year 4 | 32.6 (19.4) | 38.5 (23.3) | 0.0031 |
| Year 5 | 34.5 (24.2) | 34.6 (19.6) | 0.4923 |
| No. of referrals | |||
| Year 1 | 1.5 (1.9) | 1.4 (1.5) | 0.1435 |
| Year 2 | 0.9 (1.4) | 0.8 (1.2) | 0.5981 |
| Year 3 | 0.8 (1.4) | 0.8 (1.2) | 0.8903 |
| Year 4 | 0.6 (1.1) | 1.1 (1.4) | 0.0002 |
| Year 5 | 0.6 (1.3) | 0.9 (1.3) | 0.0235 |
| No. of days hospitalized | |||
| Year 1 | 21.4 (63.5) | 22.4 (61.7) | 0.8090 |
| Year 2 | 12.9 (57.8) | 18.3 (74.8) | 0.1451 |
| Year 3 | 12.4 (41.1) | 8.8 (26.7) | 0.2159 |
| Year 4 | 19.1 (65.9) | 7.5 (24.3) | 0.0031 |
| Year 5 | 18.9 (61.7) | 8.9 (24.3) | 0.0491 |
| No. of admissions from the emergency department | |||
| Year 1 | 0.4 (0.8) | 0.5 (0.9) | 0.3771 |
| Year 2 | 0.3 (0.7) | 0.3 (0.7) | 0.5687 |
| Year 3 | 0.4 (0.7) | 0.3 (0.6) | 0.1064 |
| Year 4 | 0.4 (0.8) | 0.3 (0.8) | 0.4042 |
| Year 5 | 0.4 (0.7) | 0.3 (0.6) | 0.2871 |
| No. of prescriptions | |||
| Year 1 | 65.4 (79.3) | 65.1 (68.5) | 0.4036 |
| Year 2 | 77.1 (93.5) | 73.2 (72.1) | 0.4630 |
| Year 3 | 80.2 (93.3) | 76.4 (73.4) | 0.6280 |
| Year 4 | 84.6 (93.7) | 82.3 (76.7) | 0.2950 |
| Year 5 | 88.4 (89.9) | 71.1 (49.8) | 0.4611 |
Data are reported as means ± standard deviations. 1The follow-up period was defined as the period following, and including, a patient’s index date, until the end of continuous eligibility or death. The index date was defined as the date corresponding to the earliest diagnosis for cognitive decline. 2Patients with prior AD were matched one-to-one to patients without prior AD using a propensity score model and the minimum length of follow-up. Propensity scores were estimated using logistic regression models that accounted for patient demographics, year of index diagnosis, select medical resource use, and medication use in the 6-month baseline period. 3Statistical significance was evaluated using McNemar’s test for categorical variables. Paired t-tests were used to evaluate statistical significance for the numbers of consultations and prescriptions following log transformations, and generalized linear models with a negative binomial distribution and a log link were used for other outcome measures. p < 0.05 was considered statistically significant; values that differ significantly are indicated by bold type. Numbers of matched pairs in each year of follow-up were as follows: year 1, n = 446; year 2, n = 366; year 3, n = 270; year 4, n = 207; year 5, n = 138. Means were calculated for the entire sample for a given year (including those with no resource use). AD, Alzheimer’s disease.
Table 3
Healthcare costs (in 2013 British pounds [GBP])1,2,3 over entire length of follow-up4
| Prior AD diagnosis (n = 502) | No prior AD diagnosis (n = 502) | p-value5 | |
| Total healthcare costs | 20,179 (15,757) | 17,896 (17,417) | 0.0212 |
| Medical costs | 17,414 (13,966) | 15,732 (16,170) | 0.0692 |
| Medications | 2,765 (4,160) | 2,164 (3,769) | 0.0070 |
| Consultations | 4,562 (3,811) | 4,545 (4,265) | 0.9038 |
| Clinical consultations | 373 (528) | 414 (706) | 0.2316 |
| Surgery consultation | 3,635 (3,059) | 3,491 (3,142) | 0.2923 |
| Telephone consultations | 123 (209) | 138 (354) | 0.3640 |
| Home visits | 432 (972) | 501 (1,413) | 0.3542 |
| Referrals | 440 (541) | 451 (635) | 0.7533 |
| Hospitalizations | 11,997 (11,981) | 10,310 (14,736) | 0.0502 |
| Admissions from ED | 6,440 (6,841) | 5,725 (6,679) | 0.0841 |
| Tests | |||
| Diagnostic imaging | 66 (105) | 71 (122) | 0.5064 |
| Laboratory tests | 273 (264) | 284 (313) | 0.4938 |
| Non-imaging diagnostic tests | 76 (150) | 72 (194) | 0.7004 |
| Medications | 2,765 (4,160) | 2,164 (3,769) | 0.0070 |
| Analgesics | 109 (403) | 106 (399) | 0.8479 |
| Dementia agents | 578 (1,364) | 130 (728) | <0.0001 |
| Antidepressants | 71 (205) | 82 (271) | 0.4148 |
| Antidiabetic agents | 119 (833) | 97 (617) | 0.5911 |
| Antihypertensive agents | 228 (395) | 206 (335) | 0.2549 |
| Antiparkinsonian agents | 10 (80) | 7 (57) | 0.4664 |
| Antipsychotics | 221 (882) | 147 (595) | 0.0834 |
| NSAIDs | 21 (85) | 24 (111) | 0.6179 |
| Statins | 123 (396) | 99 (287) | 0.2288 |
| Other medications | 1,286 (3,192) | 1,267 (2,917) | 0.8861 |
AD, Alzheimer’s disease; ED, emergency department; NSAIDs, nonsteroidal anti-inflammatory drugs. Data are reported as means ± standard deviations. 1The follow-up period was defined as the period following, and including, a patient’s index date, until the end of continuous eligibility or death. The index date was defined as the date corresponding to the earliest diagnosis for cognitive decline. 2Patients with prior AD were matched one-to-one to patients without prior AD using a propensity score model and the minimum length of follow-up. Propensity scores were estimated using logistic regression models that accounted for patient demographics, year of index diagnosis, select medical resource use, and medication use in the 6-month baseline period. 3Costs are rounded to the nearest whole pound (2013 GBP). 4Costs are observed over the entire length of follow-up, which may vary from patient to patient. 5Statistical significance was evaluated using bias-adjusted bootstrapping. p < 0.05 was considered statistically significant; values that differ significantly are indicated by bold type.

