Halting of Caspase Activity Protects Tau from MC1-Conformational Change and Aggregation
Abstract
Intracellular neurofibrillary tangles (NFTs) are the hallmark of Alzheimer’s disease and other tauopathies in which tau, a microtubule-associated protein, loses its ability to stabilize microtubules. Several post-translational modifications including phosphorylation and truncation increase tau’s propensity to aggregate thus forming NFTs; however, the mechanisms underlying tau conformational change and aggregation still remain to be defined. Caspase activation and subsequent proteolytic cleavage of tau is thought to be a potential trigger of this disease-related pathological conformation. The aim of this work was to investigate the link between caspase activation and a disease-related conformational change of tau in a neuroblastoma cell-based model of spontaneous tau aggregation. We demonstrated that caspase induction initiates proteolytic cleavage of tau and generation of conformationally altered and aggregated tau recognized by the MC1 conformational antibody. Most importantly, these events were shown to be attenuated with caspase inhibitors. This implies that therapeutics aimed at inhibiting caspase-mediated tau cleavage may prove beneficial in slowing cleavage and aggregation, thus potentially halting tau pathology and disease progression.
INTRODUCTION
Alzheimer’s disease (AD) is a progressive neurodegenerative disorder with two key pathological hallmarks: extracellular amyloid plaques and intracellular neurofibrillary tangles (NFTs) of tau [1]. NFTs are commonly known to be the intracellular accumulation of paired helical filaments (PHFs) and straight filaments formed from hyperphosphorylated and insoluble tau molecules [2, 3]. Tau protein belongs to the family of highly soluble and natively unfolded proteins referred to as microtubule-associated proteins and plays a key role as an axonal microtubule stabilizer. There are six major isoforms of tau resulting from alternative splicing of exons 2, 3, and 10 on the MAPT gene located on chromosome 17. Splicing at exons 2 and 3 determines the inclusion or exclusion of none, one, or two N-terminal acidic inserts depicted as 0N, 1N, or 2N, and splicing at exon 10 selects for three or four repeats (3R or 4R) of the highly conserved C-terminal microtubule binding motif [4–6].
In AD, interaction of tau with microtubules is compromised as a result of mislocalization and progressive aggregation, which eventually contributes to abnormalities in axonal transport [7–10]. One of the early aberrant changes in tau’s conformation can be detected by an MC1 antibody which recognizes a discontinuous epitope on tau at aa 7–9 and aa 312–342. In this MC1-reactive conformation, the N-terminus of tau interacts with its C-terminal third microtubule-binding repeat, assuming a partially folded pathological structure [11]. This aberrant conformation of tau was found to be soluble and becomes insoluble after assembling into PHFs, suggesting that the change in tau conformation from a relatively disordered soluble protein to the early conformationally altered MC1-tau and the highly ordered PHF structure is crucial in the aggregation cascade [12, 13]. Importantly, the level of MC1 reactivity was shown to correlate with the severity and progression of AD with no reactivity against control brain extracts [14].
Although many post-translational modifications of tau, e.g., phosphorylation, glycosylation, nitrosylation, ubiquitination, and truncation, have been described in the literature [15–23], the sequence of events that leads to tau conformational change and aggregation in AD remains poorly defined. Since tau conformational change is one of the earliest detectable events in the brain of AD patients, from a therapeutic perspective inhibiting this structural modification is a particularly attractive approach. There is growing evidence that proteolytic processing of tau may play a crucial role in the aberrant change of tau conformation and its aggregation. Several studies have shown that tau can be processed by various proteases including caspases, calpains, cathepsins, and thrombin, and that the tau fragments generated by these proteolytic modifications can themselves aggregate and induce aggregation of full-length tau [24]. Caspases are a family of cysteine proteases that play apoptotic and non-apoptotic roles in neuronal physiology and pathophysiology, and they can be classified into two main groups: initiator caspases and executioner caspases. Initiator caspases have evolved to coordinate upstream signaling pathways with downstream execution steps, while executioner caspases are those that perform downstream execution steps of apoptosis by cleaving multiple cellular substrates, and are processed and activated by upstream caspases [25]. Caspase activation has been found to be one of the pathological features of AD, and it has been proposed that activation of caspases in neurons leads to rapid tau aggregation into NFTs [26]. Much of the data surrounding proteolytic processing implies that tau cleavage might increase the rate of aggregation. Indeed, caspase cleavage at the well-characterized Asp421site on tau, results in a fragment that was shown in vitro to aggregate more rapidly than full-length tau. Furthermore, tau cleaved at D421 by executioner caspases was shown to facilitate filament formation and can readily adopt a conformational change that is recognized by the MC1 antibody [27]. Caspase-3 and caspase-6 executioner caspases have been implicated in the process of both tau conformational change and tau aggregation in AD, and particularly caspase-6 has been associated with the early pathological events leading to disease development [28–32]. These studies highlight caspase 3 and 6 as possible key contributors in caspase-mediated tau cleavage in AD, and both have been shown to cleave tau at Asp421 in vitro [31, 33]. Even though there is certainly a link between caspase-cleaved tau and tau pathology observed in AD, there are still questions remaining as to whether caspase cleavage of tau is indeed one of the key triggers in its early conformational change and aggregation or simply a marker of tau’s aberrant conformation, and most importantly, whether halting of caspase activity could protect tau from its conformational change and aggregation.
In this study, we set up a cell-based model with the murine neuroblastoma cell line (N2a) transiently transfected with the longest 2N4R human tau isoform that allowed us to follow spontaneous and induced conformational change and aggregation of tau. We have also established a range of sensitive AlphaScreen, ELISA, and flow cytometry assays to follow caspase induction, proteolytic processing of tau and its conformational change and aggregation. We show that: (i) caspase-cleavage of tau and its aberrant conformational change are well correlated, and (ii) tau fragmentation and aggregation can be efficiently halted by caspase inhibitors. Our results demonstrate that caspase activation is intimately associated with tau proteolytic cleavage and its disease-relevant structural change.
MATERIALS AND METHODS
Materials
The 2N4R Tau isoform was cloned into pRc/CMV2. The tau-specific CP27 (aa 130–150), DA9 (aa 102–130), TG5 (aa 220–235), and MC1 (aa 7–9 and aa 312–342) antibodies were generated and characterized as described [11, 14, 34, 35]. Staurosporine, pan-caspase inhibitors: Z-VAD(Ome)-FMK and ApoBlock were purchased from Calbiochem, Axxora, and BD Biosciences, respectively. Anti-Tau 421 antibody (tau-C3) was from Abcam, and anti-active caspase-3 and anti-active caspase-6 were purchased from Abcam and Sigma, respectively.
Cell culture
The murine neuroblastoma Neuro-2a (N2a) cell line was maintained in 50% DMEM and 50% Optimem supplemented with 5% fetal bovine serum (FBS), 1% penicillin/streptomycin and 1% MEM essential amino acids, at 37°C with 5% CO2. N2a cells were plated in standard 6-well plates for transient transfections.
Transient transfections with 2N4R tau isoform were performed using Lipofectamine 2000 (Invitrogen) with a total amount of 0.25–2μg cDNA per 1.6 cm2 surface area in 6-well plates, or 15μg cDNA per T75 flask, at a DNA:Lipofectamine ratio of 1:3.
To induce cellular stress and caspase induction, at 24 h after transient transfections cells were treated with 0.0325–1μM staurosporine for 6–24 h. Pan-caspase inhibitors were used at 50μM concentrations with incubation times of 6–24 h.
Purification of paired helical filaments
PHFs were purified from AD brain tissue as described in Jicha et al. [14]. Briefly, AD cortical tissue was weighed and homogenized in TBS buffer (containing 1 mM PMSF) and 1×complete protease inhibitor cocktail (Roche Diagnostics) at a ratio of 10 ml buffer per g tissue. The homogenate was spun at 28,000× g for 30 min at 4°C. The supernatant was reserved and the pellet was discarded. The supernatant was then run over a 25 ml MC1-Affigel 10 column, with a 4 cm high guard column of Sepharose 400 Superflow, with a flow rate of 50–60 ml/h. The supernatants were recycled twice through the column over 18–20 h at 4°C. The bound PHF was then eluted with KSCN, and the protein containing eluate was pooled and dialyzed overnight. The buffer was exchanged to TBS. An AT8 ELISA and western blot was then run to determine the PHF concentration in the sample.
Preparation of cell lysates
After removing the medium, cells were rinsed with Tris-buffered saline solution (TBS) and briefly sonicated in homogenization buffer (10 mM NaF, 1 mM Na3VO4, 2 mM EGTA, in TBS, pH 7.4) supplemented with Complete Mini Protease Inhibitor Cocktail tablets (Roche Diagnostics). Cell lysates were cleared by centrifugation at 2600× g for 10 min at 4°C. Supernatants were collected and protein concentration was estimated using the BCA protein assay kit (Fisher Scientific UK). Cell lysates were stored at –80°C.
Preparation of brain tissue homogenates
Human AD and control brain samples (AECOM collection) were sonicated in homogenization buffer (50 mM Na3PO4, pH 7.0, 10 mM Na4P2O7, 0.5 mM PMSF, 2 mM Na3VO4, 2 mM EGTA, 2 mM EDTA, 20 mM NaF, 1 mM DTT supplemented with Complete Mini Protease Inhibitor Cocktail tablets; Roche Diagnostics) at a ratio of 10 ml buffer per gram of tissue. Homogenates were cleared by centrifugation at 13 000× g for 5 min at 4°C. Supernatants were collected and protein concentration was estimated using the BCA protein assay kit (Fisher Scientific UK). Cell lysates were stored at –80°C.
GUAVA ViaCount and MultiCaspase assays
Cell viability and caspase induction were measured in a GUAVA Technologies Inc PCA-96 flow cytometer using ViaCount and MultiCaspase assays (Millipore) according to the manufacturer’s protocols. The analyses were done using GUAVA software that allowed selection of four population of cells: i) negative for both dyes, ii) positive for SR-VAD-FMK and negative for 7-AAD, iii) cells positive for both dyes, and iv) only 7-AAD positive to be segregated into separate quadrants, which reported the percent of total, and mean intensities are for each quadrant.
Lactate dehydrogenase (LDH) release assay
N2a cell medium was subjected to the CyTox 96® Non-Radioactive cytotoxicity assay. The positive control used was a sample of lysed cells that was harvested in the provided proprietary lysis buffer. Once all samples had been harvested and the positive control generated, 50μl of each sample was transferred to a flat-bottomed 96-well plate, and 50μl of the kit substrate was added to each well. The plate was incubated in the dark for 30 min, before addition of 50μl of stop buffer. The absorbance at 490 nm was recorded, and data were plotted as a percentage of the positive control.
ELISA assays
Flat-bottomed 96-well plates were coated with either DA9 (1μg/ml) or MC1 (2μg/ml) antibodies in coating buffer (15 mM K2HPO4, 25 mM KH2PO4, 0.8% NaCl, 1.2 mM EDTA, 0.05% NaN3, pH 7.2) and incubated overnight at 4°C. The following day the plates were washed in wash buffer (100 mM NaCl, 10 mM Tris base, 1% Tween 20, pH 7.2) and blocked with Starting Block (Pierce). Prior to serial dilutions the total protein concentration in cell lysates and brain homogenates was adjusted to 0.5 mg/ml. Serial dilutions of cell lysates or brain homogenates were prepared in TBS with 20% Superblock (Pierce). Serial dilutions of the control experimental samples or PHFs were used as standard curves. The following day the plates were washed prior to being incubated with CP27 (1μg/ml) antibodies followed by incubation with the secondary goat anti-mouse IgG2b-HRP antibody (1:2000). 1-Step Ultra-TMB (Pierce) was used to develop the reactions and 2 M sulphuric acid to quench them. The results were read using absorbance measurements at 450 nm.
Fractionation of cell lysates
Fractionation of cell lysates was performed as previously described [36], with minor modifications. To obtain the low speed (LS) fraction, cell lysates underwent a 10-min centrifugation at 2600× g at 4°C. Part of the LS fraction was mixed with an equal volume of lysis buffer (20 mM Tris-HCl, pH 7.4, 140 nM NaCl, 1 mM phenylmethylsulfonyl fluoride, 1 mM Na3VO4, 1 mM EDTA, 1X complete protease inhibitors) supplemented with 1% v/v Nonidet P40, and centrifuged for 1 h at 100,000× g at 4°C. The supernatant was collected and stored as the S1 fraction. The pellets (P1) were washed three times with lysis buffer supplemented with 0.5% v/v Nonidet P40. Between each wash the samples were centrifuged at 15 000× g for 3 min at 4°C. For ELISA assays, the pellets were resuspended in a third of the initial LS sample volume of lysis buffer. All samples were stored at –80°C. For western blotting, the pellets were solubilized in 8 M urea by gentle agitation at 37°C before being resuspended in Laemmli buffer (0.125 M Tris-HCl pH 6.8, 5% w/v sodium dodecyl sulphate, 10% w/v 2-mercapto-ethanol, 20% v/v glycerol and enough bromophenol blue) and heated for 5 min at 90°C. Samples were stored at –20°C.
Aggresome detection
N2a cells were prepared for aggresome detection using the FACS Canto and confocal microscopy. For confocal microscopy analysis of aggresomes, N2a cells plated in 96-well plates (BD Biocoat) were transfected with tau and treated with staurosporine, before fixation with Glyo-Fixx (ThermoFisher Scientific) containing 0.1% Triton X-100 (Sigma Aldrich) for 20 min at room temperature. Cells were blocked with 5% marvel milk powder in PBS for 1 h before incubation with the anti-CP27 antibody (1:1000) overnight. The following day cells were washed 3 times in PBS before incubation with the secondary antibody Alexa-Flour IgG1 488 (1:1000) (Life Technologies), aggresome detection reagent (1:2000) (Abcam) and Hoechst dye (1:1000) (Life Technologies). Cells were incubated for 1 h at room temperature, before imaging. For analysis of aggresome formation using FACS Canto, N2a cells plated in T75 flasks were transfected with 2N4R tau or were treated with the positive control for aggresome formation (MG-132). Cells were fixed and permeabilized using the Fix + Perm® Cell Permeabilization Kit (Invitrogen), before incubation with the aggresome detection reagent (1:20,000) for 25 min. Cells were then assessed for aggresome formation immediately by FACS.
Western blotting
Samples were loaded on a NUPAGE RTM Novex 4–12% Bis-Tris Gel (Invitrogen) and run in 1X MES running buffer (Invitrogen) before being transferred onto the Amersham Hybond ECL nitrocellulose membrane (GE Healthcare). Membranes were blocked for 1 h in blocking buffer (5% w/v dried skimmed milk in PBS buffer with 0.05% Tween 20) prior to incubation with primary antibodies in blocking buffer. After incubation with secondary antibodies tau was detected using the ECL Plus Western Blotting Detection Reagents (Fisher Scientific) on the Amersham Typhoon 9400 and band intensities were quantified using the ImageQuantTL program.
Fluorescence-activated cell sorting (FACS)
N2a cells were cultured in T75 flasks, transiently transfected with 2N4R tau cDNA, with or without 0.158μM staurosporine treatment. After trypsinization, cell suspensions were collected and centrifuged at 478× g for 5 min at 18°C before being resuspended in FACS buffer (0.1 % NaN3, 5 % FBS in PBS). The cell count was adjusted to 1×10⁷ cells per milliliter. Cells were fixed and permeabilized (reagent A and B, Fix + Perm® Cell Permeabilization Kit, Invitrogen) before immunostaining with anti-active caspase-3, anti-active caspase-6, and and IgG controls, at 10μg/ml. After a 20-min incubation at room temperature and centrifugation at 500× g for 5 min at 4°C, the cell pellets were resuspended in 200μl FACS buffer and the following secondary antibodies were added: anti-rabbit IgG-APC 1:50 (Prozyme) and anti-mouse IgG1-AF488 1:1250 (Invitrogen). Following a 20-min incubation at room temperature, 3 ml of FACS buffer were added to each tube and centrifuged at 500× g for 5 min at 4°C. The resulting cell pellets were resuspended in 2 ml of FACS buffer before measurement in BD FACS Cantotrademark.
Confocal microscopy
N2a cells were cultured on glass-bottomed culture dishes (MatTek). Following transient transfection with 2N4R tau and 24-h treatment with staurosporine, when required, cells were washed with DPBS (Gibco, Invitrogen), fixed with 4% paraformaldehyde for 10 min and then permeabilized with 0.1% Triton X-100 (Sigma) for 15 min. Alternatively N2a cells were cultured in 96-well plates (BD Biocoat) and fixed with Glyo-Fixx (ThermoFisher Scientific) containing 0.1% Triton X-100 for 20 min. Cells were then washed 3 times with PBS before incubation with blocking buffer (PBS + 5% milk (Marvel)) for 1 h followed by an overnight incubation at 4°C with the primary antibodies MC1 (1:500) or CP27 (1:1000), which were diluted in PBS + 5% milk. Cells were then washed 3 times in DPBS before addition of the secondary antibodies: Alexa Fluor 488 Goat Anti-mouse IgG2b, Alexa Fluor 647 Goat Anti-Mouse IgG1 or Alexa Fluor 568 Goat Anti-Mouse IgG1, Alexa Fluor 350 and Goat Anti-Mouse IgG2B, along with Hoechst dye (1:1000) or the aggresome detection reagent (1:2000) when applicable for 1 h at room temperature. The cells were then washed 3 times with PBS before imaging using the confocal microscope (Olympus Fluoview FX), with a 20× or 40× objective and either a 2 or 4 times zoom. Fluorophores were excited with 405 nm, 488 nm, and 633 nm wavelength lasers.
AlphaScreen assays
AlphaScreen assays (Perkin Elmer) were performed according to the manufacturer’s guidelinesusing tau-specific antibodies. Optimised Alpha-Screen assays were performed using either biotinylated DA9 (bDA9) and acceptor (Ab-ACC) bead antibodies: TG5 total tau, CP13 pS202-tau, MC6 pSer235-tau, PHF1 pSer396/pSer404-tau, or anti-Tau 421, and 10μl per well of optimized antibody mix of Ab-ACC and biotinylated antibody were added to 384-well assay plates (Greiner) together with 5μl per well of sample or standard diluted in AlphaScreen assay buffer (0.1% casein in DPBS). Plates were incubated overnight in the dark at 4°C. After overnight incubation, 5μl of the streptavidin-coated donor beads diluted in AlphaScreen buffer were added to each well and plates incubated in the dark with gentle agitation at room temperature for 4 h. Plates were read at an excitation wavelength 680 nm and emission at 520–620 nm using an Envision plate reader (Perkin Elmer). Linear regression with variable slope analyses was used to calculate relative amounts of total tau and phospho-tau from standard curves derived using purified PHFs. Relative amounts of D421-caspase cleaved tau were calculated from the AlphaScreen count levels relative to the standard curves derived using N2a cells transiently expressing 2N4R tau and treated with 0.5μM staurosporine.
RESULTS
Early conformational changes of tau in a cell-based model can be followed in an ELISA assay with MC1 conformational antibody
To establish the relationship between tau levels and generation of MC1-reactive conformational epitopeN2a cells were transiently transfected with the human 2N4R tau-expressing plasmid and analyzed by a newly-established sandwich ELISA using two antibodies for coating, pan-tau-specific DA9 and human tau-specific CP27, and MC1 for detection of conformationally-altered tau. AD and control brain homogenates were used as controls, the former yielding a high signal and the latter a low background signal (data not shown).
Transient transfections of N2a cells with increasing amounts of the 2N4R tau construct led to a rise in total tau expression and concomitant increase in the amount of conformationally-changed tau (Fig. 1A, B). As shown in Fig. 1C, there is an excellent correlation between the relative amounts of total tau and conformationally-changed tau in N2a cells expressing human tau. However, it is noteworthy that not all of the cells expressing high levels of tau are MC1 positive, as shown in the immunofluorescence experiment with MC1 and CP27 double staining (Fig. 1D–F). This suggests that although the amount of conformationally changed tau produced is correlated with the level of tau expression, at the individual cell level there are perhaps additional factors that determine whether MC1-tau is generated.
Tau-expressing N2a cells show a signature of cellular stress
To further characterize our cellular model, we have evaluated the effects of tau overexpression on cell responses (Fig. 2A–E). Overexpression of tau for 48 h led to an increase in membrane permeability, as measured by LDH release, an indication of cellular toxicity (Fig. 2A, B). There was a 30% increase in membrane permeability related to tau expression for 48 h compared to the untransfected controls at the same time point or tau expression for 24 h. Importantly this was accompanied by an increase in the level of caspase-cleaved tau at Asp421, a known cleavage site for caspase-3 and caspase-6 [37–39], which shows that the overexpression of tau causes cellular stress manifested by activation of caspases (Fig. 2C). There was an apparent elevation of phosphorylated tau at Ser202, however, this did not reach statistical significance, with no change in the levels of phosphorylated tau at pSer396. The above observations confirm that tau expression itself causes a cellular response that is likely to participate in the observed generation of conformationally-changed tau recognized by the MC1 antibody.
In N2a cells expressing human tau, treatment with staurosporine induces expression of caspases and concomitant cleavage of tau at Asp421
There is some evidence that the proteolytic processing of tau may play a crucial role in the aberrant change of tau conformation and its aggregation, or is at least an important marker of the aggregation process. The activation of caspases has been implicated in the formation of neurofibrillary tangles in AD [26]. These observations prompted us to determine whether in our experimental system treatment of cells with staurosporine would drive caspase activation and tau aggregation. Neuroblastoma cells were transiently transfected with 2N4R human tau cDNA and then treated in a dose-dependent manner for 24 h with staurosporine. General caspase activation and apoptotic events were followed in a flow cytometer using a biochemical assay for detection of activated caspases (Fig. 3A). This method uses a fluorochrome-conjugated inhibitor of caspases (SR-VAD-FMK) that binds to multiple caspases, and the resulting fluorescent signal is proportional to total cellular caspase activity. Additionally membrane structural integrity was detected by the cell impermeable dye 7-AAD. The assay allowed us to identify i) cells with low levels of caspase activation, which are negative for both dyes, ii) cells with moderate levels of caspase activation being positive for SR-VAD-FMK and negative for 7-AAD, iii) cells positive for both dyes, which have high levels of caspase activation and go through the late stages of apoptosis, and iv) dead cells, which are only 7-AAD positive. Treatment with staurosporine resulted in a dose-dependent decrease of the viable cell population with a concomitant increase of cells with high levels of caspase activation. Even the lowest concentration (0.0625μM) of staurosporine effectively triggered caspase activation, where 29.5% of SR-VAD-FMK-positive cells, and 45% of SR-VAD-FMK and 7-AAD-positive cells of the total cell population had moderate and high levels of caspase activation, respectively. The highest levels of caspase induction were observed after treatment of cells with 0.5–1μM staurosporine, and under these conditions more than 80% of cells had high levels of caspase activation 24 h after treatment (Fig. 3A). An additional follow-up measurement of membrane permeability manifested by LDH leakage under the above experimental conditions showed no differences in membrane permeability between treatment conditions over 24-h treatment with a range of staurosporine concentrations (Supplementary Figure 1A). However the largest increase in membrane leakage was caused by tau expression itself as already shown in Fig. 2B.
Caspase-3 and caspase-6 have been previously indicated to play roles in the cleavage of tau and association with tau pathology in AD [28–31, 40]. Induction of caspase-3 and caspase-6 in our experimental system was confirmed in fluorescence-activated cell sorting (FACS) experiments where over a 6-fold increase in active caspase-6 and 12-fold increase in active caspase-3 levels were detected in N2a cells after treatment with staurosporine (Fig. 3B). We also set up a sensitive AlphaScreen assay to detect tau cleaved at Asp421. As shown in Fig. 3C, tau undergoes proteolytic cleavage at that site in a dose-dependent manner after treatment with staurosporine, and the maximum cleavage was reached at 0.25–1μM staurosporine after 24-h treatment. Tau cleavage at Asp421 above basal levels was confirmed by confocal microscopy (Fig. 3D). These results reassured us that the experimental set-up would allow us to look at the events of caspase activation and proteolytic processing of tau in the context of tau aggregation.
Treatment with staurosporine induces the MC1-conformational change of tau in N2a cells expressing human tau
Since we hypothesized that the induction of caspases required for apoptosis might affect the integrity and conformational status of tau, we measured the levels of total human tau and conformationally-changed tau in cell lysates collected after treatment of N2a cells with the well-known caspase activator staurosporine (Fig. 4). After treatment of N2a cells with staurosporine, the total levels of tau decreased simultaneously with increasing concentrations of the inducer, however at the same time the levels of conformationally-changed tau increased (Fig. 4B, C). As shown in Fig. 4C, there was a relative 1.6 to 26-fold increase of conformationally-changed tau after treatment with staurosporine.
Under our experimental conditions, the transient overexpression of tau and its conformational change did not seem to cause any detrimental effects on the nuclear compartment in non-staurosporine treated cells. However, enlarged images of cells with staining of total tau and MC1-tau after treatment with staurosporine indicate a change in morphology of the nucleus, and also tau localization around the nucleus (Fig. 4D).
Next, caspase activation and generation of tau conformational change were studied in a time-course experiment where N2a cells expressing human tau were treated with 1μM staurosporine (Fig. 5). Caspase activation was triggered within the first 6 h after the treatment and reached its maximal levels of 78% caspase positive cells after 24 h, with no significant induction of caspases in the non-treated cells (Fig. 5A, D). Also, there was a correlation between the induction of caspases by staurosporine treatment and the generation of conformationally-changed tau. As the levels of total tau decreased with the time of treatment, the levels of conformationally-changed tau increased, and after 24 h they were 29-fold higher than at the start of the experiment (Fig. 5E, F). During the 24-h incubation there was no change in total tau levels, but a 2.5-fold increase in conformationally-changed tau levels in the untreated controls (Fig. 5B, C). During the time course of staurosporine treatment there was an increase in membrane permeability of N2a cells treated with 1μM staurosporine for 6 h compared to untreated cells, as measured by LDH release. However, beyond that time point there was no difference in apparent toxicity between N2a cells treated with staurosporine versus the controls (Supplementary Figure 1B). This indicates that even though cell viability might be compromised to some extent upon increased caspase induction the severity of it does not worsen under our experimental conditions.
Both in dose-response and time-course experiments the levels of tau phosphorylation on Ser396/Ser404, Ser235, and Ser202 were decreased after treatment with staurosporine (Supplementary Figure 2B), as would be expected after treatment with a broad-spectrum kinase inhibitor.
The above results show that caspase activation can be induced by nanomolar concentrations of staurosporine and that there is a correlation between caspase activation triggered by staurosporine and generation of conformationally-changed tau, as measured in the MC1 ELISA assay.
Aggregates of tau are responsible for the enhanced signal observed in the MC1/CP27 ELISA format
To determine whether the tau conformational change triggered by staurosporine is accompanied by tau aggregation, we performed tau fractionation experiments. Cell lysates from N2a cells treated with staurosporine were subjected to ultracentrifugation in the presence of a non-ionic detergent and separated into soluble and insoluble fractions (Fig. 6A). There was a dose-dependent decrease in the levels of tau in the total and soluble fractions with a concomitant increase of insoluble tau. Staurosporine treatment also induced a pronounced pattern of tau cleavage products at all concentrations tested. These results are consistent with the results of the total tau analyses in the ELISA assay (Fig. 4A), where a dose-dependent decrease of total tau after treatment with staurosporine was seen. The accumulation of detergent-insoluble tau species in the insoluble fractions after treatment with staurosporine observed here follows a dose-dependent pattern, where the highest aggregation was observed with 0.5–1μM staurosporine. Using a total tau ELISA assay, tau was shown to be present in the low-speed, soluble and insoluble fractions. However, an ELISA assay testing for conformationally-changed tau only yielded strong positive signals for the low-speed and insoluble fractions while the soluble fraction gave a low range of absorbance signals above the background (Fig. 6B). This suggests that aggregates of tau are responsible for the enhanced signal observed in the MC1 ELISA assay. These aggregates were not stained by Thioflavin S, as assessed in confocal microscopy (data not shown), which imply that even though they are recognized by the conformational MC1 antibody they are likely not of a fibrillar nature. Follow-up analyses of aggresome formation revealed that the expression of tau itself induced aggresome formation by 8% above the basal levels, whereas treatment of N2a cells for 24 h with the proteasome inhibitor MG132 increased aggresome formation by 35% above the control (Supplementary Figure 3). Importantly, N2a cells expressing tau showed the presence of pronounced inclusions that co-localized with tau particularly after treatment with staurosporine already within 12 h of the experiment (Fig. 6C). These results indicate that tau species generated under conditions of staurosporine treatment become substrates for aggresome formation, and likely, clearance by lysosomes.
Caspase-driven proteolytic processing of tau and its aggregation occur within hours and can be blocked by caspase inhibitors
Having demonstrated the time- and concentration-dependent conformational changes of tau upon treatment with staurosporine and induction of caspases, we attempted to determine comparatively the timing of occurrence of tau proteolytic cleavage and its conformational change. Thus, we set up time-course and staurosporine dose-response experiments to follow in parallel tau cleavage at Asp421 and conformational change recognized by the MC1-antibody. Confirming the previous observations (Figs. 3 and 4), there was a dose-dependent increase in tau cleavage at Asp421 and generation of MC1-tau after treatment with staurosporine, but the pattern for both modifications differed over the time course of treatment (Fig. 7A, B). Interestingly, for all treatment conditions, the highest levels of Asp421-tau were observed as early as the 6-h time point, while prolonged incubation over 12 to 24 h led to loss of the epitope— most likely due to further proteolytic processing of the C-terminus (Fig. 7A). MC1-tau generation was triggered by 0.25μM and higher concentrations of staurosporine, and similar to the appearance of Asp421-cleaved tau it was already seen at the 6-h time point (Fig. 7B). The highest levels of MC1-tau were observed after 24-h treatment with 1μM staurosporine, at which point the levels of tau truncated at Asp421 were at their lowest under those experimental conditions. This indicates that the cleavage of tau at Asp421 is important in the cascade of tau conformational change, but after incorporation into aggregates the C-terminus of tau undergoes further proteolytic processing. To further test this hypothesis we assessed tau integrity using the pan-caspase inhibitor Z-VAD(Ome)-FMK in N2a cells transiently expressing tau and treated with increasing concentrations of staurosporine over 24 h. As expected, treatment of cells with staurosporine resulted in a dose- and time-dependent proteolytic cleavage of tau (Fig. 7C). After only 6 h of treatment, a pronounced pattern of tau degradation with multiple faster migrating fragments was observed, and after 24-h treatment with 0.25μM and 0.5μM staurosporine most tau was fully degraded. Interestingly, co-treatment of cells with staurosporine and pan-caspase inhibitor nearly completely halted tau degradation with treatment for 6 h in the range of staurosporine concentrations tested (Fig. 7C). The effect was even more dramatic at the 24-h time-point at which caspase inhibition significantly diminished tau proteolysis triggered by staurosporine.
We then looked at the levels of total and Asp421-caspase cleaved tau in N2a cells expressing human tau, treated with staurosporine and co-treated with the pan-caspase inhibitor. Levels of total tau and tau caspase-cleaved at Asp421 were measured in AlphaScreen assays (Fig. 7D, E). Here, the treatment of N2a cells with 0.158μM staurosporine did not cause a change in the total tau levels but 0.5μM staurosporine drove a dramatic 75% reduction of total tau. Levels of tau after treatment with pan-caspase inhibitor were restored to a higher degree than in the untreated cells, which implies that expression of tau itself may cause induction of caspases and tau degradation. Importantly, as shown in the Asp421-caspase cleaved tau AlphaScreen assay, tau cleavage was fully blocked by the pan-caspase inhibitor after treatment with both concentrations of staurosporine (Fig. 7E).
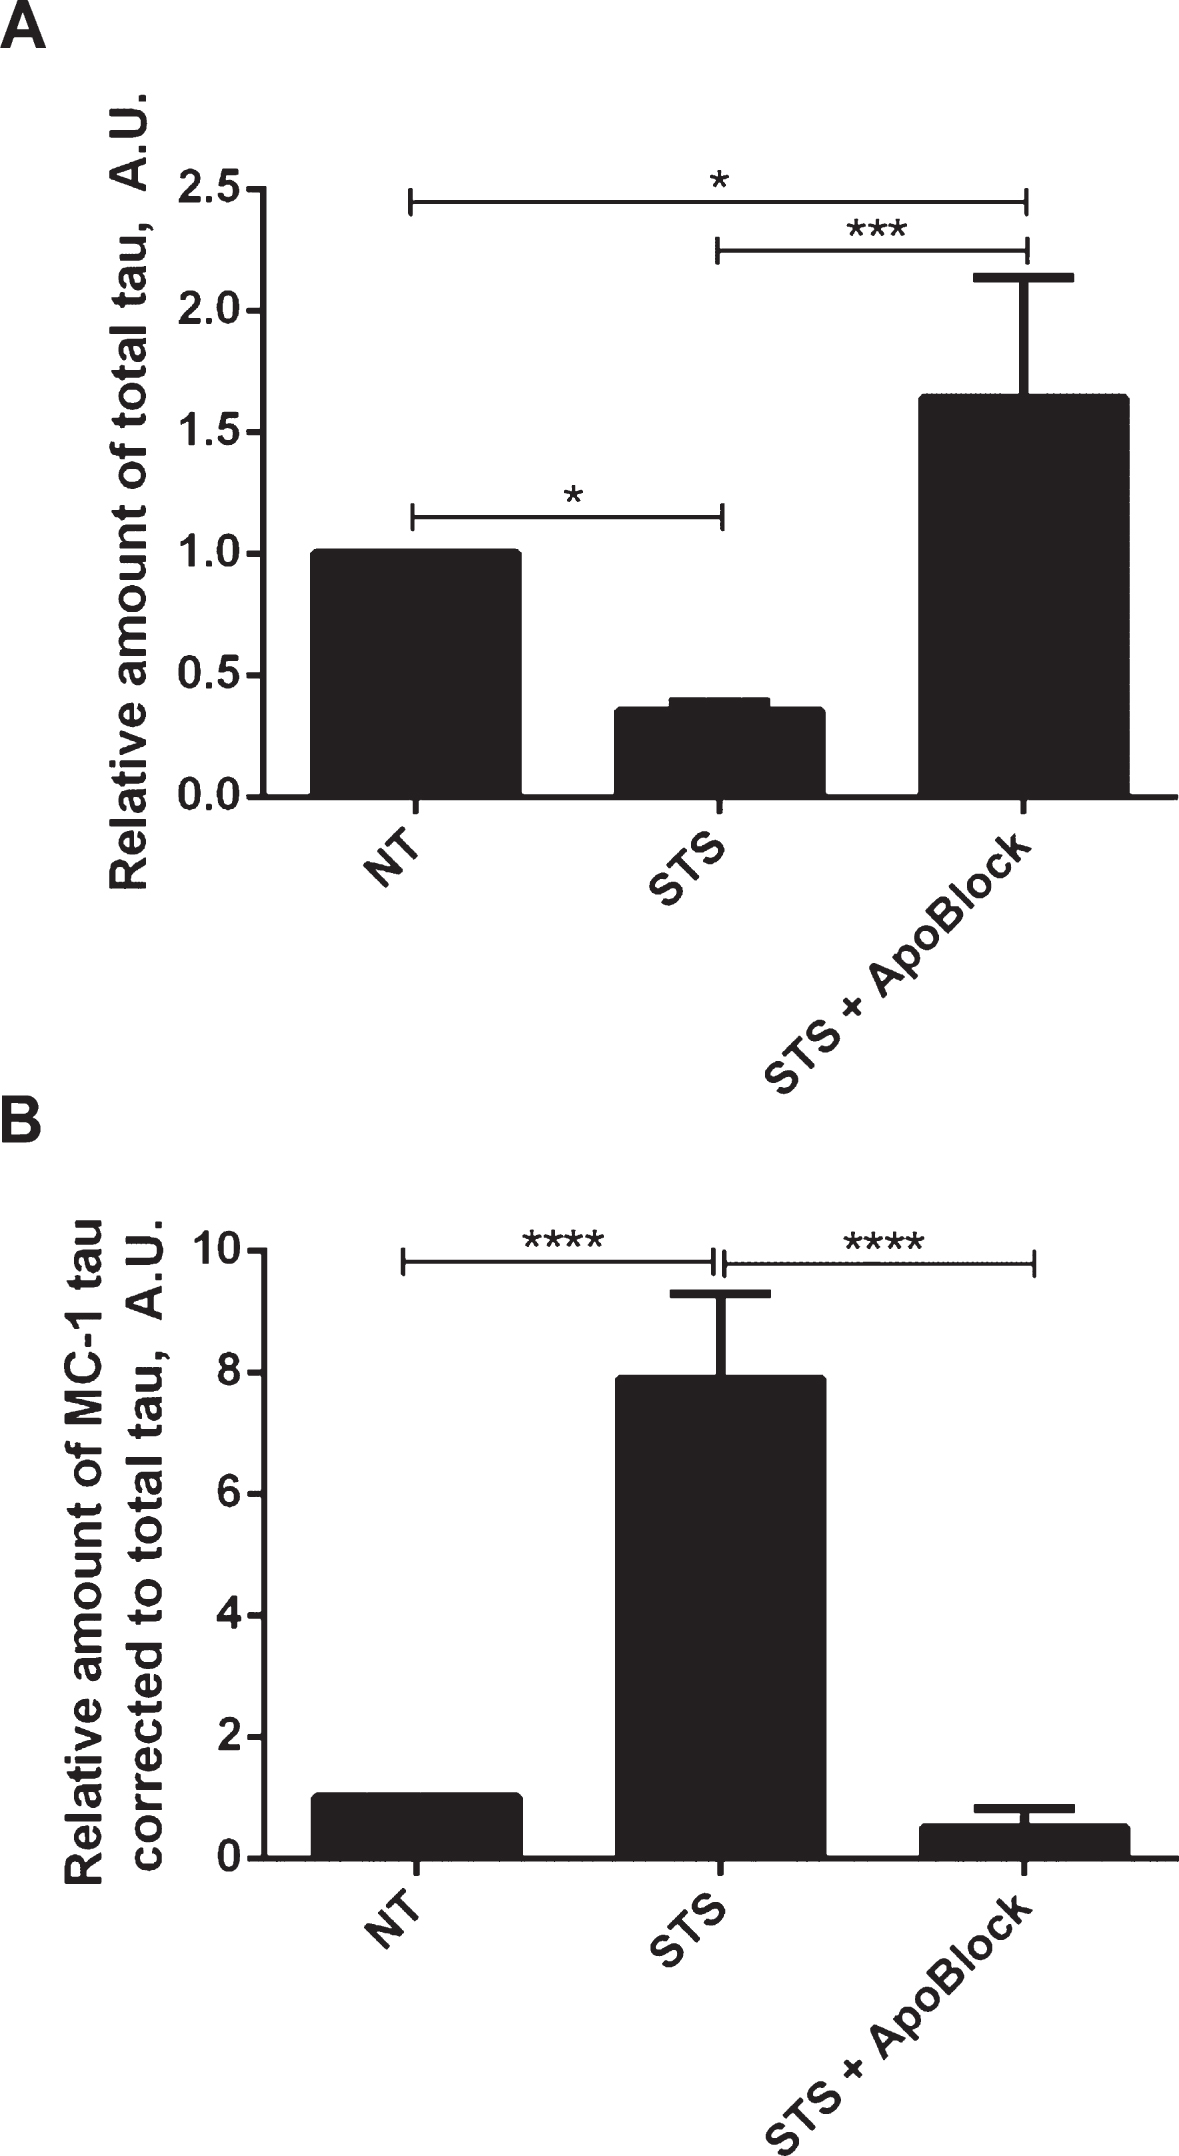
Next we tested whether tau conformational change and aggregation under our experimental conditions can be halted by treatment with the pan-caspase inhibitor ApoBlock. N2a cells transiently transfected with tau were treated with staurosporine to trigger caspase activation and consequent proteolytic cleavage of tau, its conformational change and aggregation (Fig. 8). As observed previously, the level of total tau is decreased 3-fold after treatment of N2a cells with staurosporine compared to the vehicle-treated cells. Strikingly, after pan-caspase inhibitor treatment the level of total tau increased by 64% compared to the vehicle-treated samples (Fig. 8A). There was a near 8-fold increase in conformationally changed tau (MC1-tau) with staurosporine treatment, which is in agreement with our previous observations. Crucially, the pan-caspase inhibitor reduced the levels of MC1-tau to 50% of the basal levels found in the control samples that were not treated with staurosporine (Fig. 8B). These data indicate that in our experimental system proteolytic processing of tau by caspases drives the observed conformational change, and inhibition of the induced and background levels of caspases can protect tau from proteolytic cleavage and conformational change as recognized by the MC1 antibody.
DISCUSSION
Many post-translational modifications of tau have been described in the literature, but the sequence of events that drive tau conformational changes and aggregation in AD is still not clear. Since a change in tau protein conformation is one of the earliest pathological events in AD [12, 13], inhibiting this structural modification would be very attractive therapeutically. Over the past decade it has been discussed whether proteolytic processing of tau may play a crucial role in the aberrant change of tau conformation and its aggregation. It has been shown that tau can be processed by various proteases and, among these, caspases have been considered as prospective therapeutic targets in AD due to the fact that their activation has been found to be one of the pathological features of the disease [24].
This led us to investigate the effects of cellular stress resulting in caspase activation on the generation of conformationally-changed tau. We set up a cell-based model with the murine neuroblastoma cell line (N2a) transiently transfected with the longest 2N4R human tau isoform, which allowed us to follow tau’s conformational change and aggregation. In our experimental system, we were able to detect the aberrant conformational change of tau using a sensitive sandwich ELISA assay with the MC1 antibody, which recognizes the pathological conformation of tau wherein the third microtubule binding repeat comes into close proximity with the N-terminus [11]. As we have demonstrated here transfection with tau alone resulted in a basal level of conformationally-changed tau which in general was correlated with the total level of expressed tau. Despite this only a small fraction of N2a cells expressing high levels of human 2N4R tau showed MC1 immunoreactivity, and high concentrations of cytosolic tau seem necessary but not sufficient to induce MC1-tau generation. These data suggest that there could be additional factors that determine if MC1-tau is generated. The basal level of MC1-reactive tau in transiently transfected N2a cells was also confirmed in the MC1 ELISA assay. Early on we observed an increase in membrane permeability and a low level of caspase induction in N2a cells expressing tau. This was accompanied by a low level of tau proteolytic cleavage with Asp421-cleaved tau present among the proteolytic products. These events were assumed likely to contribute to the observed basal generation of conformationally-changed tau recognized by the MC1 antibody. Therefore, we explored whether we could stimulate a more robust conformational change in tau and its aggregation by induction of caspases with staurosporine. The extent of tau proteolytic processing was greatly enhanced by staurosporine-driven induction of caspases. We have demonstrated that caspase induction in a dose-dependent manner increased the generation of conformationally-changed tau detected in the MC1-ELISA assay and this correlated with proteolytic processing including cleavage at Asp421. Some of the observed morphological changes to the nucleus upon tau expression and conformational change under treatment with staurosporine agree with earlier literature findings that overexpression of tau in SH-SY5Y neuroblastoma cells caused significant deformity of the nuclear compartment with extensive lobulations along the nuclear envelope [41]. Altogether these observations reassured us that the experimental set up would allow us to investigate the events of tau aggregation in the context of its caspase-driven proteolysis.
Tau hyperphosphorylation is often proposed to be one of the main causes of a conformational change in tau, ultimately leading to its aggregation into NFTs. Indeed, it was previously shown in cultured cells that tau hyperphosphorylation in the presence of JNK3 and GSK3β kinases leads to the formation of detergent-insoluble and Thioflavin S-reactive tau aggregates [42]. However, as we have demonstrated here, the levels of conformationally-changed tau are inversely correlated with the levels of tau phosphorylation after treatment with staurosporine, which suggests that hyperphosphorylation of tau per se does not drive its conformational change in our cell-based model. In fact, the observed decrease in tau phosphorylation might have influenced tau to adopt the MC1 conformation more readily, as it has been previously reported that some tau phosphorylations may protect tau from caspase cleavage [43]. Certainly in our cell model it is clear that tau cleavage, rather than hyperphosphorylation, is better correlated with the generation of conformationally-changed and aggregated tau both at the basal level and upon induction by staurosporine.
The MC1 aberrant conformation of tau was shown to be present in a soluble form of the protein and in PHF assemblies [12, 13]. To determine whether the tau conformational change triggered by caspase induction is accompanied by tau aggregation, we performed tau fractionation experiments. Interestingly, we observed that treatment of cells with staurosporine within 24 h converted soluble tau into detergent-insoluble, aggregated tau, suggesting that the conformationally-changed MC1-tau is prone to very rapid aggregation. This is indeed in agreement with previous reports where activation of executioner caspases was shown to precede rapid tangle formation in rTg4510 tau transgenic mice [26]. Though the tau aggregates generated in our experimental system over the time course of 24 h were recognized by the conformational MC1 antibody they are likely not of a fibrillar nature as they did not stain for Thioflavin S. We have found, however, that expression of tau itself moderately increased aggresome formation, but especially upon treatment with staurosporine tau was found to extensively co-localize with denatured protein cargo within aggresomes. This indirectly suggests that the misfolded tau species are likely attenuated in aggresomes before degradation via autophagy.
As reported here the induction of caspases drives proteolytic processing, and tau becomes efficiently cleaved at Asp421, a far C-terminal site that is known to be proteolytically processed both by caspase-3 and caspase-6 in vitro [31, 33]. Indeed our AlphaScreen and FACS analyses indicated that both caspases were found to be robustly activated in response to staurosporine treatment, which was accompanied by extensive cleavage of tau at Asp421. Knowing that tau phosphorylation, proteolysis, and conformational changes play important roles in the pathogenesis of AD, over the past years there have been numerous attempts to determine the chronological sequence of these events. Multiple scenarios have been proposed including those where phosphorylation and cleavage of tau at Asp421 is followed by the canonical conformational Alz-50 epitope, or phosphorylation is followed by the conformational change, with cleavage as the last step [44]. Generation of Asp421-truncated tau in fibrillary structures was also indicated to produce further permanent toxicity for neurons [45]. Nevertheless, whether caspase cleavage of tau is one of the key triggers in its aggregation pathway or simply a marker of tau’s aberrant conformation, and most importantly whether halting of caspase activity could be disease-relevant and protect tau from the conformational change and aggregation still remain to be defined. Here we have shown that caspase induction, proteolytic processing of tau, and its aggregation are indeed well correlated. Both tau truncation and its conformational change happen within the first 6 h of staurosporine treatment and caspase induction, but as the amount of MC1-tau increases over time, the amount of Asp421-cleaved tau is decreased. This indicates that proteolysis of tau at Asp421 is likely important in the cascade of its conformational change, but after assembly of tau into aggregates this epitope is cleaved off as a result of further proteolytic processing by other proteases. Indeed, detailed immunohistochemical analyses with antibodies to Asp421- and Glu391-truncated tau resulted in the conclusion that tau proteolysis occurs sequentially from the C-terminus to inner regions of tau in AD progression [46].
Crucially, for the first time we have demonstrated that tau fragmentation and aggregation can be effectively halted by wide-spectrum caspase inhibitors. Indeed, caspase-driven cleavage of tau detected as a range of faster migrating species in western blotting and generation of Asp421-cleaved tau were attenuated by pan-caspase inhibitors. Also, treatment of cells with a pan-caspase inhibitor prevented the generation of MC1-tau under staurosporine treatment conditions where high levels of aggregated MC1-tau were detected. As we observed using the total tau and MC1 ELISA assays, treatment with the pan-caspase inhibitors restored total tau levels and decreased the generation of MC1-tau in the control vehicle-treated cells. Altogether the above findings indicate that caspase activation is intimately associated both with tau proteolytic cleavage and its aberrant structural change recognized by the conformational MC1 antibody.
Future experiments will address the role of members of the caspase family in the induction of tau aggregation. Identification of the key players will ultimately lead to a better understanding at the molecular level of the tau pathological cascade and potentially allow the development of disease-modifying therapeutic drugs that target this neurodegenerative pathway.
DISCLOSURE STATEMENT
Authors’ disclosures available online (http://j-alz.com/manuscript-disclosures/15-0960r2).
Appendices
The supplementary material is available in the electronic version of this article: http://dx.doi.org/10.3233/JAD-150960.
REFERENCES
[1] | Selkoe DJ ((1986) ) Altered structural proteins in plaques and tangles: What do they tell us about the biology of Alzheimer’s disease? Neurobiol Aging 7: , 4225–4232. |
[2] | Yagishita S , Itoh Y , Nan W , Amano N ((1981) ) Reappraisal of the fine structure of Alzheimer’s neurofibrillary tangles. Acta Neuropathol 54: , 239–246. |
[3] | Ihara Y , Nukina N , Miura R , Ogawara M ((1986) ) Phosphorylated tau protein is integrated into paired helical filaments in Alzheimer’s disease. J Biochem 99: , 1807–1810. |
[4] | Cleveland DW , Hwo SY , Kirschner MW ((1977) ) Physical and chemical properties of purified tau factor and the role of tau in microtubule assembly. J Mol Biol 116: , 227–247. |
[5] | Avila J , Lucas JJ , Perez M , Hernandez F ((2004) ) Role of tau protein in both physiological and pathological conditions. Physiol Rev 84: , 361–384. |
[6] | Buee L , Troquier L , Burnouf S , Belarbi K , Van Der Jeugd A , Ahmed T , Fernandez-Gomez F , Caillierez R , Grosjean M- , Begard S , Barbot B , Demeyer D , Obriot H , Brion I , Buee-Scherrer V , Maurage C , Balschun D , D’Hooge R , Hamdane M , Blum D , Sergeant N ((2010) ) From tau phosphorylation to tau aggregation: What about neuronal death? Biochem Soc Trans 38: , 967–972. |
[7] | Mandelkow E , Stamer K , Vogel R , Thies E , Mandelkow E ((2003) ) Clogging of s by tau, inhibition of axonal traffic and starvation of synapses. Neurobiol Aging 24: , 1079–1085. |
[8] | LaPointe NE , Morfini G , Pigino G , Gaisina IN , Kozikowski AP , Binder LI , Brady ST ((2009) ) The amino terminus of tau inhibits kinesin-dependent axonal transport: Implications for filament toxicity. J Neurosci Res 87: , 440–451. |
[9] | Ghoshal N , Garcia-Sierra F , Wuu J , Leurgans S , Bennett DA , Berry RW , Binder LI ((2002) ) Tau conformational changes correspond to impairments of episodic memory in mild cognitive impairment and Alzheimer’s disease. Exp Neurol 177: , 475–493. |
[10] | Zempel H , Luedtke J , Kumar Y , Biernat J , Dawson H , Mandelkow E , Mandelkow E ((2013) ) Amyloid-beta oligomers induce synaptic damage via Tau-dependent microtubule severing by TTLL6 and spastin. EMBO J 32: , 2920–2937. |
[11] | Jicha GA , Bowser R , Kazam IG , Davies P ((1997) ) Alz-50 and MC-1, a new monoclonal antibody raised to paired helical filaments, recognize conformational epitopes on recombinant tau. J Neurosci Res 48: , 128–132. |
[12] | Weaver CL , Espinoza M , Kress Y , Davies P ((2000) ) Conformational change as one of the earliest alterations of tau in Alzheimer’s disease. Neurobiol Aging 21: , 719–727. |
[13] | Uboga NV , Price JL ((2000) ) Formation of diffuse and fibrillar tangles in aging and early Alzheimer’s disease. Neurobiol Aging 21: , 1–10. |
[14] | Jicha GA , Berenfeld B , Davies P ((1999) ) Sequence requirements for formation of conformational variants of tau similar to those found in Alzheimer’s disease. J Neurosci Res 55: , 713–723. |
[15] | Chen F , David D , Ferrari A , Gotz J ((2004) ) Posttranslational modifications of tau - Role in human tauopathies and modeling in transgenic animals. Curr Drug Targets 5: , 503–515. |
[16] | Grundke-Iqbal I , Iqbal K , Tung Y ((1986) ) Abnormal phosphorylation of the microtubule-associated protein (tau) in Alzheimer cytoskeletal pathology. Proc Natl Acad Sci U S A 83: , 44913–44917. |
[17] | Mondragon-Rodriguez S , Basurto-Islas G , Binder LI , Garcia-Sierra F ((2009) ) Conformational changes and cleavage; are these responsible for the tau aggregation in Alzheimer’s disease? Future Neurol 4: , 39–53. |
[18] | Binder LI , Guillozet-Bongaarts AL , Garcia-Sierra F , Berry RW ((2005) ) Tau, tangles, and Alzheimer’s disease. Biochim Biophys Acta 1739: , 216–223. |
[19] | Kuhla B , Haase C , Flach K , Luth H , Arendt T , Munch G ((2007) ) Effect of pseudophosphorylation and cross-linking by lipid peroxidation and advanced glycation end product precursors on tau aggregation and filament formation. J Biol Chem 282: , 6984–6991. |
[20] | Wischik CM , Novak M , Edwards PC , Klug A , Tichelaar W , Crowther RA ((1988) ) Structural characterization of the core of the paired helical filament of Alzheimer disease. Proc Natl Acad Sci U S A 85: , 4884–4888. |
[21] | Perry G , Mulvihill P , Fried VA , Smith HT , Grundke-Iqbal I , Iqbal K ((1989) ) Immunochemical properties of ubiquitin conjugates in the paired helical filaments of Alzheimer disease. J Neurochem 52: , 1523–1528. |
[22] | Gamblin TC , Chen F , Zambrano A , Abraha A , Lagalwar S , Guillozet AL , Lu M , Fu Y , Garcia-Sierra F , LaPointe N , Miller R , Berry RW , Binder LI , Cryns VL ((2003) ) Caspase cleavage of tau: Linking amyloid and neurofibrillary tangles in Alzheimer’s disease. Proc Natl Acad Sci U S A 100: , 10032–10037. |
[23] | Min S , Cho S , Zhou Y , Schroeder S , Haroutunian V , Seeley WW , Huang EJ , Shen Y , Masliah E , Mukherjee C , Meyers D , Cole PA , Ott M , Gan L ((2010) ) Acetylation of tau inhibits its degradation and contributes to tauopathy. Neuron 67: , 953–966. |
[24] | Wang Y , Garg S , Mandelkow E , Mandelkow E ((2010) ) Proteolytic processing of tau. Biochem Soc Trans 38: , 955–961. |
[25] | Hyman BT , Yuan J ((2012) ) Apoptotic and non-apoptotic roles of caspases in neuronal physiology and pathophysiology. Nat Rev Neurosci 13: , 395–406. |
[26] | de Calignon A , Fox LM , Pitstick R , Carlson GA , Bacskai BJ , SpiresJones TL , Hyman BT ((2010) ) Caspase activation precedes and leads to tangles. Nature 464: , 1201–1204. |
[27] | Rissman RA , Poon WW , BlurtonJones M , Oddo S , Torp R , Vitek MP , LaFerla FM , Rohn TT , Cotman CW ((2004) ) Caspase-cleavage of tau is an early event in Alzheimer disease tangle pathology. J Clin Invest 114: , 121–130. |
[28] | Guo H , Albrecht S , Bourdeau M , Petzke T , Bergeron C , LeBlanc AC ((2004) ) Active caspase-6 and caspase-6-cleaved tau in neuropil threads, neuritic plaques, and neurofibrillary tangles of Alzheimer’s disease. Am J Pathol 165: , 523–531. |
[29] | Albrecht S , Bourdeau M , Bennett D , Mufson EJ , Bhattacharjee M , LeBlanc AC ((2007) ) Activation of caspase-6 in aging and mild cognitive impairment. Am J Pathol 170: , 1200–1209. |
[30] | Wai MSM , Liang Y , Shi C , Cho EYP , Kung H , Yew DT ((2009) ) Co-localization of hyperphosphorylated tau and caspases in the brainstem of Alzheimer’s disease patients. Biogerontology 10: , 457–469. |
[31] | Gamblin TC , Chen F , Zambrano A , Abraha A , Lagalwar S , Guillozet AL , Lu M , Fu Y , Garcia-Sierra F , LaPointe N , Miller R , Berry RW , Binder LI , Cryns VL ((2003) ) Caspase cleavage of tau: Linking amyloid and neurofibrillary tangles in Alzheimer’s disease. Proc Natl Acad Sci U S A 100: , 10032–10037. |
[32] | Horowitz PM , Patterson KR , Guillozet-Bongaarts AL , Reynolds MR , Carroll CA , Weintraub ST , Bennett DA , Cryns VL , Berry RW , Binder LI ((2004) ) Early N-terminal changes and caspase-6 cleavage of tau in Alzheimer’s disease. J Neurosci 24: , 7895–7902. |
[33] | Zhao H , Zhao WJ , Lok K , Wang ZJ , Yin M ((2014) ) A Synergic Role of Caspase-6 and Caspase-3 in Tau Truncation at D421 Induced by H2O2. Cell Mol Neurobiol 34: , 369–378. |
[34] | Vincent I , Rosado M , Davies P ((1996) ) Mitotic mechanisms in Alzheimer’s disease? J Cell Biol 132: , 413–425. |
[35] | Davies P ((2000) ) Characterization and use of monoclonal antibodies to tau and paired helical filament tau. Methods Mol Med 32: , 361–373. |
[36] | Bandyopadhyay B , Li GB , Yin HS , Kuret J ((2007) ) Tau aggregation and toxicity in a cell culture model of tauopathy. J Biol Chem 282: , 16454–16464. |
[37] | Gamblin TC , Chen F , Zambrano A , Abraha A , Lagalwar S , Guillozet AL , Lu M , Fu Y , Garcia-Sierra F , LaPointe N , Miller R , Berry RW , Binder LI , Cryns VL ((2003) ) Caspase cleavage of tau: Linking amyloid and neurofibrillary tangles in Alzheimer’s disease. Proc Natl Acad Sci U S A 100: , 10032–10037. |
[38] | Rissman RA , Poon WW , Blurton-Jones M , Oddo S , Torp R , Vitek MP , LaFerla FM , Rohn TT , Cotman CW ((2004) ) Caspase-cleavage of tau is an early event in Alzheimer disease tangle pathology. J Clin Invest 114: , 121–130. |
[39] | Zhao H , Zhao W , Lok K , Wang Z , Yin M ((2014) ) A synergic role of caspase-6 and caspase-3 in tau truncation at D421 induced by H2O2. Cell Mol Neurobiol 34: , 369–378. |
[40] | Horowitz PM , Patterson KR , Guillozet-Bongaarts AL , Reynolds MR , Carroll CA , Weintraub ST , Bennett DA , Cryns VL , Berry RW , Binder LI ((2004) ) Early N-terminal changes and caspase-6 cleavage of tau in Alzheimer’s disease. J Neurosci 24: , 7895–7902. |
[41] | Monroy-Ramírez HC , Basurto-Islas G , Mena R , Cisneros B , Binder LI , Avila J , Garcia-Sierra F ((2013) ) Alterations in the nuclear architecture produced by the overexpression of tau protein in neuroblastoma cells. J Alzheimers Dis 36: , 503–520. |
[42] | Sato S , Tatebayashi Y , Akagi T , Chui DH , Murayama M , Miyasaka T , Planel E , Tanemura K , Sun XY , Hashikawa T , Yoshioka K , Ishiguro K , Takashima A ((2002) ) Aberrant tau phosphorylation by glycogen synthase kinase-3 beta and JNK3 induces oligomeric tau fibrils in COS-7 cells. J Biol Chem 277: , 42060–42065. |
[43] | GuillozetBongaarts AL , Cahill ME , Cryns VL , Reynolds MR , Berry RW , Binder LI ((2006) ) Pseudophosphorylation of tau at serine 422 inhibits caspase cleavage: In vitro evidence and implications for tangle formation in vivo. J Neurochem 97: , 1005–1014. |
[44] | Mondragón-Rodríguez S1 , Basurto-Islas G , Santa-Maria I , Mena R , Binder LI , Avila J , Smith MA , Perry G , García-Sierra F ((2008) ) Cleavage and conformational changes of tau protein follow phosphorylation during Alzheimer’s disease. Int J Exp Pathol 89: , 81–90. |
[45] | Jarero-Basulto JJ1 , Luna-Muñoz J , Mena R , Kristofikova Z , Ripova D , Perry G , Binder LI , Garcia-Sierra F ((2013) ) Proteolytic cleavage of polymeric tau protein by caspase-3: Implications for Alzheimer disease. J Neuropathol Exp Neurol 72: , 1145–1161. |
[46] | Basurto-Islas G , Luna-Muñoz J , Guillozet-Bongaarts AL , Binder LI , Mena R , García-Sierra F ((2008) ) Accumulation of aspartic acid421- and glutamic acid391-cleaved tau in neurofibrillary tangles correlates with progression in Alzheimer disease. J Neuropathol Exp Neurol 67: , 470–483. |
Figures and Tables
Fig.1
Correlation between total tau and conformationally-changed MC1-tau levels. A–C) ELISA assay analyses of cell lysates from N2a cells transiently transfected with increasing amounts of 2N4R tau cDNA or mock transfected controls. Relative amounts of total tau measured in DA9/CP27 ELISA (A), conformationally changed tau measured in MC1/CP27 ELISA (B), and correlation of mean values from the two (C). Linear regression with variable slope analyses were used to calculate relative amounts of total tau and conformationally-changed tau from standard curves made of purified PHFs. A 50μg and 0.625μg of cell lysates were loaded per well for detection of MC1-tau and total tau, respectively. Amounts of total tau and conformationally-changed tau are expressed as mean values for six individual data sets. A.U., arbitrary units. D–F) Fluorescence micrographs of N2a cells immunostained for total tau with CP27 antibody (D), conformationally-changed tau with MC1 antibody (E), nuclear staining and merged MC1 and CP27-stained images (F).
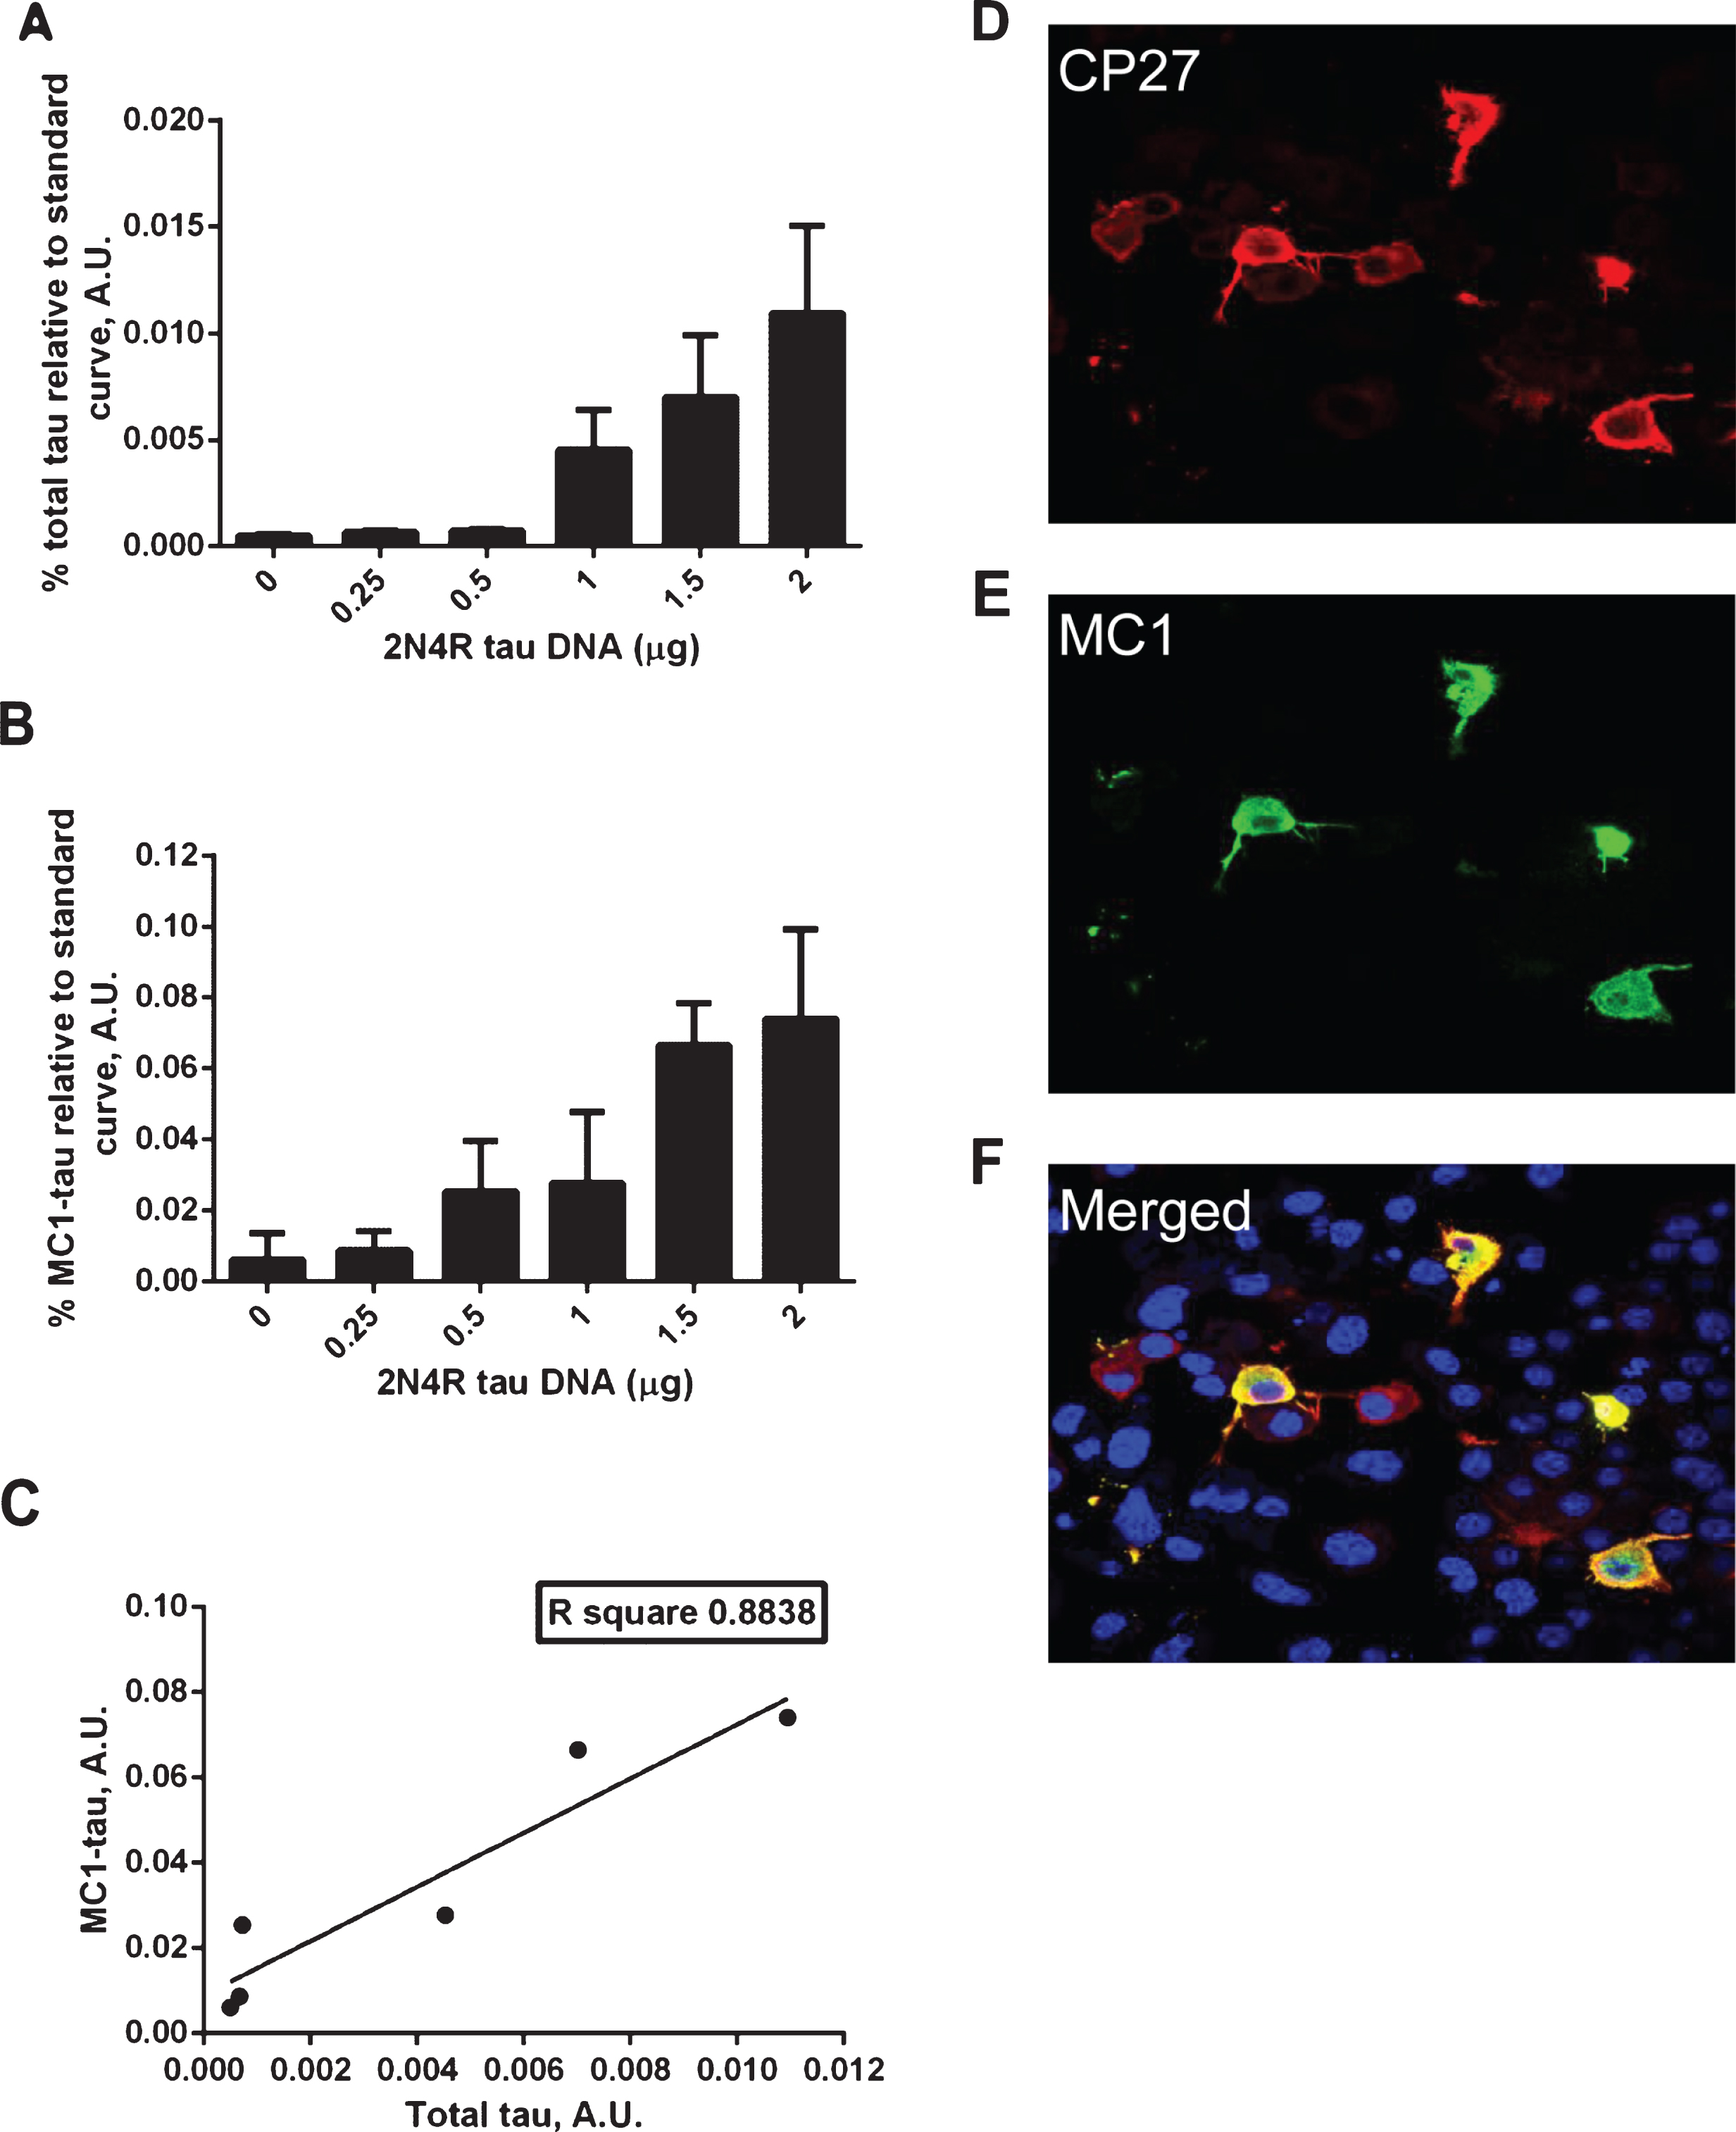
Fig.2
Effects of tau expression on stress-related cellular events. A) Relative amounts of total tau in DA9/CP27 ELISA in lysates from N2a cells transiently transfected with 2N4R tau cDNA for 24 and 48 h. B) Lactate dehydrogenase (LDH) release monitored in medium from N2a cells transiently transfected with 2N4R tau cDNA for 24 and 48 h, and mock transfected controls. C) Results of AlphaScreen assays for D421-caspase cleaved tau and (D, E) phospho-tau corrected to total tau levels in N2a cells expressing 2N4R tau for 24 and 48 h. Linear regression with variable slope analyses were used to calculate relative amounts of total tau from standard curves made of purified PHFs. Relative amounts of D421-caspase cleaved tau were calculated from standard curves made of N2a cell lysates transiently expressing 2N4R tau and treated with staurosporine. Amounts of total tau, D421-tau, pS202 and pS396/pS404 are expressed as mean values of six individual datasets from three independent experiments. Statistical analyses were done using one-way ANOVA with Dunnett’s test or unpaired t test. A.U., arbitrary units.
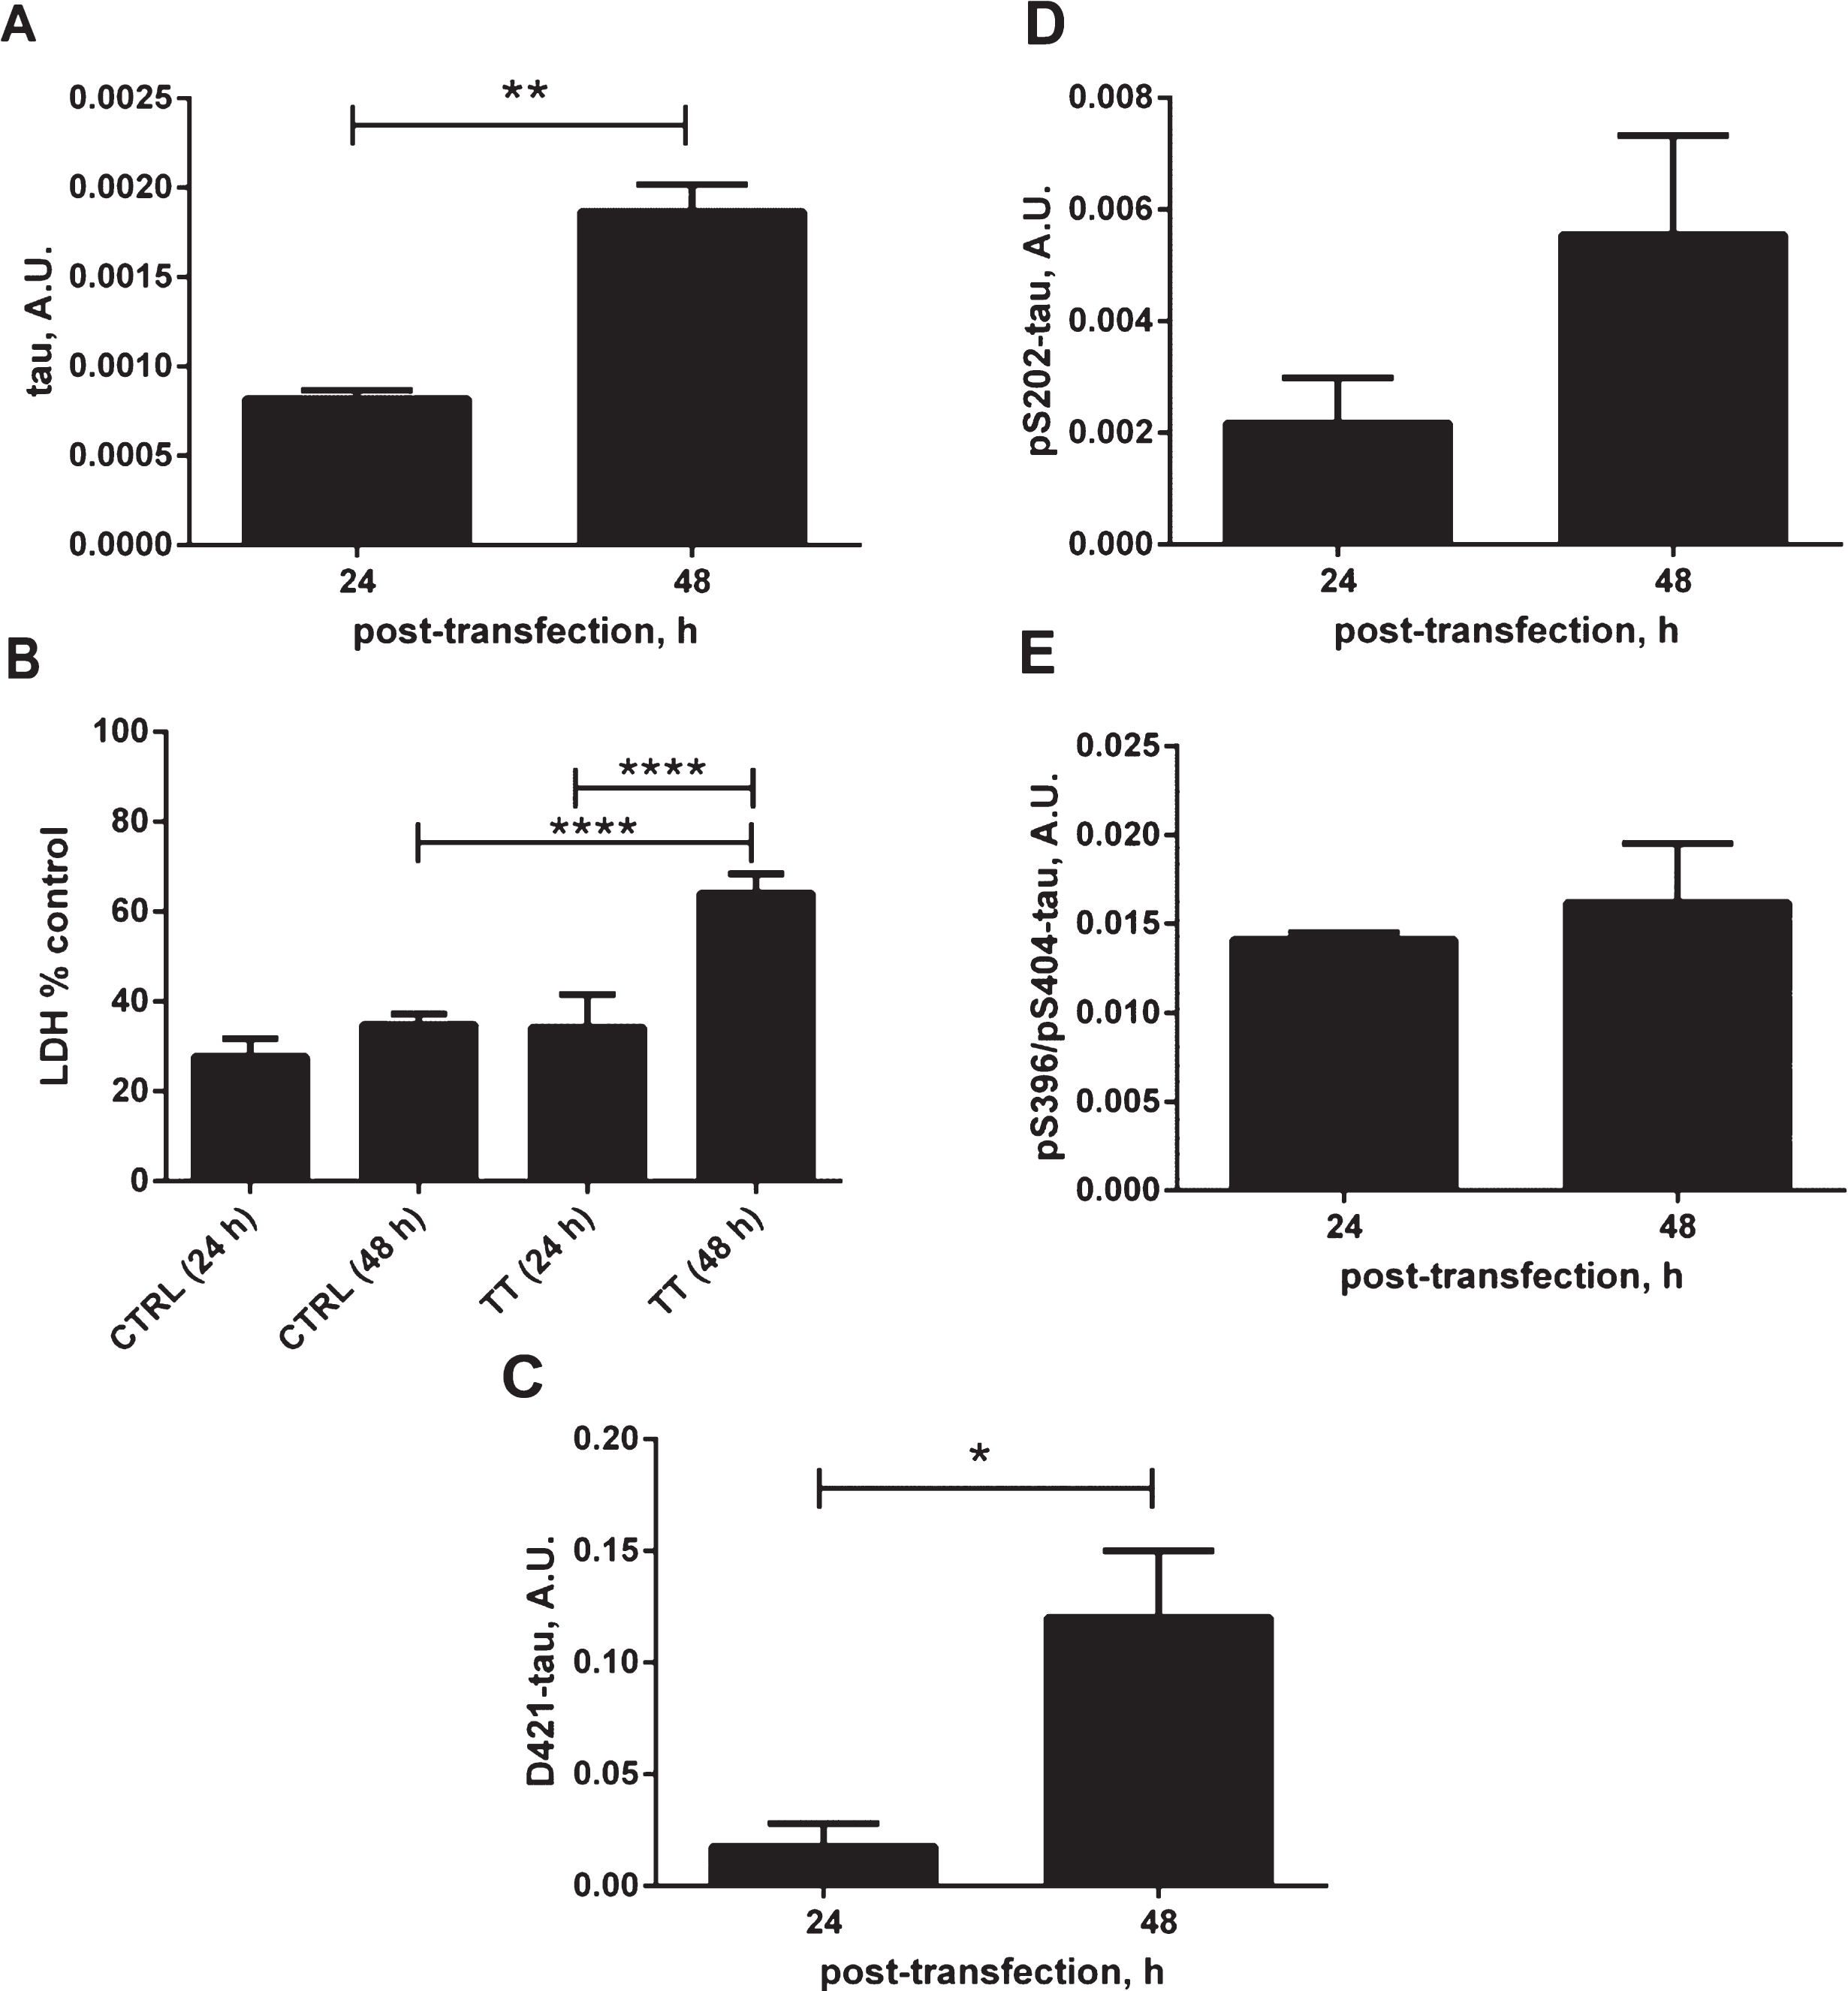
Fig.3
Induction of caspase activation and cleavage of tau at D421 by treatment of N2a cells with staurosporine. A) N2a cells transiently transfected with 2N4R tau cDNA and treated with 0.0625-1μM staurosporine. Caspase activation was detected using a fluorochrome-conjugated pan-caspase inhibitor (SR-VAD-FMK) in a GUAVA PCA96 flow cytometer. Membrane structural integrity was detected by the cell impermeable dye 7-AAD. Cells with low, moderate or high levels of caspase activation are depicted as filled circles, filled squares and filled triangles respectively. Dead cells with no active caspases present and permeable membranes are depicted as open circles. Each point is the mean value of three independent experiments. B) Induction of caspase-3 and caspase-6 was confirmed in two independent experiments in fluorescence activated cell sorting (FACS). N2a cells transiently transfected with 2N4R tau with or without staurosporine treatment and immunolabeled with active caspase-3 or active caspase-6 antibodies in a total population of 100,000 cells for each group. C) Amounts of D421-caspase cleaved tau corrected to total tau levels measured by ELISA in N2a cells transiently transfected with 2N4R tau cDNA and treated with 0.0625–1μM staurosporine. Linear regression with variable slope analyses was used to calculate relative amounts of total tau from standard curves based on purified PHFs. Relative amounts of D421-caspase cleaved tau were calculated from standard curves derived from N2a cell lysates transiently expressing 2N4R tau and treated with staurosporine. Mean values of six individual datasets from three independent experiments are presented. (D) Fluorescence micrographs of N2a cells transiently transfected with 2N4R tau with or without treatment with 0.158μM staurosporine and immunostained for D421 caspase-cleaved tau.
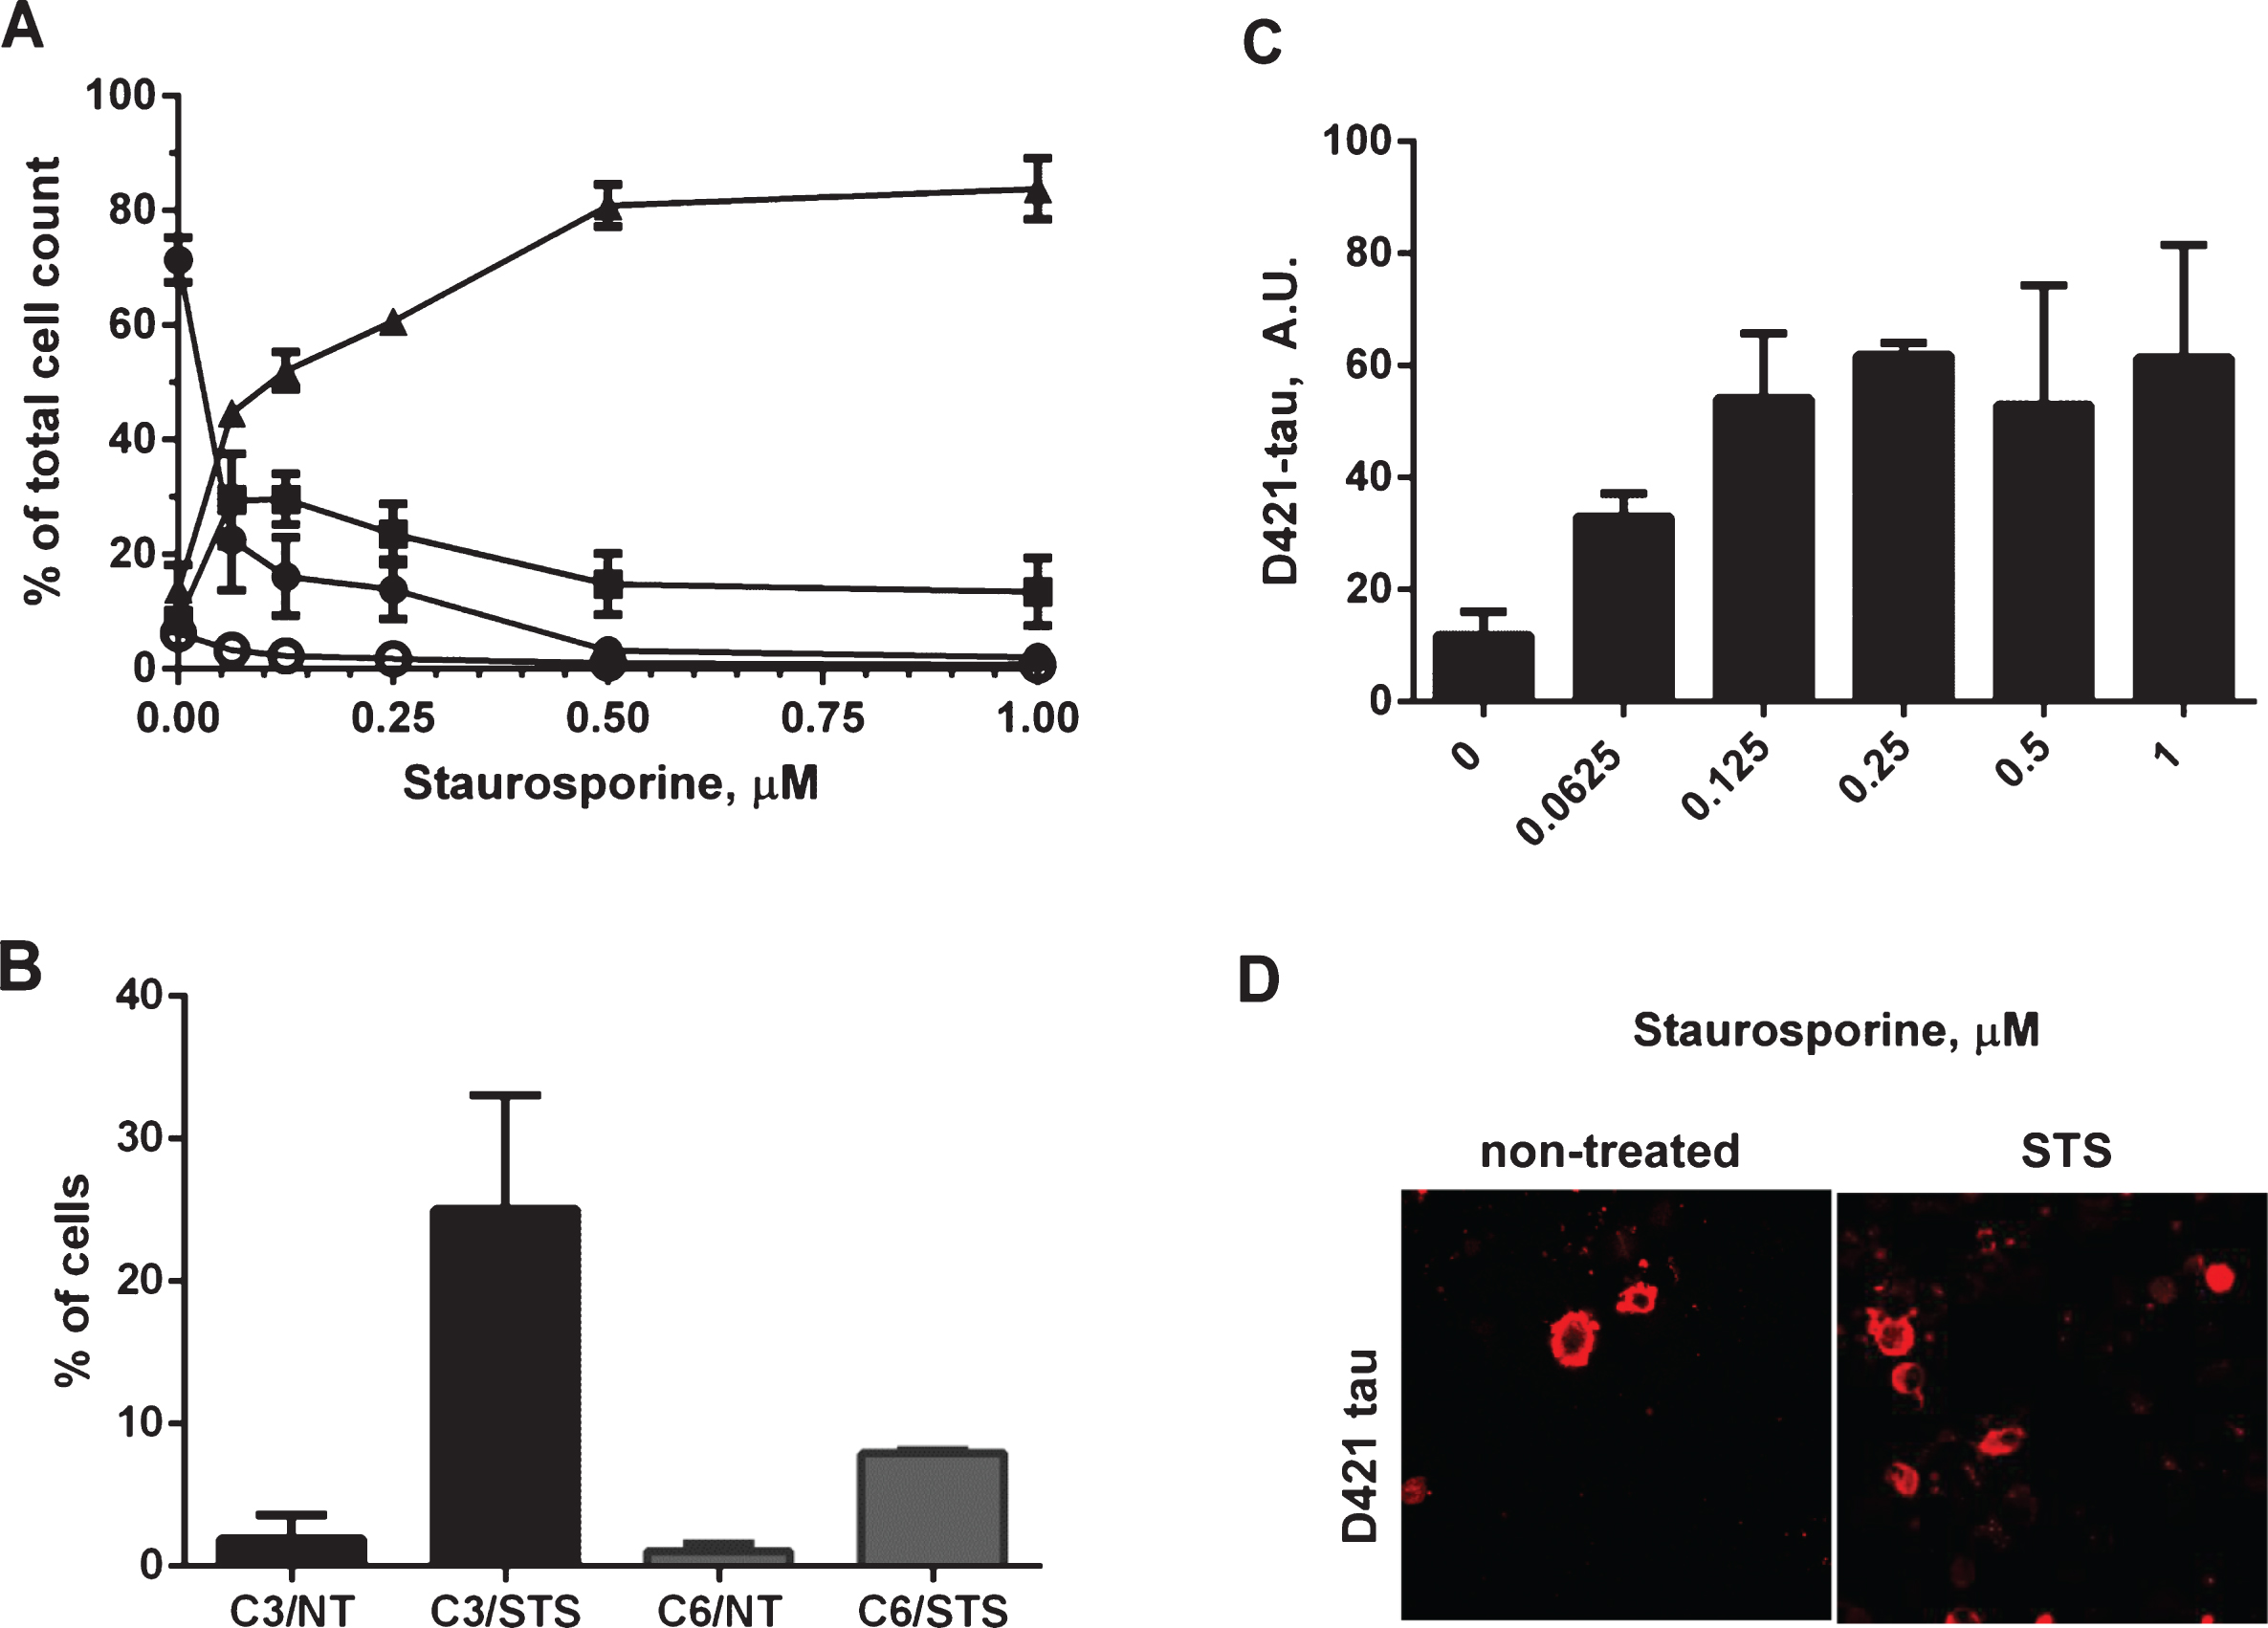
Fig.4
Dose-dependent increase in levels of conformationally-changed tau after treatment with staurosporine. Levels of total tau and conformationally-changed tau were measured in cell lysates of N2a cells transiently transfected with 2N4R tau cDNA and treated with 0.0625–1μM staurosporine. Relative amounts of total tau in DA9/CP27 ELISA (A), relative amounts of conformationally-changed tau levels measured by MC1/CP27 ELISA (B), levels of conformationally-changed tau corrected for total tau levels C). Linear regression with variable slope analyses were used to calculate relative amounts of total tau and conformationally-changed tau from standard curves derived from purified PHFs. Amounts of total tau and conformationally-changed tau are expressed as mean values of six individual data sets relative to non-treated controls set to unity. Statistical analyses for the relative amounts of conformationally-changed tau using one-way ANOVA with Dunnett’s test confirmed significant differences between the values obtained for 0.25 (p < 0.5), 0.5 (p < 0.001), and 1 (p < 0.001) μM staurosporine when compared to untreated controls. A.U., arbitrary units. D) Fluorescence micrographs of N2a cells immunostained for total tau with CP27 antibody, conformationally-changed tau with MC1 antibody, and merged with nuclear stained images.
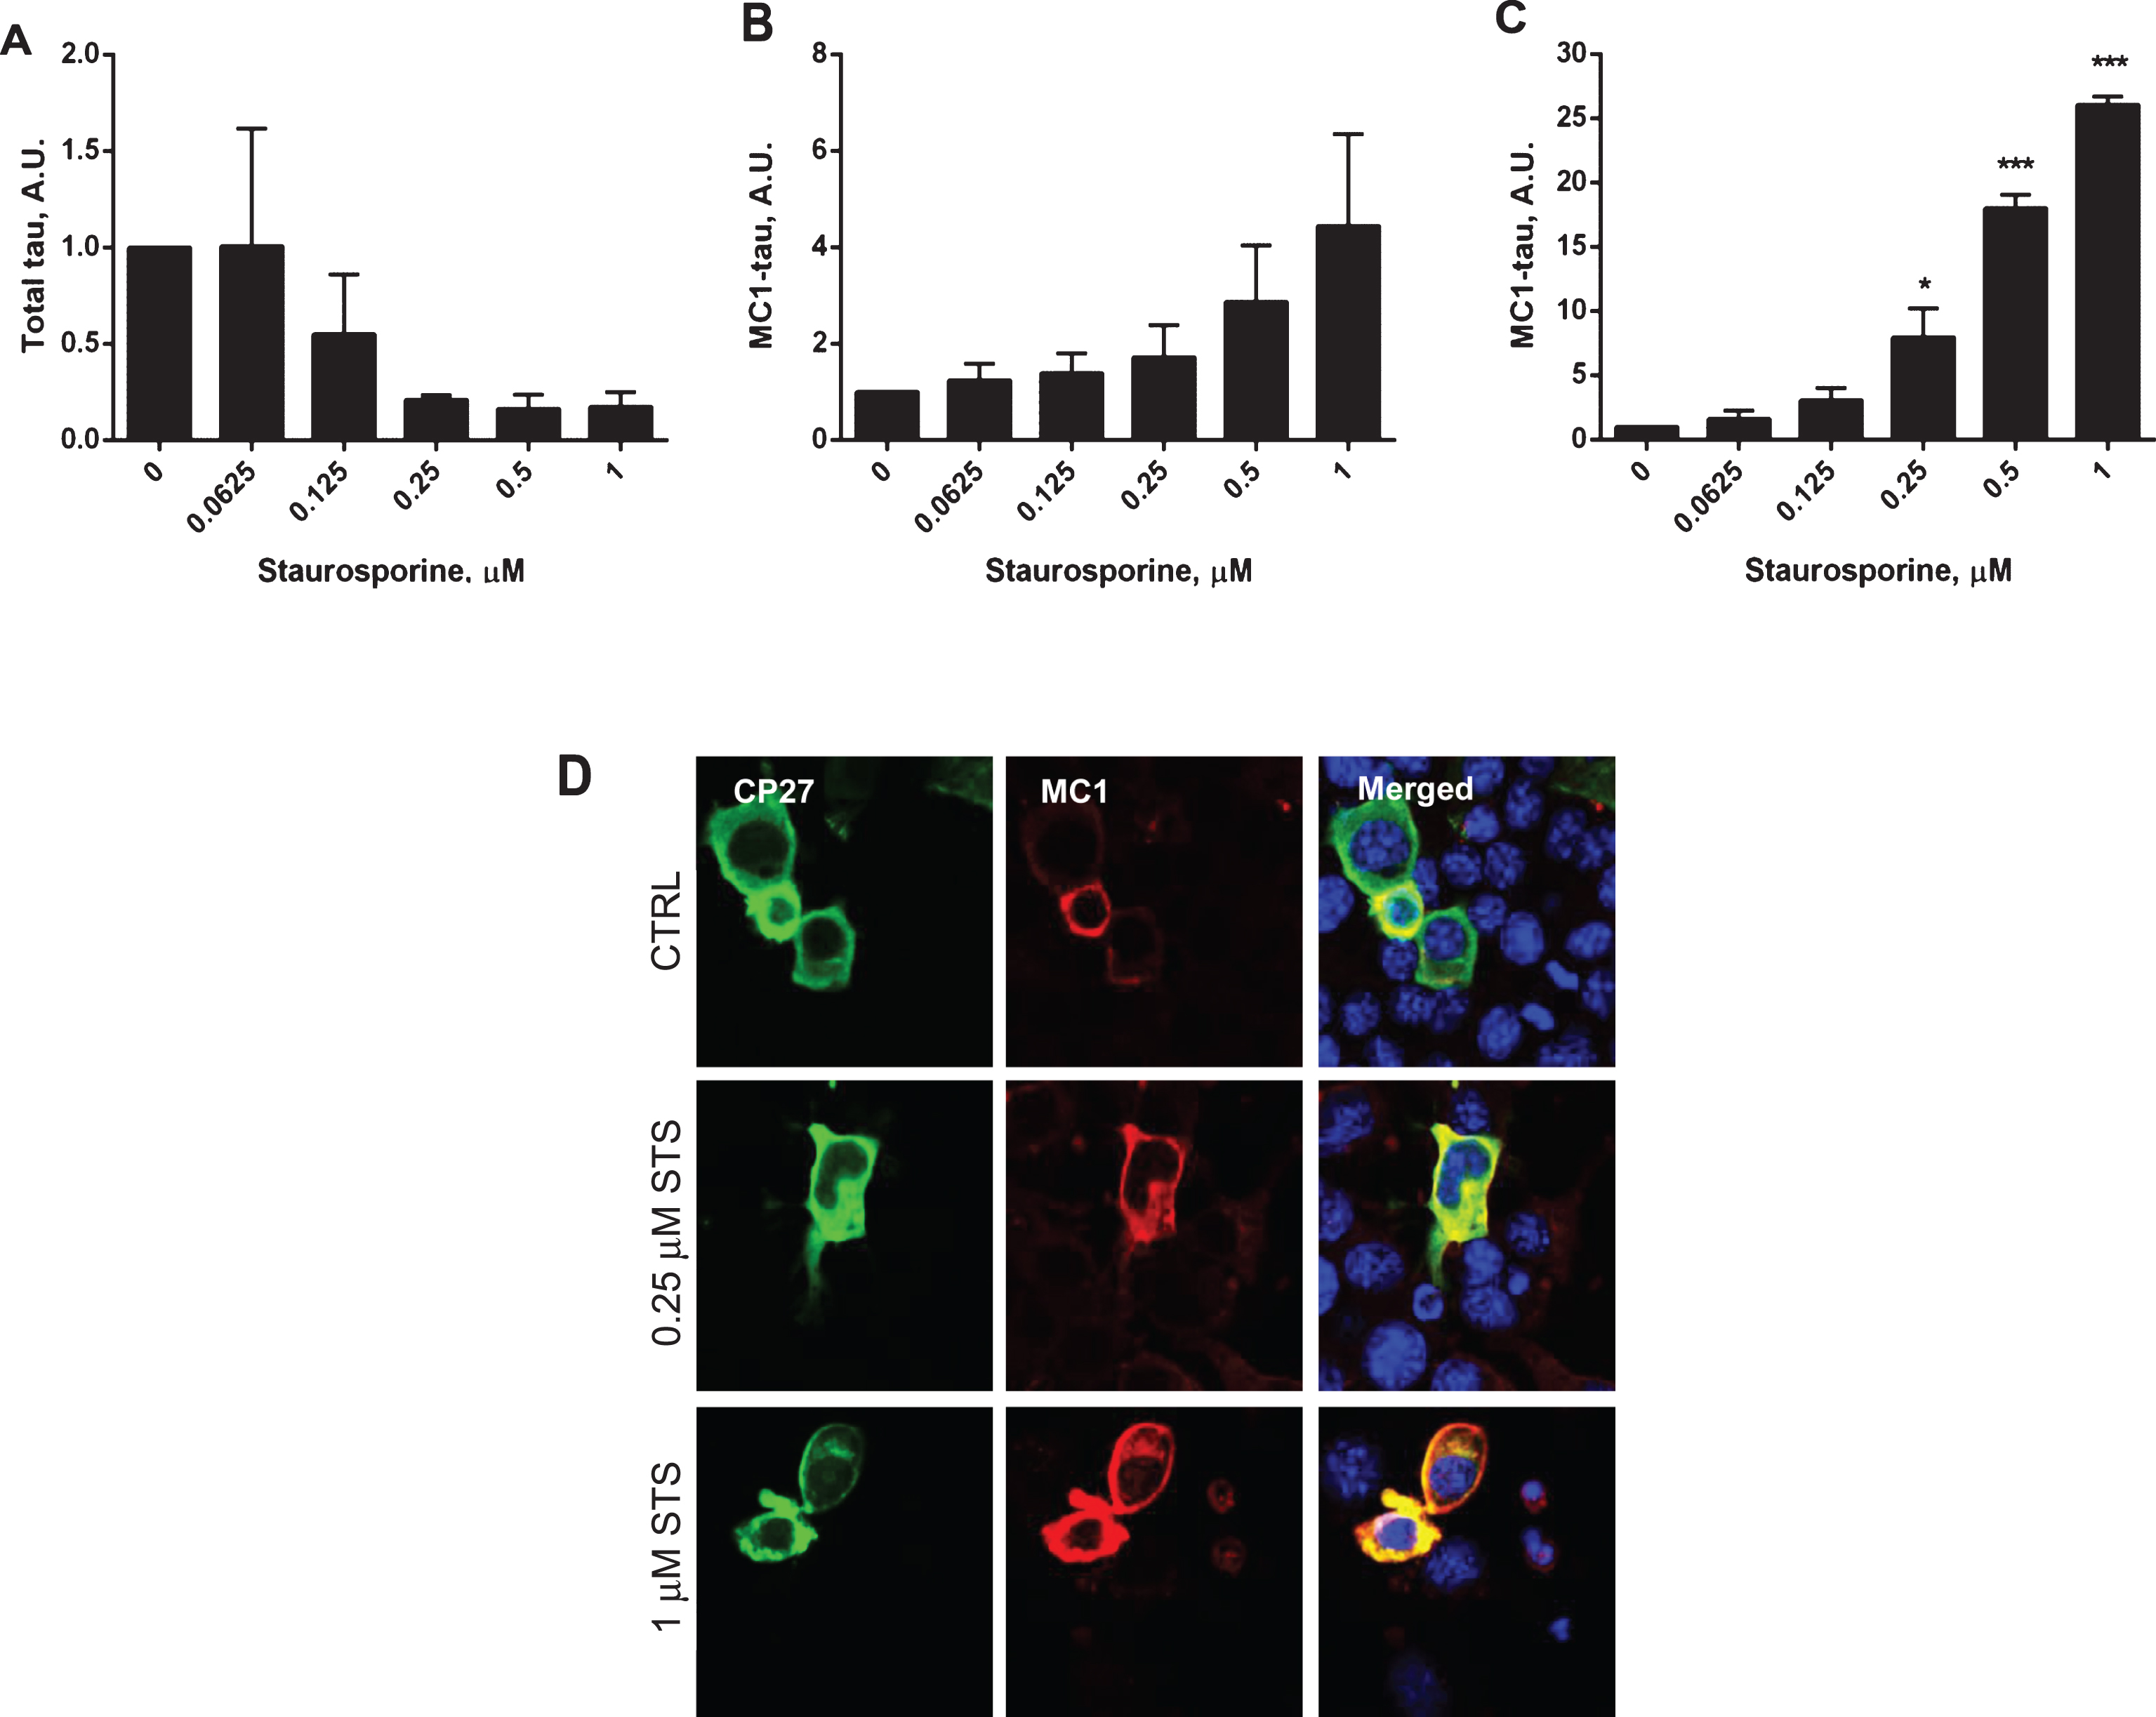
Fig.5
Time-course of caspase activation and induction of conformationally-changed tau after treatment of N2a cells with staurosporine. Caspase activation in N2a cells transiently transfected with the 2N4R tau cDNA alone (A) and treated with 1μM staurosporine (D). Samples were collected at time zero, 6 h, 12 h, and 24 h. Caspase activation was detected using a fluorochrome-conjugated pan-caspase inhibitor (SR-VAD-FMK) in a GUAVA PCA96 flow cytometer. Membrane structural integrity was detected by the cell impermeable dye 7-AAD. Cells with low, moderate, or high levels of caspase activation correspond to filled circles, filled squares, and filled triangles, respectively. Dead cells with no active caspases present and permeable membranes are marked as open circles (A, D). Relative amounts of total tau in DA9/CP27 ELISA in control lysates (B) and after treatment with 1μM staurosporine (E). Relative amounts of conformationally-changed tau levels measured by MC1/CP27 ELISA in control lysates (C) and after treatment with 1μM staurosporine (F). Linear regression with variable slope analyses was used to calculate relative amounts of total tau and conformationally-changed tau from standard curves obtained from purified PHFs. Each point represents the mean value of six independent samples. A.U., arbitrary units.
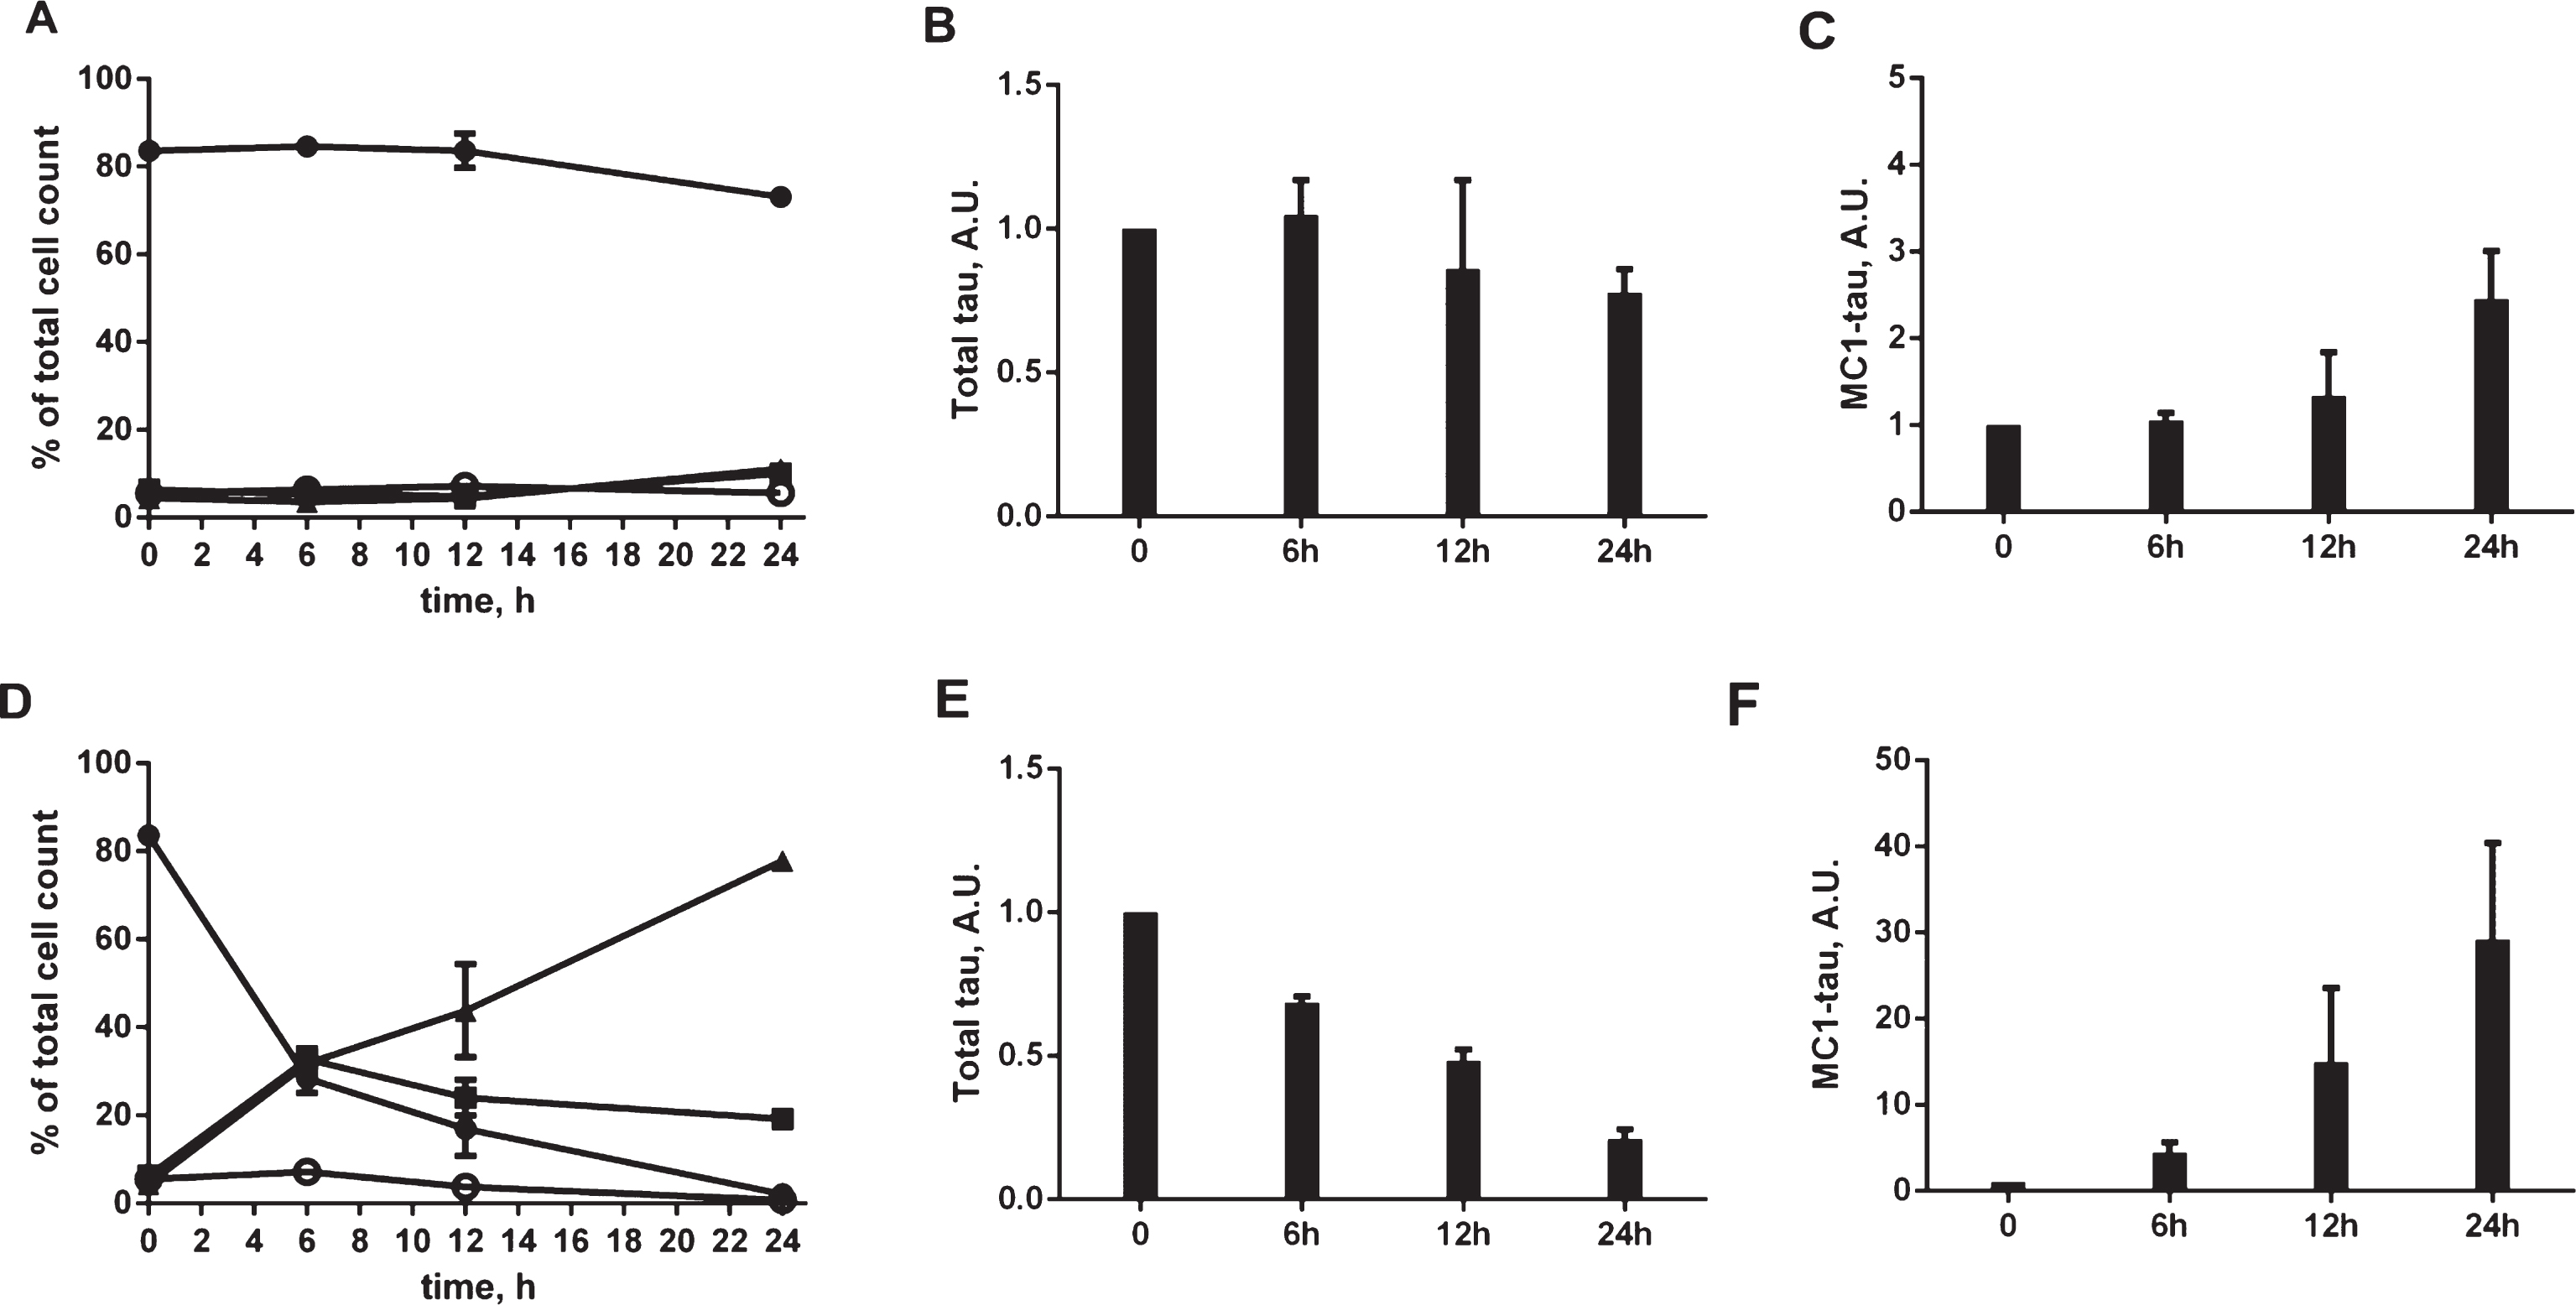
Fig.6
Fractionation of tau in N2a cell lysates after treatment with staurosporine. A) Lysates from N2a cells transiently transfected with 2N4R tau cDNA and treated with 0.03125-1μM staurosporine subjected to low speed centrifugation (2600× g) followed by a high speed centrifugation (100,000× g) in the presence of Nonidet P40, as described in Materials and Methods. The low speed (LS), soluble (S1), and pelleted (P1) fractions after the high speed centrifugation step were resolved by SDS-PAGE. Total tau was detected by western blot with DA9 antibody. B) Absorbance signals in DA9/CP27 and MC1/CP27 ELISA formats for total tau and aggregated MC1-tau, respectively, for low-speed (LS), soluble (S1), and pelleted (P1) fractions of N2a cell lysates after treatment with 0.5μM staurosporine. C) Fluorescence micrographs of N2a cells transfected with 2N4R tau cDNA, treated with 0.25–0.5μM staurosporine and immunostained for total tau with CP27 antibody, aggresome detection reagent and merged with nuclear stained images. Accumulation of tau in aggresomes indicated by arrows.
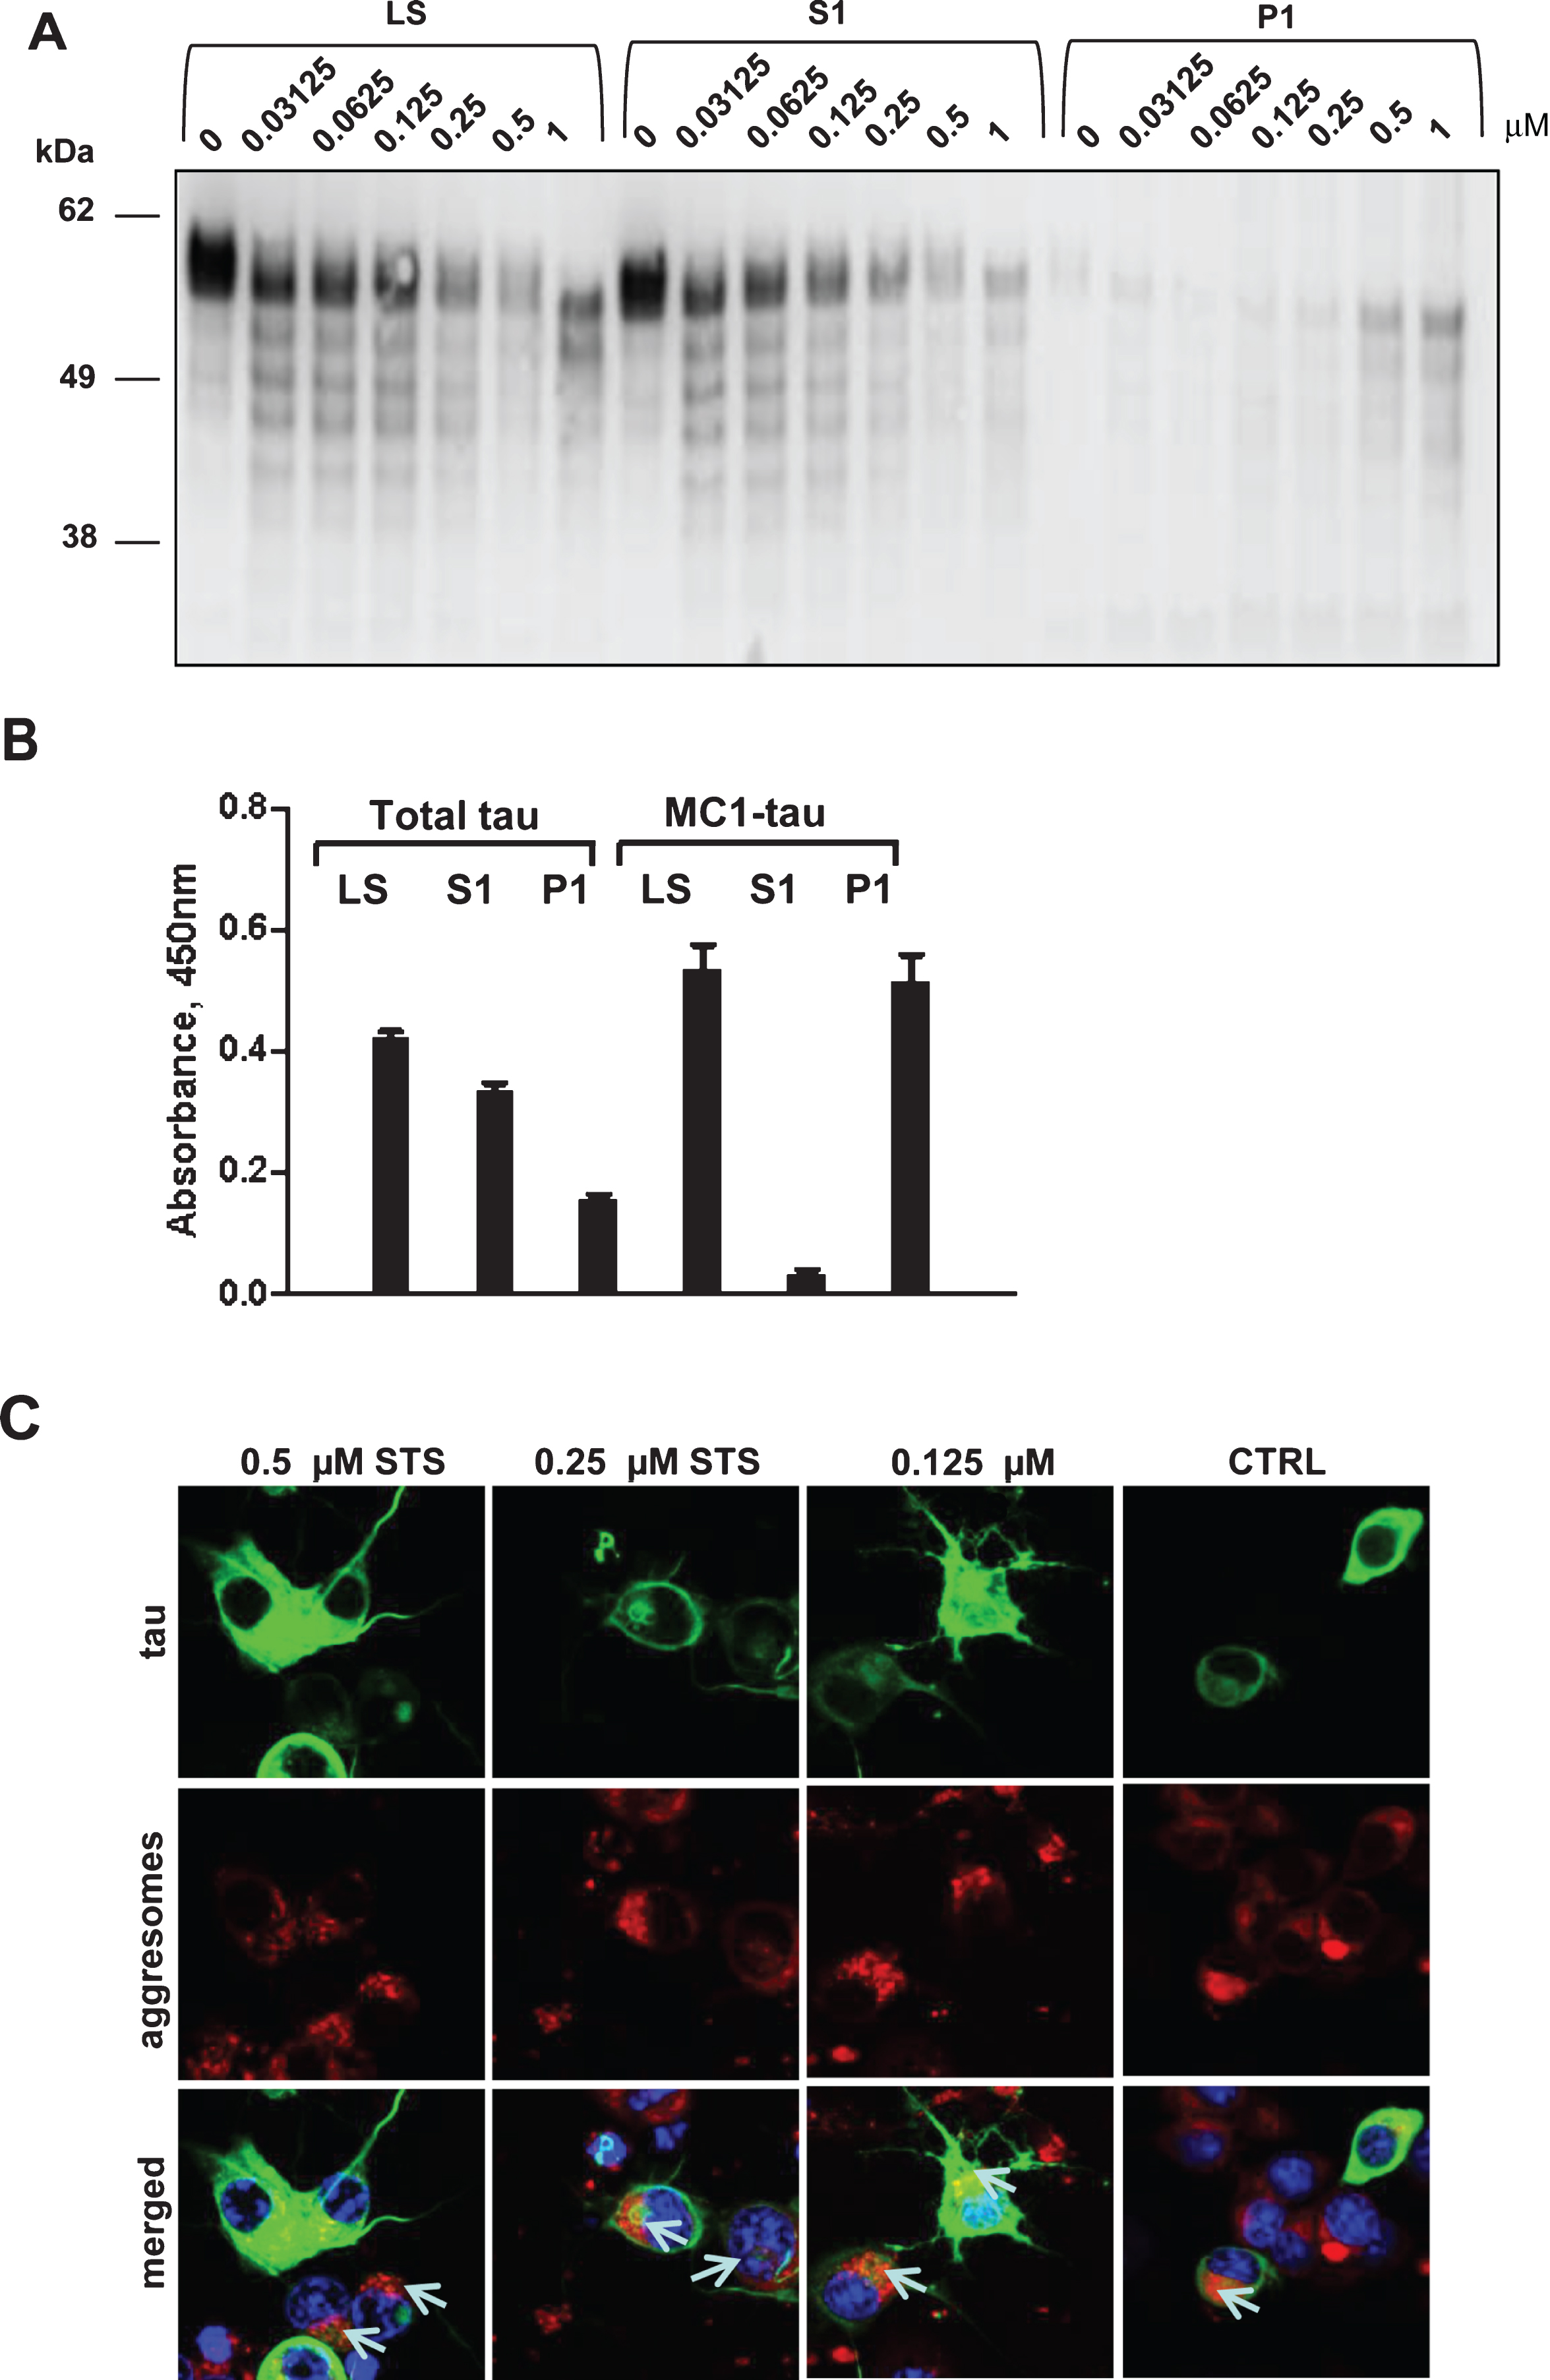
Fig.7
Timing of proteolytic processing of tau and its aggregation, and the effect of caspase inhibitors on tau integrity and D421-cleavage. A, B) Combined time-course and staurosporine dose-response in N2a cells transiently expressing 2N4R tau. The cells were treated with 0-1μM staurosporine for 6, 12, or 24 h marked in black, grey, and white, respectively. Relative levels of D421-tau (A) and MC1-tau (B) corrected to total tau were measured in ELISA assays. C) N2a cells transiently expressing 2N4R tau were treated with staurosporine (0.125, 0.25, and 0.5μM) or staurosporine and pan-caspase inhibitor Z-VAD(Ome)-FMK (50μM) for either 6 or 24 h. Controls with no treatment are shown as NT. Cell lysates were resolved in SDS-PAGE and tau protein was detected by western blot with DA9 antibody. Data represent three independent experiments. Results of AlphaScreen assays for total tau (D) and D421-caspase cleaved tau corrected to total tau levels (E) in N2a cells transiently transfected with 2N4R tau and treated with 0.158μM and 0.5μM staurosporine (STS) or staurosporine and 50μM of pan-caspase inhibitor (ApoBlock) for 24 h. Untreated controls are shown as NT. Linear regression with variable slope analyses were used to calculate relative amounts of total tau and D421-caspase cleaved tau for A, B, D, and E from standard curves based on N2a cell lysates transiently expressing 2N4R tau and treated with STS. Relative amounts of D421-caspase cleaved tau were corrected to total tau. Amounts of total tau and D421-cleaved tau are expressed as mean values for five individual data sets relative to untreated controls set to unity. Statistical analyses for the relative amounts of total tau and Asp421-tau using one-way ANOVA with multiple comparisons. A.U., arbitrary units.
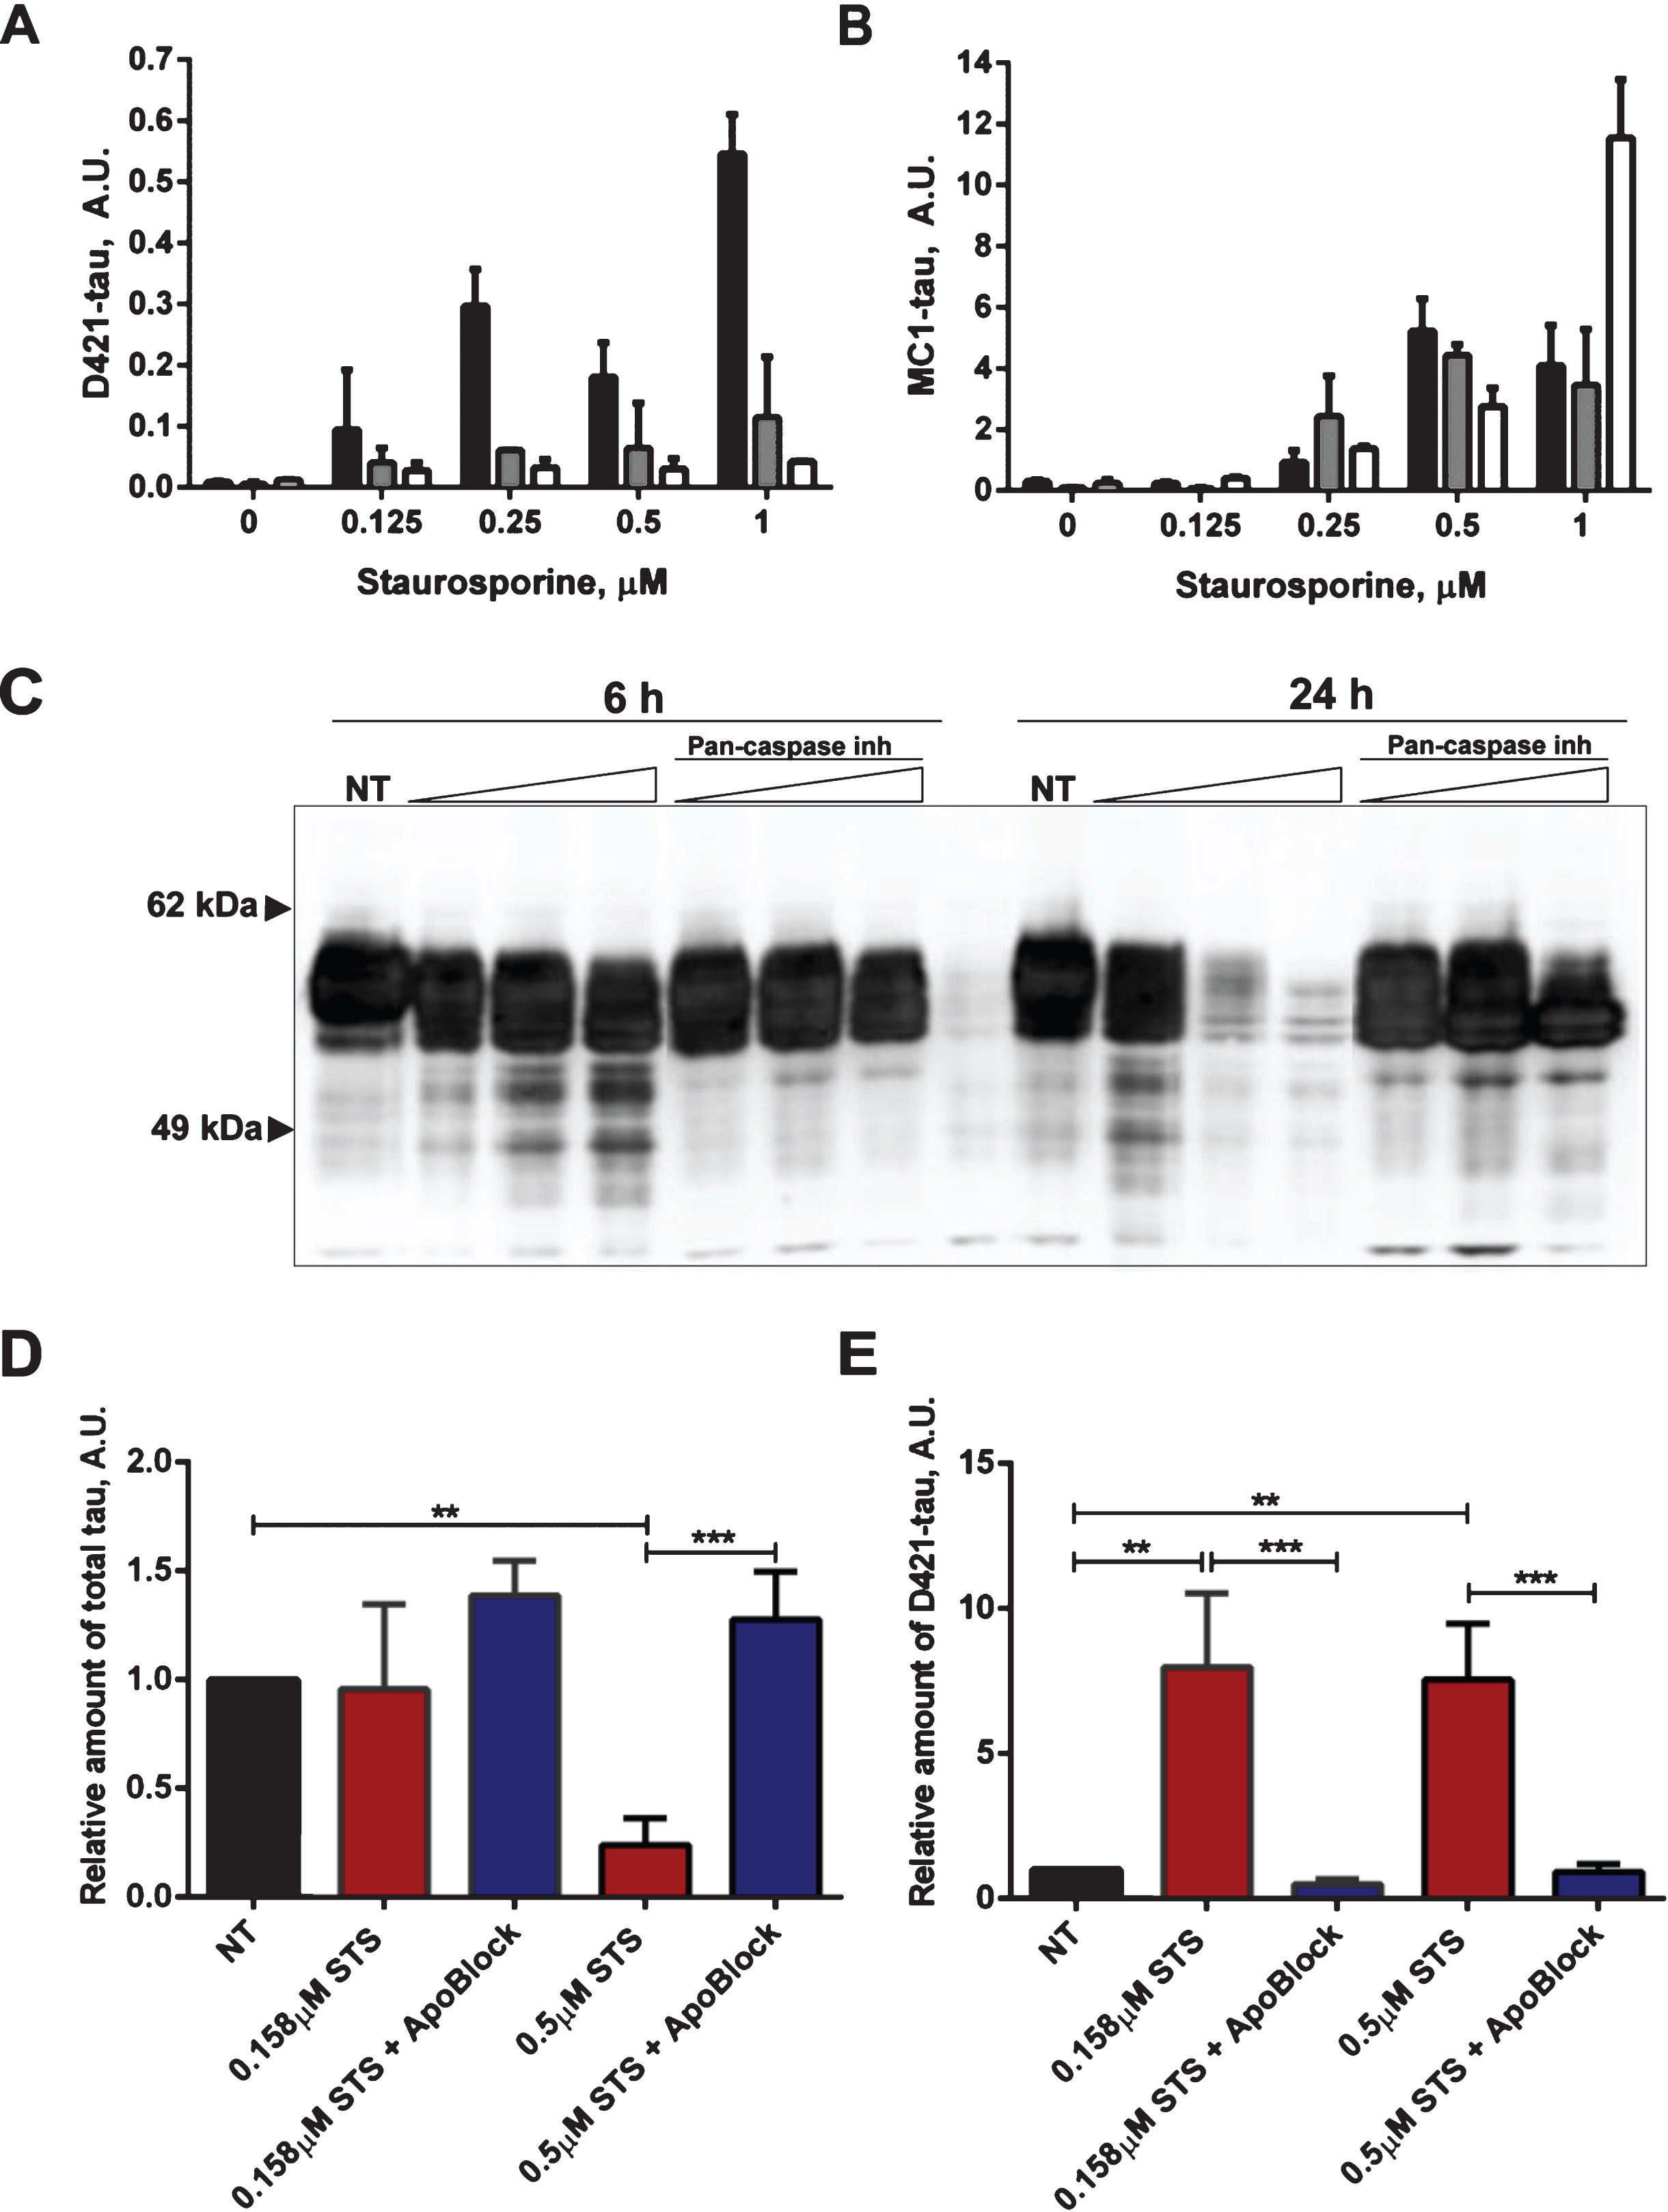
Fig.8
Protective effect of pan-caspase inhibitor on aggregation of tau. N2a cells were transiently transfected with 2N4R tau and treated with 0.5μM staurosporine (STS) or staurosporine and 50μM pan-caspase inhibitor (ApoBlock) for 24 h. Untreated controls are shown as NT. Cell lysates were analyzed in ELISA for total tau (A) and conformationally-changed MC1-tau (B). Linear regression with variable slope analyses were used to calculate relative amounts of total tau and conformationally-changed tau from standard curves based on purified PHFs. Relative amounts of conformationally-changed were corrected for total tau. Amounts of total tau and conformationally-changed tau are expressed as mean values of six individual datasets relative to untreated controls set to unity. Statistical analyses for the relative amounts of total tau and D421-tau using one-way ANOVA with multiple comparisons. A.U. arbitrary units.