
Development of a Late-Life Dementia Prediction Index with Supervised Machine Learning in the Population-Based CAIDE Study
Abstract
Background and objective: This study aimed to develop a late-life dementia prediction model using a novel validated supervised machine learning method, the Disease State Index (DSI), in the Finnish population-based CAIDE study.
Methods: The CAIDE study was based on previous population-based midlife surveys. CAIDE participants were re-examined twice in late-life, and the first late-life re-examination was used as baseline for the present study. The main study population included 709 cognitively normal subjects at first re-examination who returned to the second re-examination up to 10 years later (incident dementia n = 39). An extended population (n = 1009, incident dementia 151) included non-participants/non-survivors (national registers data). DSI was used to develop a dementia index based on first re-examination assessments. Performance in predicting dementia was assessed as area under the ROC curve (AUC).
Results: AUCs for DSI were 0.79 and 0.75 for main and extended populations. Included predictors were cognition, vascular factors, age, subjective memory complaints, and APOE genotype.
Conclusion: The supervised machine learning method performed well in identifying comprehensive profiles for predicting dementia development up to 10 years later. DSI could thus be useful for identifying individuals who are most at risk and may benefit from dementia prevention interventions.
INTRODUCTION
Dementia prevention is a high public health priority. With many reported modifiable risk factors [1],and several ongoing large multimodal prevention trials [2, 3], the interest in dementia prediction models has grown during the past years. Similarly to risk scores for cardiovascular disease [4], dementia risk scores could be used to identify at-risk individuals who would benefit most from preventive interventions. Dementia risk profiling could additionally facilitate the tailoring of preventive interventions to target the most relevant risk factors for a specific individual or group.
Several dementia prediction models have been reported [5, 6]. Model development has been based mainly on a data analytical approach (logistic or Cox proportional hazards regression analyses), and in one case on an Evidence-Based Medicine approach [5, 7]. The increasing number and complexity of factors and biomarkers related to dementia risk, and limitations in visualizing and interpreting individual risk profiles represent major challenges for such methods of developing dementia prediction models.
One of the few validated dementia risk scores [8, 9] has already been used to select at-risk elderly from the general population participating in a successful prevention trial [2], and is available for use with both pen-and-paper and computer-based technology (mobile app, online tool) [10]. The usefulness of computerized dementia prediction tools for prevention-related decision-making is only starting to be explored. As comprehensive online prevention research resources and e-Health solutions are starting to be developed for both health care professionals and general public (e.g., Brain Health Registry, multinational data discovery and sharing platforms, internet-based prevention trials [11], clinical decision support systems integratable with electronic health records [12]), it is increasingly important to find suitable methods for developing, updating, and easily visualizing and interpreting complex dementia risk profiles.
The Disease State Index (DSI) is a supervised machine learning method designed for practical implementation as a clinical decision support system [12]. DSI has been extensively tested and shown to perform well in the context of improving early diagnosis of Alzheimer’s disease and differential diagnosis of neurodegenerative diseases [12–20]. However, the use of DSI in a public health/dementia prevention context has so far not been investigated, i.e., predicting dementia in a general population without cognitive impairment. Compared to previously used methods for developing dementia risk scores [5], the main strengths of DSI are its ability to deal with larger amounts of heterogeneous data, to handle missing data well, and to use unprocessed data (i.e., without any pre-specified cut-offs for clinical or biomarker variables). In addition, DSI is accompanied by the Disease State Fingerprint (DSF), a method for presenting DSI data in an easily and quickly interpretable visual form. The present study aims to develop a late-life dementia prediction model using DSI in the longitudinal population-based CAIDE study.
MATERIALS AND METHODS
The CAIDE study
The CAIDE study has been previously described in detail [21–23]. In brief, participants were first evaluated at midlife (1972, 1977, 1982, or 1987) in cardiovascular surveys. A random sample of 2,000 individuals aged 65–79 at the end of 1997, and living in or close to Kuopio and Joensuu regions in Eastern Finland were invited for a first late-life re-examination in 1998 (Fig. 1). Altogether 1,449 (72.5%) individuals participated. A second late-life re-examination was conducted in 2005–2008. Of the initial 2,000 persons, 1,426 were still alive and living in the region in the beginning of 2005, and 909 (63.7%) participated. Mean age (SD) was 50.6 (6.0) years at midlife, 71.3 (4.0) years at the first re-examination, and 78.6 (3.7) years at the second re-examination. The CAIDE study was approved by the local ethics committee of Kuopio University Hospital and written informed consent was obtained from all participants.
In both late-life re-examinations, cognition was assessed using a three-step protocol (screening, clinical, and differential diagnostic phases). In 1998, participants with≤24 points on the Mini-Mental State Examination (MMSE) [24] at screening were referred for further evaluations. In 2005–2008, subjects with≤24 points or decline≥3 points on MMSE, <70% delayed recall in the CERAD word list [25], or with informant concerns about the participant’s cognition were referred for further evaluations. In both re-examinations, the clinical phase included detailed medical and neuropsychological assessments, and the differential diagnostic phase included brain imaging (MRI/CT), blood tests, and if needed cerebrospinal fluid analysis.
A review board including the study physician, neuropsychologist, a senior neuropsychologist, and a senior neurologist ascertained the primary diagnosis based on all available information. Dementia and mild cognitive impairment (MCI) diagnoses were made according to established criteria [26–28].
Design of the present study
The present study focused on CAIDE participants without dementia or MCI in 1998 (first late-life re-examination, used here as baseline). The main study population included 709 individuals who also participated in the 2005–2008 re-examination (39 diagnosed with dementia). Mean follow-up (SD) was 8.3 (1.0) years. To account for non-participants/non-survivors in 2005–2008, an extended study population (n = 1,009) was defined using additional data on dementia diagnoses until the end of 2008 from the Hospital Discharge Register, Drug Reimbursement Register and Causes of Death Register [22]. Dementia cases in the extended population (n = 151) were defined according to CAIDE or register diagnoses (CAIDE diagnoses had priority, except when registers indicated dementia diagnoses after the second re-examination and before the end of 2008). Mean follow-up (SD) was 9.0 (1.4) years, and mean time (SD) to dementia diagnosis was 7.1 (1.9) years. Non-participants in 2005–2008 who had died without a recorded dementia diagnosis (n = 244) could not be classified as cases or controls and were excluded. Additionally 13 subjects without cognitive impairment in 1998 who had a dementia diagnosis in any register before the end of 2000 were excluded (they were considered too close to dementia onset).
Factors included in prediction models
Survey methods were carefully standardized and complied with international recommendations [29]. Cognitive performance in 1998 was included in prediction models. Five cognitive domains were assessed as previously described [30]: global cognition (MMSE), episodic memory (mean number of recalled words from three 10-word lists), verbal expression (one-minute animal naming test), psychomotor speed (mean of normalized scores from Letter Digit Substitution and bimanual Purdue Pegboard tests), executive functioning (time difference between the color word interference and naming tasks in the Stroop test), and prospective memory (reminding the investigator to make a phone call at the end of the testing session; score 1–4 from not remembering to remembering without reminders).
Vascular factors (blood pressure (BP), body mass index (BMI), waist-hip ratio, total cholesterol, high-density lipoprotein (HDL) cholesterol, and triglycerides) were assessed at each examination. Assessments from 1998 were included in the basic model. Changes in BP, BMI, and total cholesterol from midlife to the first re-examination in 1998 were included in an additional model. Diagnoses of stroke, transient ischemic attack, myocardial infarction, coronary heart disease, atrial fibrillation, heart failure, or diabetes (Hospital Discharge Register) were combined into a dichotomous comorbidity variable.
Other assessments from 1998 used in the present study included data from a self-administered questionnaire on sociodemographic characteristics, medical history and health-related behavior, e.g., leisure-time physical activity, alcohol use, smoking, self-rated health, and fitness, feelings of hopelessness [31], Beck Depression Inventory [32], and Subjective Memory Questionnaire (SMQ) [33].
Apolipoprotein E (APOE) genotypes were assessed from blood leucocytes using polymerase chain reaction and HhaI digestion [34]. APOE was modeled as a dichotomous variable (ɛ4 allele carrier/non-carrier), and also as an ordered variable (genotype 23 < 24 and 33 < 34 < 44) [35, 36].
Disease state index and disease state fingerprint
DSI has been previously described in detail [12, 13]. In brief, DSI is a validated supervised machine learning method that provides numeric index values ranging from 0 to 1. The DSI value is computed by comparing an individual to a previously known population (training data). The DSI value can be interpreted as the share of data corresponding to a subsequent dementia profile. DSI value 0 corresponds to an ideal control, and 1 to an ideal subsequent dementia case. Higher DSI values thus denote greater profile similarity to individuals known to subsequently develop dementia in the training population.
DSI values are computed in three steps. First, each measurement is compared with the training data using a monotonically increasing fitness function that provides a likelihood of the measured factor belonging to an individual who will develop dementia. The fitness as a function of measurement value x, is defined as
DSI can process heterogeneous data, and the measured factors/biomarkers are structured into groups, e.g., different cognitive tests into a Cognition group or vascular factors into a Vascular group. A composite DSI value is calculated for each group based on the included individual factors. Grouping is thus useful for assessing the combined effect of conceptually related measurements, and it has other effects such as filtering out noise at group level, and ensuring that strongly correlated factors are not added into the model multiple times. Missing data does not affect model building as long as there is enough data for each factor to give a reliable distribution.
The DSF visualization gives a comprehensive overview of an individual’s predictive profile [13], showing which factors are most relevant and to what extent they correspond to a subject who will develop dementia. An example with explanations is shown in the Supplementary Material.
Data analysis
Differences between control and dementia groups were determined with Mann-Whitney U test for continuous or ordinal variables, and χ2 test for other categorical variables. Significance level was set at p < 0.05. Only factors significantly different between control and dementia groups were pre-selected into the DSI model. Additional p-value significance thresholds for selecting factors into the model were also tested to assess effects on predictive performance.
Performance of DSI in predicting dementia was evaluated using a stratified cross-validation procedure. Analysis was performed using 50×5-folds. The performance of DSI was measured as the area under the receiver operating characteristic curve (AUC), by averaging AUCs from individual folds. DSI classification results were validated by comparison with a commonly used machine learning model, support vector machine (SVM), using the same data. Analyses were conducted using Matlab R2014a.
RESULTS
Population characteristics
Population characteristics in 1998 by dementia status until the end of 2008 are shown in Table 1. In the main study population, individuals with subsequent dementia were older, had significantly poorer performance on four of the six cognitive tests, had lower systolic blood pressure (SBP) and diastolic blood pressure (DBP), higher frequency of cardio/cerebrovascular comorbidity and the APOE ɛ4 allele, and more pronounced subjective memory complaints (total SMQ score and four items about forgetting phone numbers, clothing size, names of actors, and forgetting what to say in mid-sentence). SBP, DBP, and BMI decreased more between midlife and 1998 in subjects with subsequent dementia compared with controls.
In the extended study population, individuals with dementia were older, had significantly poorer performance on all six cognitive tests, higher frequency of cardio/cerebrovascular comorbidity and the APOE ɛ4 allele, and more pronounced subjective memory complaints (total SMQ score and one item about forgetting phone numbers). No differences were found in SBP or DBP. Changes in DBP, total cholesterol, and BMI (but not SBP) between midlife and 1998 were different between controls and subsequent dementia cases.
Performance of DSI in predicting dementia
Table 2 shows AUCs (95% CI) for the composite DSI including factor groups Cognition, Vascular factors, Demographics, Subjective memory questionnaire, and APOE genotype (basic model). The composite DSI achieved an AUC of 0.79 (0.79–0.80) in the main study population, and 0.75 (0.74–0.75) in the extended study population. Training the DSI on the entire main or extended population and using it to classify the same cases yielded AUCs of 0.84 and 0.76, respectively.
There was an overall pattern of similar to somewhat lower AUCs for individual factors and factor groups in the extended population compared with the main study population. ROC curves for the composite DSI in both populations are shown in Fig. 2. Accuracy, sensitivity and specificity for different composite DSI cut-off values are shown in Table 3.
Results were validated by comparison with a SVM classification, trained with a linear kernel using the same set of factors and cross-validation procedure. We used the MATLAB fitcsvm function with parameter values that empirically gave the best results (kernel scale 103 and box constraint 10- 3 for both models). Population mean values were used for missing values, and factors were entered into the model as individual standardized values. The SVM achieved an AUC of 0.77 (0.76–0.78) for the main study population, and 0.74 (0.73–0.74) for the extended population, a slightly lower performance compared with DSI.
AUC (95% CI) for the composite DSI including the basic model plus changes in vascular factors from midlife to late-life are shown in Table 2. There was a slight increase in AUCs for composite DSI compared with the basic model. AUCs for changes in vascular factors considered together were slightly higher than AUCs for the group of late-life vascular factors, and this difference was most pronounced in the extended study population. Change in BMI had the highest AUC (0.68) for both main and extended study populations.
Sensitivity analyses
Table 4 shows the effects of p-value threshold filtering on the number of factors included in the prediction model, and on AUCs (95% CI) for the composite DSI. Analyses focused on p-values from Mann-Whitney U-tests comparing controls and subsequent dementia cases, and on factors showing significant differences at various p-value thresholds. Results suggest that the model is not improved after adding variables with p > 0.01.
Additional analyses were conducted to account for previously described J- or U-shaped associations between BMI, BP, cholesterol, and dementia [1] (the current DSI version includes a monotonically increasing fitness function). Dichotomous variables were created for values higher or lower than chosen cut-offs for BMI, BP, and total cholesterol, and the variables were added to the models to investigate the significance of the distribution tails. Several cut-offs were tested, but the combined predictive performance of these variables was low and did not affect the overall performance of the model (results not shown).
DISCUSSION
The late-life DSI dementia index developed using a supervised machine learning method performed well in predicting dementia up to 10 years later in an older general population without MCI or dementia at baseline. Performance was in the upper range of reported performance for previous dementia risk scores [5], and close to the performance level of established risk scores for cardiovascular conditions [4, 37, 38]. The late-life DSI dementia index and midlife CAIDE Dementia Risk Score, both developed within the CAIDE study but with very different methods, had similar predictive power [8, 9].
As emphasized by a recent multidomain vascular care trial to prevent dementia [39], preventive interventions may not be effective in unselected older populations. A risk-based selection could facilitate targeting preventive interventions to individuals who are most likely to benefit. The midlife CAIDE Dementia Risk Score has been used for this purpose in another population-based multidomain lifestyle trial that showed significant beneficial intervention effects on cognitive performance [2]. However, the selection required data pre-processing according to pre-set cut-offs, and additional cognitive testing referenced to population norms (separate from the dementia risk score). The late-life DSI dementia index could facilitate faster and more detailed risk assessment, with easier to interpret individual risk profiles, thus enabling risk-based selection of target populations, and also potential tailoring of preventive interventions based on the most relevant risk factors. Such advantages derive from the ability of DSI to quickly handle large amounts of heterogeneous data in raw form (i.e., as collected from subjects), and the provision of DSI data to human readers in an easily interpretable visual form. While many available classifiers process data as a ‘black box’ requiring machine learning expertise to scrutinize, DSF clearly discloses the factors contributing to the results, and supports clinical judgment by highlighting what is most relevant. Such characteristics are particularly important for dementia risk assessment tools in the context of recent database developments such as large population-based online Brain Health Registries, multinational data discovery and sharing platforms, or internet-based prevention trials [11].
Factors included in the DSI index
A large number of heterogeneous factors were tested in the present study, and DSI performed well in identifying the main types of late-life risk factors related to subsequent dementia: objective and subjective measures of cognition, age, vascular factors, and APOE genotype, in overall agreement with previous studies using other statistical methods [5]. Detailed, factor-specific comparisons with available dementia risk scores are difficult because these have often pre-processed raw data according to different cut-offs, and/or combined variables in different ways, leading to variability in individual factors and their weights. However, some general patterns can be observed.
Long-term (i.e., decades) dementia prediction models tend to differ from shorter-term (i.e.,<10 years) prediction models, and they also tend to perform poorly when applied outside the age groups they were designed for [5, 6]. The relatively long pre-clinical stage of dementia-related diseases (e.g., Alzheimer’s disease or cerebrovascular disease) is a major challenge for dementia risk scores, particularly at older ages [5, 6]. The links between risk factors and dementia development can be bidirectional, i.e., a factor may increase dementia risk, but it may also be influenced by ongoing disease processes once the dementia-related disease starts [1]. While the mechanisms are not yet fully clear, a pattern of more pronounced decline in, for example, BP, BMI, and total cholesterol from midlife to late-life has been consistently described in people who subsequently develop dementia [1]. Whereas traditional vascular risk factors (e.g., high BP, BMI, and/or total cholesterol) are important for midlife dementia risk scores, their predictive value decreases in late-life risk scores (some of which may even include low BP and/or low BMI as predictors) [1, 5]. AUCs for the vascular factors group in the DSI dementia index are in agreement with this pattern. Interestingly, group AUCs for changes in vascular factors prior to baseline were slightly higher that group AUCs for vascular factors at baseline in the DSI model. Declining BMI from midlife to late-life was the most important predictor in the vascular changes group, while BMI in late-life was not predictive of subsequent dementia. The predictive value of one-time late-life measurements versus midlife-to-latelife changes has so far not been investigated in late-life dementia risk scores.
However, overall performance of the DSI dementia index was not greatly affected by leaving out changes in vascular factors. The most important predictor was cognitive performance, which is perhaps not surprising for late-life dementia risk scores [5]. Cognitive performance was also more predictive of subsequent dementia than age. As our study focused on individuals aged 65–79 years, it remains to be determined whether this finding applies to other age groups or populations. APOE genotype had the lowest AUCs compared to the other groups of factors included in the DSI models. While in some previous dementia prediction models APOE genotype appeared to be somewhat informative, other models have excluded it as not informative enough [5].
Strengths, limitations, and future directions
The main strengths of the present study are the population-based design, long follow-up time, and detailed late-life cognitive assessments at two time points, thus increasing diagnostic accuracy. Mortality and non-participation were at least partly taken into account by including both the main population (survivors/participants) and extended population (additional register dementia diagnoses for non-survivors/non-participants) in analyses. Results for both populations were relatively similar, although in the extended population AUCs tended to be somewhat lower, and some factors were excluded from the models. Individuals who do not participate in studies or die during follow-up usually have poorer health, and are more likely to either develop dementia or die at younger ages, before dementia onset. Although dementia diagnoses in Finnish national registers were accurate (positive predictive values above 90%), their combined sensitivity was around 70% [22], thus underestimating the actual number of cases. Also, individuals who died without recorded dementia diagnoses had to be excluded from analyses.
The comorbidity variable used in DSI models was based on Hospital Discharge Register diagnoses, thus including only cardio/cerebrovascular conditions severe enough to require hospitalization (data on pharmacological treatment and conditions diagnosed in outpatient clinics were not available). Also, brain MRI measurements were not included in the present study due to insufficient sample size. A previous late-life risk index including MRI measurements had somewhat better predictive performance (AUC 0.81) [40], but the shorter version without MRI had similar predictive performance to DSI (AUC0.77) [41].
The present study tested many heterogeneous factors, and results from p-value thresholds filtering analyses indicated that the DSI dementia index benefited from selection of factors. DSI was originally built with the assumption that all included factors are already established as likely classifiers, and their effectiveness is ranked by relevance. If several factors with unclear predictive value for dementia are included, the need for factor selection arises. A large amount of poor classifiers with little relevance can overpower the factors with higher relevance and skew the final results. Also, if the training groups are too small, a non-significant difference between controls and cases can lead to a higher relevance by chance.
The late-life DSI dementia prediction model was designed for shorter-term dementia prediction (up to 10 years). External validation is needed to verify its predictive performance. Long-term predictive performance will also need to be tested. In addition, analyses of changes in overall risk level over time are essential for determining whether the DSI dementia index can be used for longitudinal risk monitoring and assessing response to preventive interventions.
Conclusion
DSI performed well in identifying comprehensive profiles for predicting dementia development up to 10 years later. The DSI dementia index could thus be useful for identifying individuals who are most at risk and may benefit from dementia prevention interventions. The detailed and visually easy to interpret individual risk profiles may also facilitate tailoring of preventive interventions based on the most relevant risk factors.
ACKNOWLEDGMENTS
This study was funded by the European Union 7th Framework Program for research, technological development and demonstration VPH-DARE@IT (Grant Agreement No: 601055); MIND-AD Academy of Finland 291803 and Swedish Research Council 529-2014-7503 (EU Joint Programme - Neurodegenerative Disease Research, JPND); strategic funding for UEF-BRAIN from University of Eastern Finland; Academy of Finland grants 287490 and 294061; Center for Innovative Medicine (CIMED), Sweden; Alzheimerfonden Sweden; AXA Research Fund.
The funding sources had no involvement in study design; in the collection, analysis and interpretation of data; in the writing of the report; and in the decision to submit the article for publication.
Authors’ disclosures available online (http://j-alz.com/manuscript-disclosures/16-0560r1).
Appendices
The supplementary material is available in the electronic version of this article: http://dx.doi.org/10.3233/JAD-160560.
REFERENCES
[1] | Solomon A , Mangialasche F , Richard E , Andrieu S , Bennett DA , Breteler M , Fratiglioni L , Hooshmand B , Khachaturian AS , Schneider LS , Skoog I , Kivipelto M ((2014) ) Advances in the prevention of Alzheimer’s disease and dementia. J Intern Med 275: , 229–250. |
[2] | Ngandu T , Lehtisalo J , Solomon A , Levälahti E , Ahtiluoto S , Antikainen R , Bäckman L , Hänninen T , Jula A , Laatikainen T , Lindström J , Mangialasche F , Paajanen T , Pajala S , Peltonen M , Rauramaa R , Stigsdotter-Neely A , Strandberg T , Tuomilehto J , Soininen H , Kivipelto M ((2015) ) A 2 year multidomain intervention of diet, exercise, cognitive training, and vascular risk monitoring versus control to prevent cognitive decline in at-risk elderly people (FINGER): A randomized controlled trial. Lancet 385: , 2255–2263. |
[3] | European Dementia Prevention Initiative, http://www.edpi.org, Accessed on September 19, 2016. |
[4] | Lloyd-Jones DM ((2010) ) Cardiovascular risk prediction: Basic concepts, current status, and future directions. Circulation 121: , 1768–1777. |
[5] | Tang EY , Harrison SL , Errington L , Gordon MF , Visser PJ , Novak G , Dufouil C , Brayne C , Robinson L , Launer LJ , Stephan BC ((2015) ) Current developments in dementia risk prediction modelling: An updated systematic review. PLoS One 10: , e0136181. |
[6] | Solomon A , Soininen H ((2015) ) Dementia: Risk prediction models in dementia prevention. Nat Rev Neurol 11: , 375–377. |
[7] | Anstey KJ , Cherbuin N , Herath PM ((2013) ) Development of a new method for assessing global risk of Alzheimer’sdisease for use in population health approaches to prevention. Prev Sci 14: , 411–421. |
[8] | Kivipelto M , Ngandu T , Laatikainen T , Winblad B , Soininen H , Tuomilehto J ((2006) ) Risk score for the prediction of dementia risk in 20 years among middle aged people: A longitudinal, population-based study. Lancet Neurol 5: , 735–741. |
[9] | Exalto LG , Quesenberry CP , Barnes D , Kivipelto M , Biessels GJ , Whitmer RA ((2013) ) Midlife risk score for the prediction of dementia four decades later. Alzheimers Dement 10: , 562–570. |
[10] | Sindi S , Calov E , Fokkens J , Ngandu T , Soininen H , Tuomilehto J , Kivipelto M ((2015) ) The CAIDE Dementia Risk Score App: The development of an evidence-based mobile application to predict the risk of dementia. Alzheimers Dement (Amst) 1: , 328–333. |
[11] | Healthy Ageing Through Internet Counselling in the Elderly clinical trial, http://www.hatice.eu Accessed on September 19, 2016. |
[12] | Mattila J , Koikkalainen J , Virkki A , van Gils M , Lötjönen L , and Alzheimer’s Disease Neuroimaging Initiative ((2012) ) Design and application of a generic clinical decision support system for multiscale data. IEEE Trans Biomed Eng 59: , 234–240. |
[13] | Mattila J , Koikkalainen J , Virkki A , Simonsen A , van Gils M , Waldemar G , Soininen H , Lötjönen J ; Alzheimer’s Disease Neuroimaging Initiative ((2011) ) A Disease State Fingerprint for evaluation of Alzheimer’s disease. J Alzheimers Dis 27: , 163–176. |
[14] | Mattila J , Soininen H , Koikkalainen J , Rueckert D , Wolz R , Waldemar G , Lötjönen J ((2012) ) Optimizing the diagnosis of early Alzheimer’s disease in mild cognitive impairment subjects. J Alzheimers Dis 32: , 969–979. |
[15] | Simonsen AH , Mattila J , Hejl AM , Frederiksen KS , Herukka SK , Hallikainen M , van Gils M , Lötjönen J , Soininen H , Waldemar G ((2012) ) Application of the PredictAD software tool to predict progression in patients with mild cognitive impairment. Dement Geriatr Cogn Disord 34: , 344–350. |
[16] | Liu Y , Mattila J , Ruiz MÁ , Paajanen T , Koikkalainen J , van Gils M , Herukka SK , Waldemar G , Lötjönen J , Soininen H , Alzheimer’s Disease Neuroimaging Initiative ((2013) ) Predicting AD conversion: Comparison between prodromal AD guidelines and computer assisted PredictAD tool. PLoS One 8: , e55246. |
[17] | Hall A , Mattila J , Koikkalainen J , Lötjonen J , Wolz R , Scheltens P , Frisoni G , Tsolaki M , Nobili F , Freund-Levi Y , Minthon L , Frölich L , Hampel H , Visser PJ , Soininen H ((2015) ) Predicting progression from cognitive impairment to Alzheimer’s disease with the Disease State Index. Curr Alzheimer Res 12: , 69–79. |
[18] | Hall A , Muñoz-Ruiz M , Mattila J , Koikkalainen J , Tsolaki M , Mecocci P , Kloszewska I , Vellas B , Lovestone S , Visser PJ , Lötjonen J , Soininen H , Alzheimer Disease Neuroimaging Initiative, AddNeuroMed consortium, DESCRIPA, Kuopio L-MCI ((2015) ) Generalizability of the disease state index prediction model for identifying patients progressing from mild cognitive impairment to Alzheimer’s disease. J Alzheimers Dis 44: , 79–92. |
[19] | Muñoz-Ruiz MÁ , Hartikainen P , Hall A , Mattila J , Koikkalainen J , Herukka SK , Julkunen V , Vanninen R , Liu Y , Lötjönen J , Soininen H ((2013) ) Disease State Fingerprint in frontotemporal degeneration with reference to Alzheimer’s disease and mild cognitive impairment. J Alzheimers Dis 35: , 727–739. |
[20] | Simonsen AH , Mattila J , Hejl AM , Garde E , van Gils M , Thomsen C , Lötjönen J , Soininen H , Waldemar G ((2013) ) Application of the PredictAD decision support tool to a Danish cohort of patients with Alzheimer’s disease and other dementias. Dement Geriatr Cogn Disord 37: , 207–213. |
[21] | Kivipelto M , Helkala EL , Laakso MP , Hänninen T , Hallikainen M , Alhainen K , Soininen H , Tuomilehto J , Nissinen A ((2001) ) Midlife vascular risk factors and Alzheimer’s disease in later life: Longitudinal, population based study. BMJ 322: , 1447–1451. |
[22] | Solomon A , Ngandu T , Soininen H , Hallikainen M , Kivipelto M , Laatikainen T ((2014) ) Validity of dementia and Alzheimer’s disease diagnoses in Finnish national registers. Alzheimers Dement 10: , 303–309. |
[23] | CAIDE-Cardiovascular Risk Factors, Aging and Dementia, http://www.uef.fi/caide Accessed on September 19, 2016. |
[24] | Folstein MF , Folstein SE , McHugh PR ((1975) ) Mini-mental state. A practical method for grading the cognitive state of patients for the clinician. J Psychiatr Res 12: , 189–198. |
[25] | Morris JC , Heyman A , Mohs RC , Hughes JP , van Belle G , Fillenbaum G , Mellits ED , Clark C ((1989) ) The Consortium to Establish a Registry for Alzheimer’s disease (CERAD). Part I. Clinical and neuropsychological assessment of Alzheimer’s disease. Neurology 39: , 1159–1165. |
[26] | American Psychiatric Association ((1994) ) Diagnostic and Statistical Manual of Mental Disorders, 4th edn. American Psychiatric Association, Washington, DC. |
[27] | McKhann G , Drachman D , Folstein M , Katzman R , Price D , Stadlan EM ((1984) ) Clinical diagnosis of Alzheimer’s disease: Report of the NINCDS-ADRDA Work Group under the auspices of Department of Health and Human Services Task Force on Alzheimer’s Disease. Neurology 34: , 939–944. |
[28] | Petersen RC , Smith GE , Ivnik RJ , Tangalos EG , Schaid DJ , Thibodeau SN , Kokmen E , Waring SC , Kurland LT ((1995) ) Apolipoprotein E status as a predictor of the development of Alzheimer’s disease in memory-impaired individuals. JAMA 273: , 1274–1278. |
[29] | Kuulasmaa K , Tunstall-Pedoe H , Dobson A , Fortmann S , Sans S , Tolonen H , Evans A , Ferrario M , Tuomilehto J ((2000) ) Estimation of contribution of changes in classic risk factors to trends in coronary-event rates across the WHO MONICA Project populations. Lancet 355: , 675–687. |
[30] | Ngandu T , Helkala EL , Soininen H , Winblad B , Tuomilehto J , Nissinen A , Kivipelto M ((2007) ) Alcohol drinking and cognitive functions: Findings from the Cardiovascular Risk Factors Aging and Dementia (CAIDE) Study. Dement Geriatr Cogn Disord 23: , 140–149. |
[31] | Everson SA , Goldberg DE , Kaplan GA , Cohen RD , Pukkala E , Tuomilehto J , Salonen JT ((1996) ) Hopelessness and risk of mortality and incidence of myocardial infarction and cancer. Psychosom Med 58: , 113–121. |
[32] | Beck AT , Ward CH , Mendelson M , Mock J , Erbaugh J ((1961) ) An inventory for measuring depression. Arch Gen Psychiatry 4: , 561–571. |
[33] | Bennett-Levy J , Powell GE ((1980) ) The Subjective Memory Questionnaire (SMQ). An investigation into the self-reporting of ‘real-life’ memory skills. Br J Soc Clin Psychol 19: , 177–188. |
[34] | Tsukamoto K , Watanabe T , Matsushima T , Kinoshita M , Kato H , Hashimoto Y , Kurokawa K , Teramoto T ((1993) ) Determination by PCR-RFLP of ApoE genotype in a Japanese population. J Lab Clin Med 121: , 598–602. |
[35] | Corder EH , Saunders AM , Strittmatter WJ , Schmechel DE , Gaskell PC , Small GW , Roses AD , Haines JL , Pericak-Vance MA ((1993) ) Gene dose of apolipoprotein E type 4 allele and the risk of Alzheimer’s disease in late onset families. Science 261: , 921–923. |
[36] | Corder EH , Saunders AM , Risch NJ , Strittmatter WJ , Schmechel DE , Gaskell PC Jr , Rimmler JB , Locke PA , Conneally PM , Schmader KE , Small GW , Roses AD , Haines JL , Pericak-Vance MA ((1994) ) Protective effect of apolipoprotein E type 2 allele for late onset Alzheimer disease. Nat Genet 7: , 180–184. |
[37] | Wilson PW , D’Agostino RB , Levy D , Belanger AM , Silbershatz H , Kannel WB ((1998) ) Prediction of coronary heart disease using risk factor categories. Circulation 97: , 1837–1847. |
[38] | Conroy RM , Pyörälä K , Fitzgerald AP , Sans S , Menotti A , De Backer G , De Bacquer D , Ducimetière P , Jousilahti P , Keil U , Njølstad I , Oganov RG , Thomsen T , Tunstall-Pedoe H , Tverdal A , Wedel H , Whincup P , Wilhelmsen L , Graham IM ; SCORE project group ((2003) ) Estimation of ten-year risk of fatal cardiovascular disease in Europe: The SCORE project. Eur Heart J 24: , 987–1003. |
[39] | Moll van Charante EP , Richard E , Eurelings LS , van Dalen JW , Ligthart SA , van Bussel EF , Hoevenaar-Blom MP , Vermeulen M , van Gool WA ((2016) ) Effectiveness of a 6-year multidomain vascular care intervention to prevent dementia (preDIVA): A cluster-randomised controlled trial. Lancet 388: , 797–805. |
[40] | Barnes DE , Covinsky KE , Whitmer RA , Kuller LH , Lopez OL , Yaffe K ((2009) ) Predicting risk of dementia in older adults: The late-life dementia risk index. Neurology 73: , 173–179. |
[41] | Barnes DE , Covinsky KE , Whitmer RA , Kuller LH , Lopez OL , Yaffe K ((2010) ) Commentary on Developing a national strategy to prevent dementia: Leon Thal Symposium 2009. Dementia risk indices: A framework for identifying individuals with a high dementia risk. Alzheimers Dement 6: , 138–141. |
Figures and Tables
Fig.1
Formation of the study populations.
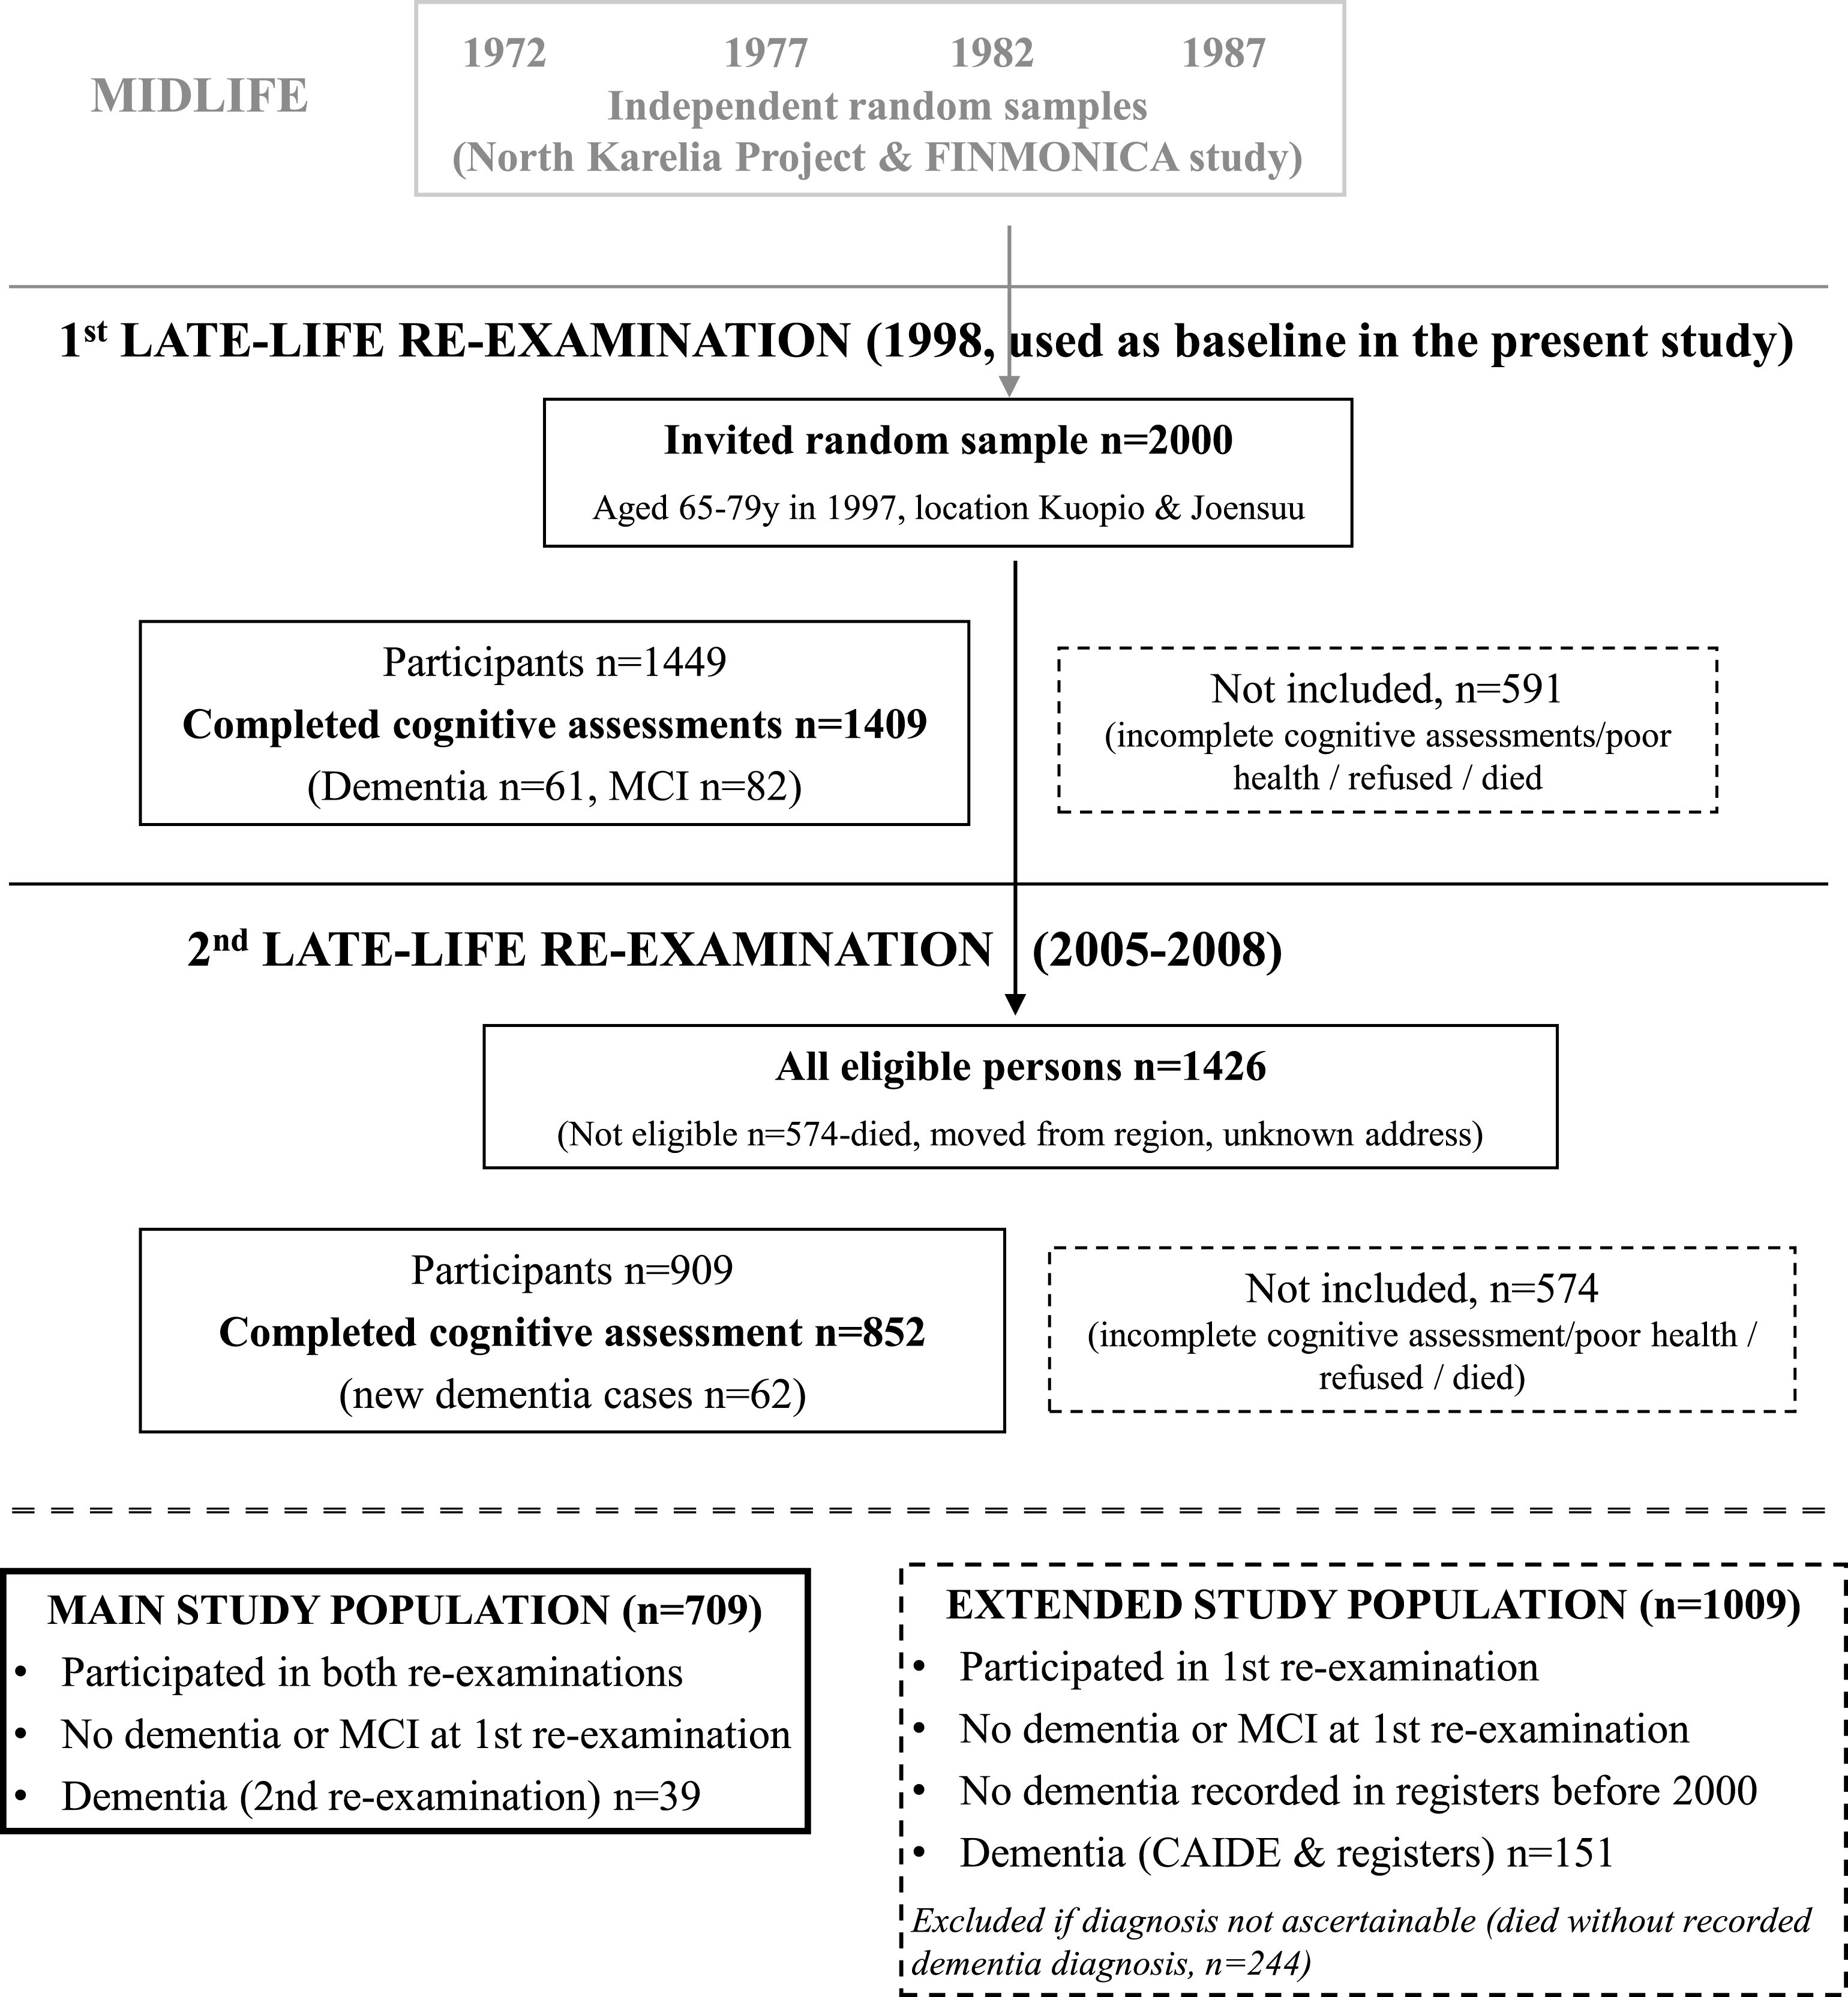
Fig.2
ROC curves for the late-life DSI dementia index in the main and extended study populations.
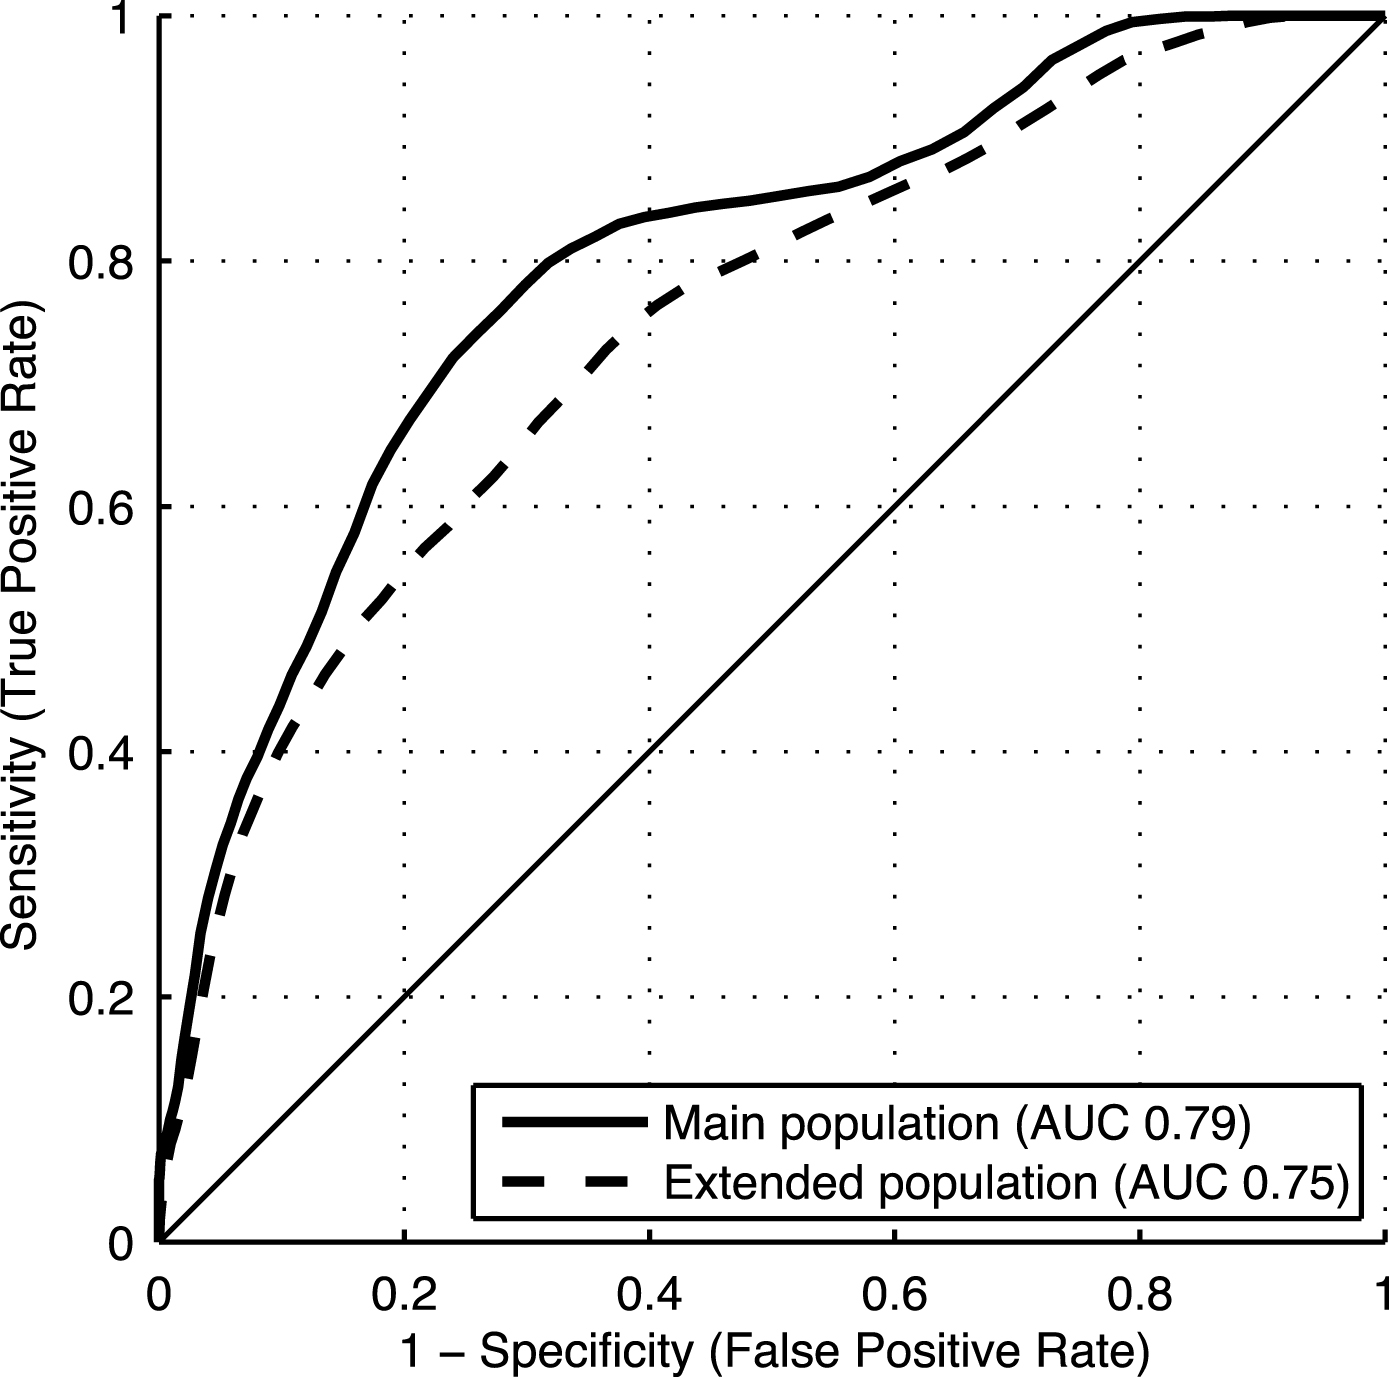
Table 1
Characteristics of the study populations
| Main study population | Extended study population | |||||||
| (participants/survivors) | ||||||||
| n | Control | Dementia | p-value | n | Control | Dementia | p-value | |
| Socio-demographic characteristics | ||||||||
| Age | 670/39 | 70.0 (3.4) | 72.4 (4.1) | <0.001 | 858/151 | 70.2 (3.6) | 72.4 (3.9) | <0.001 |
| Education (years) | 659/39 | 9.3 (3.5) | 9.2 (4.1) | 0.47 | 845/148 | 9.0 (3.5) | 9.0 (3.8) | 0.38 |
| Women | 670/39 | 64.2% | 74.4% | 0.20 | 858/151 | 65.4% | 66.9% | 0.72 |
| Cognition | ||||||||
| MMSE (0-30p) | 669/39 | 26.6 (1.6) | 26.2 (1.8) | 0.33 | 853/149 | 26.5 (1.7) | 26.1 (1.9) | 0.044 |
| Verbal expression | 670/39 | 21.3 (6.0) | 19.5 (5.0) | 0.15 | 854/148 | 20.9 (6.0) | 19.5 (5.6) | 0.028 |
| Prospective memory (1-4p) | 585/34 | 2.9 (0.8) | 2.4 (0.9) | 0.001 | 756/129 | 2.8 (0.8) | 2.4 (0.8) | <0.001 |
| Episodic memory (0-10p) | 662/39 | 5.4 (1.1) | 4.8 (1.0) | 0.002 | 846/150 | 5.3 (1.1) | 4.7 (1.3) | <0.001 |
| Psychomotor speed | 635/38 | 0.02 (0.8) | –0.4 (1.0) | 0.011 | 809/136 | 0.1 (0.8) | –0.4 (0.9) | <0.001 |
| Executive functioning | 649/38 | 36.2 (17.5) | 48.3 (21.5) | <0.001 | 824/143 | 37.5 (18.7) | 46.6 (25.9) | <0.001 |
| Vascular & lifestyle factors | ||||||||
| SBP (mmHg) | 669/39 | 151.1 (22.3) | 140.4 (22.7) | 0.004 | 857/151 | 150.9 (22.6) | 152.6 (25.8) | 0.48 |
| DBP (mmHg) | 669/39 | 81.3 (10.8) | 75.4 (10.3) | 0.002 | 857/151 | 80.9 (11.0) | 79.9 (11.1) | 0.40 |
| BMI (kg/m2) | 670/39 | 27.8 (4.0) | 27.0 (4.0) | 0.29 | 858/151 | 27.8 (4.0) | 27.2 (4.1) | 0.09 |
| Waist-hip ratio | 669/39 | 0.9 (0.1) | 0.9 (0.1) | 0.12 | 852/150 | 0.9 (0.1) | 0.9 (0.1) | 0.35 |
| Total cholesterol (mmol/l) | 668/39 | 5.9 (1.0) | 5.6 (1.1) | 0.08 | 855/150 | 5.9 (1.0) | 5.9 (1.0) | 0.56 |
| HDL (mmol/l) | 668/39 | 1.4 (0.4) | 1.5 (0.4) | 0.48 | 855/150 | 1.4 (0.4) | 1.5 (0.4) | 0.09 |
| Triglycerides (mmol/l) | 668/39 | 1.5 (0.7) | 1.4 (0.7) | 0.38 | 855/150 | 1.5 (0.7) | 1.5 (0.8) | 0.35 |
| Physical activity (1-6p) | 666/39 | 2.0 (1.1) | 2.5 (1.8) | 0.47 | 849/149 | 2.1 (1.2) | 2.3 (1.5) | 0.32 |
| Alcohol use (1-3p) | 663/39 | 1.8 (0.8) | 1.9 (0.7) | 0.23 | 848/148 | 1.8 (0.8) | 1.9 (0.8) | 0.22 |
| Smoker | 665/38 | 33.1% | 29.0% | 0.60 | 848/148 | 32.9% | 35.8% | 0.49 |
| Presence of comorbidity | 670/39 | 20.9% | 41.0% | 0.003 | 858/151 | 21.1% | 31.1% | 0.007 |
| APOE genotype | ||||||||
| ɛ23/24 or 33/34/44 (N) | 669/39 | 8/63/27/2 | 5/41/44/10 | 0.001 | 850/150 | 8/62/28/2 | 3/48/38/11 | <0.001 |
| ɛ4 carrier | 670/39 | 30.4% | 53.8% | 0.002 | 858/151 | 31.1% | 50.3% | <0.001 |
| Self-rated health measures | ||||||||
| Self-rated health (1-5p) | 667/39 | 2.6 (0.7) | 2.7 (0.7) | 0.71 | 852/150 | 2.6 (0.7) | 2.8 (0.8) | 0.06 |
| Self-rated fitness (1-5p) | 666/37 | 2.7 (0.7) | 2.7 (0.8) | 0.84 | 852/148 | 2.7 (0.7) | 2.8 (0.8) | 0.10 |
| Hopelessness (0-8p) | 624/38 | 5.2 (1.8) | 4.7 (2.1) | 0.16 | 782/127 | 5.1 (1.8) | 4.9 (1.8) | 0.44 |
| BDI (0-63p) | 572/29 | 9.2 (6.2) | 10.3 (7.3) | 0.49 | 719/111 | 9.2 (6.3) | 10.0 (7.0) | 0.38 |
| Subjective Memory Questionnaire (1-4p/question) | ||||||||
| Total score | 510/28 | 46.1 (8.1) | 50.1 (9.0) | 0.021 | 648/98 | 45.7 (8.2) | 48.1 (10.0) | 0.020 |
| Forgetting phone numbers | 659/38 | 2.5 (0.8) | 2.9 (0.7) | 0.003 | 842/143 | 2.5 (0.8) | 2.75 (0.77) | 0.001 |
| Forgetting clothing size | 632/32 | 2.3 (0.9) | 2.8 (1.1) | 0.023 | 808/132 | 2.3 (1.0) | 2.5 (1.0) | 0.19 |
| Forgetting name of actors | 638/37 | 2.8 (0.8) | 3.2 (0.8) | 0.005 | 807/142 | 2.8 (0.8) | 2.9 (0.8) | 0.10 |
| Forgetting what to say in mid-sentence | 662/38 | 1.8 (0.6) | 2.1 (0.7) | 0.009 | 844/141 | 1.8 (0.6) | 1.9 (0.7) | 0.09 |
| Changes in vascular factors (late-life – midlife) | ||||||||
| SBP (mmHg) | 669/39 | 10.3 (23.2) | –1.2 (25.2) | 0.002 | 857/151 | 9.4 (23.3) | 7.6 (26.5) | 0.29 |
| DBP (mmHg) | 669/39 | –7.0 (12.1) | –13.3 (14.0) | 0.017 | 857/151 | –7.4 (12.1) | –9.8 (12.7) | 0.031 |
| Total cholesterol (mmol/l) | 668/39 | –0.8 (1.2) | –1.0 (1.4) | 0.24 | 855/150 | –0.8 (1.2) | –0.9 (1.2) | 0.035 |
| BMI (kg/m2) | 670/39 | 1.6 (2.7) | –0.1 (2.3) | <0.001 | 858/151 | 1.6 (2.7) | 0.2 (2.9) | <0.001 |
All shown characteristics were assessed at the first late-life re-examination (1998), except for Changes in vascular factors, which show differences between 1998 and midlife (21 years earlier). Values are means (standard deviations) unless otherwise specified. For Cognition, higher results indicate better performance, except for executive functioning where lower results indicate better performance. Physical activity was assessed as 6 ordered categories: 1 = daily; 2 = 2-3 times a week; 3 = once a week; 4 = 2-3 times a month; 5 = a few times a year; and 6 = not at all. Alcohol use was assessed as 3 ordered categories: 1 = monthly; 2 = less than monthly; and 3 = not at all. Self-rated health and fitness were assessed as 5 ordered categories: 1 = very good; 2 = good; 3 = satisfactory; 4 = relatively poor; and 5 = very poor. For hopelessness, higher score indicated less hopelessness. For BDI (Beck Depression Inventory), higher score indicate more pronounced depressive symptoms. In the Subjective Memory Questionnaire, each question had 4 ordered answer categories: 1 = never; 2 = sometimes; 3 = often; and 4 = almost all the time (i.e., higher score indicates more pronounced memory complaints). Only questions with significant differences between groups are shown here.
Table 2
Performance of DSI, included individual factors and factor groups in predicting dementia
| Main study population (participants/survivors) | Extended study population | |
| AUC (95% CI) | AUC (95% CI) | |
| Basic model | ||
| Total DSI | 0.79 (0.79–0.80) | 0.75 (0.74–0.75) |
| Cognition | 0.73 (0.73–0.74) | 0.69 (0.69–0.70) |
| Executive functioning | 0.68 (0.67–0.69) | 0.62 (0.62–0.63) |
| Episodic memory | 0.64 (0.62–0.65) | 0.61 (0.61–0.62) |
| Prospective memory | 0.62 (0.61–0.63) | 0.63 (0.62–0.63) |
| Psychomotor speed | 0.62 (0.61–0.63) | 0.67 (0.66–0.68) |
| MMSE | 0.54 (0.54–0.55) | |
| Verbal Expression | 0.55 (0.55–0.56) | |
| Socio-demographic characteristics | 0.67 (0.65–0.68) | 0.66 (0.66–0.67) |
| Age | 0.67 (0.65–0.68) | 0.66 (0.66–0.67) |
| Vascular factors | 0.65 (0.64–0.66) | 0.53 (0.52–0.53) |
| DBP | 0.64 (0.63–0.65) | |
| SBP | 0.63 (0.62–0.64) | |
| Presence of comorbidity | 0.56 (0.55–0.57) | 0.53 (0.52–0.53) |
| Subjective Memory Questionnaire | 0.64 (0.63–0.66) | 0.58 (0.57–0.58) |
| Total score | 0.62 (0.61–0.64) | 0.57 (0.56–0.58) |
| Forgetting phone numbers | 0.61 (0.60–0.62) | 0.57 (0.56–0.57) |
| Forgetting name of actors | 0.60 (0.59–0.61) | |
| Forgetting clothing size | 0.59 (0.57–0.60) | |
| Forgetting what to say in mid-sentence | 0.58 (0.57–0.59) | |
| APOE genotype | 0.59 (0.58–0.60) | 0.60 (0.59–0.61) |
| Genotype risk order | 0.60 (0.59–0.61) | 0.60 (0.60–0.61) |
| ɛ4 carrier | 0.57 (0.55–0.58) | 0.57 (0.57–0.58) |
| Basic model + changes in vascular factors from midlife | ||
| Total DSI | 0.80 (0.79–0.81) | 0.78 (0.77–0.79) |
| Vascular changes | 0.68 (0.66–0.69) | 0.65 (0.64–0.66) |
| BMI change | 0.68 (0.67–0.69) | 0.68 (0.67–0.69) |
| SBP change | 0.65 (0.63–0.66) | |
| DBP change | 0.61 (0.59–0.62) | 0.61 (0.59–0.62) |
| Total cholesterol change | 0.55 (0.54–0.57) |
Values are AUC (95% CI) for the composite DSI, factor groups (Cognition, Vascular factors, Demographics, Subjective memory questionnaire, and APOE genotype), and individual factors within each group. In the basic model + changes in vascular factors from midlife, the total DSI value includes all factors and factor groups from the basic model plus the Vascular changes group. Only factors with significant differences between control and dementia groups (as per Table 1 p-values) are shown here.
Table 3
Late-life DSI dementia index cut-offs (basic model) with accuracy, sensitivity, specificity, and the percentage of individuals classified as developing dementia in the future
| Main study population | Extended study population | |||||||
| Cut-off | Accuracy | Sensitivity | Specificity | Classified | Accuracy | Sensitivity | Specificity | Classified |
| dementia + (%) | dementia + (%) | |||||||
| 0.10 | 0.06 | 1.00 | 0.01 | 99 | 0.15 | 1.00 | 0.00 | 100 |
| 0.20 | 0.15 | 1.00 | 0.10 | 91 | 0.19 | 1.00 | 0.05 | 96 |
| 0.30 | 0.33 | 0.93 | 0.30 | 72 | 0.34 | 0.95 | 0.23 | 80 |
| 0.40 | 0.56 | 0.85 | 0.54 | 48 | 0.51 | 0.83 | 0.45 | 59 |
| 0.45 | 0.66 | 0.82 | 0.65 | 38 | 0.60 | 0.78 | 0.57 | 48 |
| 0.50 | 0.74 | 0.73 | 0.74 | 29 | 0.67 | 0.69 | 0.67 | 38 |
| 0.55 | 0.81 | 0.61 | 0.83 | 20 | 0.74 | 0.59 | 0.76 | 29 |
| 0.60 | 0.87 | 0.45 | 0.89 | 13 | 0.80 | 0.49 | 0.85 | 20 |
| 0.70 | 0.93 | 0.24 | 0.97 | 5 | 0.85 | 0.26 | 0.95 | 8 |
| 0.80 | 0.94 | 0.09 | 0.99 | 1 | 0.85 | 0.07 | 0.99 | 2 |
| 0.90 | 0.95 | 0.03 | 1.00 | 0 | 0.85 | 0.00 | 1.00 | 0 |
Table 4
Effects of p-value threshold filtering on the number of factors included in the model, and on the predictive performance (AUC) of the DSI dementia index
| Main study population | Extended study population | |||
| p-value thresholds | No. of factors included | AUC (95% CI) | No. of factors included | AUC (95% CI) |
| in model | in model | |||
| p < 0.000001 | 0 | 5 | 0.76 (0.75–0.76) | |
| p < 0.001 | 4 | 0.76 (0.75–0.78) | 9 | 0.77 (0.76–0.77) |
| p < 0.01 | 14 | 0.82 (0.81–0.83) | 10 | 0.77 (0.76–0.77) |
| p < 0.05 | 18 | 0.80 (0.79–0.81) | 15 | 0.75 (0.75–0.76) |
| p < 0.1 | 21 | 0.79 (0.79–0.80) | 23 | 0.75 (0.74–0.75) |
| p < 0.2 | 30 | 0.79 (0.78–0.80) | 27 | 0.75 (0.74–0.75) |
| no threshold | 49 | 0.74 (0.73–0.76) | 49 | 0.73 (0.72–0.73) |
p-values calculated from Mann-Whitney U-tests comparing controls and subsequent dementia cases were used for the thresholds shown. Only factors showing significant differences between groups below a specific threshold are included in the model and factors not showing significant differences are filtered out of the model.

