
Modifiable Risk Factors Discriminate Memory Trajectories in Non-Demented Aging: Precision Factors and Targets for Promoting Healthier Brain Aging and Preventing Dementia
Abstract
Background:
Non-demented cognitive aging trajectories are characterized by vast level and slope differences and a spectrum of outcomes, including dementia.
Objective:
The goal of AD risk management (and its corollary, promoting healthy brain aging) is aided by two converging objectives: 1) classifying dynamic distributions of non-demented cognitive trajectories, and 2) identifying modifiable risk-elevating and risk-reducing factors that discriminate stable or normal trajectory patterns from declining or pre-impairment patterns.
Method:
Using latent class growth analysis we classified three episodic memory aging trajectories for n = 882 older adults (baseline Mage=71.6, SD=8.9, range = 53-95, female=66%): Stable (SMA; above average level, sustained slope), Normal (NMA; average level, moderately declining slope), and Declining (DMA; below average level, substantially declining slope). Using random forest analyses, we simultaneously assessed 17 risk/protective factors from non-modifiable demographic, functional, psychological, and lifestyle domains. Within two age strata (Young-Old, Old-Old), three pairwise prediction analyses identified important discriminating factors.
Results:
Prediction analyses revealed that different modifiable risk predictors, both shared and unique across age strata, discriminated SMA (i.e., education, depressive symptoms, living status, body mass index, heart rate, social activity) and DMA (i.e., lifestyle activities [cognitive, self-maintenance, social], grip strength, heart rate, gait) groups.
Conclusion:
Memory trajectory analyses produced empirical classes varying in level and slope. Prediction analyses revealed different predictors of SMA and DMA that also varied by age strata. Precision approaches for promoting healthier memory aging—and delaying memory impairment—may identify modifiable factors that constitute specific targets for intervention in the differential context of age and non-demented trajectory patterns.
INTRODUCTION
Non-demented aging populations show substantial individual variability in level and slope of longitudinal changes in multiple brain and cognitive function indicators [1-6]. This dynamic heterogeneity includes patterns potentially linked to a spectrum of clinical categories or outcomes, including cognitively normal aging, mild cognitive impairment (MCI), and an increased probability of Alzheimer’s disease (AD). Dementia prevention researchers have become increasingly interested in this diversity of non-demented cognitive aging trajectories, reasoning that individualized trajectories may be partially accounted for by differential patterns of risk and protective factors, some of which may be modifiable. Specifically, these trajectory distributions may constitute an understudied but promising platform for discovery of risk-reducing and protection-enhancing factors that moderate differential memory changes during broad bands of aging (50s-90s) [6-10]. Moreover, it is conceivable that the distribution of trajectories per se may be objectively clustered into relative better functioning (higher level, sustained slope), relatively normal functioning (mid-level, moderate decline), and worse functioning (lower level, steeper decline). It is also conceivable that different constellations of risk/protection factors may discriminate the normal cluster from both the higher and lower clusters. This possibility leads to a converging goal for researchers interested in AD risk detection, management, delay, or prevention [10-15]. Namely, in order to advance the cause of dementia risk management, it may be profitable to discover factors that elevate risk for early exacerbated decline and factors that enhance protection and sustained levels of aging change. Furthermore, these outcomes may not be produced by the same factors.
Episodic memory (EM) is a sensitive indicator of neurobiological changes in normal aging and neurodegenerative processes, producing differential trajectories including exacerbated decline in MCI and AD [3, 4, 16, 17]. Variability of memory change—and the existence of preserved high and sustained levels of performance—has been linked to several mechanisms associated with lifestyle factors that lead to maintenance of brain functioning in older adulthood [4]. Concepts of cognitive reserve or cognitive resilience can be operationalized as the existence of preserved performance in the presence of risk (including genetic risk and brain pathology) due to (perhaps) risk-reducing or protection-enhancing factors [4, 18-20]. Several studies support the reserve and resilience hypotheses suggesting the potential for discriminating not only a normal memory aging group from a declining or impaired group, but also from a higher performing group [8, 21, 22]. For example, the Betula Project used longitudinal EM trajectories to separate maintainers (i.e., moderate to high baseline EM score and better-than-average rate of change) from decliners and those with age-typical change [3]. Being a maintainer was predicted by higher education, being female, living with someone, more physical activity, and other non-modifiable factors. Concordant work from the Northwestern SuperAging project [8, 21, 22] and the Victoria Longitudinal Study (VLS) [23-26] has been reported.
We implement the current observational study with two coordinated steps. For step one, we analyzed a distribution of actual memory trajectories (over a 40-year band of aging) from non-demented participants in the VLS. We used latent class growth analyses (LCGA) to objectively separate neighboring (but statistically distinguishable) classes of trajectories based on an algorithm including individualized level and slope values. The goal was to determine objective classes of memory aging trajectories—substantially supplementing informally characterized, cross-sectionally tested, or single-indicator estimated groups.
For step two, we extracted multiple VLS measures that reflected the broad range of relatively modifiable risk and protection factors recently identified in reviews of observational and epidemiological research as being associated with differential non-demented and preclinical cognitive aging patterns and outcomes [10, 12, 13, 15, 27]. Multiple risk factor predictors of cross-sectional memory deficits, declining memory performance, or emerging memory (or mild cognitive) impairment have been identified [3, 9, 28-32]. Several reviews discuss risk factors for cognitive impairment or dementia. For example, reduction in seven potentially modifiable risk factors (i.e., diabetes, midlife hypertension, midlife obesity, smoking, depression, low education, physical inactivity) could decrease the number of AD cases worldwide by millions [13]. Seven additional risk and protection factors (i.e., cholesterol level, traumatic brain injury, alcohol, social engagement, cognitive engagement, fish intake. and pesticide exposure) were reported that could identify low, moderate, and high risk of AD [27]. Recently, an exhaustive review of modifiable risk factors, identified early life (education), mid-life (hearing loss, hypertension, obesity), and late life (diabetes, smoking, depression, physical inactivity, social isolation) factors as potential targets for dementia prevention [15]. Drawing from both memory predictors and dementia risk literature and focusing on relatively modifiable risk and protection factors, we assembled 17 factors from the VLS data base for this study [10, 12, 13, 15, 16]. We also included other risk factors that have been related to differential memory aging decline (i.e., peak expiratory flow [33], grip strength [34], gait, balance [35], subjective health [36], and self-maintenance activities [37]). We simultaneously analyzed all 17 factors for predictive importance in discriminating pairwise comparisons of the three expected trajectory groups. In order to test the large number of predictors (of unknown importance weight) in the same model without the limitation of multiple testing that occurs in more traditional analyses, we selected the machine learning technique, Random Forest Analysis (RFA) [17]. The technology is parallel to unbiased biomarker discovery approaches (e.g., metabolomics) whereby even larger numbers of putative biomarkers are compared (via RFA) in discriminating neighboring clinical diagnoses. For example, metabolomics biomarker analyses discriminated normal aging from Parkinson’s disease with incipient (but not yet diagnosed) dementia [38]. Similar approaches have been applied to the discovery of predictive biomarkers of AD and MCI [39]. We note that it is arguably more challenging to discriminate groups of non-demented older adults who vary in preclinical characteristics of their memory trajectories.
The present study has two main objectives. First, we use longitudinal data of memory trajectories to operationally define separable clusters. We expect at least three main classes of memory trajectories, corresponding roughly to stable memory aging (SMA), normal memory aging (NMA), and declining memory aging (DMA). Second, we use a machine-learning computational technology (i.e., RFA), to test 17 risk predictors of memory status class. The predictors derive from four AD risk domains: 1) non-modifiable demographic (e.g., sex), 2) functional biomarker (e.g., gait), 3) psychological (e.g., depressive symptoms), and 4) lifestyle (e.g., physical activity). Given both age- and sex-related differences in AD incidence, age and sex may be selective predictors. The number and specific predictors may also vary within age strata. We expect that predictors of SMA will differ from those of DMA.
MATERIALS AND METHOD
Participants
Participants were community-dwelling older adult volunteers of the VLS, an ongoing, multi-cohort, longitudinal-sequential study of biomedical, health, cognitive, genetic, and lifestyle aspects of human aging. All participants provided written informed consent and all data collection procedures were in full compliance with human research ethics. The VLS includes three original samples aged 53-85 at recruitment that are followed at approximately 4.5-year intervals. The source cohort (n = 955) had three waves of longitudinal data. Using established procedures for accelerated longitudinal designs [40, 41], we used age as the metric of longitudinal change, converting from wave-based to age-based data. The resulting accelerated longitudinal design [42, 43] covers a 40-year band of aging (53-95 years). The inclusionary criteria were longitudinal EM data and English fluency. The following exclusionary criteria were applied: 1) EM data missing from all three waves (n = 12), 2) concurrent brain-related health conditions (e.g., AD and dementia, n = 14), 3) Mini-Mental State Examination score <24 (n = 26), 4) recent (within the last five years) very serious head injury (n = 2), and 5) moderately to very serious stroke (but not transient ischemic attack; n = 19). No participants reported very serious depression or very serious drug or alcohol dependence. The final study sample (n=882) is described in Table 1 (M age at baseline = 71.6, age range = 53-95, 65.9% female). Overall retention rates for the two adjoining intervals are: W1-W2 = 71%, W2–W3 = 73%.
Table 1
Sample characteristics for entire sample and by memory status.
| Measured Variable | Whole Sample | Proportion of Missing Data (%) | SMA | NMA | DMA |
| n | 882 | 3 | 276 | 415 | 191 |
| Mi (SE) | 0.004 (0.44) | - | 0.93 (0.02) | -0.12 (0.01) | -1.34 (0.02) |
| Ms (SE) | -0.043 (0.059) | - | -0.026 (0.002) | -0.043 (0.001) | -0.056 (0.003) |
| Age (y) | 71.6 (8.9) | 0 | 70.8 (8.7) | 71.9 (8.7) | 72.2 (9.5) |
| Young-old (n=435) | 64.1 (5.2) | - | 63.9 (5.2) | 64.5 (5.2) | 63.5 (5.2) |
| Old-old (n=447) | 78.9 (4.5) | - | 78.5 (4.1) | 79.0 (4.3) | 79.3 (5.3) |
| Education (years) | 15.1 (3.0) | 0 | 15.8 (2.9) | 14.9 (2.8) | 14.5 (3.3) |
| Sex (% female) | 65.9 | 0 | 77.2 | 63.6 | 54.5 |
| Living status (% with) | 65.0 | 1 | 63.4 | 64.9 | 67.7 |
| CES-D score | 7.9 (7.1) | 2 | 7.0 (6.6) | 8.4 (7.1) | 8.2 (7.5) |
| Subjective healtha | 1.83 (0.74) | 1 | 1.79 (0.70) | 1.81 (0.73) | 1.94 (0.82) |
| Pulse pressure (mmHg) | 53.2 (10.6) | 4 | 53.1 (10.2) | 53.0 (11.0) | 54.0 (10.2) |
| Peak expiratory flow (L/min) | 415.3 (116.0) | 5 | 403.6 (110.8) | 415.8 (119.4) | 431.3 (114.6) |
| Grip strength (kg/f) | 29.8 (9.7) | 6 | 28.4 (8.5) | 29.8 (9.6) | 31.7 (11.0) |
| Body mass index (kg/m2) | 26.6 (4.1) | 2 | 26.8 (4.3) | 26.6 (4.1) | 26.3 (3.7) |
| Heart rate (beats/min) | 68.5 (9.3) | 6 | 68.8 (8.7) | 68.3 (9.3) | 68.6 (10.1) |
| Gait (s) | 6.88 (1.93) | 6 | 6.78 (1.85) | 6.82 (1.78) | 7.16 (2.31) |
| Balance (s) | 3.07 (1.19) | 5 | 3.02 (1.06) | 3.02 (1.12) | 3.27 (1.46) |
| Physical activity | 15.4 (5.2) | 2 | 15.7 (4.9) | 15.4 (5.1) | 15.1 (5.6) |
| Social activity | 22.3 (6.8) | 3 | 23.5 (6.5) | 22.3 (6.6) | 20.5 (7.4) |
| Novel cognitive activity | 74.7 (17.0) | 4 | 79.1 (15.6) | 75.5 (16.3) | 66.8 (17.9) |
| Self-maintenance activity | 29.2 (5.9) | 3 | 29.9 (5.3) | 29.3 (5.6) | 27.9 (7.3) |
| Self-reported eyesight | 3.1% | - | - | - | - |
| Self-reported hearing | 7.9% | - | - | - | - |
Note. Results presented as Mean (Standard Deviation) unless otherwise stated. SMA, stable memory aging; NMA, normal memory aging; DMA, declining memory aging; Mi, mean episodic memory intercept; Ms, mean episodic memory slope; CES-D, Center for Epidemiologic Studies Depression scale; mmHg, millimeter of mercury; L, liters; min, minute; kg, kilograms; f, force; m2, meters squared; s, seconds.; aSelf-reported health relative to perfect based on 1 = very good to 5 = very poor; b Self-reported eyesight and hearing relative to peers based on 1 = very good to 5 = very poor in % of poor or very poor.
Episodic memory
We used four measures from two standard tests of EM, word recall and Rey Auditory Verbal Learning Test (RAVLT) [26, 44]. For word recall, participants were given two minutes to study a list of 30 English words (6 from each of 5 taxonomic categories in random order) and five minutes to write down as many as they could remember [44]. Six equivalent lists exist and were administered such that no participant saw the same list twice. Participants received a maximum score of 30 on each of two trials. This task provided two manifest variables: 1) score on list 1 and 2) score on list 2. For RAVLT, participants listened to fifteen nouns and then recalled orally as many as possible [45, 46]. This procedure was repeated five times (A1-A5). Participants then listened to a second list (B1) of 15 unrelated nouns and immediately recalled them orally. Finally, participants recalled the first list (A6). This task provided two manifest variables: 1) list B1 was used as a measure of free recall (maximum score of 15) and 2) list A6 was used to measure recall after interference (maximum score of 15). Writing skill of participants was not assessed, nor was sensory ability controlled for (see Table 1 for percentage reporting poor or very poor). However, all sensory aides (i.e., glasses, hearing aids) were allowed for testing, and all participants experienced the same testing conditions in all sessions.
Risk factor predictors of memory status (SMA, DMA)
Four broad domains of 17 risk-related biomarkers were tested together in the statistically competitive context of a machine-learning computational approach using random forest analyses (RFA). Most of these markers have been investigated independently as both risk factors for dementia and predictors or covariates of memory performance and change. Notably, the current RFA analyses uses single time point predictors and the baseline measure of the predictor is measured at the beginning of each individual’s trajectory. Whereas the first category included important precision factors, the remaining domains were comprised of potentially modifiable precision targets. First, two non-modifiable demographic factors were collected at baseline and included participants’ 1) age (in years) and 2) sex. Second, seven potentially modifiable functional biomarkers included baseline 1) pulse pressure (PP; equals systolic blood pressure (BP) – diastolic BP, in mmHg) based on an average of eight BP readings [26], 2) peak expiratory flow (largest volume of air expired over three attempts, in liters/minute [33]), 3) grip strength (average hand strength, in kilograms/ force [34]), 4) body mass index (BMI; equals weight/height2, in kilograms/meters2), 5) heart rate (average over eight sessions), and the average of wave 1 and wave 2 data for 6) balance (360 degree turn, in seconds) and 7) gait (20 feet, in seconds).
Third, two potentially modifiable psychological markers included baseline 1) depressive symptoms (Center for Epidemiologic Studies Depression Scale) [47], and 2) subjective health relative to a perfect state of health on a 5-point Likert scale (from “very good” = 1 to “very poor” = 5). Fourth, six potentially modifiable lifestyle factors included baseline 1) education (total years), 2) living status (living alone = 0, living with someone = 1), and four other composite factors based on self-report questions from the VLS Activities Lifestyle Questionnaire [48] which uses a nine-point scale to rate frequency of participation (from “never” = 0 to “daily” = 8). We included 3) physical activity (n = 4 questions), 4) novel cognitive activity (n = 27), 5) social activity (n = 7), and 6) self-maintenance activity (n = 6).
Older age is a prominent risk factor for AD and risk increases in intensity with advancing age. Therefore, we tested age as both a predictor and a stratification variable. Specifically, because of the chronological breadth of the longitudinal sample (40 years) and the observations of age differences in dementia prevalence and co-morbidities, we stratified by age to investigate whether predictors vary between age groups: young-old (<72.5 years) and old-old (≥72.5 years) adults. The baseline Median age (72.5) and the baseline Mean age (71.8) were similar. Therefore, to maximize the data points in both groups we chose 72.5 as the stratification point of age in this sample.
Statistical approach: foundational statistical analyses
For our foundational statistical analyses, we used MPlus 7 [49] to conduct confirmatory factor analysis of EM, longitudinal invariance testing, and latent growth modeling. Model fit for all analyses was determined using the following standard indices [40, 50]: 1) chi-square test of model fit (χ2) for which a good fit would produce a non-significant outcome (p >0.05), indicating that the data are not significantly different from the estimates associated with the model, 2) Akaike Information Criterion (AIC) for which better fit is associated with a lower value, 3) Bayesian Information Criterion (BIC; the sample-size adjusted value of AIC), lower values imply better model fit, 4) root mean square error of approximation (RMSEA) for which a value of ≤0.05 is deemed good fit and ≤0.08 is deemed adequate fit, 5) comparative fit index (CFI) for which a value of ≥0.95 is deemed good fit and ≥0.90 is deemed adequate fit, and 6) standardized root mean square residual (SRMR), for which a value of ≤0.08 is deemed as good fit. We used -2 log likelihood (-2LL) difference statistic (D) for all nested models. First, we computed the EM latent variable. We used four EM measures as described above (word recall lists one and two; RAVLT, free recall and recall after interference) to test an EM latent variable using confirmatory factor analyses. For best model fit indexes, see Supplementary Table 1. Second, we tested the one-factor EM latent variable for longitudinal (three-wave) measurement invariance. The tests examined included: 1) configural invariance (the same indicator variables load onto the latent variable at each time point), 2) metric invariance (factor loadings are constrained as equal for each latent variable to indicate that it is measuring the same construct), and 3) scalar invariance (indicator intercepts are constrained to be equal which allows mean differences to be evident at the latent level; [40]). For details, see Supplementary Table 1. We estimated EM factor scores and used these scores in all subsequent models. Third, we used latent growth modeling to examine change patterns for the EM latent variable to establish the baseline growth model. Chronological age was used as the metric of longitudinal change to improve interpretability and account for the effect of age as if it were a covariate in the model [51]. We centered age at 75 years (the approximate mean of the 40-year span of data). We established the best fitting latent growth model in the following sequence of tests (Supplementary Table 1): 1) fixed intercept model (assumes no inter- or intra-individual variation), 2) random intercept model (assumes no intra-individual differences but models inter-individual variability), 3) random intercept fixed slope model (allows inter-individual variation in level, but assumes all individuals change at the same rate), and 4) random intercept random slope model (allows inter-individual variation in initial level and change) [52]. Due to data collected up to a maximum of three times per individual participant, no non-linear models were tested for the growth model or for subsequent analyses. We did not use latent growth modeling for interpreting level or change based on predictors, but rather to create classes of memory change.
Statistical approach: memory trajectory classification
Using MPlus 7 [49], we objectively classified participants into distinct EM trajectory groups by performing LCGA for the entire sample (see [53]). EM data were used to determine memory trajectory class based on an algorithm that utilized both individualized level and slope. Specifically, two- to five-class models (two more than theoretically expected) [53] were tested. For each of the class models tested, we used the random intercept, random slope growth model that was fully constrained within each class (i.e., intercept and slope were constrained to be equal) in order to determine group differences [54]. We used recommended indices (AIC, BIC, -2LL, entropy) to compare the class models with the most parsimonious one-class model and assessed their relative fit (Supplementary Table 2). As in previous work, we identified a model with low AIC, BIC, and -2LL values, a high entropy value, greater than 100 participants in each class, and that corresponded to theoretical expectations [19]. Class membership was used for prediction analyses.
Statistical approach: predictors of SMA and DMA
We used R 3.2.5 [55] to perform RFA, stratified by age (young-old [n=435] and old-old [n=447]), to determine the most important (of 17) predictors of SMA and DMA status as compared with the benchmark (NMA). See Table 1 and Supplementary Table 3 for young-old, old-old distribution, and age. We also examined predictors of SMA as compared with DMA. As in previous work, RFA was selected as the optimal technique to test all predictors simultaneously [19]. RFA accommodates multiple predictors and variable sample sizes, and produces a ranking of the determinants in terms of importance in predicting memory status. Specifically, RFA is a recursive partitioning multivariate data exploration technique that combines predictions across multiple classification and regression trees (ntree), each based on a random sample of participants and predictor variables (mtry). We imputed missing predictor data (3% overall, ranging from 1% to 6% across risk and protection factors) using the “missForest” package [56, 57]. “missForest” is particularly useful when using mixed-type data as it can impute continuous and categorical data including complex interactions. It uses a random forest trained on the data matrix to predict missing values and can be run in parallel with other random forest packages.
We conducted RFA using the “Party” package [58]. Each forest was comprised of ntree = 1000 (which is sufficient for good model stability) and each potential split evaluated a random sample of mtry = 5 predictors (
RESULTS
Foundational statistical analyses
Initial analyses showed that a single-factor model for EM fit the data well. There was support for configural, metric, and partial scalar invariance (Supplementary Table 1). The best fitting latent growth model was a random intercept, random slope latent growth model (Supplementary Table 1). These results provide important evidence that 1) we are measuring the same construct across time, 2) there is age-related change in EM, and 3) there is considerable variability among individuals around that change. This provides further support for investigating objective classification of subgroups within this population.
Research Objective 1: Memory status classification
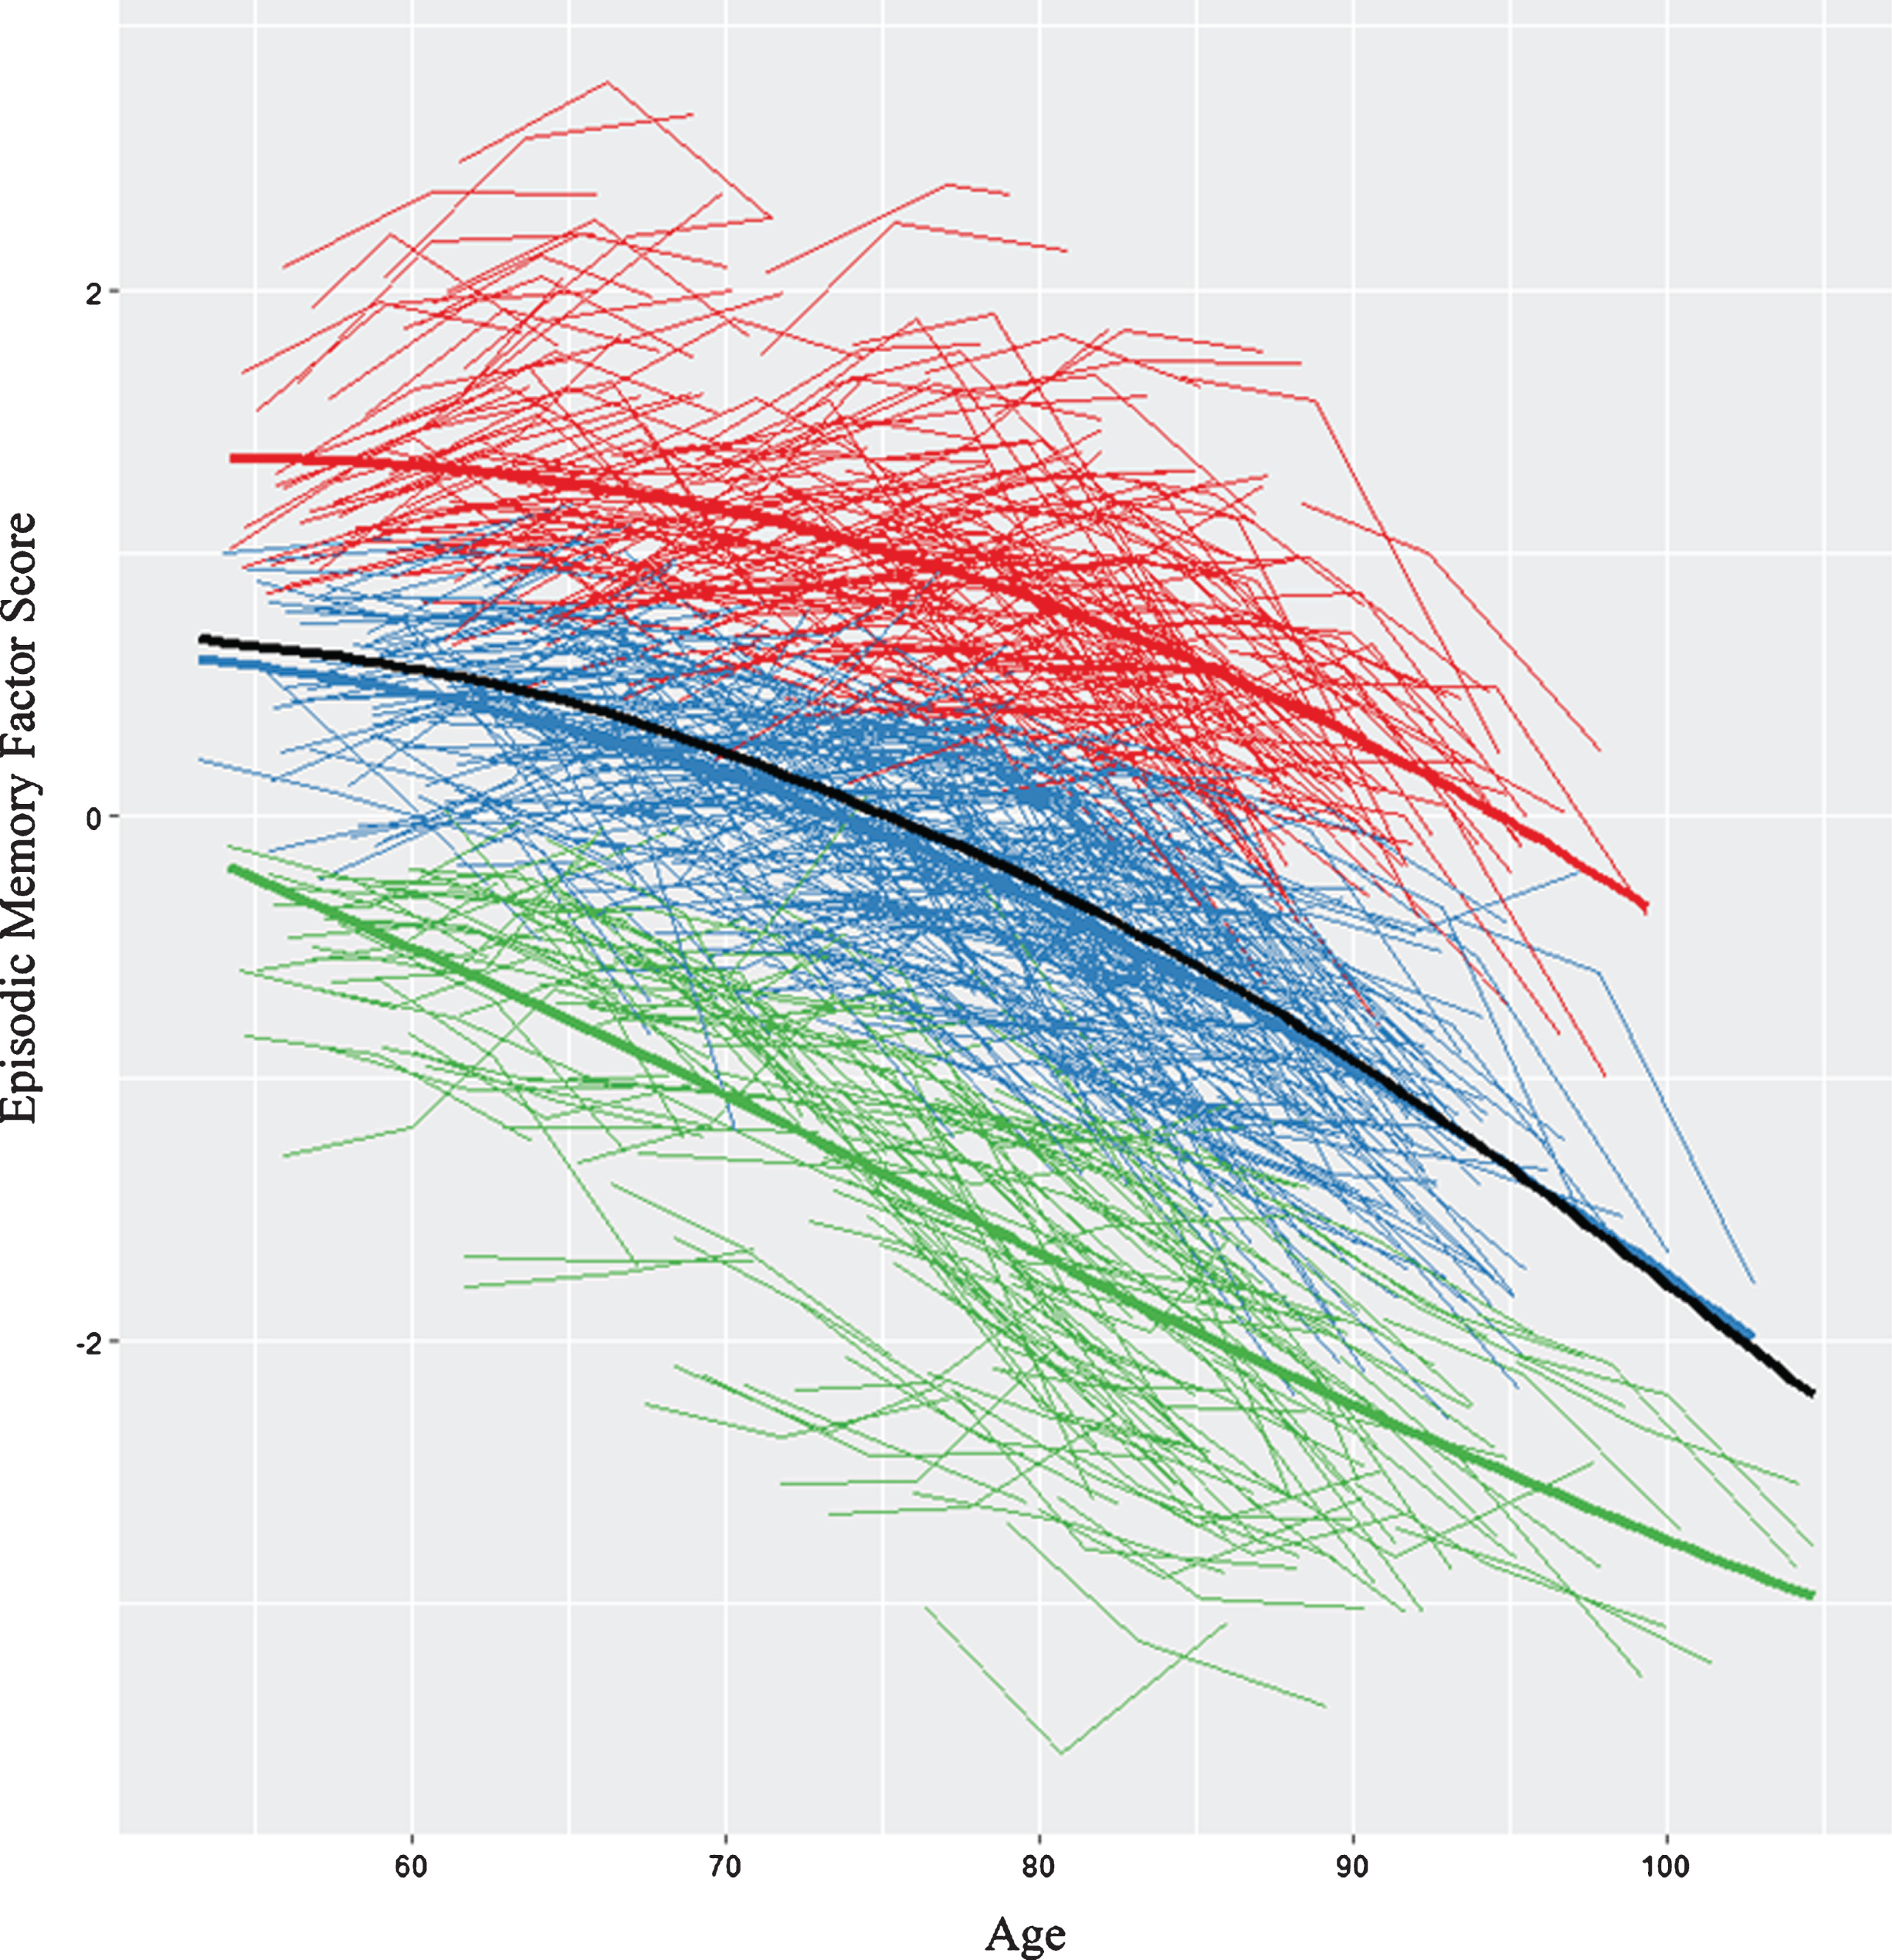
We first analyzed all (n = 882) individualized latent memory trajectories. The LCGA identified a 3-class model as the best-fitting solution (see Supplementary Table 2). Figure 1 displays the raw trajectory data for each individual supplemented by color coding that reflects the three observed classes. Mean trajectory lines for each class and for the overall sample are also provided. The model had a very good entropy value (0.80) and each class had more than 5% of the sample. The specific characteristics for each class are reported (see Supplementary Table 3). The top class (SMA) is defined empirically by an above-average, sustained memory trajectory characterized by higher and maintained memory scores over time (n = 276 [31%], intercept = 0.93, 95% CI, slope = -0.03, 95% CI [-0.030, -0.022]). The middle class (NMA) is characterized empirically by mid-range or average level (intercept) and a declining slope (n = 415 [47%], intercept = -0.12, 95% CI [-0.16, -0.09], slope = -0.04, 95% CI [-0.047, -0.039]). The lower class (DMA) is characterized by low intercept (i.e., factor scores below 0) and a steeper declining slope (DMA, n = 191 [22%], intercept = -1.3, 95% CI [-1.38, -1.31], slope = -0.056, 95% CI [-.068, -.050]). We conducted LCGA within our two established age groups (i.e., young-old, old-old) that confirmed memory class membership (i.e., >90%). The trajectory analyses provided evidence that within a group of non-demented older adults there is a potential for objectively detectable subclasses of performance. This supports undertaking prediction analyses to identify the risk/protection factors that discriminate these subclasses. See Table 1 for description of the 17 risk factors in full sample and for each of the three memory status groups.
Fig.1
We identified three memory classes based on episodic memory level and slope. The figure displays the raw trajectory data supplemented by color coding that reflects the three observed classes. Red represents stable memory aging (SMA), blue represents normal memory aging (NMA), and green represents declining memory aging (DMA). In addition, three overall mean trajectory lines (bolded lines) are displayed in the same colors. The black line represents overall latent growth change. The inflection point for the overall sample = 73.4 years (calculated using the “bede” function in R).
Research Objective 2: Risk predictors of SMA and DMA
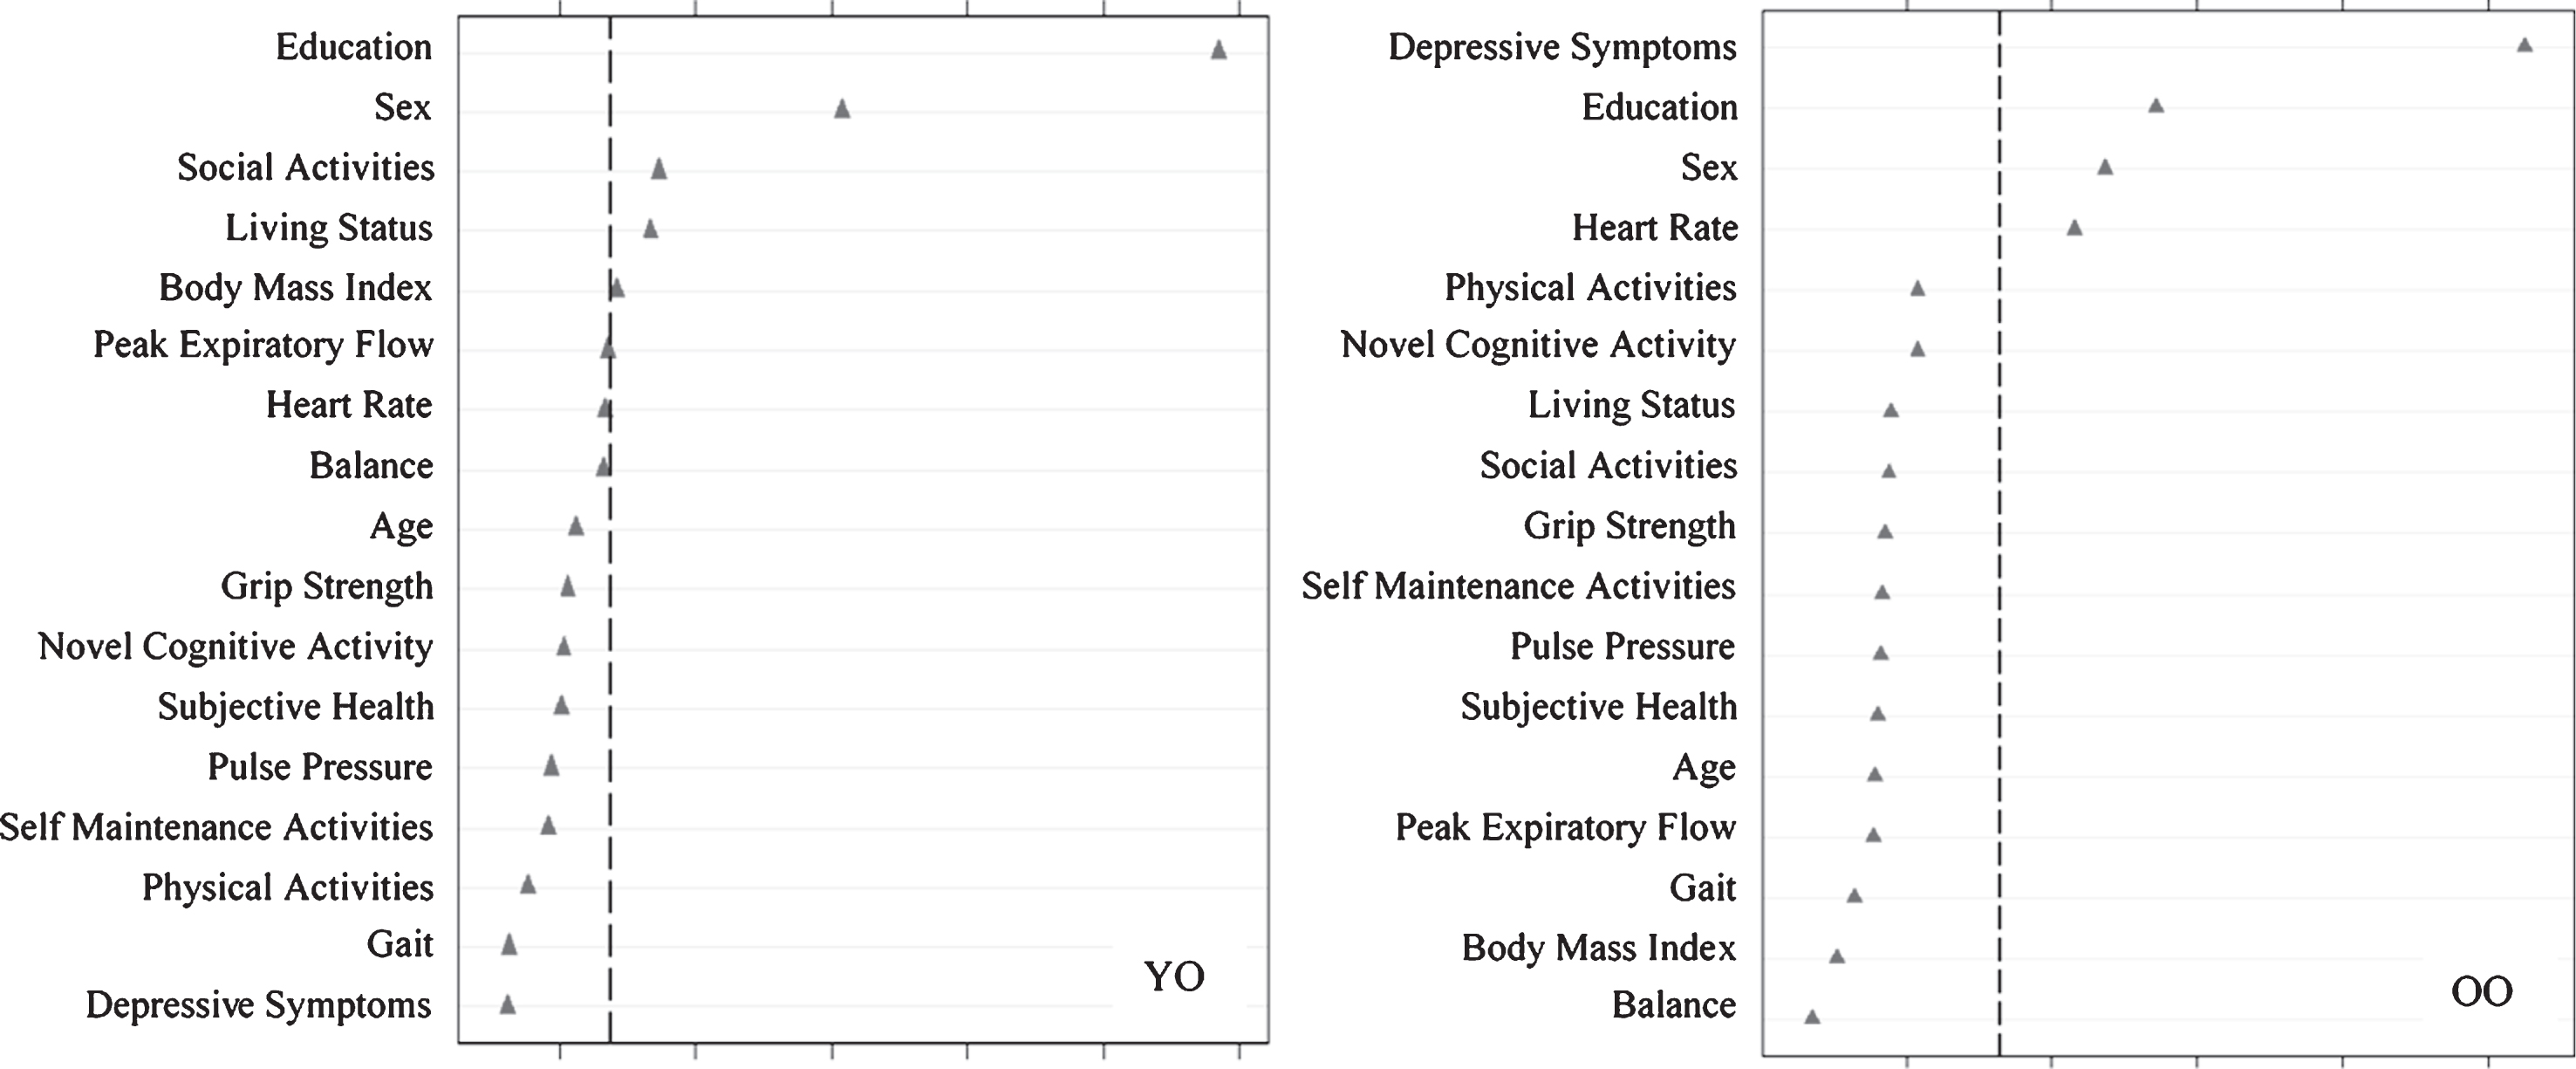
Using RFA, we computed the relative predictive importance of 17 risk factors in discriminating SMA from NMA as stratified by age (Fig. 2). Results showed that important predictors varied by age strata. For young-old adults, in order of importance, SMA was predicted by more education, female sex, more social activity, living with someone, and higher BMI (AUC = 0.60, 95% CI [0.54, 0.66]). For old-old adults, in order of importance, SMA was predicted by fewer depressive symptoms, more education, female sex, and higher heart rate (AUC = 0.60, 95% CI [0.54, 0.66]).
Fig.2
Relative importance of predictors of stable memory aging (SMA) versus normal memory aging (NMA) status for Young-Old (YO) and Old-Old (OO) adults. In both cases, ntree = 1000, mtry = 5. For YO, area under the curve = 0.60, n = 349. For OO, area under the curve = 0.60, n = 342.
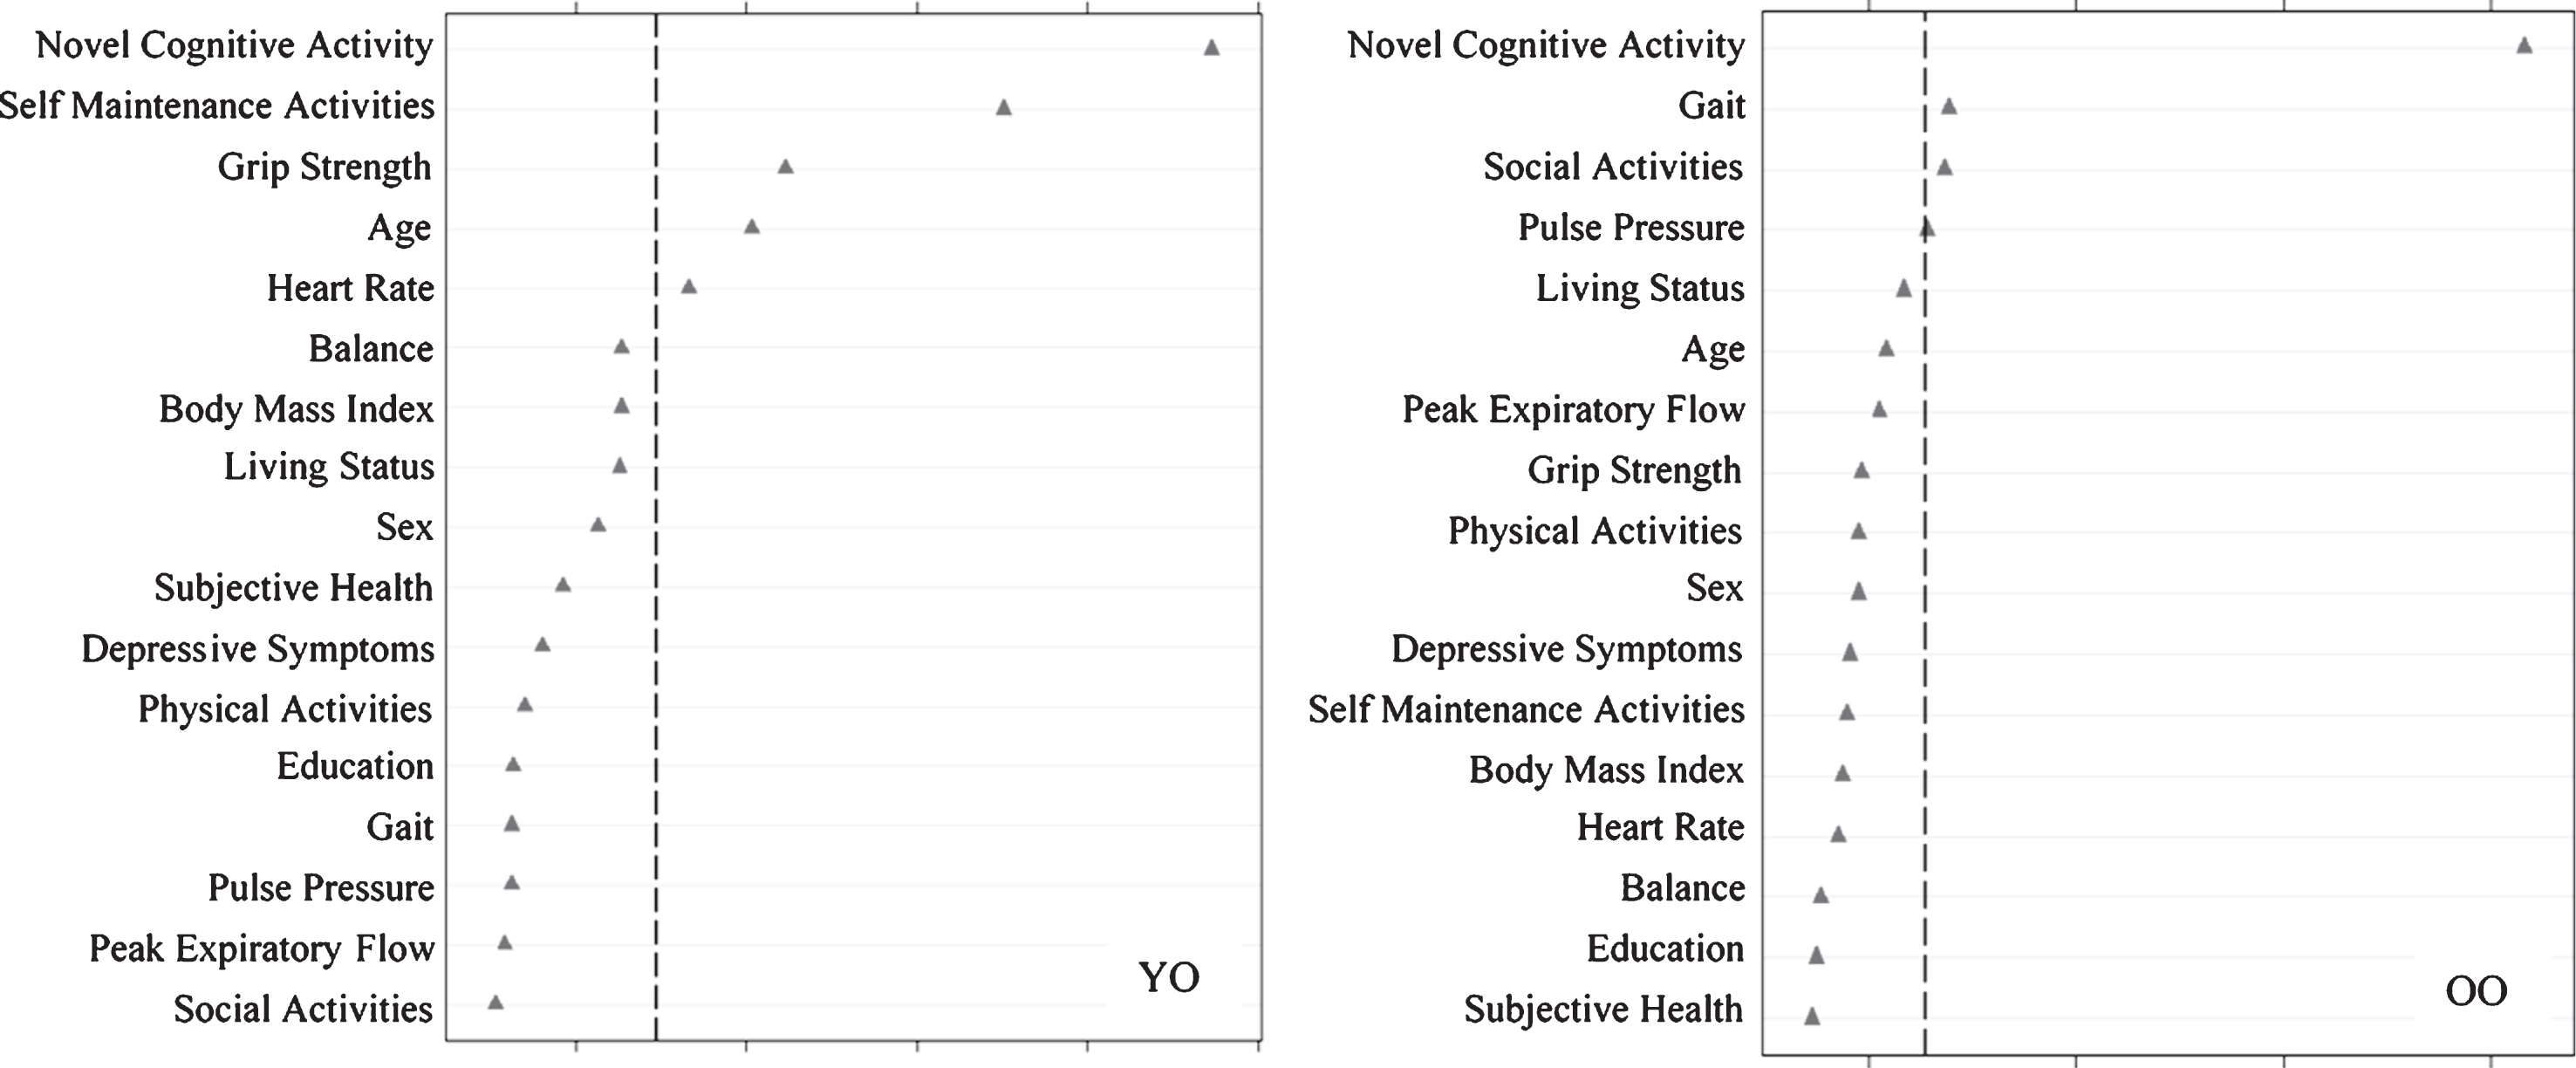
We then assessed predictors discriminating DMA from NMA status (Fig. 3) as stratified by age. Results showed that the important predictors also varied by age group and included factors that were both observed and not observed as predictors of SMA. For the young-old group, in order of importance, DMA was predicted by less novel cognitive activity, less self-maintenance activity, higher grip strength, younger age, and higher heart rate (AUC = 0.61, 95% CI [0.54, 0.69]). For old-old adults, DMA was predicted by less novel cognitive activity, slower gait, and less social activity (AUC = 0.62, 95% CI [0.55, 0.69]).
Fig.3
Relative importance of predictors of declining memory aging (DMA) versus normal memory aging (NMA) status for Young-Old (YO) and Old-Old (OO) adults. In both cases, ntree = 1000, mtry = 5. For YO, area under the curve = 0.61, n = 290. For OO, area under the curve = 0.62, n = 316.
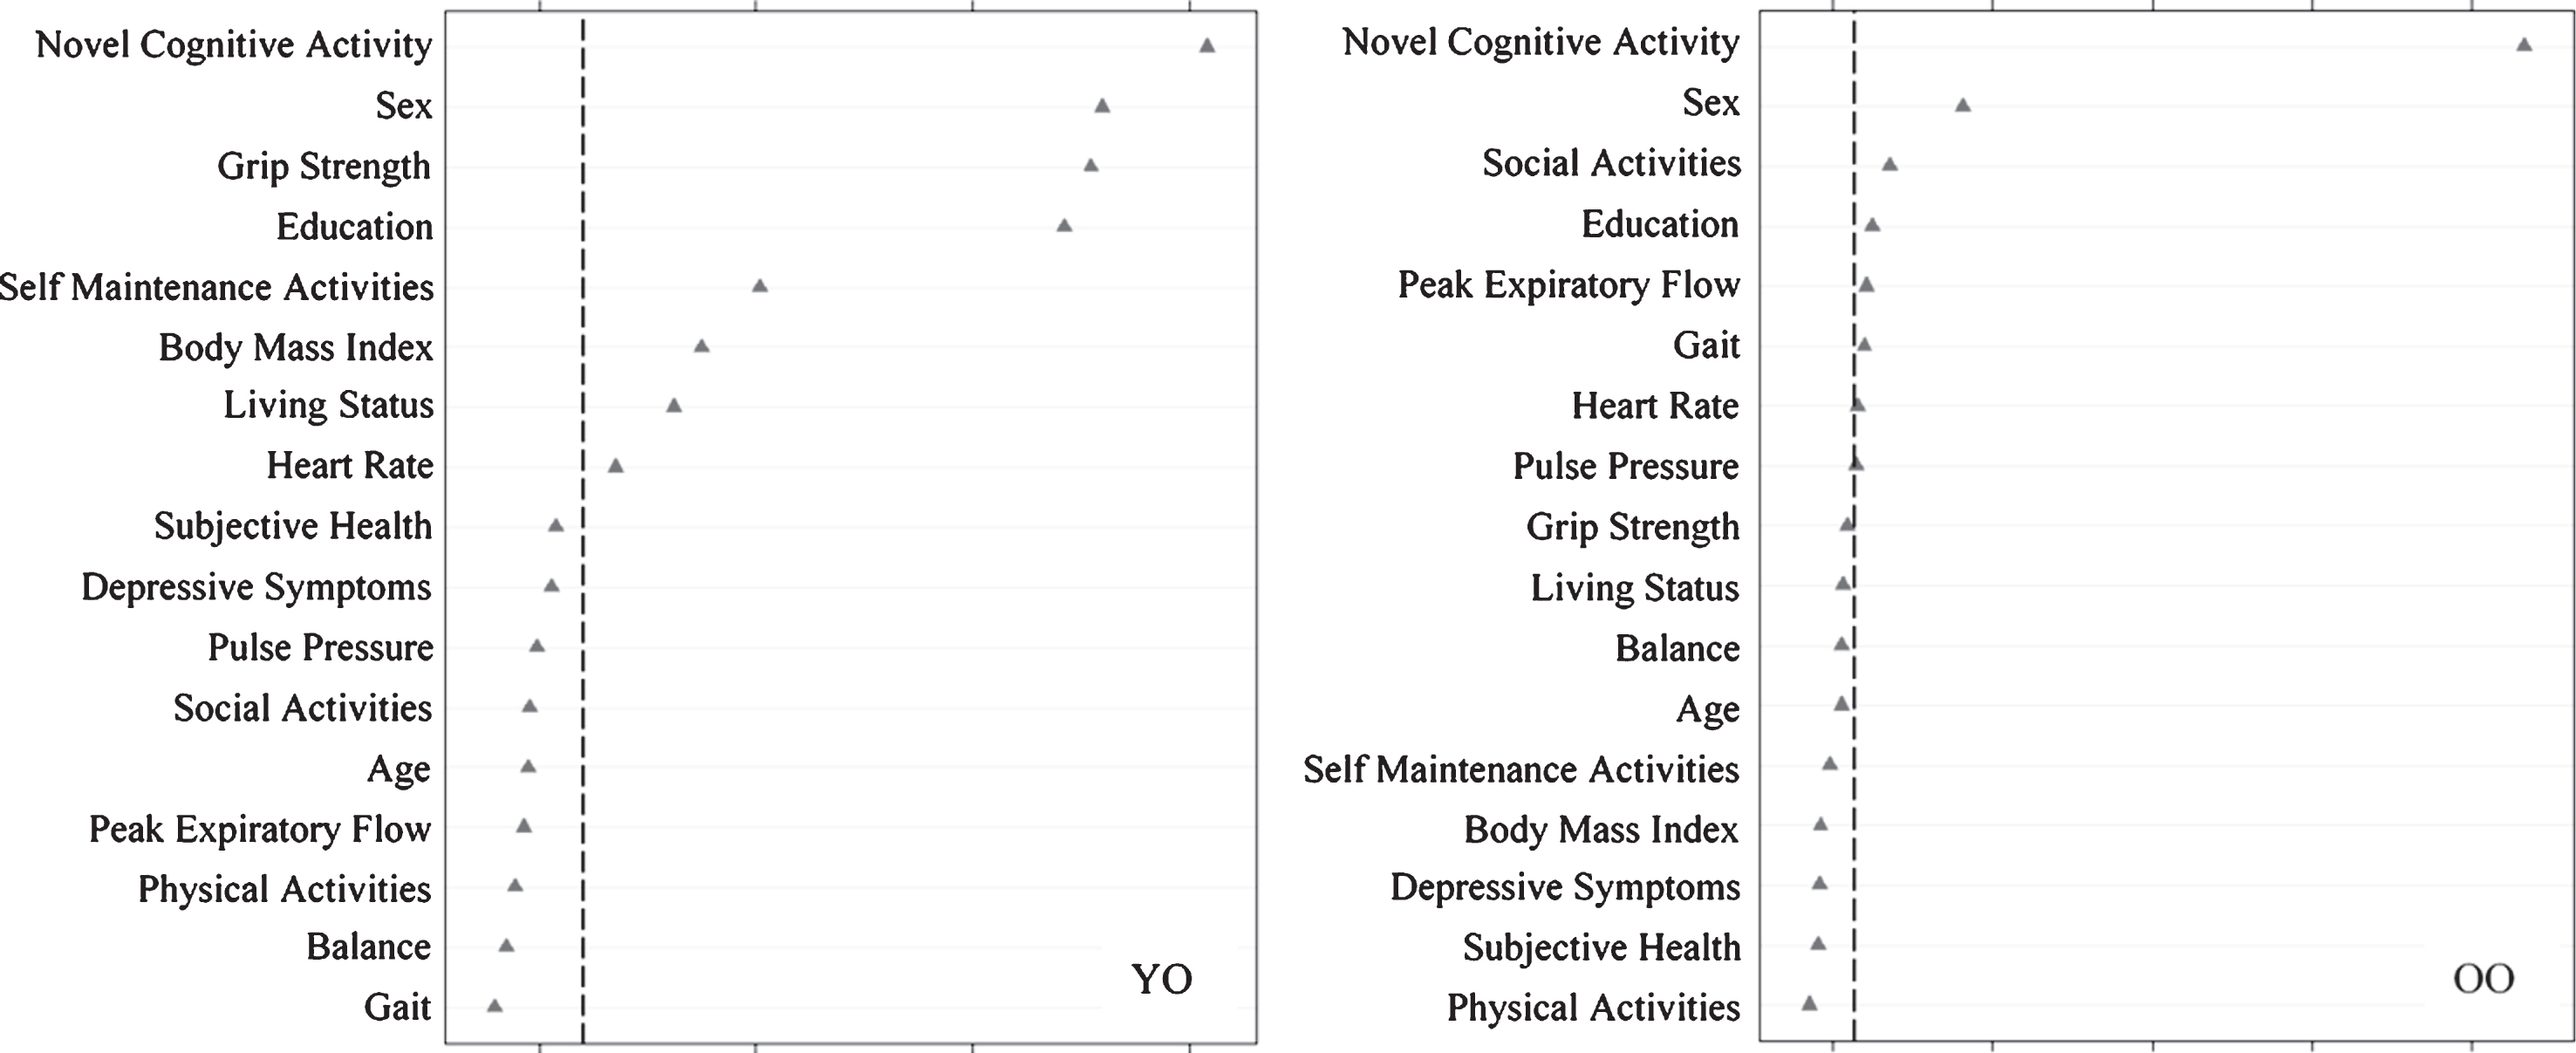
We then assessed predictors discriminating SMA from DMA status (Fig. 4) as stratified by age. For young-old adults, in order of importance, SMA group membership was predicted by more novel cognitive activity, female sex, lower grip strength, more education, more self-maintenance activity, higher BMI, living with someone, and lower heart rate (AUC = 0.70, 95% CI [0.63, 0.78]). For old-old adults, in order of importance, SMA group membership was predicted by more novel cognitive activity, female sex, more social activity, more education, lower peak expiratory flow, and faster gait (AUC = 0.74, 95% CI [0.68, 0.80]).
Fig.4
Relative importance of predictors of stable memory aging (SMA) versus declining memory aging (DMA) status for Young-Old (YO) and Old-Old (OO) adults. In both cases, ntree = 1000, mtry = 5. For YO, area under the curve = 0.70, n = 231. For OO, area under the curve = 0.74, n = 236.
DISCUSSION
The overall goal of this study was to link trajectory analyses of non-demented memory aging with established modifiable AD risk factors tested as predictors of both stable (relatively high) and declining (relatively low) memory classes. The purpose was to explore whether identified and potentially modifiable AD risk and protective factors were important predictors of non-demented memory change patterns. Future research could examine these factors to determine efficacy in promoting healthier memory aging or delaying (preventing) early and impairment-related memory decline. We emphasized modifiable risk and protective factor, considering only two non-modifiable biological risk variables (age and sex), influence in the competitive quantitative (machine learning) context of each other. Prediction analyses were conducted separately on young-old (55-72.4) and old-old (72.5-95) groups, reflecting the age-graded increase in AD risk and probability of multi-factorial involvement.
Integrating memory trajectory and prediction analyses
The selective risk prediction insights were built on the foundation provided by the first research objective results. Specifically, for this objective, we extended to a latent variable of memory the observation that there is dramatic inter-individual variability in level and slope of longitudinal trajectories in non-demented aging. This variability (Fig. 1) was essential to the premise that actual memory aging could be multi-directional and multi-factorial. Multiple influences and mechanisms could determine individualized trajectories and imply the need for precision intervention protocols. A latent variable has several advantages over single manifest variables that are often used in both observational and intervention research in dementia. By incorporating more than one indicator representing the same domain and integrating their shared common variance, the underlying construct can be more adequately estimated—a process that minimizes measurement error and establishes construct validity [40].
The subsequent analyses of the actual full-sample distribution of individualized trajectories produced three neighboring but statistically discriminable classes of memory aging status. These trajectory classes were distinguished by an algorithm including both level and slope information for each individual. The results of this analysis established that the expected broad distribution of memory trajectories in non-demented aging could be objectively classified in three neighboring, discriminable and interpretable phenotypes (i.e., SMA and DMA groups, with the intermediate NMA as the largest group). Although as yet not known from this study, these three classes may reflect predictably different probabilities of conversion to later impairment (perhaps especially amnestic impairment) and AD dementia. In addition to these observed “phenotypes” of dynamic memory aging, the prediction results demonstrated that these classes, although continuously distributed in level and slope, could be significantly discriminated by associated individual differences in AD-related risk and protective factors. We turn now to a brief discussion of prediction patterns.
Prediction results and potential mechanisms
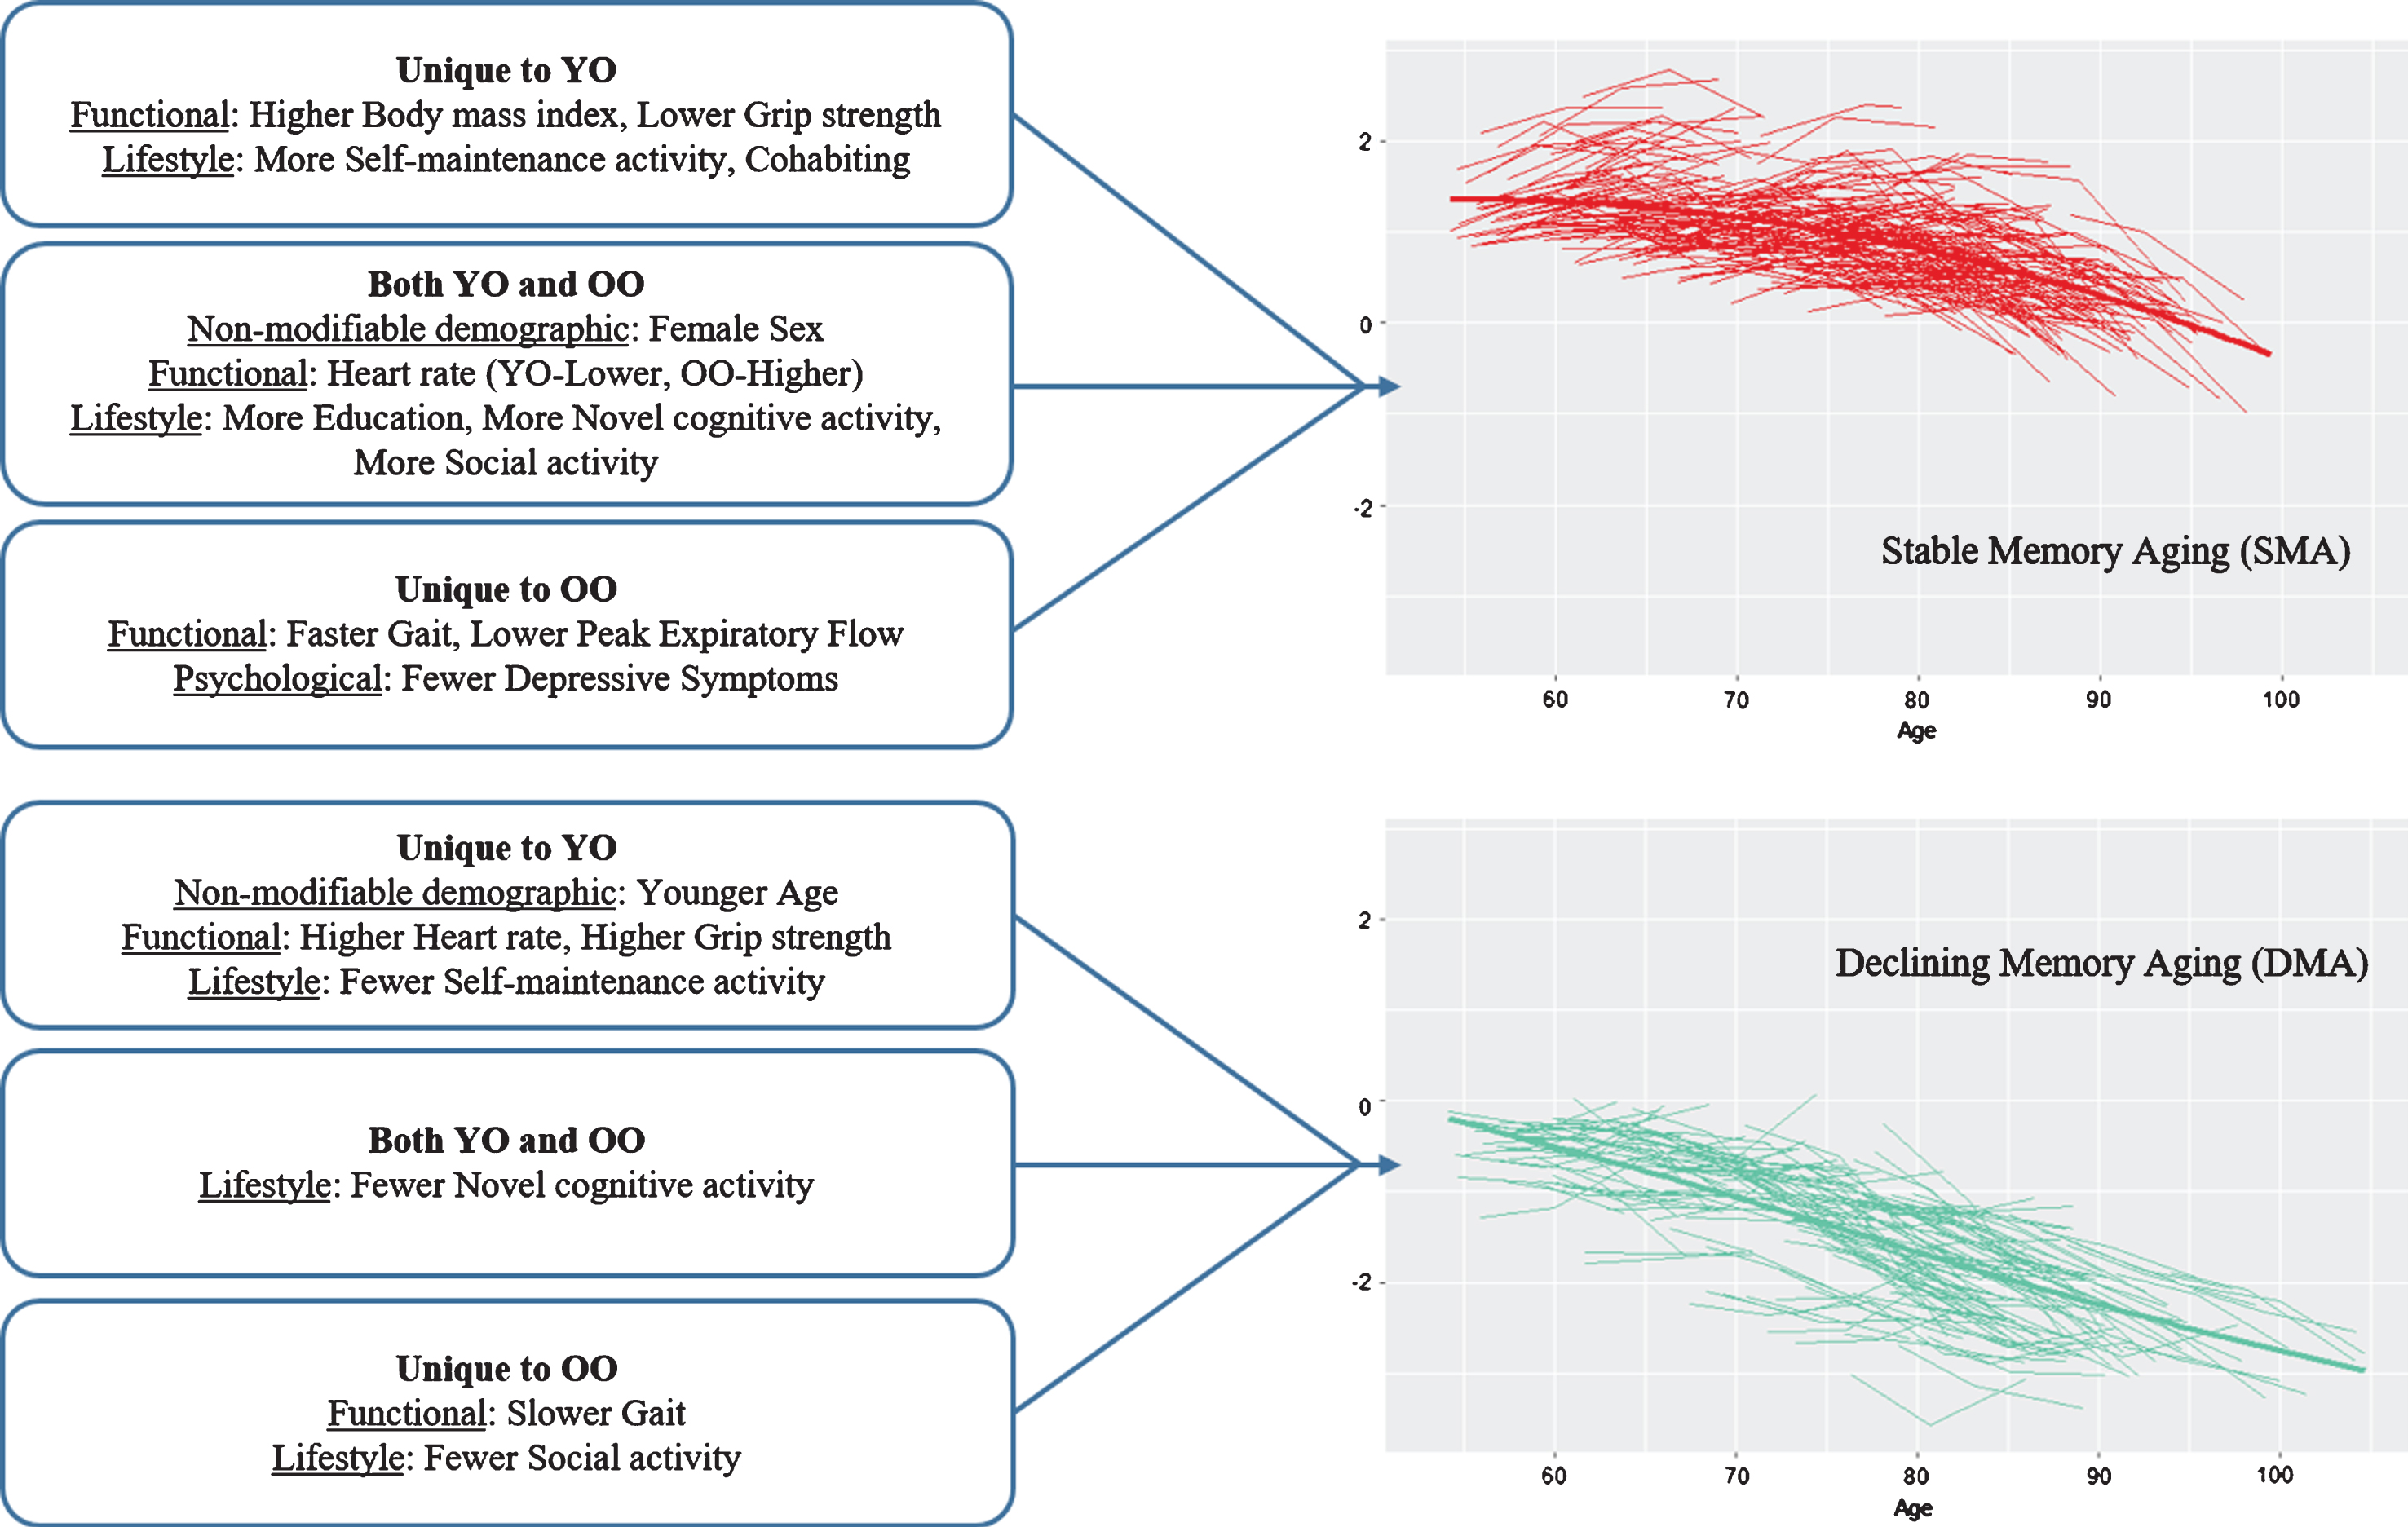
Overall, for the second objective, the results indicated that a substantial number of modifiable risk factors predicted SMA or DMA status but the predictors of SMA largely differed from those of DMA. The latter result indicates that the predictors (and mechanisms) underlying low and rapidly declining memory aging are not necessarily the same as (nor simply the opposite of) those predicting higher and stable memory aging. As can be seen in Table 2, both non-modifiable demographic factors (age, sex) also played a significant but selective role in the prediction results. Sex was an important predictor of SMA, with female sex a favorable attribute for healthier memory aging. Notably, sex did not predict DMA. Within the age strata, however, actual chronological age (limited in range) was not an important predictor of SMA but was for DMA in the young-old strata only. Notably, with some similarities, different predictors were significant for the young-old and the old-old strata. For comparison purposes, we depict the highlights of the age strata differences in SMA and DMA prediction patterns in Figure 5. More of the risk/protection factors predicted SMA than DMA and these predictors varied for young-old and old-old. Twelve of the 17 risk factors predicted SMA, 4 in young-old only, 3 in old-old only, and 5 in both age strata. Seven of the 17 risk factors predicted DMA, 4 in young-old only, 2 in old-old only, and 1 for both age strata. Notably, we may have identified more predictors for SMA than DMA because none of the risk/protection factors used in the present models were AD-specific genetic or biological markers potentially sensitive to preclinical memory decline. The precision modifiable predictors, although different for young-old and old-old, may be especially beneficial for SMA. One implication is that targets for promoting healthy memory aging may differ from targets for delaying exacerbated memory decline. Moreover, these targets may also vary for younger aging adults as compared with older aging adults and, in some cases, for females as compared with males.
Table 2
| Risk Factor | Predicting SMA/NMA1 | Predicting SMA/DMA1 | Predicting DMA/NMA1 | |||
| Young-Old | Old-Old | Young-Old | Old-Old | Young-Old | Old-Old | |
| Non-modifiable Demographic | ||||||
| Age3 | Younger | |||||
| Sex2,6 | Female | Female | Female | Female | ||
| Functional | ||||||
| Pulse Pressure5 | ||||||
| Peak Expiratory Flow2 | Lower | |||||
| Grip Strength4 | Lower | Higher | ||||
| Body Mass Index2 | Higher | Higher | ||||
| Heart Rate4 | Higher | Lower | Higher | |||
| Gait4 | Faster | Slower | ||||
| Balance5 | ||||||
| Psychological | ||||||
| Depressive Symptoms2 | Fewer | |||||
| Subjective Health5 | ||||||
| Lifestyle/Reserve | ||||||
| Living Status2 | Cohabiting | Cohabiting | ||||
| Education2,6 | More | More | More | More | ||
| Physical Activity5 | ||||||
| Novel Cognitive Activity4,6 | More | More | Fewer | Fewer | ||
| Social Activity4 | More | More | Fewer | |||
| Self-Maintenance Activity4 | More | Fewer | ||||
1 Predicting the first status against the benchmark. 2 Unique to SMA. 3 Unique to DMA. 4 Both SMA and DMA. 5 Not a significant predictor. 6 Most common predictors. SMA, stable memory aging; NMA, normal memory aging; DMA, declining memory aging.
Fig.5
Prediction patterns of risk and protection factors for Stable Memory Aging and Declining Memory Aging based on Young-Old (YO) and Old-Old (OO) stratum.
Our prediction analyses were conducted with powerful machine learning technology. RFA permits the evaluation of multiple predictors in a competitive context, accounts for correlations among predictors, identifies the relatively important predictors in order, and shows model performance advantages over logistic regression [65]. Although RFA is used in many unbiased biomarker discovery and validation studies, it does not provide information regarding the underlying mechanisms or interactive influences through which a given significant predictor exerts discriminating power for clinical groups. As discussed in multiple reviews, the mechanisms associated with many of the risk and protective factors we examined are as yet unknown. Such predictors reflect an accumulation of morbidity or protection and relatively broad and interactive influences. We consulted recent reviews to offer additional perspectives on how these dementia risk factors might also be influential in predicting differential non-demented memory trajectories [10, 12, 13, 15].
Sex and age
Our results highlight two precision non-modifiable markers that are relevant in select circumstances. Sex was included as a predictor because it is an established and important moderator of risk-dementia associations [66]. The Alzheimer’s Association [67] reported that higher prevalence of AD in females may be related to increased vulnerability as a function of 1) sex-related biological and genetic variations [68-72] and 2) gender-related risk factors [68, 73-75]. That sex (female) was an important predictor of SMA [19, 76] may be linked to frequent observations of sex differences in memory aging, AD prevalence, and AD-related neuro-genetic underpinnings [63]. Several dementia-related examples include memory performance [77], memory resilience [19], genetic (APOE) vulnerability [70] and protection [72], biological variation [67], lifestyle factors [68, 73-75], and neuritic plaque burden [69, 71, 78]. Together, these suggest different mechanisms and potential interventions across sex. In contrast, chronological age (within the strata) was not a significant predictor. Age is the most important AD risk factor and older age is associated with greater co-morbidities [70]. For the three prediction models, we stratified the sample by age due to the wide band of aging for which there are multiple (and potential different) risk factors and mechanisms underlying memory trajectories. In this restricted context, we found that actual age was not a robust predictor of memory trajectory class.
Modifiable SMA or DMA predictors
A well-known factor, education, measured in years and representing a general and cumulative (over the lifespan) variable, was confirmed as an important discriminative predictor of SMA for both young-old and old-old adults, but not for DMA. Not surprisingly, higher education is often linked with cognitive reserve and higher cognitive performance (but not decreased rates of decline) in older adulthood [10, 12, 13, 15, 79, 80]. Recent research reported that 12 months of late-life post-secondary education increased cognitive reserve in older adults [81]. It is also important to note that persons with higher education may engage in healthier lifestyles than their less educated colleagues. Two risk factors uniquely predicting SMA for young-old (but not old-old), were higher BMI and cohabitation. Although weight status literature is mixed regarding the effects of high BMI on memory aging [82], generally higher levels of BMI have been shown to negatively affect cognitive trajectories, including memory in older adults [83, 84]. Our findings support the observation that midlife obesity, not late-life obesity, is a greater risk factor for exacerbated memory decline in older adulthood [13, 82, 85]. Midlife obesity has been linked to pre-diabetes and metabolic syndrome that affect memory through decreased brain insulin production that is linked to amyloid clearance, inflammation, and lower levels of brain glucose [15]. The living status finding was consistent with literature that most often reports living with someone associated with better cognitive outcomes [3, 6]. Fewer depressive symptoms uniquely predicted SMA for old-old. Notably, there were no clinically significant depression cases in the present sample. Clinical depression, and perhaps depressive symptoms, are related to 1) brain pathology [86], 2) impaired cognitive ability [10, 87], and 3) dementia [12, 13, 15, 88]. Depressive symptoms in late life are not uncommon but are also potentially treatable and perhaps preventable. Assuming no progressive or degenerative condition, this result emphasizes the importance of promoting positive mental health in late life, as a potential moderating or preventive factor in the maintenance of exceptional brain and cognitive health [89, 90]. There were no additional modifiable predictors of DMA.
Modifiable predictors of both SMA and DMA
For young-old, lower heart rate predicted SMA and higher heart rate predicted DMA. In contrast, for old-old adults, higher heart rate predicted SMA. Although higher heart rate has been associated with lower cognitive performance in young-old adults [91], aging-related declines in maximum heart rate are common [92]. Exercise interventions that target increased heart rate have been shown to improve memory and increase hippocampal volume [93]. Social activity (more) predicted SMA in young-old and old-old adults whereas fewer social activities predicted DMA in old-old. This pattern supports research reporting that more social activity is consistently associated with lower risk of AD and dementia [10, 12].
Modifiable predictors of SMA versus DMA comparison
As expected, five additional predictors of SMA beyond those identified in the SMA-NMA analyses were detected. These results included exemplars of functional (grip strength, expiratory flow, gait) and lifestyle (novel cognitive activity, self-maintenance activity) factors. An implication for replication or extension for interventions aimed at promoting healthy memory aging is that a larger set of potential memory support factors may be relevant. Notably, this direct SMA-DMA comparison identified more predictors in both age strata (young-old 4 more; old-old 3 more) and these additional predictors were different. This suggests that more precision may be required for intervention in later ages. One precision marker potentially important to young-old adults in promoting SMA and delaying DMA was grip strength. Lower grip predicted SMA and higher grip predicted DMA. Although grip strength is a marker of muscle strength and has been considered a marker of biological vitality, previous grip strength associations to memory are mixed, possibly due to the memory measures being investigated [34]. Lower peak expiratory flow uniquely predicted SMA for old-old adults. These findings contrast the generally reported lower midlife pulmonary function associated with lower cognitive scores and higher risk of MCI and dementia 23 years later [33]. Improvement of pulmonary function may be associated with increased levels of oxygen in the brain resulting in improved cognitive function and less dementia risk. Gait was an additional marker important in promoting SMA and delaying DMA unique to old-old. Faster gait predicted SMA and slower gait predicted DMA. Change in walking speed has previously been linked to fluid cognition changes [34] and may be a prodromal indicator of dementia [94]. Notably, interventions targeting both respiration and mobility have shown promising benefits for improving or maintaining cognitive function in aging [35, 95].
Across both age strata, less novel cognitive activity was a leading predictor of DMA and more novel cognitive activity was predictive of SMA. Research has shown that increased novel cognitive activity has been associated with cognitive resilience [19] and may enhance cognitive reserve or compensate for other risk factors associated with memory deficits [15, 48, 96, 97]. Novel cognitive activity is relevant to promoting healthy memory aging (i.e., SMA) and for preventing decline (i.e., DMA). Self-maintenance activities were potentially important for promoting SMA (more) and delaying DMA (fewer) for young-old adults only, supporting findings that fewer self-maintenance activities are predictive of mild cognitive performance [37]. That this predictor was only identified in young-old adults indicates early intervention may be advisable for self-maintenance.
Limitations and strengths
Six limitations are noted. First, by design our participants are relatively healthy, predominantly white (non-Hispanic), and (deliberately) non-demented. As such, they represent a pool of older adults for whom interventions including modifiable risk or protective factors for memory may be objectively identified and profitably tested. Although they are not representative of the full population of worldwide aging adults, this sample reflects a large segment of older adults in some industrialized countries and it is similar in composition to other studies investigating memory trajectories of normal, exceptional, stable, resilient, or pre-impaired adults [3, 9, 98]. Second, although we tested 17 predictors as derived from related literatures, not all risk and protection factors identified in the literature were included. Some of the risk factors were available in the data set but were not sufficiently represented in the sample to be included in the analyses (i.e., diabetes, smoking, alcohol, and hearing loss). In addition, some of the risk factors from the literature were not available in the VLS battery (i.e., cholesterol level, fish intake, and pesticide exposure). Due to the planned analyses that take into account a band of aging between 53 and 95 years, modifiable predictors measured at baseline are necessarily recorded at different ages according to the first time point of each individual’s trajectory. Third, this VLS sample does not have full genetic or AD biomarker data. Accordingly, our goal in this study was to conduct prediction analyses using a set of non-invasive and relatively modifiable risk factors commonly found in observational studies and easily translatable to non-demented populations. We recommend further research integrating other modalities of biomarkers and risk factors for the prediction of non-demented memory trajectory classes. For the present study, we concentrated on identifying a variety of memory-risk-related participant characteristics, many of which are modifiable, and examined them in a competitive context as stratified by age. Fourth, the AUC values for our RFAs were moderate (range = 0.6 to 0.7), which may reflect our focus on mostly modifiable predictors from three domains of memory risk and the fact that the participants were non-demented. Our present purpose was not to derive the best set of diagnostic biomarkers but to generate an empirically supported list of important predictors for future evidence-based research and intervention protocols focused on non-demented populations. Future research with less modifiable biomarkers (e.g., APOE genetic risk) could absorb more of the predictive variance of our analyses, although genetic variations of normal memory aging are inconsistent [99, 100]. Such analyses could also point to a likely smaller set of modifiable predictors that emerge in the context of AD biomarkers. Fifth, our DMA group is not classified according to mild cognitive impairment criteria, and we do not have outcome information for their progression beyond the present final wave. The DMA classification is, however, based on key information often lacking (or estimated) in MCI approaches; namely, level of performance on multiple memory measures (represented as a factorially valid latent variable) and on actual trajectories of change. Sixth, for applied and prevention work, the operative and modifiable risk factors (and intervention targets) varied in this study by late-life age group, indicating the importance of designing precision-based protocols. Although examining these precision targets at midlife was beyond the scope of this study, midlife risk and protection factors should be considered in future research.
Among strengths, we note our novel and objective classification of SMA and DMA status using a robust and reliable latent EM variable (confirmed for measurement invariance over three waves). Our approach to identifying an SMA group was based on LCGA specifications of individualized level and slope information in the context of a large distribution of memory trajectories. Quantitative analyses of longitudinal memory level and change data produced objective classifications corresponding to a continuum of non-demented and not-known-to-be impaired memory aging. Second, we used a substantial, well-characterized sample spanning a 40-year band of aging and employed an integrated set of powerful statistical techniques. Third, the availability of a comparatively large NMA control group was leveraged to develop the notable predictor comparisons between the SMA group and both the NMA and DMA group. This provides useful knowledge for interpretation and potential intervention plans. Fourth, we used age information in three ways. Actual age in years was the metric along which the trajectories were plotted and the LCGA were conducted. This was the equivalent of including age as a covariate in the analyses, but permitted the accelerated design employed in this study. Shifting to the prediction analyses, age group was a stratification variable, with all analyses conducted separately within the two 20-year strata. Given the broad band of aging represented in this design, this approach permitted the specific evaluation of the potential differences in memory trajectory predictors for younger-old and older-old adults. As shown in Figure 5, this provided important and precision-based insight into the differential associations—and likely intervention targets—for these two subsets of older adults. Finally, within each stratum actual age was included as a predictor in order to assess whether it predicted trajectory status even within the restricted range of an age strata.
In summary, we provide evidence that three memory classes or phenotypes can be derived objectively from a broad distribution of non-demented memory trajectories. Moreover, substantial variance associated with a sustained healthy memory aging class and a rapidly declining memory class can be predicted by standard (i.e., present in most longitudinal studies) risk markers from four common domains (non-modifiable demographic, functional, psychological, lifestyle). In addition, all domains contributed predictors in at least some models. Whereas adults who experience severe cognitive decline have a greater risk of disease and death [101–103], cognitive maintenance is demonstrably associated with functional independence, increased quality of life, and decreased risk of death [104, 105]. Our prediction results identified selective modifiable risk or protective factors that could be converted to potential intervention targets for the twin purposes of 1) promoting healthy memory aging or 2) preventing or delaying accelerated decline, impairment, and perhaps dementia. Notably, these factors predicting stable memory performance are different from the factors associated with declining memory trajectories. That these also vary by age strata (within aging) supports the notion that precision health solutions may be carefully tailored to specific detectable and relevant categories of older adults, namely age category and memory trajectory class. That sex is a prominent predictor for SMA (but not DMA) points to future observational disaggregation and precision targeting of intervention goals for males and females.
ACKNOWLEDGMENTS
Roger Dixon acknowledges support for this research by grants from the National Institutes of Health (National Institute on Aging; R01 AG008235), the Canadian Consortium on Neurodegeneration in Aging (with funding from the Canadian Institutes of Health Research and partners), and the Canada Research Chairs program. We appreciate the many important contributions of VLS staff and participants.
Authors’ disclosures available online (https://www.j-alz.com/manuscript-disclosures/18-0571r2).
SUPPLEMENTARY MATERIAL
[1] The supplementary material is available in the electronic version of this article: http://dx.doi.org/10.3233/JAD-180571.
REFERENCES
[1] | Dixon RA , Small BJ , MacDonald SWS , McArdle JJ ((2012) ) Yes, memory declines with aging—but when, how, and why? In Memory and aging: Current issues and future directions, Naveh-Benjamin M, Ohta N, eds. Psychology Press, New York, NY, pp. 325–347. |
[2] | Hochstetler H , Trzepacz PT , Wang S , Yu P , Case M , Henley DB , Degenhardt E , Leoutsakos J-M , Lyketsos CG ((2016) ) Empirically defining trajectories of late-life cognitive and functional decline. J Alzheimers Dis 50: , 271–282. |
[3] | Josefsson M , Luna X , Pudas S , Nilsson LG , Nyberg L ((2012) ) Genetic and lifestyle predictors of 15-Year longitudinal change in episodic memory. J Am Geriatr Soc 60: , 2308–2312. |
[4] | Nyberg L , Lövdén M , Riklund K , Lindenberger U , Bäckman L ((2012) ) Memory aging and brain maintenance. Trends Cogn Sci 16: , 292–305. |
[5] | Raz N , Ghisletta P , Rodrigue KM , Kennedy KM , Lindenberger U ((2010) ) Trajectories of brain aging in middle-aged and older adults: regional and individual differences. Neuroimage 51: , 501–511. |
[6] | Yaffe K , Fiocco AJ , Lindquist K , Vittinghoff E , Simonsick EM , Newman AB , Satterfield S , Rosano C , Rubin SM , Ayonayon HN , Harris TB , Health ABCS ((2009) ) Predictors of maintaining cognitive function in older adults: the Health ABC study. Neurology 72: , 2029–2035. |
[7] | Depp CA , Harmell A , Vahia IV ((2012) ) Successful cognitive aging. In Behavioral Neurobiology of Aging, Pardon M-C, Bondi MW, eds. Springer, Berlin Heidelberg, pp. 35–50. |
[8] | Gefen T , Shaw E , Whitney K , Martersteck A , Stratton. J , Rademaker A , Weintraub S , Mesulam M-M , Rogalski E ((2014) ) Longitudinal neuropsychological performance of cognitive superagers. J Am Geriatr Soc 62: , 1598. |
[9] | Zahodne LB , Schupf N , Brickman AM , Mayeux R , Wall MM , Stern Y , Manly JJ ((2016) ) Dementia risk and protective factors differ in the context of memory trajectory groups. J Alzheimers Dis 52: , 1013–1020. |
[10] | Dixon RA , Lachman ME ((2019) ) Risk and protective factors in cognitive aging: advances in assessment, prevention, and promotion of alternative pathways. In The Aging Brain: Functional Adaptation Across Adulthood, Samanez-Larkin G, ed. American Psychological Association, Washington, DC. |
[11] | Anstey KJ ((2014) ) Optimizing cognitive development over the life course and preventing cognitive decline: Introducing the Cognitive Health Environment Life Course Model (CHELM). Int J Behav Dev 38: , 1–10. |
[12] | Anstey KJ , Eramudugolla R , Hosking DE , Lautenschlager NT , Dixon RA ((2015) ) Bridging the translation gap: From dementia risk assessment to advice on risk reduction. J Prev Alzheimers Dis 2: , 189–198. |
[13] | Barnes DE , Yaffe K ((2011) ) The projected effect of risk factor reduction on Alzheimer’s disease prevalence. Lancet Neurol 10: , 819–828. |
[14] | Daffner KR ((2010) ) Promoting successful cognitive aging: A comprehensive review. J Alzheimers Dis 19: , 1101–1122. |
[15] | Livingston G, Sommerlad A, Orgeta V, Costafreda SG, Huntley J, Ames D, Ballard C, Banerjee S, Burns A, Cohen-Mansfield J, Cooper C, Fox N, Gitlin LN, Howard R, Kales HC, Larson E, Ritchie K, Rockwood K, Sampson EL, Samus Q, Schneider LS, G, Teri L, Mukadam N Dementia prevention, intervention, and care. Lancet 390: , 2673–2734. |
[16] | Boyle PA , Buchman AS , Wilson RS , Leurgans SE , Bennett DA ((2010) ) Physical frailty is associated with incident mild cognitive impairment in community-based older persons. J Am Geriatr Soc 58: , 248–255. |
[17] | Wilson R , Leurgans S , Boyle P , Schneider. J , Bennett D ((2010) ) Neurodegenerative basis of age-related cognitive decline. Neurology 75: , 1070–1078. |
[18] | Kaup AR , Nettiksimmons. J , Harris TB , Sink KM , Satterfield S , Metti AL , Ayonayon HN , Yaffe K ((2015) ) Cognitive resilience to apolipoprotein E ɛ4: contributing factors in black and white older adults. JAMA Neurol 72: , 340–348. |
[19] | McDermott KL , McFall GP , Andrews SJ , Anstey KJ , Dixon RA ((2017) ) Memory resilience to Alzheimer’s genetic risk: sex effects in predictor profiles. J Gerontol B Psychol Sci Soc Sci 72: , 937–946. |
[20] | Stern Y ((2009) ) Cognitive reserve. Neuropsychologia 47: , 2015–2028. |
[21] | Harrison TM , Weintraub S , Mesulam M-M , Rogalski E ((2012) ) Superior memory and higher cortical volumes in unusually successful cognitive aging. J Int Neuropsychol Soc 18: , 1081–1085. |
[22] | Rogalski EJ , Gefen T , Shi. J , Samimi M , Bigio E , Weintraub S , Geula C , Mesulam M-M ((2013) ) Youthful memory capacity in old brains: anatomic and genetic clues from the Northwestern SuperAging Project. J Cogn Neurosc 25: , 29–36. |
[23] | de Frias CM , Dixon RA ((2014) ) Lifestyle engagement affects cognitive status differences and trajectories on executive functions in older adults. Arch Clin Neuropsychol 29: , 16–25. |
[24] | de Frias CM , Dixon RA , Strauss E ((2009) ) Characterizing executive functioning in older special populations: From cognitively elite to cognitively impaired. Neuropsychology 23: , 778–791. |
[25] | Dixon RA , de Frias CM ((2014) ) Cognitively elite, cognitively normal, and cognitively impaired aging: neurocognitive status and stability moderate memory performance. J Clin Exp Neuropsychol 36: , 418–430. |
[26] | McFall GP , Wiebe SA , Vergote D , Westaway D , Jhamandas J , Bäckman L , Dixon RA ((2015) ) ApoE and pulse pressure interactively influence level and change in the aging of episodic memory: protective effects among ɛ2 carriers. Neuropsychology 29: , 388–401. |
[27] | Anstey KJ , Cherbuin N , Herath PM ((2013) ) Development of a new method for assessing global risk of Alzheimer’s disease for use in population health approaches to prevention. Prev Sci 14: , 411–421. |
[28] | Hertzog C , Dixon RA , Hultsch DF , MacDonald SW ((2003) ) Latent change models of adult cognition: are changes in processing speed and working memory associated with changes in episodic memory? Psychol Aging 18: , 755–769. |
[29] | Salthouse TA ((2003) ) Memory aging from 18 to 80. Alzheimer Dis Assoc Disord 17: , 162–167. |
[30] | Andrews SJ , Eramudugolla R , Velez JI , Cherbuin N , Easteal S , Anstey KJ ((2017) ) Validating the role of the Australian National University Alzheimer’s Disease Risk Index (ANU-ADRI) and a genetic risk score in progression to cognitive impairment in a population-based cohort of older adults followed for 12 years. Alzheimers Res Ther 9: , 16. |
[31] | Dixon RA , de Frias CM ((2007) ) Mild memory deficits differentially affect 6-year changes in compensatory strategy use. Psychol Aging 22: , 632. |
[32] | Brainerd CJ , Reyna VF , Petersen RC , Smith GE , Taub ES ((2011) ) Is the apolipoprotein e genotype a biomarker for mild cognitive impairment? Findings from a nationally representative study. Neuropsychology 25: , 679–689. |
[33] | Vidal JS , Aspelund T , Jonsdottir MK , Jonsson PV , Harris TB , Lopez OL , Gudnason V , Launer LJ ((2013) ) Pulmonary function impairment may be an early risk factor for late-life cognitive impairment. J Am Geriatr Soc 61: , 79–83. |
[34] | Clouston SA , Brewster P , Kuh D , Richards M , Cooper R , Hardy R , Rubin MS , Hofer SM ((2013) ) The dynamic relationship between physical function and cognition in longitudinal aging cohorts. Epidemiol Rev 35: , 33–50. |
[35] | Zhao E , Tranovich MJ , Wright VJ ((2014) ) The role of mobility as a protective factor of cognitive functioning in aging adults: a review. Sports Health 6: , 63–69. |
[36] | Wahlin Å , MacDonald SW , de Frias CM , Nilsson L-G , Dixon RA ((2006) ) How do health and biological age influence chronological age and sex differences in cognitive aging: moderating, mediating, or both? Psychol Aging 21: , 318. |
[37] | Dolcos S , MacDonald SW , Braslavsky A , Camicioli R , Dixon RA ((2012) ) Mild cognitive impairment is associated with selected functional markers: Integrating concurrent, longitudinal, and stability effects. Neuropsychology 26: , 209. |
[38] | Han W , Sapkota S , Camicioli R , Dixon RA , Li L ((2017) ) Profiling novel metabolic biomarkers for Parkinson’s disease using in-depth metabolomic analysis. Mov Disord 32: , 1720–1728. |
[39] | Huan T , Tran T , Zheng. J , Sapkota S , MacDonald SW , Camicioli R , Dixon RA , Li L ((2018) ) Metabolomics analyses of saliva detect novel biomarkers of Alzheimer’s disease. J Alzheimers Dis 65: , 1401–1416. |
[40] | Little TD ((2013) ) Longitudinal structural equation modeling, Guilford Press, New York, NY. |
[41] | McArdle JJ , Nesselroade JR ((2014) ) Longitudinal data analysis using structural equation models, American Psychological Association. |
[42] | Galbraith S , Bowden J , Mander A ((2017) ) Accelerated longitudinal designs: an overview of modelling, power, costs and handling missing data. Stat Methods Med Res 26: , 374–398. |
[43] | Sapkota S , Bäckman L , Dixon RA ((2017) ) Executive function performance and change in aging is predicted by apolipoprotein e, intensified by catechol-O-methyltransferase and brain-derived neurotrophic factor, and moderated by age and lifestyle. Neurobiol Aging 52: , 81–89. |
[44] | Dixon RA , Wahlin Å , Maitland SB , Hultsch DF , Hertzog C , Bäckman L ((2004) ) Episodic memory change in late adulthood: generalizability across samples and performance indices. Mem Cognit 32: , 768–778. |
[45] | Lezak MD ((1983) ) Neuropsychological assessment, Oxford University Press, New York, NY. |
[46] | Vakil E , Blachstein H ((1993) ) Rey Auditory-Verbal Learning Test: Structure analysis. J Clin Psychol 49: , 883–890. |
[47] | Lewinsohn PM , Seeley JR , Roberts RE , Allen NB ((1997) ) Center for Epidemiologic Studies Depression Scale (CES-D) as a screening instrument for depression among community-residing older adults. Psychol Aging 12: , 277. |
[48] | Runge SK , Small BJ , McFall GP , Dixon RA ((2014) ) APOE moderates the association between lifestyle activities and cognitive performance: Evidence of genetic plasticity in aging. J Int Neuropsychol Soc 20: , 478. |
[49] | Muthén LK, Muthén BO ((1998) - (2017) ) Mplus User’s Guide, Muthén & Muthén, Los Angeles, CA. |
[50] | Kline RB ((2011) ) Principles and practice of structural equation modeling, Guilford Press, New York, NY. |
[51] | Terrera GM , Brayne C , Matthews F ((2010) ) One size fits all? Why we need more sophisticated analytical methods in the explanation of trajectories of cognition in older age and their potential risk factors. Int Psychogeriatr 22: , 291–299. |
[52] | Singer JD , Willett JB ((2003) ) Applied longitudinal data analysis: Modeling change and event occurrence, Oxford University Press; US, New York, NY. |
[53] | Ram N , Grimm KJ ((2009) ) Methods and measures: Growth mixture modeling: A method for identifying differences in longitudinal change among unobserved groups. Int J Behav Dev 33: , 565–576. |
[54] | Jung T , Wickrama K ((2008) ) An introduction to latent class growth analysis and growth mixture modeling. Soc Personal Psychol Compass 2: , 302–317. |
[55] | R Development Core Team ((2015) ) R: A language and environment for statistical computing. R Foundation for Statistical Computing, Vienna, Austria. |
[56] | Stekhoven DJ , Bühlmann P ((2012) ) MissForest—non-parametric missing value imputation for mixed-type data. Bioinformatics 28: , 112–118. |
[57] | Waljee AK , Mukherjee A , Singal AG , Zhang Y , Warren. J , Balis U , Marrero J , Zhu J , Higgins PD ((2013) ) Comparison of imputation methods for missing laboratory data in medicine. BMJ Open 3: , e002847. |
[58] | Hothorn T, Bühlmann P, Dudoit S, Molinaro A, Van Der Laan MJ ((2006) ) Survival ensembles. Biostatistics 7: , 355–373. |
[59] | Couronné R , Probst P , Boulesteix A-L ((2018) ) Random forest versus logistic regression: a large-scale benchmark experiment. BMC Bioinformatic 19: , 270. |
[60] | Hapfelmeier A , Ulm K ((2013) ) A new variable selection approach using random forests. Comput Stat Data Anal 60: , 50–69. |
[61] | Strobl C , Boulesteix A-L , Zeileis A , Hothorn T ((2007) ) Bias in random forest variable importance measures: Illustrations, sources and a solution. BMC Bioinformatics 8: , 25. |
[62] | Breiman L ((2001) ) Random forests. Mach Learn 45: , 5–32. |
[63] | Strobl C , Malley J , Tutz G ((2009) ) An introduction to recursive partitioning: rationale, application, and characteristics of classification and regression trees, bagging, and random forests. Psychol Methods 14: , 323. |
[64] | Rice ME , Harris GT ((2005) ) Comparing effect sizes in follow-up studies: ROC Area, Cohen’s d, and r. Law Hum Behav 29: , 615–620. |
[65] | Yoo W , Ference BA , Cote ML , Schwartz A ((2012) ) A comparison of logistic regression, logic regression, classification tree, and random forests to identify effective gene-gene and gene-environmental interactions. Int J Sci Appl Technol 2: , 268. |
[66] | Tierney MC , Curtis AF , Chertkow H , Rylett RJ ((2017) ) Integrating sex and gender into neurodegeneration research: A six-component strategy. Alzheimers Dement (N Y) 3: , 660–667. |
[67] | Alzheimer’s Association ((2016) ) Alzheimer’s Association report: 2016 Alzheimer’s disease facts and figures. Alzheimers Dement 12: , 459–509. |
[68] | Chêne G , Beiser A , Au R , Preis SR , Wolf PA , Dufouil C , Seshadri S ((2015) ) Gender and incidence of dementia in the Framingham Heart Study from mid-adult life. Alzheimers Dement 11: , 310–320. |
[69] | Patel M ((2017) ) Revising the risk of Alzheimer disease in women. Nat Rev Neurol 13: , 575. |
[70] | Riedel BC , Thompson PM , Brinton RD ((2016) ) Age, APOE and sex: triad of risk of Alzheimer’s disease. J Steroid Biochem Mol Biol 160: , 134–147. |
[71] | Ungar L , Altmann A , Greicius MD ((2014) ) Apolipoprotein E, gender, and Alzheimer’s disease: An overlooked, but potent and promising interaction. Brain Imaging Behav 8: , 262–273. |
[72] | Zhao L , Mao Z , Woody SK , Brinton RD ((2016) ) Sex differences in metabolic aging of the brain: insights into female suscetibility to Alzheimer’s disease. Neurobiol Aging 42: , 69–79. |
[73] | Carter CL , Resnick EM , Mallampalli M , Kalbarczyk A ((2012) ) Sex and gender differences in Alzheimer’s disease: recommendations for future research. J Womens Health 21: , 1018–1023. |
[74] | Letellier N , Gutierrez L-A , Carrière I , Gabelle A , Dartigues J-F , Dufouil C , Helmer C , Cadot E , Berr C ((2018) ) Sex-specific association between neighborhood characteristics and dementia: The Three-City cohort. Alzheimers Dement 14: , 473–482. |
[75] | Peng X , Xing P , Li X , Qian Y , Song F , Bai Z , Han G , Lei H ((2016) ) Towards personalized intervention for Alzheimer’s disease. Genomics Proteomics Bioinformatics 14: , 289–297. |
[76] | Weber D , Skirbekk V , Freund I , Herlitz A ((2014) ) The changing face of cognitive gender differences in Europe. Proc Natl Acad Sci U S A 111: , 11673–11678. |
[77] | McCarrey AC , An Y , Kitner-Triolo MH , Ferrucci L , Resnick SM ((2016) ) Sex differences in cognitive trajectories in clinically normal older adults. Psychol Aging 31: , 166. |
[78] | Finch CE , Shams S ((2016) ) Apolipoprotein E and sex bias in cerebrovascular aging of men and mice. Trends Neurosci 39: , 625–637. |
[79] | Schneeweis N , Skirbekk V , Winter-Ebmer R ((2014) ) Does education improve cognitive performance four decades after school completion? Demography 51: , 619–643. |
[80] | Zahodne LB , Glymour MM , Sparks C , Bontempo D , Dixon RA , MacDonald SW , Manly JJ ((2011) ) Education does not slow cognitive decline with aging: 12-year evidence from the Victoria Longitudinal Study. J Int Neuropsychol Soc 17: , 1039–1046. |
[81] | Lenehan ME , Summers MJ , Saunders NL , Summers JJ , Ward DD , Ritchie K , Vickers JC ((2016) ) Sending your grandparents to university increases cognitive reserve: The Tasmanian Healthy Brain Project. Neuropsychology 30: , 525. |
[82] | Bischof GN , Park DC ((2015) ) Obesity and aging: Consequences for cognition, brain structure and brain function. Psychosom Med 77: , 697. |
[83] | Sellbom KS , Gunstad J ((2012) ) Cognitive function and decline in obesity. J Alzheimers Dis 30: , S89–S95. |
[84] | Hsu CL , Voss MW , Best JR , Handy TC , Madden K , Bolandzadeh N , Liu-Ambrose T ((2015) ) Elevated body mass index and maintenance of cognitive function in late life: exploring underlying neural mechanisms. Front Aging Neurosci 7: , 155. |
[85] | Anstey K , Cherbuin N , Budge M , Young J ((2011) ) Body mass index in midlife and late-life as a risk factor for dementia: a meta-analysis of prospective studies. Obes Rev 12: , e426–e437. |
[86] | Freret T , Gaudreau P , Schumann-Bard P , Billard J-M , Popa-Wagner A ((2015) ) Mechanisms underlying the neuroprotective effect of brain reserve against late life depression. J Neural Transm 122: , 55–61. |
[87] | Wang S , Blazer DG ((2015) ) Depression and cognition in the elderly. Annu Rev Clin Psychol 11: , 331–360. |
[88] | Richard E , Reitz C , Honig LH , Schupf N , Tang MX , Manly JJ , Mayeux R , Devanand D , Luchsinger JA ((2013) ) Late-life depression, mild cognitive impairment, and dementia. JAMA Neurol 70: , 383–389. |
[89] | Jopp DS , Wozniak D , Damarin AK , De Feo M , Jung S , Jeswani S ((2014) ) How could lay perspectives on successful aging complement scientific theory? Findings from a US and a German life-span sample. Gerontologist 55: , 91–106. |
[90] | Pruchno R ((2015) ) Successful aging: contentious past, productive future. Gerontologist 55: , 1–4. |
[91] | Frewen. J , Finucane C , Savva GM , Boyle G , Coen RF , Kenny RA ((2013) ) Cognitive function is associated with impaired heart rate variability in ageing adults: the Irish longitudinal study on ageing wave one results. Clin Auton Res 23: , 313–323. |
[92] | Larson ED , St Clair JR , Sumner WA , Bannister RA , Proenza C ((2013) ) Depressed pacemaker activity of sinoatrial node myocytes contributes to the age-dependent decline in maximum heart rate. Proc Natl Acad Sci U S A 110: , 18011–18016. |
[93] | Erickson KI , Voss MW , Prakash RS , Basak C , Szabo A , Chaddock L , Kim JS , Heo S , Alves H , White SM ((2011) ) Exercise training increases size of hippocampus and improves memory. Proc Natl Acad Sci U S A 108: , 3017–3022. |
[94] | Bullain SS , Corrada MM , Perry SM , Kawas CH ((2016) ) Sound body sound mind? Physical performance and the risk of dementia in the oldest-old: the 90+ study. J Am Geriatr Soc 64: , 1408–1415. |
[95] | Ferreira L , Tanaka K , Santos-Galduróz RF , Galduróz JCF ((2015) ) respiratory training as strategy to prevent cognitive decline in aging: a randomized controlled trial. Clin Interv Aging 10: , 593. |
[96] | Lachman ME , Agrigoroaei S , Murphy C , Tun PA ((2010) ) Frequent cognitive activity compensates for education differences in episodic memory. Am J Geriatr Psychiatry 18: , 4–10. |
[97] | Wirth M , Haase CM , Villeneuve S , Vogel J , Jagust WJ ((2014) ) Neuroprotective pathways: lifestyle activity, brain pathology, and cognition in cognitively normal older adults. Neurobiol Aging 35: , 1873–1882. |
[98] | Pietrzak RH , Lim YY , Ames D , Harrington K , Restrepo C , Martins RN , Rembach A , Laws SM , Masters CL , Villemagne VL ((2015) ) Trajectories of memory decline in preclinical Alzheimer’s disease: results from the Australian Imaging, Biomarkers and Lifestyle Flagship Study of Ageing. Neurobiol Aging 36: , 1231–1238. |
[99] | Caselli RJ , Beach TG , Knopman DS , Graff-Radford NR ((2017) ) Alzheimer disease: scientific breakthroughs and translational challenges. Mayo Clin Proc 92: , 978–994. |
[100] | Deckers K , Boxtel MP , Schiepers OJ , Vugt M , Muñoz Sánchez JL , Anstey KJ , Brayne C , Dartigues JF , Engedal K , Kivipelto M ((2015) ) Target risk factors for dementia prevention: a systematic review and Delphi consensus study on the evidence from observational studies. Int J Geriatr Psychiatry 30: , 234–246. |
[101] | Guehne U , Luck T , Busse A , Angermeyer MC , Riedel-Heller SG ((2007) ) Mortality in individuals with mild cognitive impairment. Results of the Leipzig Longitudinal Study of the Aged (LEILA75+). Neuroepidemiology 29: , 226–234. |
[102] | Yaffe K , Petersen RC , Lindquist K , Kramer. J , Miller B ((2006) ) Subtype of mild cognitive impairment and progression to dementia and death. Dement Geriatr Cogn Disord 22: , 312–319. |
[103] | Guehne U , Luck T , Busse A , Angermeyer MC , Riedel-Heller SG ((2007) ) Mortality in individuals with mild cognitive impairment. Neuroepidemiology 29: , 226–234. |
[104] | Vance DE , Webb NM , Marceaux JC , Viamonte SM , Foote AW , Ball KK ((2008) ) Mental stimulation, neural plasticity, and aging: directions for nursing research and practice. J Neurosci Nurs 40: , 241–249. |
[105] | Yaffe K, Lindquist K, Vittinghoff E, Barnes D, Simonsick EM, Newman A, Satterfield S, Rosano C, Rubin SM, Ayonayon HN ((2010) ) The effect of maintaining cognition on risk of disability and death. J Am Geriatr Soc 58: , 889–894. |

