prPred: A Predictor to Identify Plant Resistance Proteins by Incorporating k-Spaced Amino Acid (Group) Pairs
 Yansu Wang
 Pingping Wang
 Yingjie Guo1
  Lei Xu
- 1School of Electronic and Communication Engineering, Shenzhen Polytechnic, Shenzhen, China
- 2School of Life Science and Technology, Harbin Institute of Technology, Harbin, China
- 3Department of Neurology, The 2nd Affiliated Hospital of Harbin Medical University, Harbin, China
- 4College of Information and Computer Engineering, Northeast Forestry University, Harbin, China
To infect plants successfully, pathogens adopt various strategies to overcome their physical and chemical barriers and interfere with the plant immune system. Plants deploy a large number of resistance (R) proteins to detect invading pathogens. The R proteins are encoded by resistance genes that contain cell surface-localized receptors and intracellular receptors. In this study, a new plant R protein predictor called prPred was developed based on a support vector machine (SVM), which can accurately distinguish plant R proteins from other proteins. Experimental results showed that the accuracy, precision, sensitivity, specificity, F1-score, MCC, and AUC of prPred were 0.935, 1.000, 0.806, 1.000, 0.893, 0.857, and 0.948, respectively, on an independent test set. Moreover, the predictor integrated the HMMscan search tool and Phobius to identify protein domain families and transmembrane protein regions to differentiate subclasses of R proteins. prPred is available at https://github.com/Wangys-prog/prPred. The tool requires a valid Python installation and is run from the command line.
Introduction
Plant pathogens can disturb the plant immune system to support their growth and development within plant tissue. The propagation and spread of pathogens threaten food security and cause crop and economic losses. To recognize invading pathogens, plants have evolved various disease resistance proteins (R proteins). There are two main categories of plant R proteins: membrane-bound pattern recognition receptors (PRRs) and intracellular resistance receptors. PRRs are comprised of two receptor classes, receptor-like proteins (RLPs) and receptor-like kinases (RLKs), that are located on the plant plasma membrane as the first layer of the surveillance system to detect microbe-derived molecular patterns. PRRs typically contain highly variable extracellular domains, such as lysin motif (LysM), leucine-rich repeat (LRR), and lectin domains (Zhou and Yang, 2016). The majority of intracellular resistance receptors (NBS-LRRs or NLRs) are nucleotide-binding sites (NBSs) and LRR proteins that can recognize effectors delivered into host cells by pathogens. The NBS domain is part of the NB-ARC domain that contains additional subdomains, including apoptotic protease-activating factor-1 (APAF-1), R gene products and caenorhabditis elegans death-4 protein (CED-4) (van der Biezen and Jones, 1998; Van Ooijen et al., 2008). NLR proteins are divided into two subclasses based on the N-terminal structure: TIR-NBS-LRR (TNL), which contains a toll-like-interleukin receptor (TIR) domain, and CC-NBS-LRR, which carries a coiled-coil (CC) domain (Han, 2019; Sun et al., 2020).
Five computational approaches have been developed for R protein prediction (Table 1). NLR-parser, RGAugury, and Restrepo-Montoya’s pipeline are alignment-based tools, and NBSPred and DRPPP are learning-based tools. NLR-parser uses motif alignment and search tool (MAST) to identify NLR-like sequences (Steuernagel et al., 2015). RGAugury identifies different subclasses of R proteins, including membrane-associated receptors (RLPs or RLKs) and NBS-containing proteins, by integrating the results generated from several computing programs, such as BLAST (Camacho et al., 2009), InterProScan (Zdobnov and Apweiler, 2001), HMMER3 (Eddy, 2011), nCoil (Lupas et al., 1991), and Phobius (Käll et al., 2004). Restrepo-Montoya et al. (2020) developed a computational approach to classify RLK and RLP proteins using SignalP 4.0 (Petersen et al., 2011), TMHMM 2 (Krogh et al., 2001) and PfamScan (Finn et al., 2014). However, methods based on sequence alignment are low-sensitive and time-consuming, which can lead to difficulties in predicting low similarity proteins. Machine learning-based methods, NBSPred and DRPPP, are used for the detection of R proteins based on SVM by considering various numerical representation schemes of protein sequences. NBSPred was developed to differentiate NLR/NLR-like proteins from non-NLR proteins. However, the NBSPred training datasets were generated by electronic searches and were not experimentally verified, which might reduce the accuracy of the model. DRPPP was built by extracting various features from input protein sequences, and the model achieved 91.11% accuracy for prediction plant R proteins. Unfortunately, the NBSPred1 and DRPPP2 web servers are no longer available.
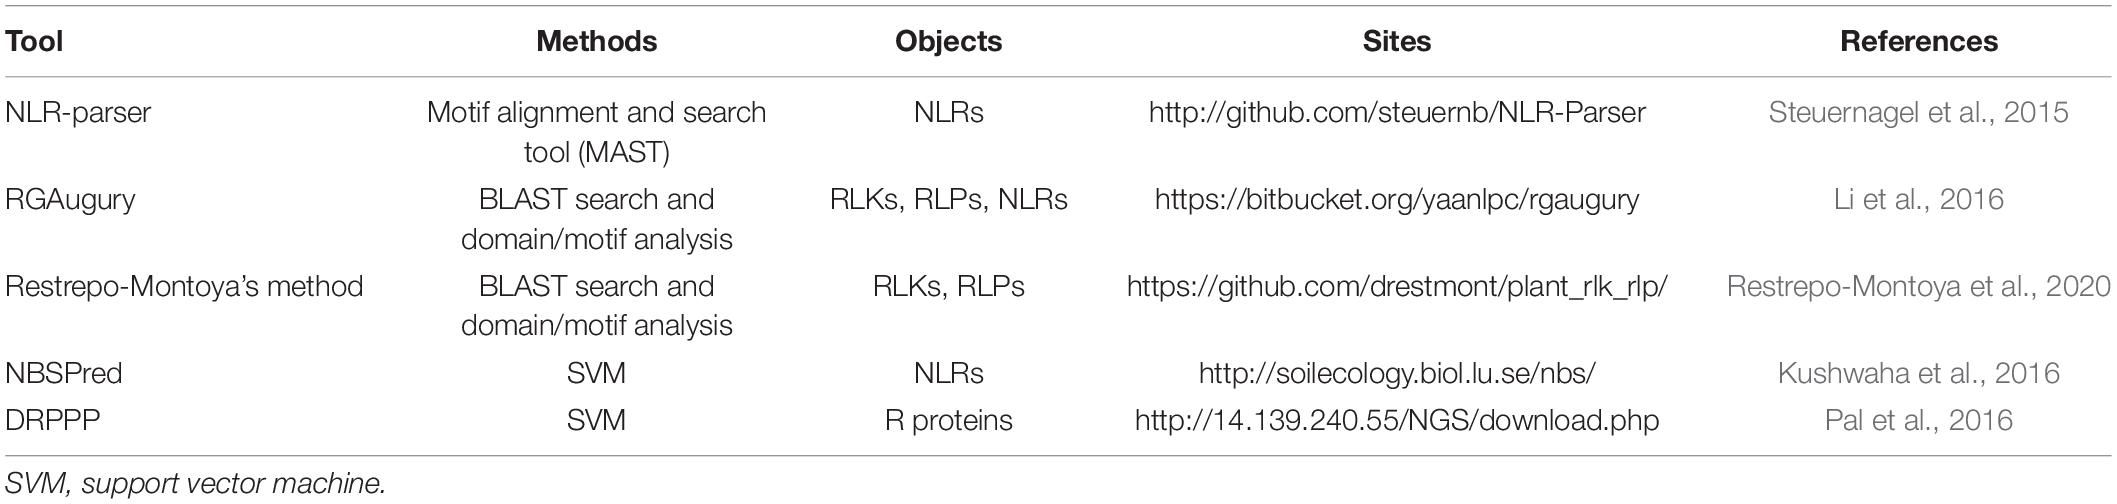
Table 1. Summary of existing tools for plant R protein prediction.
In this study, we developed an accurate computational approach for identifying R proteins using various sequence features. It is worth highlighting that the composition of k-spaced amino acid pairs (CKSAAPs) and k-spaced amino acid group pairs (CKSAAGPs) were also considered in the training process. The two-step feature selection strategy was adopted to detect irrelevant and redundant features. Then, the optimal k value and algorithm were evaluated for R protein prediction. Ultimately, support vector machine (SVM) and 5-spaced amino acid (group) pairs were chosen and applied to construct classifiers with sequence features.
Materials and Methods
A flowchart of our method is shown in Figure 1. It can be summarized in five steps: (1) data collection; (2) feature construction; (3) two-step feature selection; (4) performance evaluation of features with or without CKSAAPs and CKSAAGPs; and (5) performance evaluation of different algorithms.
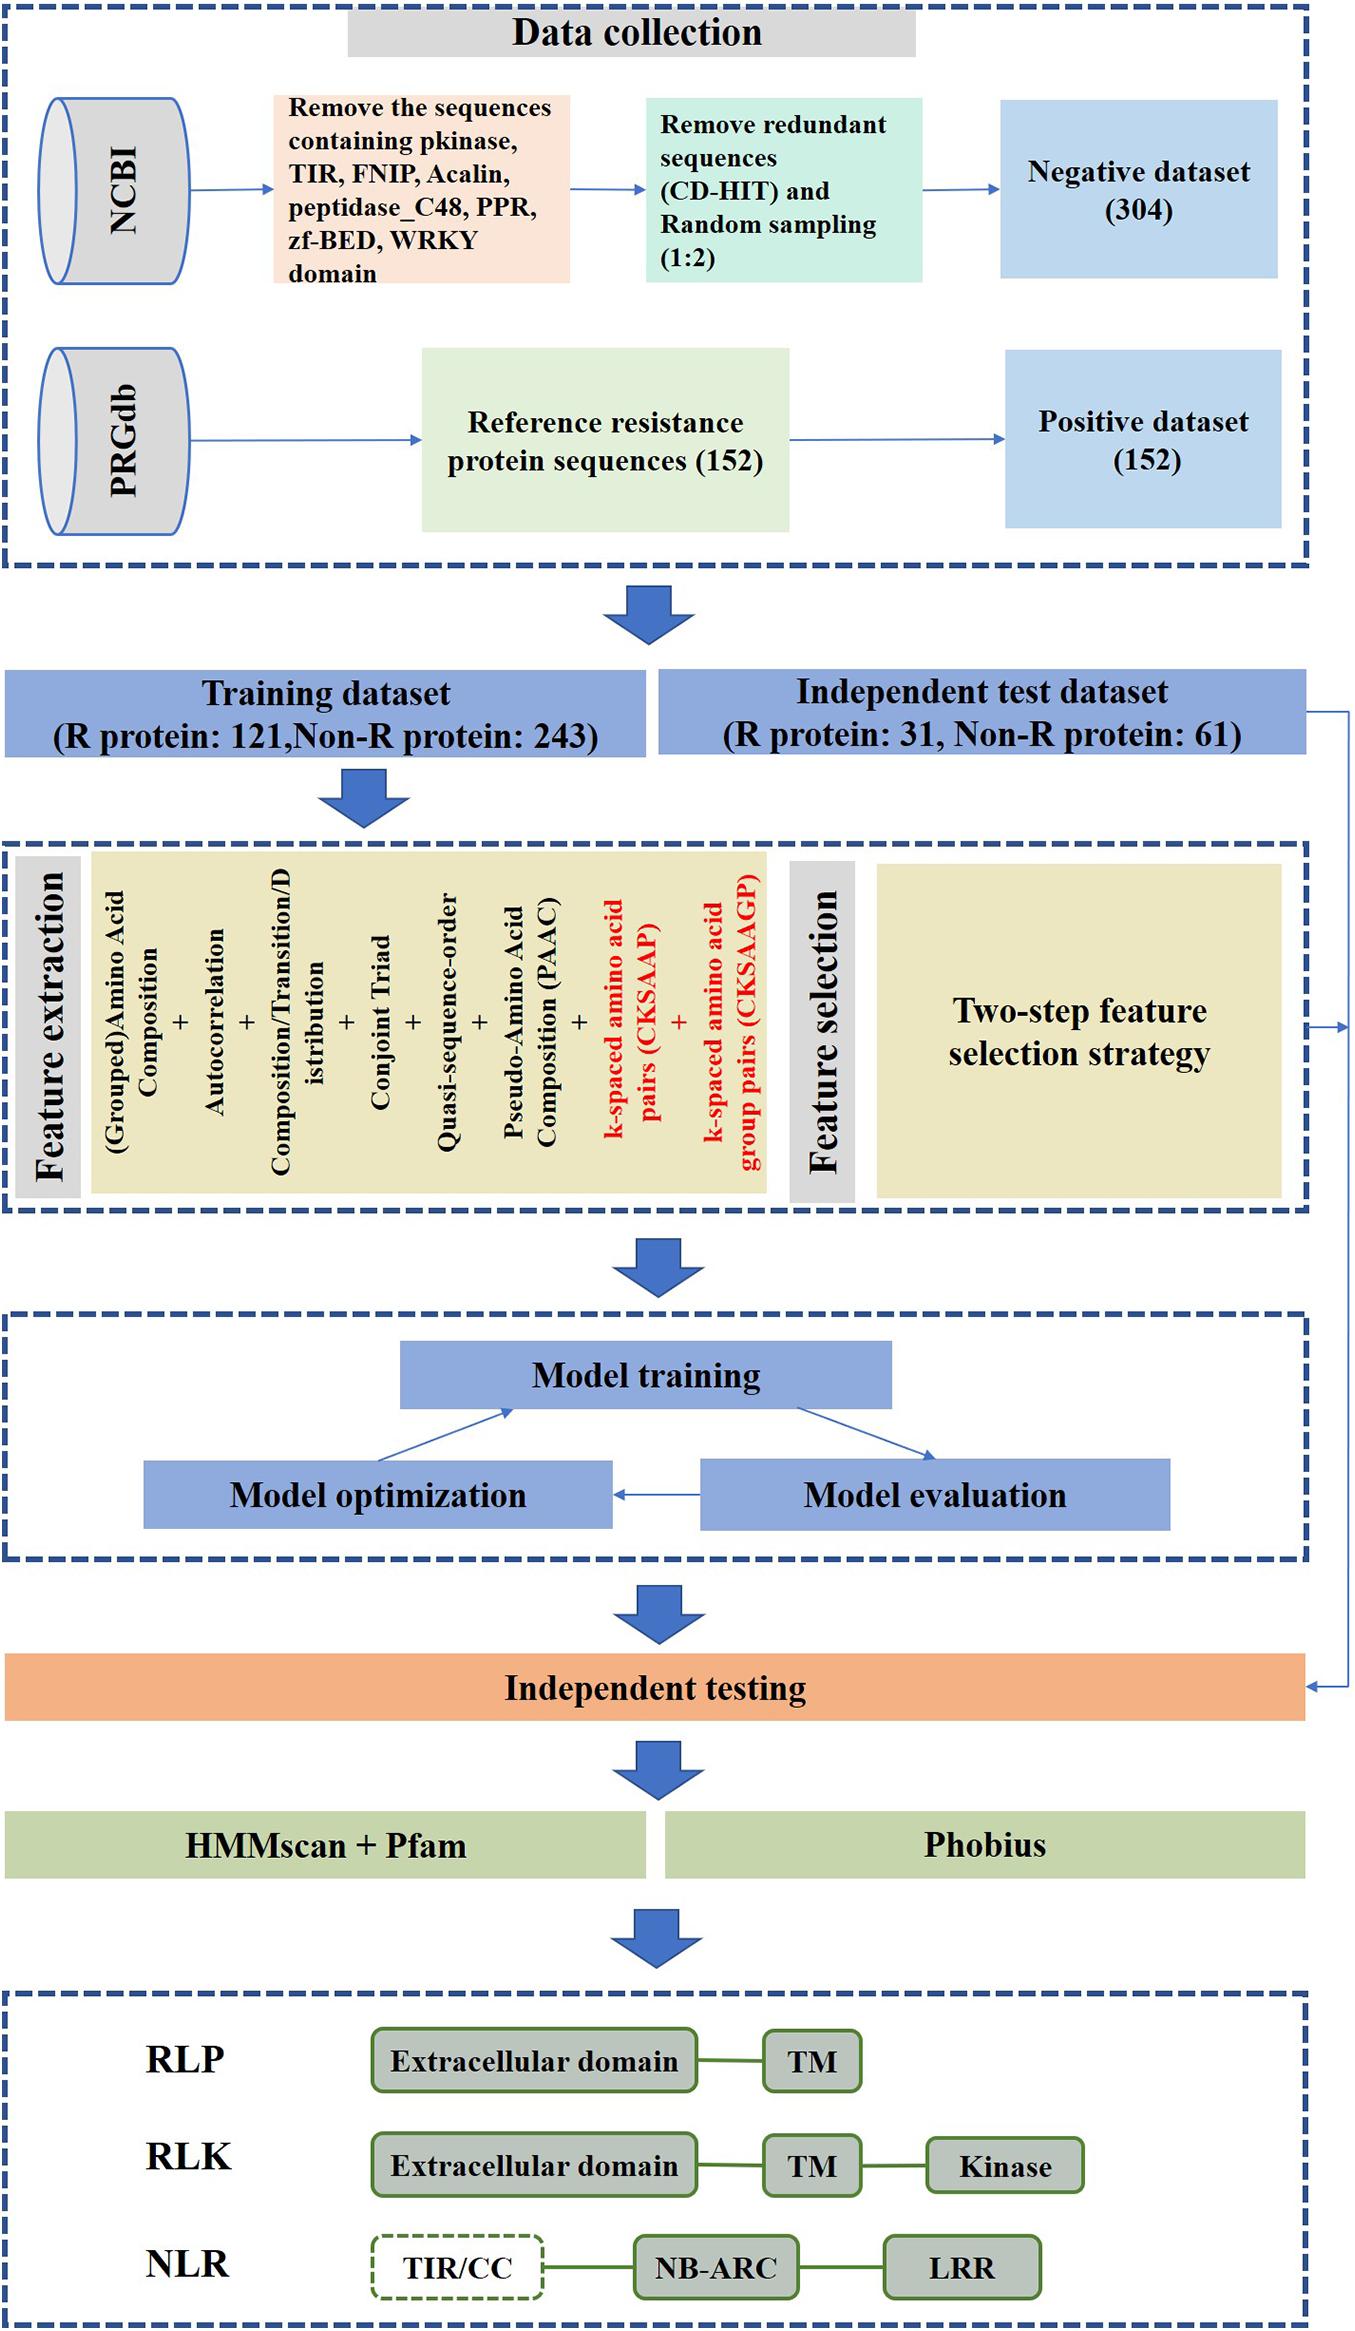
Figure 1. prPred workflow.
Data Collection
We obtained plant R protein sequences from the PRGdb database3. R protein sequences were derived from 35 plant species and served as a positive dataset (Osuna-Cruz et al., 2018). Next, the known protein sequences of 35 plant species were downloaded from the NCBI protein database to construct a negative dataset. The sequences containing NB-ARC, LRR, Pkinase, TIR, FNIP, Acalin, peptidase_C48, PPR, zf-BED, and WRKY were filtered by a Pfam domain search (Kushwaha et al., 2016). To remove redundancy, proteins with sequence similarity >30% were excluded from the non-R protein dataset using CD-HIT (Fu et al., 2012). However, 34,975 protein sequences remained in the non-R protein dataset after filtering, thus, to ensure the balance of data, 304 protein sequences were selected randomly from the identified non-R proteins to serve as a final negative dataset. Then, 152 R proteins and 304 non-R proteins were split into training and test datasets at an 8:2 ratio. Finally, the training dataset is made up of 121 R protein sequences and 243 non-R protein sequences, and the independent test dataset is composed of 31 R protein sequences and 61 non-R protein sequences.
Feature Construction
Features were extracted from input sequences using iFeature (Chen et al., 2018), such as amino acid composition, grouped amino acid composition, quasi-sequence-order, composition/transition/distribution (C/T/D), autocorrelation, conjoint triad and pseudo-amino acid composition (PseAAC). More detailed information about the features is described in the Supplementary Methods and Supplementary Table 1.
There are lots of feature extraction methods (Pal et al., 2016; Zeng et al., 2016; Liao et al., 2018; Zhang and Liu, 2019; Ikram et al., 2020; Li J. et al., 2020; Wang et al., 2020; Zhao et al., 2020; Zhu et al., 2020). In this work, we utilized CKSAAPs and CKSAAGPs as numeric vectors to represent the protein sequence. CKSAAP was used to calculate the occurrence frequencies of any two amino acids separated by any k amino acids. For example, if k = 0, the 0-spaced residue pairs can be represented as: AA, AC, AD, …, YY; if k = 1, the 1-spaced residue pairs can be expressed as AxA, AxC, AxD, …, YxY. The CKSAAPs are defined as:
where “x” represents any of 20 amino acids; Nk was calculated as Nk = L − (k + 1), k = 1, 2, 3…, where L represents the length of a given protein sequence. The final feature vector was computed by concatenating the individual feature vectors; for example, if k = 5, the number of vector dimensions would be 400 × 6 = 2,400.
Amino acid residues can be divided into five categories based on chemical properties of the side chains, including aliphatic group (g1: GAVLMI), aromatic group (g2: FYW), positive charged group (g3: KRH), negative charged group (g4: DE), and uncharged group (g5: STCPNQ). k-spaced amino acid group pairs (CKSAAGP) is based on the frequency of two group separated by any k amino acids. If k = 0, the 0-spaced group pairs is represented as:
Two-Step Feature Selection Strategy
First, feature vectors were sorted according to the value of information gain (IG). A new feature list was generated in descending order of the IG value. Second, we selected or removed features based on the accuracy value during the training process. We added features from higher IG value to lower IG value. If the addition of a feature did not reduce the accuracy in the cross-validation strategy, then the feature vector was retained; otherwise, it was removed.
Machine Learning Algorithms
Eight algorithms, including logistic regression (LR) (Hosmer et al., 2013), K-nearest neighbors (KNN) (Kramer, 2013), SVM (Hearst et al., 1998), decision tree (DT) (Swain and Hauska, 1977), random forest (RF) (Breiman, 2001), gradient boosting classifier (GBC) (Aler et al., 2017), Adaboost (Schapire, 2013), and extra-tree classifier (ETC) (Geurts et al., 2006), were chosen to train the model. We applied grid search (GS) to find optimal parameter combination in 10-fold cross-validation for each model. GS requires specifying a range for parameters, for example, the SVM parameter optimization using GS is implemented within the given ranges of C = {−5, 11} and γ = {−9, 13}.
Performance Evaluation
To estimate the contributions of CKSAAPs and CKSAAGPs and to measure the overall predictive performance of the classification models, six parameters were applied for 10-fold cross-validation and independent tests (Hearst et al., 1998; An et al., 2019; Chen et al., 2019; Ding et al., 2019a, b; Fang et al., 2019; Jiang et al., 2019; Lv et al., 2019b, 2020b; Shen et al., 2019; Liu et al., 2020), including precision (Pre), sensitivity (Sen), specificity (Spe), accuracy (Acc), F1-score, and Matthew’s correlation coefficient (MCC). They are defined as follows:
where TP is the number of R proteins classified as R proteins, TN is the number of non-R proteins classified as non-R proteins, FP is the number of non-R proteins classified as R proteins, and FN is the number of R proteins classified as non-R proteins.
Additionally, the ROC curve and PR curve were used as visual assessment metrics. The ROC curve shows the false-positive rate versus the true positive rate, and the PR curve is recall versus precision. The area under the curve (AUC) is also provided as performance measure (Wang et al., 2010; Cheng et al., 2019). An AUC close to 1 indicates better prediction of the model.
Results
Comparison of Different Feature Combinations and Classification Models
CKSAAPs and CKSAAGPs are numerical encoding schemes that can capture short linear motif information, and the composition of CKSAAPs has been successfully applied to identify protein modification sites (Cheng et al., 2018; Lv et al., 2020c, d). We constructed feature vectors with CKSAAPs and CKSAAGPs because plant R proteins contain motif information distinct from that of non-R proteins (Supplementary Figure 1). The numerical encoding schemes of CKSAAP and CKSAAGP have exhibited obvious differences between R and non-R proteins using Wilcoxon rank sum test (Supplementary Figure 2). Table 2 showed that different models had different responses to the features with or without CKSAAPs and CKSAAGPs. For example, the Acc of LR showed no noticeable changes when CKSAAP and CKSAAGP features were added, while the Acc of SVM was improved from 0.902 to 0.935 in the independent dataset when considering 5-spaced amino acid pairs.
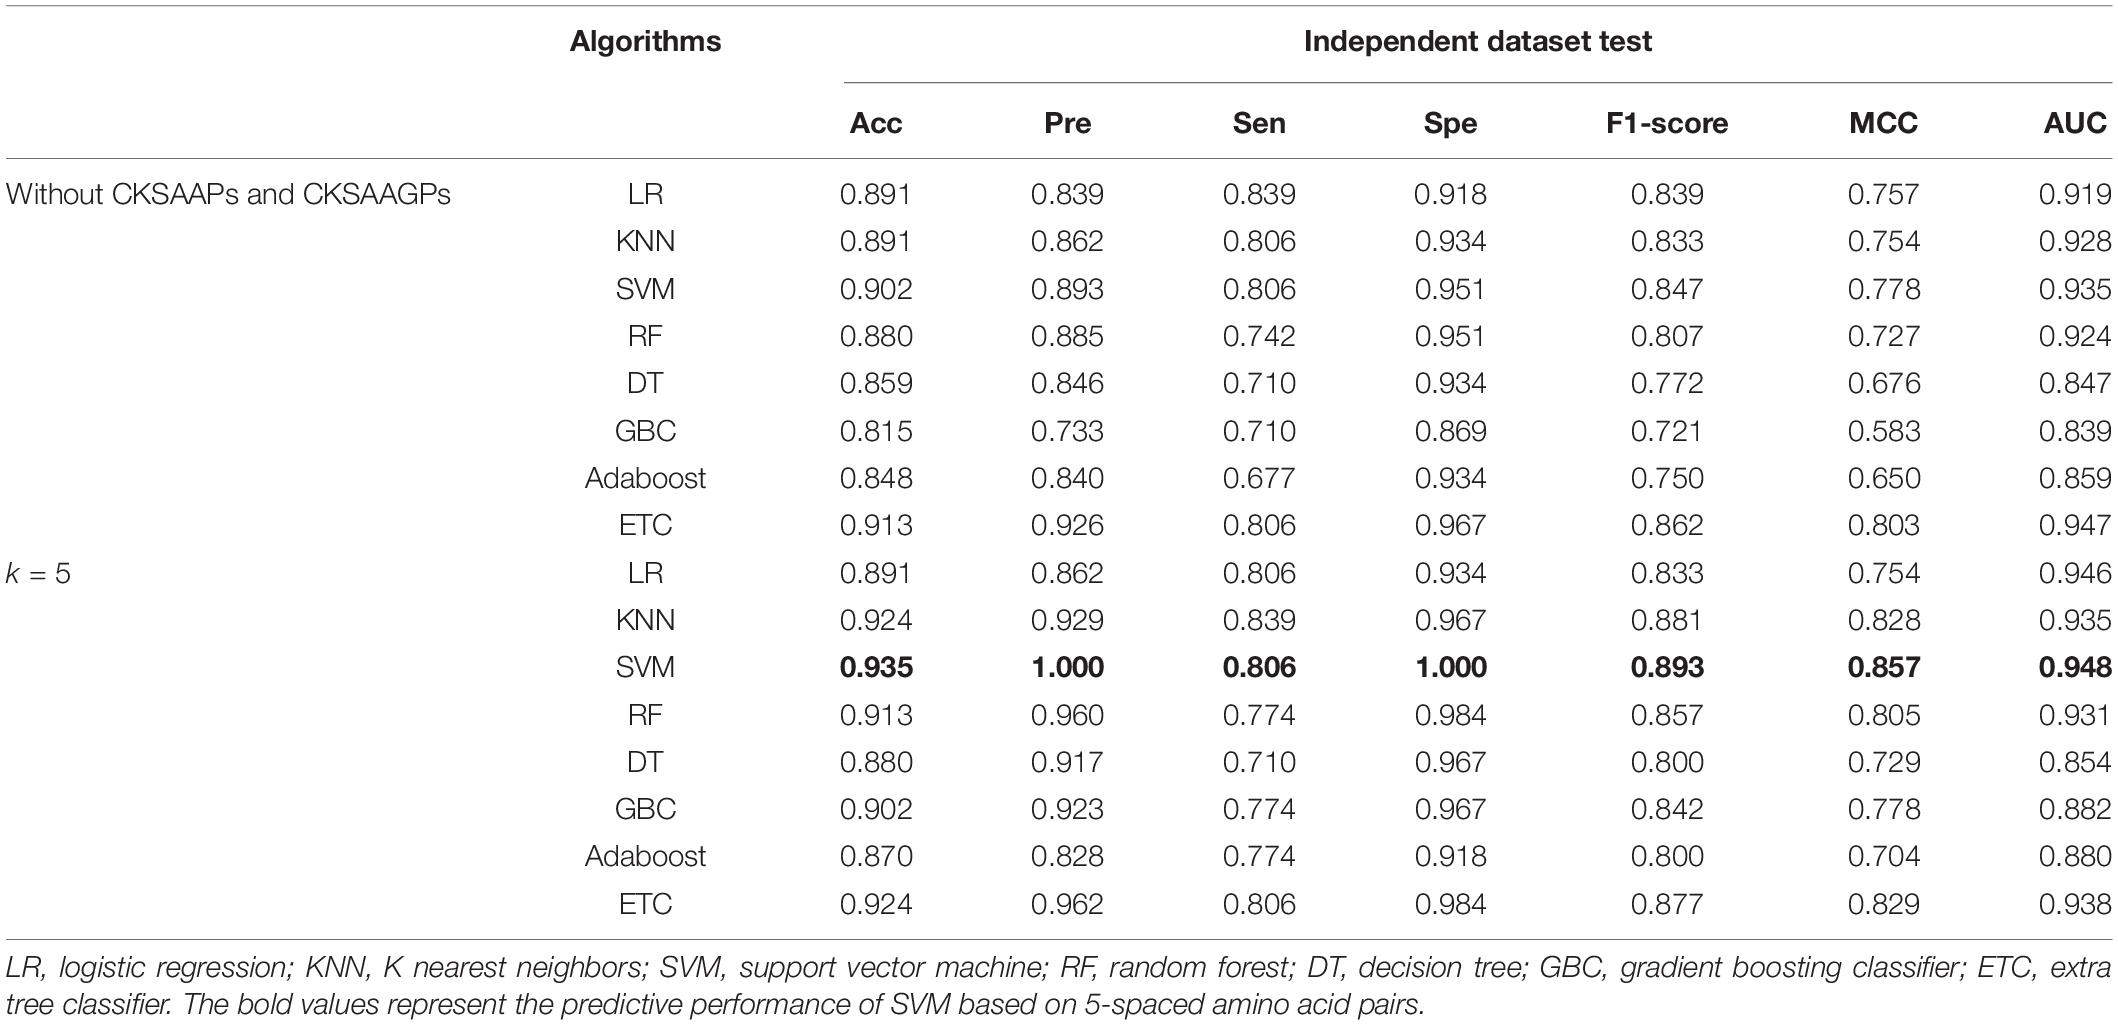
Table 2. Performance comparison of features with and without CKSAAP and CKSAAGP in the independent dataset test.
To determine the optimal algorithms and k value, we explored the discrimination power of k = 3-, 5-, 7-, 9-, and 13-spaced amino acid pairs using different algorithms (e.g., LR, KNN, SVM, RF, DT, GBC, Adaboost, and ETC) (Supplementary Table 2). We observed that SVM achieved better performance than other algorithms in 10-fold cross-validation tests in the same k-value. Although the AUC of SVM when k = 5 (AUCk = 5 = 0.948) was slightly lower than that when k = 9 and 13 (AUCk = 9 = 0.953, AUCk = 13 = 0.951) in the ROC curve in the independent dataset tests, the PR curve showed 4.12 and 7.09% improvements in AUC-PR when k = 5 compared with k = 9 and 13 (Figure 2). Moreover, the Acc, Spe, F1-score, and MCC values were improved by 2.41% (4.94%), 3.41% (3.41%), 3.60% (8.77%), and 6.72% (13.81%), respectively, compared with k = 9 (and 13) (Supplementary Table 2). Therefore, we chose SVM as the model and k = 5 to build the plant R protein predictor. The predictor showed satisfactory prediction results for the independent dataset with an Acc of 0.935, Pre of 1.000, Sen of 0.806, Spe of 1.000, F1-score of 0.893, MCC of 0.857, and AUC of 0.948 (Table 2 and Supplementary Table 2). The optimal parameters of SVM with the RBF kernel were C = 2.0 and γ = 0.0078.
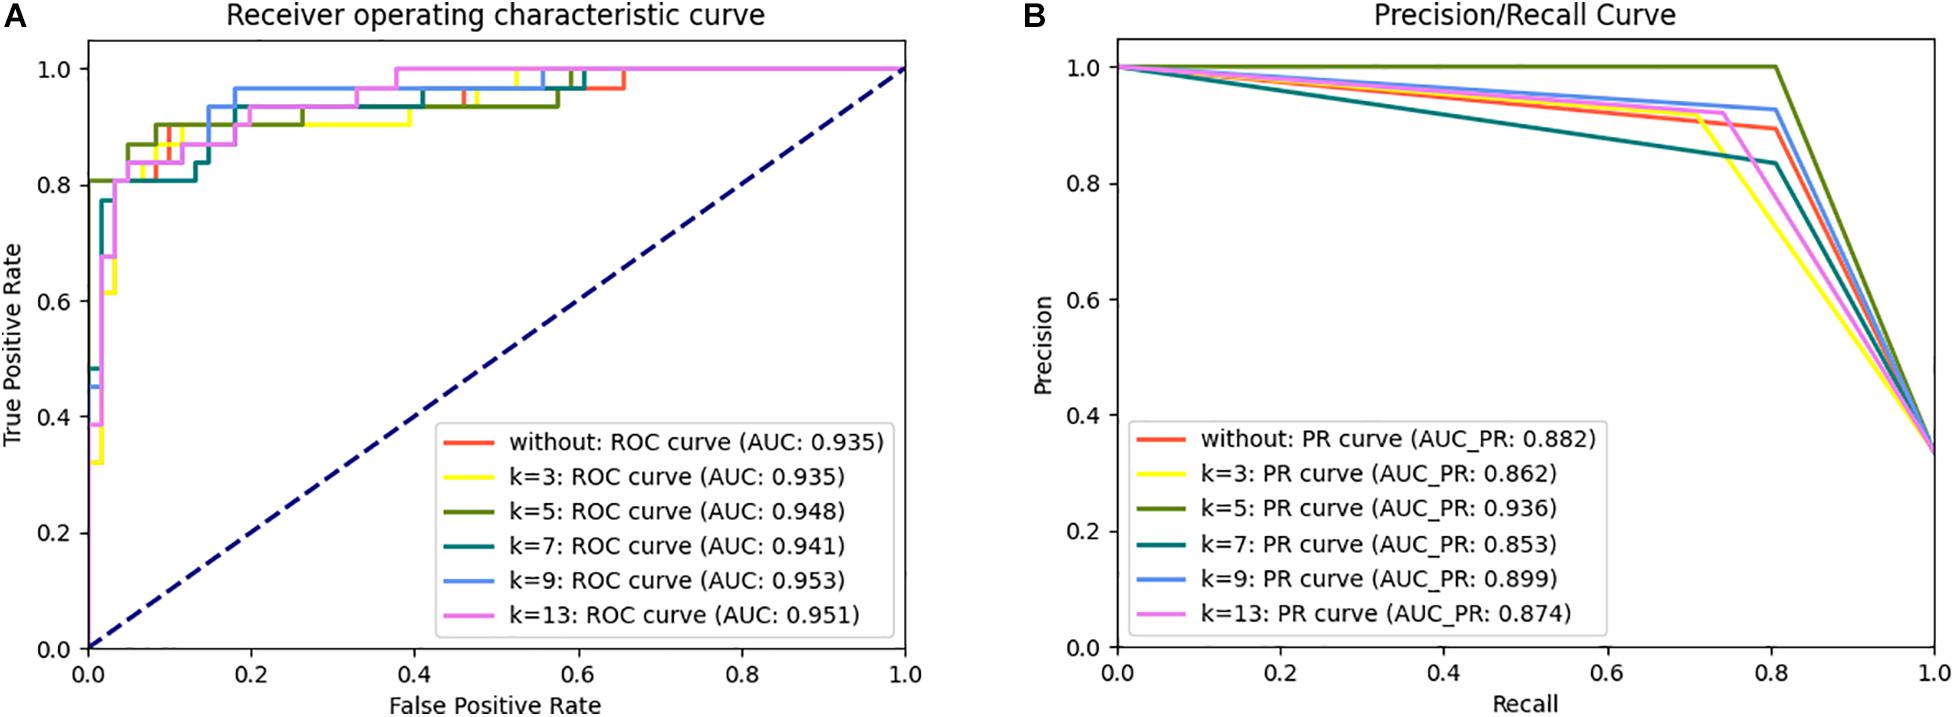
Figure 2. ROC (A) and PR (B) curve for the prPred classifier in the independent dataset test.
Prediction Pipeline of prPred
Because the published methods based on machine learning algorithms (e.g., NBSPred and DRPPP) are no longer available, performance comparisons cannot be carried out between prPred and the state-of-the-art methods. The alignment-based tools, NLR-parser and Restrepo-Montoya’s method are mainly applied to predict NLRs and PRRs (RLKs and RLPs), respectively. The RGAugury project aims to identify resistance gene analogs for plant genomes using interolog- and domain-based approaches. In the study, prPred integrated machine learning method and sequence alignment-based method to analyze and evaluate the potential R proteins. Except for predicting the potential R proteins, it was capable of annotating protein domain families based on Pfam-A using a hidden Markov model (HMM) and searching transmembrane regions (TMs) using Phobius to differentiate RLPs/PLKs from NLRs. Users can import protein sequences in FASTA format, and the prPred prediction results can be saved to CSV- and FASTA-formatted file. The CSV-formatted file output contains information about the protein sequence ID, prediction probability score, TM number, that as shown in Table 3.
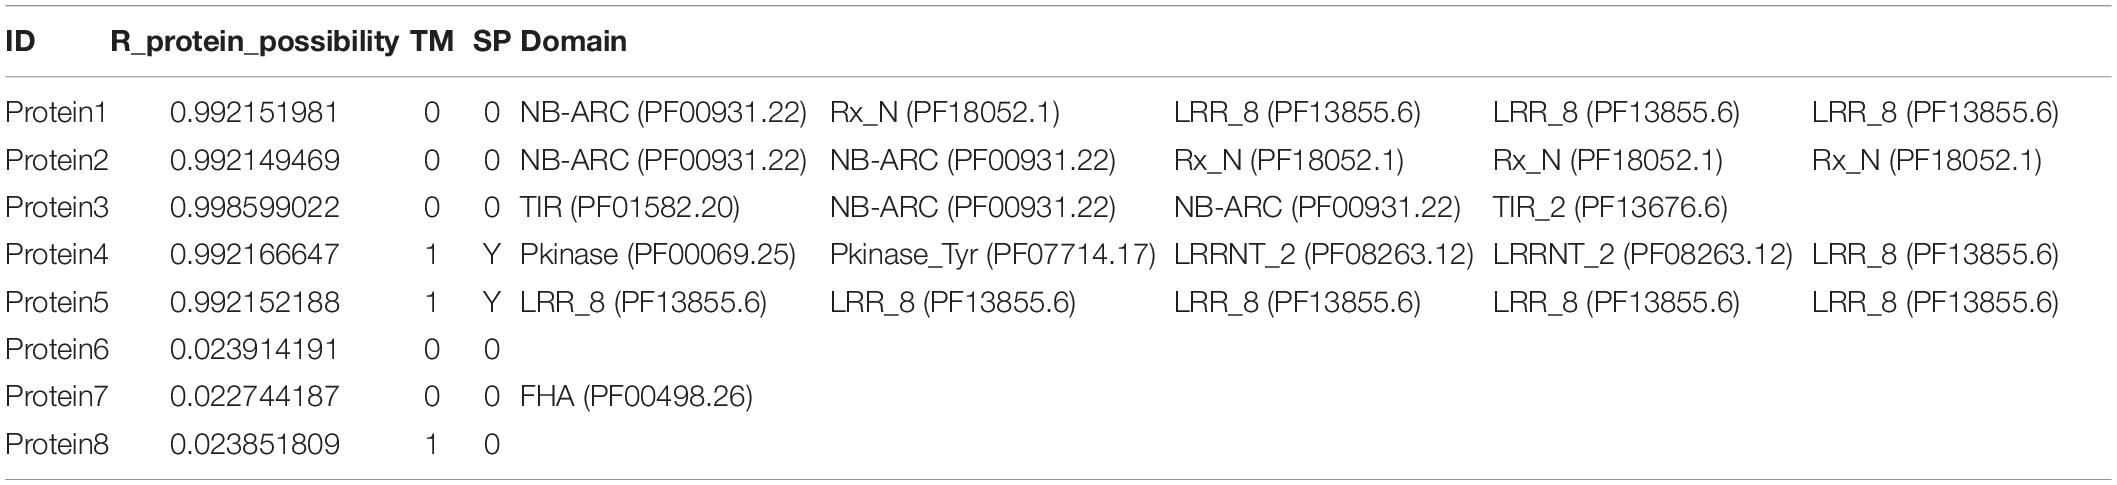
Table 3. Example results in the CSV-format output file of prPred.
Conclusion
In this study, we developed a bioinformatics tool called prPred for the prediction of plant resistance proteins that combines CKSAAP and CKSAAGP features based on SVM. The predictive and analytical results demonstrated that the constructed model is an efficient predictor to distinguish R proteins from non-R proteins. CKSAAP and CKSAAGP features provide important improvements in the prediction performance. We expect that prPred will be a useful tool to facilitate biological research and provide guidance for related experimental validation. In the feature, we will use deep learning method and deep representation learning features for prPred (Lv et al., 2019a, 2020a, 2021; Li F. et al., 2020).
Data Availability Statement
The datasets presented in this study can be found in online repositories. The names of the repository/repositories and accession number(s) can be found in the article/Supplementary Material.
Author Contributions
YW and PW were responsible for experiments and manuscript preparation. YG and SH participated in discussions. YC and LX worked as supervisor for all procedures. All authors contributed to the article and approved the submitted version.
Funding
This work was supported by the Post-doctoral Foundation Project of Shenzhen Polytechnic (6020330004K).
Conflict of Interest
The authors declare that the research was conducted in the absence of any commercial or financial relationships that could be construed as a potential conflict of interest.
Supplementary Material
The Supplementary Material for this article can be found online at: https://www.frontiersin.org/articles/10.3389/fbioe.2020.645520/full#supplementary-material
Footnotes
- ^ http://soilecology.biol.lu.se/nbs/
- ^ http://14.139.240.55/NGS/download.php
- ^ http://prgdb.org/prgdb/
References
Aler, R., Galván, I. M., Ruiz-Arias, J. A., and Gueymard, C. A. (2017). Improving the separation of direct and diffuse solar radiation components using machine learning by gradient boosting. Sol. Energy 150, 558–569. doi: 10.1016/j.solener.2017.05.018
An, J.-Y., Zhou, Y., Zhang, L., Qiang, N., and Wang, D.-F. (2019). Improving self-interacting proteins prediction accuracy using protein evolutionary information and weighed-extreme learning machine. Curr. Bioinform. 14, 115–122. doi: 10.2174/1574893613666180209161152
Camacho, C., Coulouris, G., Avagyan, V., Ma, N., Papadopoulos, J., Bealer, K., et al. (2009). BLAST+: architecture and applications. BMC Bioinformatics 10:421. doi: 10.1186/1471-2105-10-421
Chen, J., Zhao, J., Yang, S., Chen, Z., and Zhang, Z. (2019). Prediction of protein ubiquitination sites in arabidopsis thaliana. Curr. Bioinform. 14, 614–620. doi: 10.2174/1574893614666190311141647
Chen, Z., Zhao, P., Li, F., Leier, A., Marquez-Lago, T. T., Wang, Y., et al. (2018). iFeature: a python package and web server for features extraction and selection from protein and peptide sequences. Bioinformatics 34, 2499–2502. doi: 10.1093/bioinformatics/bty140
Cheng, L., Hu, Y., Sun, J., Zhou, M., and Jiang, Q. (2018). DincRNA: a comprehensive web-based bioinformatics toolkit for exploring disease associations and ncRNA function. Bioinformatics 34, 1953–1956. doi: 10.1093/bioinformatics/bty002
Cheng, L., Wang, P., Tian, R., Wang, S., Guo, Q., Luo, M., et al. (2019). LncRNA2Target v2.0: a comprehensive database for target genes of lncRNAs in human and mouse. Nucleic Acids Res. 47, D140–D144.
Ding, Y., Tang, J., and Guo, F. (2019a). Identification of drug-side effect association via multiple information integration with centered kernel alignment. Neurocomputing 325, 211–224. doi: 10.1016/j.neucom.2018.10.028
Ding, Y., Tang, J., and Guo, F. (2019b). Identification of drug-target interactions via fuzzy bipartite local model. Neural Comput. Appl. 32, 10303–10319. doi: 10.1007/s00521-019-04569-z
Eddy, S. R. (2011). Accelerated profile HMM searches. PLoS Comput. Biol. 7:e1002195. doi: 10.1371/journal.pcbi.1002195
Fang, M., Lei, X., and Guo, L. (2019). A survey on computational methods for essential proteins and genes prediction. Curr. Bioinform. 14, 211–225. doi: 10.2174/1574893613666181112150422
Finn, R. D., Bateman, A., Clements, J., Coggill, P., Eberhardt, R. Y., Eddy, S. R., et al. (2014). Pfam: the protein families database. Nucleic Acids Res. 42, D222–D230. doi: 10.1093/nar/gkt1223
Fu, L., Niu, B., Zhu, Z., Wu, S., and Li, W. (2012). CD-HIT: accelerated for clustering the next-generation sequencing data. Bioinformatics 28, 3150–3152. doi: 10.1093/bioinformatics/bts565
Geurts, P., Ernst, D., and Wehenkel, L. (2006). Extremely randomized trees. Mach. Learn. 63, 3–42. doi: 10.1007/s10994-10006-16226-10991
Han, G. Z. (2019). Origin and evolution of the plant immune system. New Phytol. 222, 70–83. doi: 10.1111/nph.15596
Hearst, M. A., Dumais, S. T., Osuna, E., Platt, J., and Scholkopf, B. (1998). Support vector machines. IEEE Intell. Syst. Their Appl. 13, 18–28. doi: 10.1109/5254.708428
Hosmer, D. W. Jr., Lemeshow, S., and Sturdivant, R. X. (2013). Applied Logistic Regression. Hoboken, NJ: John Wiley & Sons.
Ikram, N., Qadir, M. A., and Afzal, M. T. (2020). SimExact - an efficient method to compute function similarity between proteins using gene ontology. Curr. Bioinform. 15, 318–327. doi: 10.2174/1574893614666191017092842
Jiang, M., Pei, Z., Fan, X., Jiang, J., Wang, Q., and Zhang, Z. (2019). Function analysis of human protein interactions based on a novel minimal loop algorithm. Curr. Bioinform. 14, 164–173. doi: 10.2174/1574893613666180906103946
Käll, L., Krogh, A., and Sonnhammer, E. L. (2004). A combined transmembrane topology and signal peptide prediction method. J. Mol. Biol. 338, 1027–1036. doi: 10.1016/j.jmb.2004.03.016
Kramer, O. (2013). “K-nearest neighbors,” in Dimensionality Reduction with Unsupervised Nearest Neighbors, eds J. Kacprzyk, Warsaw, P. L. C. Jain, (Adelaide: Springer), 13–23. doi: 10.1007/1978-1003-1642-38652-38657_38652
Krogh, A., Larsson, B., Von Heijne, G., and Sonnhammer, E. L. (2001). Predicting transmembrane protein topology with a hidden Markov model: application to complete genomes. J. Mol. Boil. 305, 567–580. doi: 10.1006/jmbi.2000.4315
Kushwaha, S. K., Chauhan, P., Hedlund, K., and Ahrén, D. (2016). NBSPred: a support vector machine-based high-throughput pipeline for plant resistance protein NBSLRR prediction. Bioinformatics 32, 1223–1225. doi: 10.1093/bioinformatics/btv714
Li, F., Luo, M., Zhou, W., Li, J., Jin, X., Xu, Z., et al. (2020). Single cell RNA and immune repertoire profiling of COVID-19 patients reveal novel neutralizing antibody. Protein Cell 25, 1–5.
Li, J., Pu, Y., Tang, J., Zou, Q., and Guo, F. (2020). DeepAVP: a dual-channel deep neural network for identifying variable-length antiviral peptides. IEEE J. Biomed. Health Inform. 24, 3012–3019. doi: 10.1109/jbhi.2020.2977091
Li, P., Quan, X., Jia, G., Xiao, J., Cloutier, S., and You, F. M. (2016). RGAugury: a pipeline for genome-wide prediction of resistance gene analogs (RGAs) in plants. BMC Genomics 17:852. doi: 10.1186/s12864-12016-13197-x
Liao, Z., Wan, S., He, Y., and Quan, Z. (2018). Classification of small GTPases with hybrid protein features and advanced machine learning techniques. Curr. Bioinform. 13, 492–500. doi: 10.2174/1574893612666171121162552
Liu, B., Li, C., and Yan, K. (2020). DeepSVM-fold: protein fold recognition by combining support vector machines and pairwise sequence similarity scores generated by deep learning networks. Brief. Bioinform. 21, 1733–1741. doi: 10.1093/bib/bbz098
Lupas, A., Van Dyke, M., and Stock, J. (1991). Predicting coiled coils from protein sequences. Science 256, 1162–1164. doi: 10.1126/science.1252.5009.1162
Lv, H., Dao, F.-Y., Guan, Z.-X., Yang, H., Li, Y.-W., and Lin, H. (2020a). Deep-Kcr: accurate detection of lysine crotonylation sites using deep learning method. Brief. Bioinform. doi: 10.1093/bib/bbaa255 Online ahead of print
Lv, H., Dao, F. Y., Zhang, D., Guan, Z. X., Yang, H., Su, W., et al. (2020b). iDNA-MS: an integrated computational tool for detecting DNA modification sites in multiple genomes. iScience 23:100991. doi: 10.1016/j.isci.2020.100991
Lv, Z., Wang, D., Ding, H., Zhong, B., and Xu, L. (2020c). Escherichia Coli DNA N-4-methycytosine site prediction accuracy improved by light gradient boosting machine feature selection technology. IEEE Access 8, 14851–14859. doi: 10.1109/access.2020.2966576
Lv, Z., Zhang, J., Ding, H., and Zou, Q. (2020d). RF-PseU: a random forest predictor for RNA pseudouridine sites. Front. Bioeng. Biotech. 8:134. doi: 10.3389/fbioe.2020.00134
Lv, Z., Ao, C., and Zou, Q. (2019a). Protein function prediction: from traditional classifier to deep learning. Proteomics 19:1900119. doi: 10.1002/pmic.201900119
Lv, Z., Jin, S., Ding, H., and Zou, Q. (2019b). A random forest sub-golgi protein classifier optimized via dipeptide and amino acid composition features. Front. Bioeng. Biotech. 7:215. doi: 10.3389/fbioe.2019.00215
Lv, Z., Wang, P., Zou, Q., and Jiang, Q. (2021). Identification of sub-golgi protein localization by use of deep representation learning features. Bioinformatics doi: 10.1093/bioinformatics/btaa1074 Online ahead of print
Osuna-Cruz, C. M., Paytuvi-Gallart, A., Di Donato, A., Sundesha, V., Andolfo, G., Aiese Cigliano, R., et al. (2018). PRGdb 3.0: a comprehensive platform for prediction and analysis of plant disease resistance genes. Nucleic Acids Res. 46, D1197–D1201. doi: 10.1093/nar/gkx1119
Pal, T., Jaiswal, V., and Chauhan, R. S. (2016). DRPPP: a machine learning based tool for prediction of disease resistance proteins in plants. Comput. Biol. Med. 78, 42–48. doi: 10.1016/j.compbiomed.2016.09.008
Petersen, T. N., Brunak, S., Von Heijne, G., and Nielsen, H. (2011). SignalP 4.0: discriminating signal peptides from transmembrane regions. Nat. Methods 8:785. doi: 10.1038/nmeth.1701
Restrepo-Montoya, D., Brueggeman, R., Mcclean, P. E., and Osorno, J. M. (2020). Computational identification of receptor-like kinases “RLK” and receptor-like proteins “RLP” in legumes. BMC Genomics 21:459. doi: 10.1186/s12864-12020-06844-z
Schapire, R. E. (2013). “Explaining AdaBoost,” in Empirical Inference: Festschrift in Honor of Vladimir N. Vapnik, eds B. Schölkopf, Z. Luo, and V. Vovk (Berlin: Springer), 37–52. doi: 10.1007/1978-1003-1642-41136-41136_41135
Shen, Y., Tang, J., and Guo, F. (2019). Identification of protein subcellular localization via integrating evolutionary and physicochemical information into Chou’s general PseAAC. J. Theor. Biol. 462, 230–239. doi: 10.1016/j.jtbi.2018.11.012
Steuernagel, B., Jupe, F., Witek, K., Jones, J. D., and Wulff, B. B. (2015). NLR-parser: rapid annotation of plant NLR complements. Bioinformatics 31, 1665–1667. doi: 10.1093/bioinformatics/btv1005
Sun, Y., Zhu, Y.-X., Balint-Kurti, P. J., and Wang, G. F. (2020). Fine-tuning immunity: players and regulators for plant NLRs. Trends Plant Sci. 25, 695–713. doi: 10.1016/j.tplants.2020.1002.1008
Swain, P. H., and Hauska, H. (1977). The decision tree classifier: design and potential. IEEE T. Geosci. Elect. 15, 142–147. doi: 10.1109/TGE.1977.6498972
van der Biezen, E. A., and Jones, J. D. (1998). The NB-ARC domain: a novel signalling motif shared by plant resistance gene products and regulators of cell death in animals. Curr. Biol. 8, R226–R228.
Van Ooijen, G., Mayr, G., Kasiem, M. M., Albrecht, M., Cornelissen, B. J., and Takken, F. L. (2008). Structure–function analysis of the NB-ARC domain of plant disease resistance proteins. J. Exp. Bot. 59, 1383–1397. doi: 10.1093/jxb/ern045
Wang, G., Wang, Y., Teng, M., Zhang, D., Li, L., and Liu, Y. (2010). Signal transducers and activators of transcription-1 (STAT1) regulates microRNA transcription in interferon gamma-stimulated HeLa cells. PLoS One 5:e11794. doi: 10.1371/journal.pone.0011794
Wang, Z., He, W., Tang, J., and Guo, F. (2020). Identification of highest-affinity binding sites of yeast transcription factor families. J. Chem. Inform. model. 60, 1876–1883. doi: 10.1021/acs.jcim.9b01012
Zdobnov, E. M., and Apweiler, R. (2001). InterProScan–an integration platform for the signature-recognition methods in InterPro. Bioinformatics 17, 847–848. doi: 10.1093/bioinformatics/17.9.847
Zeng, J., Li, D., Wu, Y., Zou, Q., and Liu, X. (2016). An empirical study of features fusion techniques for protein-protein interaction prediction. Curr. Bioinform. 11, 4–12. doi: 10.2174/1574893611666151119221435
Zhang, J., and Liu, B. (2019). A review on the recent developments of sequence-based protein feature extraction methods. Current Bioinformatics 14, 190–199. doi: 10.2174/1574893614666181212102749
Zhao, X., Jiao, Q., Li, H., Wu, Y., Wang, H., Huang, S., et al. (2020). ECFS-DEA: an ensemble classifier-based feature selection for differential expression analysis on expression profiles. BMC Bioinformatics 21:43. doi: 10.1186/s12859-020-3388-y
Zhou, J.-M., and Yang, W.-C. (2016). Receptor-like kinases take center stage in plant biology. Sci. China Life Sci. 59:863. doi: 10.1007/s11427-016-5112-8
Keywords: prPred, plant R protein, CKSAAP, CKSAAGP, support vector machine
Citation: Wang Y, Wang P, Guo Y, Huang S, Chen Y and Xu L (2021) prPred: A Predictor to Identify Plant Resistance Proteins by Incorporating k-Spaced Amino Acid (Group) Pairs. Front. Bioeng. Biotechnol. 8:645520. doi: 10.3389/fbioe.2020.645520
Received: 23 December 2020; Accepted: 31 December 2020;
Published: 21 January 2021.
Edited by:
Zhibin Lv, University of Electronic Science and Technology of China, ChinaCopyright © 2021 Wang, Wang, Guo, Huang, Chen and Xu. This is an open-access article distributed under the terms of the Creative Commons Attribution License (CC BY). The use, distribution or reproduction in other forums is permitted, provided the original author(s) and the copyright owner(s) are credited and that the original publication in this journal is cited, in accordance with accepted academic practice. No use, distribution or reproduction is permitted which does not comply with these terms.
*Correspondence: Yu Chen, nefu_chenyu@163.com; Lei Xu, csleixu@szpt.edu.cn
†These authors have contributed equally to this work