iPS Cell-Based Model for MAPT Haplotype as a Risk Factor for Human Tauopathies Identifies No Major Differences in TAU Expression
 Tabea Strauß1,2
  Amir Marvian-Tayaranian1,2 Eldem Sadikoglou3
  Ashutosh Dhingra3
  Florian Wegner4,5
  Dietrich Trümbach6
  Wolfgang Wurst1,6,7
  Peter Heutink3,8
  Sigrid C. Schwarz1,2,9
  Günter U. Höglinger1,2,4,5*
- 1German Center for Neurodegenerative Diseases (DZNE), Munich, Germany
- 2Department of Neurology, Technical University Munich, Munich, Germany
- 3German Center for Neurodegenerative Diseases (DZNE), Tübingen, Germany
- 4Department of Neurology, Hanover Medical School, Hanover, Germany
- 5Center for Systems Neuroscience, Hanover, Germany
- 6Institute of Developmental Genetics, Helmholtz Zentrum München, Oberschleißheim, Germany
- 7TUM School of Life Sciences, Technical University of Munich, Freising, Germany
- 8Department for Neurodegenerative Diseases, Hertie Institute for Clinical Brain Research, University of Tübingen, Tübingen, Germany
- 9Geriatric Clinic Haag, Haag in Oberbayern, Germany
The H1 haplotype of the microtubule-associated protein tau (MAPT) gene is a common genetic risk factor for some neurodegenerative diseases such as progressive supranuclear palsy, corticobasal degeneration, and Parkinson’s disease. The molecular mechanism causing the increased risk for the named diseases, however, remains unclear. In this paper, we present a valuable tool of eight small molecule neural precursor cell lines (smNPC) homozygous for the MAPT haplotypes (four H1/H1 and four H2/H2 cell lines), which can be used to identify MAPT-dependent phenotypes. The employed differentiation protocol is fast due to overexpression of NEUROGENIN-2 and therefore suitable for high-throughput approaches. A basic characterization of all human cell lines was performed, and their TAU and α-SYNUCLEIN profiles were compared during a differentiation time of 30 days. We could identify higher levels of conformationally altered TAU in cell lines carrying the H2 haplotype. Additionally, we found increased expression levels of α-SYNUCLEIN in H1/H1 cells. With this resource, we aim to fill a gap in neurodegenerative disease modeling with induced pluripotent stem cells (iPSC) for sporadic tauopathies.
Introduction
A major class of neurodegenerative diseases are tauopathies which are characterized by intra-cellular inclusions of the microtubule-associated protein tau (MAPT) in neurons. TAU is encoded by the MAPT gene on chromosome 17q21 and can be spliced into six isoforms by inclusion or exclusion of exons 2, 3, and 10 (Goedert and Jakes, 1990). Alternative splicing of exon 10 results in isoforms with either three or four microtubule-binding repeats (3R or 4R-TAU; Goedert et al., 1989). According to the dominant isoform detected in the brain inclusions, tauopathies can be classified as 3R, 4R, and 3R/4R tauopathies (Sergeant et al., 2005). A classical 3R tauopathy is Pick’s disease (PiD), while progressive supranuclear palsy (PSP) and corticobasal degeneration (CBD) are typical 4R tauopathies (Dickson, 1998; Dickson et al., 2002, 2010). Primary age-related tauopathies (PART) and Alzheimer’s disease (AD) display deposits with both isoforms (Goedert et al., 2006; Crary et al., 2014). Over 50 known mutations in the MAPT gene causing familial forms of frontotemporal lobar degeneration with TAU inclusions (FTLD-TAU; Ghetti et al., 2015) include missense mutations that alter the amino acid sequences of TAU and splice mutations which influence the alternative splicing of exon 10 (Goedert, 2005). Apart from these autosomal dominant mutations, there are several genetic risk factors that increase the risk for neurodegenerative diseases like tauopathies.
After a first association of a polymorphic dinucleotide marker between exon 9 and 10 in the MAPT gene with PSP (Conrad et al., 1997), thorough analysis revealed a complete linkage disequilibrium of multiple polymorphisms in this gene, defining two extended haplotypes H1 and H2. Spanning not only the whole TAU gene (Baker et al., 1999) but a region of approximately 1.8 Mb on chromosome 17q21, the MAPT haplotype is one of the largest haplotypes in the human genome (Ezquerra et al., 1999; Pastor et al., 2002; Pittman et al., 2004; Caffrey and Wade-Martins, 2007). Characteristic for the H2 haplotype is a nearly 1 Mb long inversion, which includes the MAPT gene next to other genes (Stefansson et al., 2005). The H1 haplotype was repeatedly connected to a higher risk for developing primary tauopathies such as PSP and CBD and the secondary tauopathy AD (Myers et al., 2005; Höglinger et al., 2011; Kouri et al., 2015). Surprisingly, genome-wide association studies identified the MAPT haplotype also as major risk factor for Parkinson’s disease (PD), which is not considered a tauopathy but a synucleinopathy (Pascale et al., 2016). Additionally, Vuono et al. (2015) reported a connection between the rate of cognitive decline and the MAPT haplotype in Huntington’s disease.
The molecular mechanisms of the H1 haplotype causing an increased risk for developing a sporadic neurodegenerative disease is still under investigation. Haplotype defining single nucleotide polymorphisms (SNPs) are mainly found in intronic regions, not altering the amino acid sequence of TAU (Kwok et al., 2004). Whether the MAPT haplotype influences the total TAU expression or only the expression of one specific TAU isoform is still subject to debate (Kwok et al., 2004; Caffrey et al., 2006; Myers et al., 2007; de Jong et al., 2012; Trabzuni et al., 2012; Majounie et al., 2013; Valenca et al., 2016).
So far, most studies have only investigated the haplotype-dependent mRNA expression, but not its translation into TAU protein. Additionally, there is the need for a human cell model to investigate the mechanisms behind the MAPT haplotype. Induced pluripotent stem cell (iPSC)-derived neurons have become a valuable tool for investigating tauopathies. The ability to convert somatic cells from individuals with specific genetic variants into human neurons has proven an appealing instrument. Missense and intronic mutations in the MAPT gene that are connected to FTLD-TAU were shown to cause differences in mRNA and protein expression of TAU in iPSC-derived neurons (Imamura et al., 2016; Garcia-Leon et al., 2018; Verheyen et al., 2018). Familial forms of tauopathies are only representing a small percentage of cases, therefore justifying an urgent need to model genetic risk factors for sporadic tauopathies like the MAPT haplotype. While a recent iPSC model used H1/H2 heterozygous cell lines to investigate allele-specific MAPT mRNA expression (Beevers et al., 2017), a systematic comparison of homozygous H1 and H2 cell lines is missing. With the presented iPSC resource, we attempt to close that gap.
Materials and Methods
Identification and Selection of iPSC Lines
Commercially available cell lines from healthy donors from the ECACC cell bank, specifically from the HipSci collection (Human Induced Pluripotent Stem Cell Initiative),1 were selected regarding their MAPT haplotype, passage number and pluripotency score, as well as their donors’ age and sex (see Table 1). The openly accessible genome sequencing data of healthy control individuals was searched and filtered for three haplotype defining SNPs: rs1800547, rs8070723, and rs1052553. 4 H1/H1 and 4 H2/H2 cell lines were purchased (for genotyping of further SNPs and microsatellite Rep1 see Tables 2–6). For simplicity, all cell lines are referred to only by their four-letter code in the end of the name (e.g., yemz for HPSI1013i-yemz_1). For all cell lines an MTA was signed from our lab, as well as all collaborating partners on this project.
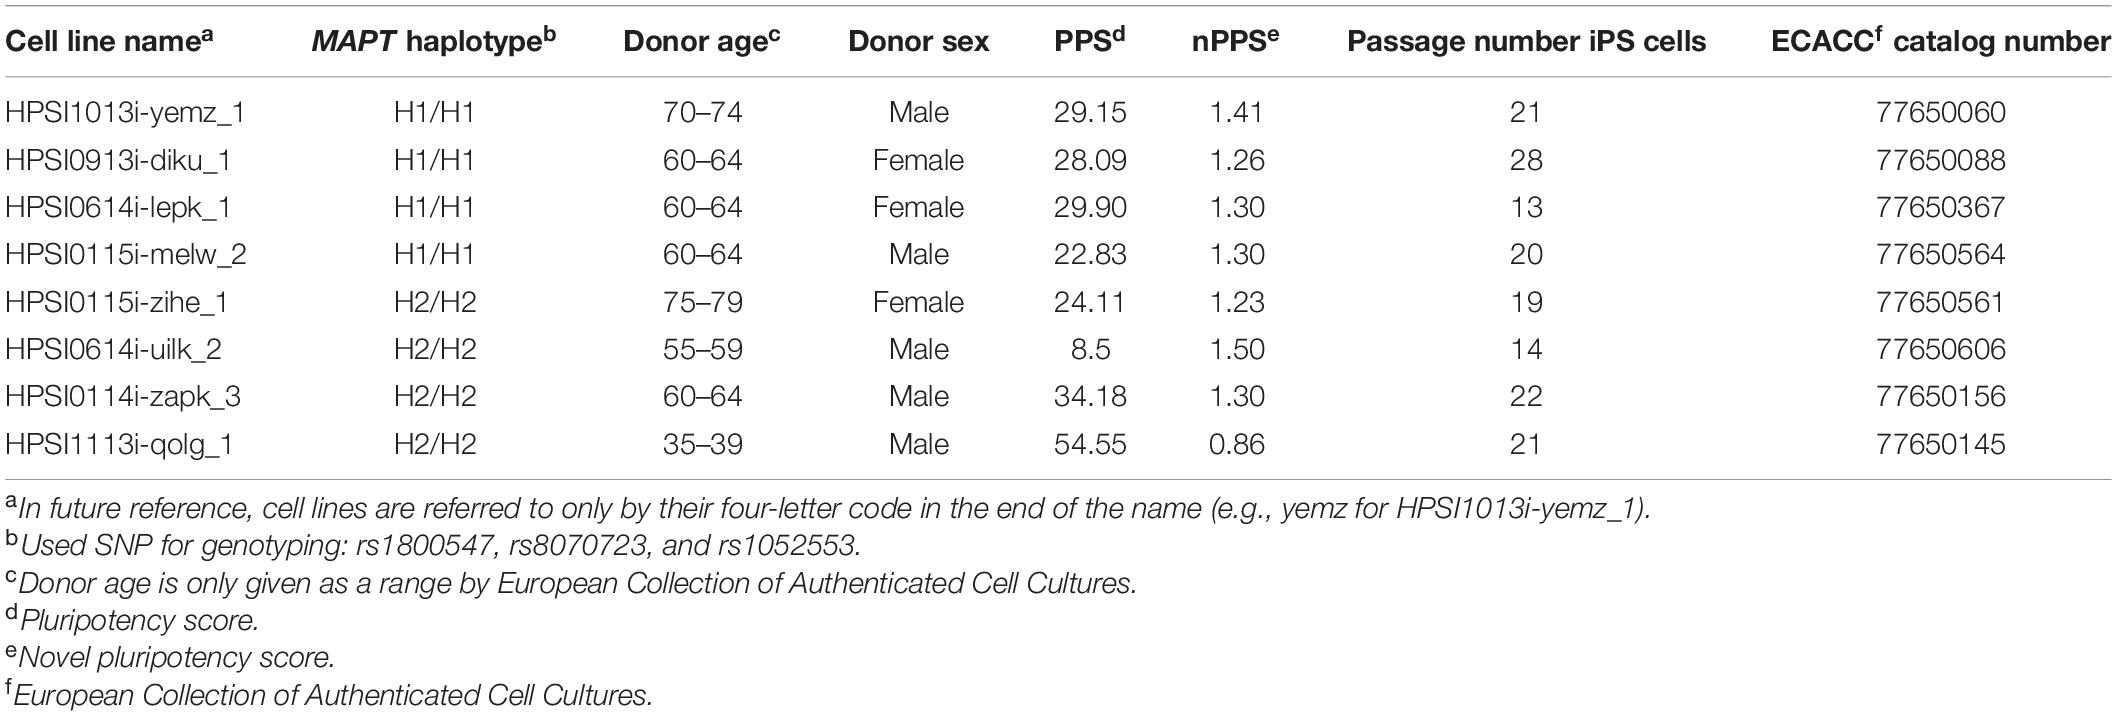
Table 1. General information of used human iPS cell lines.
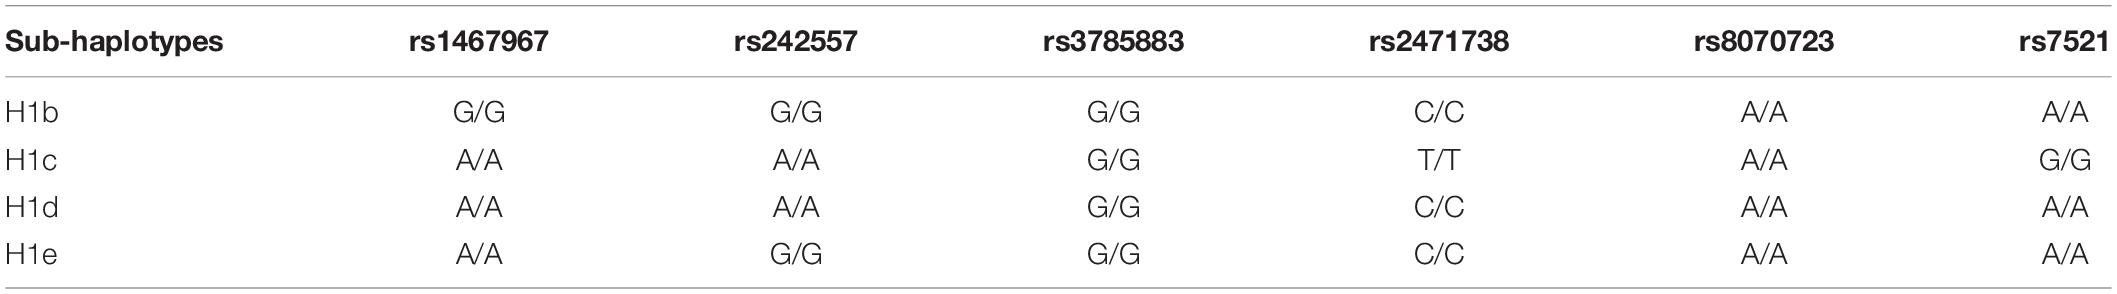
Table 2. Single nucleotide polymorphisms (SNPs) defining the H1 sub-haplotype.
Genotyping
The selected cell lines were further analyzed regarding their genotype for SNPs in the MAPT gene and in the SNCA gene coding for α-SYNUCLEIN. The genotyping array results for imputed and phased genotypes from each cell line, available at the HipSci website,2 were analyzed with the freely available software GenomeBrowse from Golden Helix (Bozeman, MT, United States) to identify SNP genotypes. Furthermore, for investigation of a microsatellite near the SNCA gene, first the GATK haplotype calls from the whole genome sequencing (also available on the HipSci website) were first viewed with the GenomeBrowse for identification of the genotype in the region of interest. Secondly, the raw sequencing reads of the whole genome sequencing data were viewed with the UCSC Browser3 to identify the whole sequence of the microsatellite.
Induced Pluripotent Stem Cells Culture and smNPC Generation
Purchased iPS cells were thawed and expanded on Matrigel (Corning, NY, United States) in “Essential 8 Flex” medium (Thermo Fisher, Waltham, MA, United States). iPSCs were converted according to a modified protocol into small molecule neural precursor cells (smNPC) via embryoid body formation (Reinhardt et al., 2013; Dhingra et al., 2020). iPSC were detached and transferred into a low binding 6 well suspension plate with KSR medium containing 78% DMEM/F12 Medium, 20% Knockout serum replacement, 1% Non-essential amino acids, and 1% GlutaMax (Life Technologies, Carlsbad, CA, United States) and 0,1% β-Mercaptoethanol (Sigma-Aldrich, St. Louis, MO, United States) supplemented with 10 μM Dorsomorphine (Abcam, Cambridge, United Kingdom), 10 μM SB431542 (Selleckchem, Houston, TX, United States), 0.5 μM Purmorphamine (Biomol, Hamburg, Germany), 3 μM CHIR99021 (Tocris, Bristol, United Kingdom) and 2 μM Thiazovivin (Millipore, Billerica, MA, United States). At day 2, the medium was changed to N2B27 medium consisting of 48.425% DMEM/F12 Medium, 48% Neurobasal Medium, 0.5% N2-supplement, 1% B27 supplement without Vitamin A (Life Technologies, Carlsbad, CA, United States), 0.025% Insulin (Sigma-Aldrich, St. Louis, MO, United States), 0.5% Non-essential amino acids, 1% GlutaMax, 1% Penicillin/Streptavidin (Life Technologies, Carlsbad, CA, United States) and 0.05% β-Mercaptoethanol supplemented with 10 μM Dorsomorphine, 10 μM SB431542, 0.5 μM Purmorphamine and 3 μM CHIR99021. At day 4, the medium was changed to smNPC expansion medium composed of N2B27 medium with 0.5 μM Purmorphamine, 3 μM CHIR99021 and 64 μg/ml ascorbic acid (Th. Geyer, Renningen, Germany). 6-day old embryoid bodies were mechanically disrupted by pipetting with a 1 ml filter tip and plated in a 6 well plate coated with Geltrex (Life Technologies, Carlsbad, CA, United States). The cells were passaged with Accutase (Sigma-Aldrich, St. Louis, MO, United States) when reaching a confluency of 80%. Thereafter, cells were passaged several times every 5–7 days until the culture contained compact smNPC colonies (seven and eight passages). At this point, cells were frozen for a cell stock of pure smNPCs.
Differentiation Into Neurons
For rapid differentiation of smNPCs into neurons, the inducible lentivirus expression construct for the human transcription factor NEUROGENIN-2 (pLV_TRET_hNgn2_UBC_Blast_T2A_rtTA3) was introduced into the smNPCs (Menden et al., 2021). The vector contains NGN2 under control of the tetracycline operator and a blasticidin resistance. SmNPCs were plated at a cell density of 40,000/cm2 in a 12 well plate. The next day, the medium was refreshed containing 1 μM Thiazovivin and an hour later the virus was added. After 24 h, the cells were washed, and the medium was replaced with fresh expansion medium. 2–4 days later, cells were passaged and treated with 15 μg/ml Blasticidin (Invivogen, San Diego, CA, United States) for 15 days to select for the stable integration of the NGN2 vector. After the selection step, cells were frozen to create a cell stock from which cells were thawed when fresh NGN2_smNPCs were needed.
To induce neuronal differentiation for experiments, NGN2_smNPCs were seeded on multi-well-plates sequentially coated with 100 μg/ml Poly-L-ornithine (Sigma-Aldrich, St. Louis, MO, United States) and 10 μg/ml Laminin (Sigma-Aldrich, St. Louis, MO, United States). Cells were directly seeded in induction medium consisting of N2B27 medium supplemented with 2.5 μg/ml doxycycline (Sigma-Aldrich, St. Louis, MO, United States) and 2 μM DAPT (Cayman, Ellsworth, United States). At day 3 of differentiation, the medium was completely changed to differentiation medium containing N2B27 medium with 2.5 μg/ml doxycycline, 10 μM DAPT, 10 ng/ml BDNF, 10 ng/ml GDNF, 10 ng/ml NT 3 (Peprotech, Princeton, NJ, United States) and 0.5 μg/ml laminin. From day 6 on, half of the medium was refreshed every 3 days by differentiation medium without doxycycline and DAPT. Cells were differentiated for several time periods and then harvested or fixed or the according readout was performed (see Figure 1C).
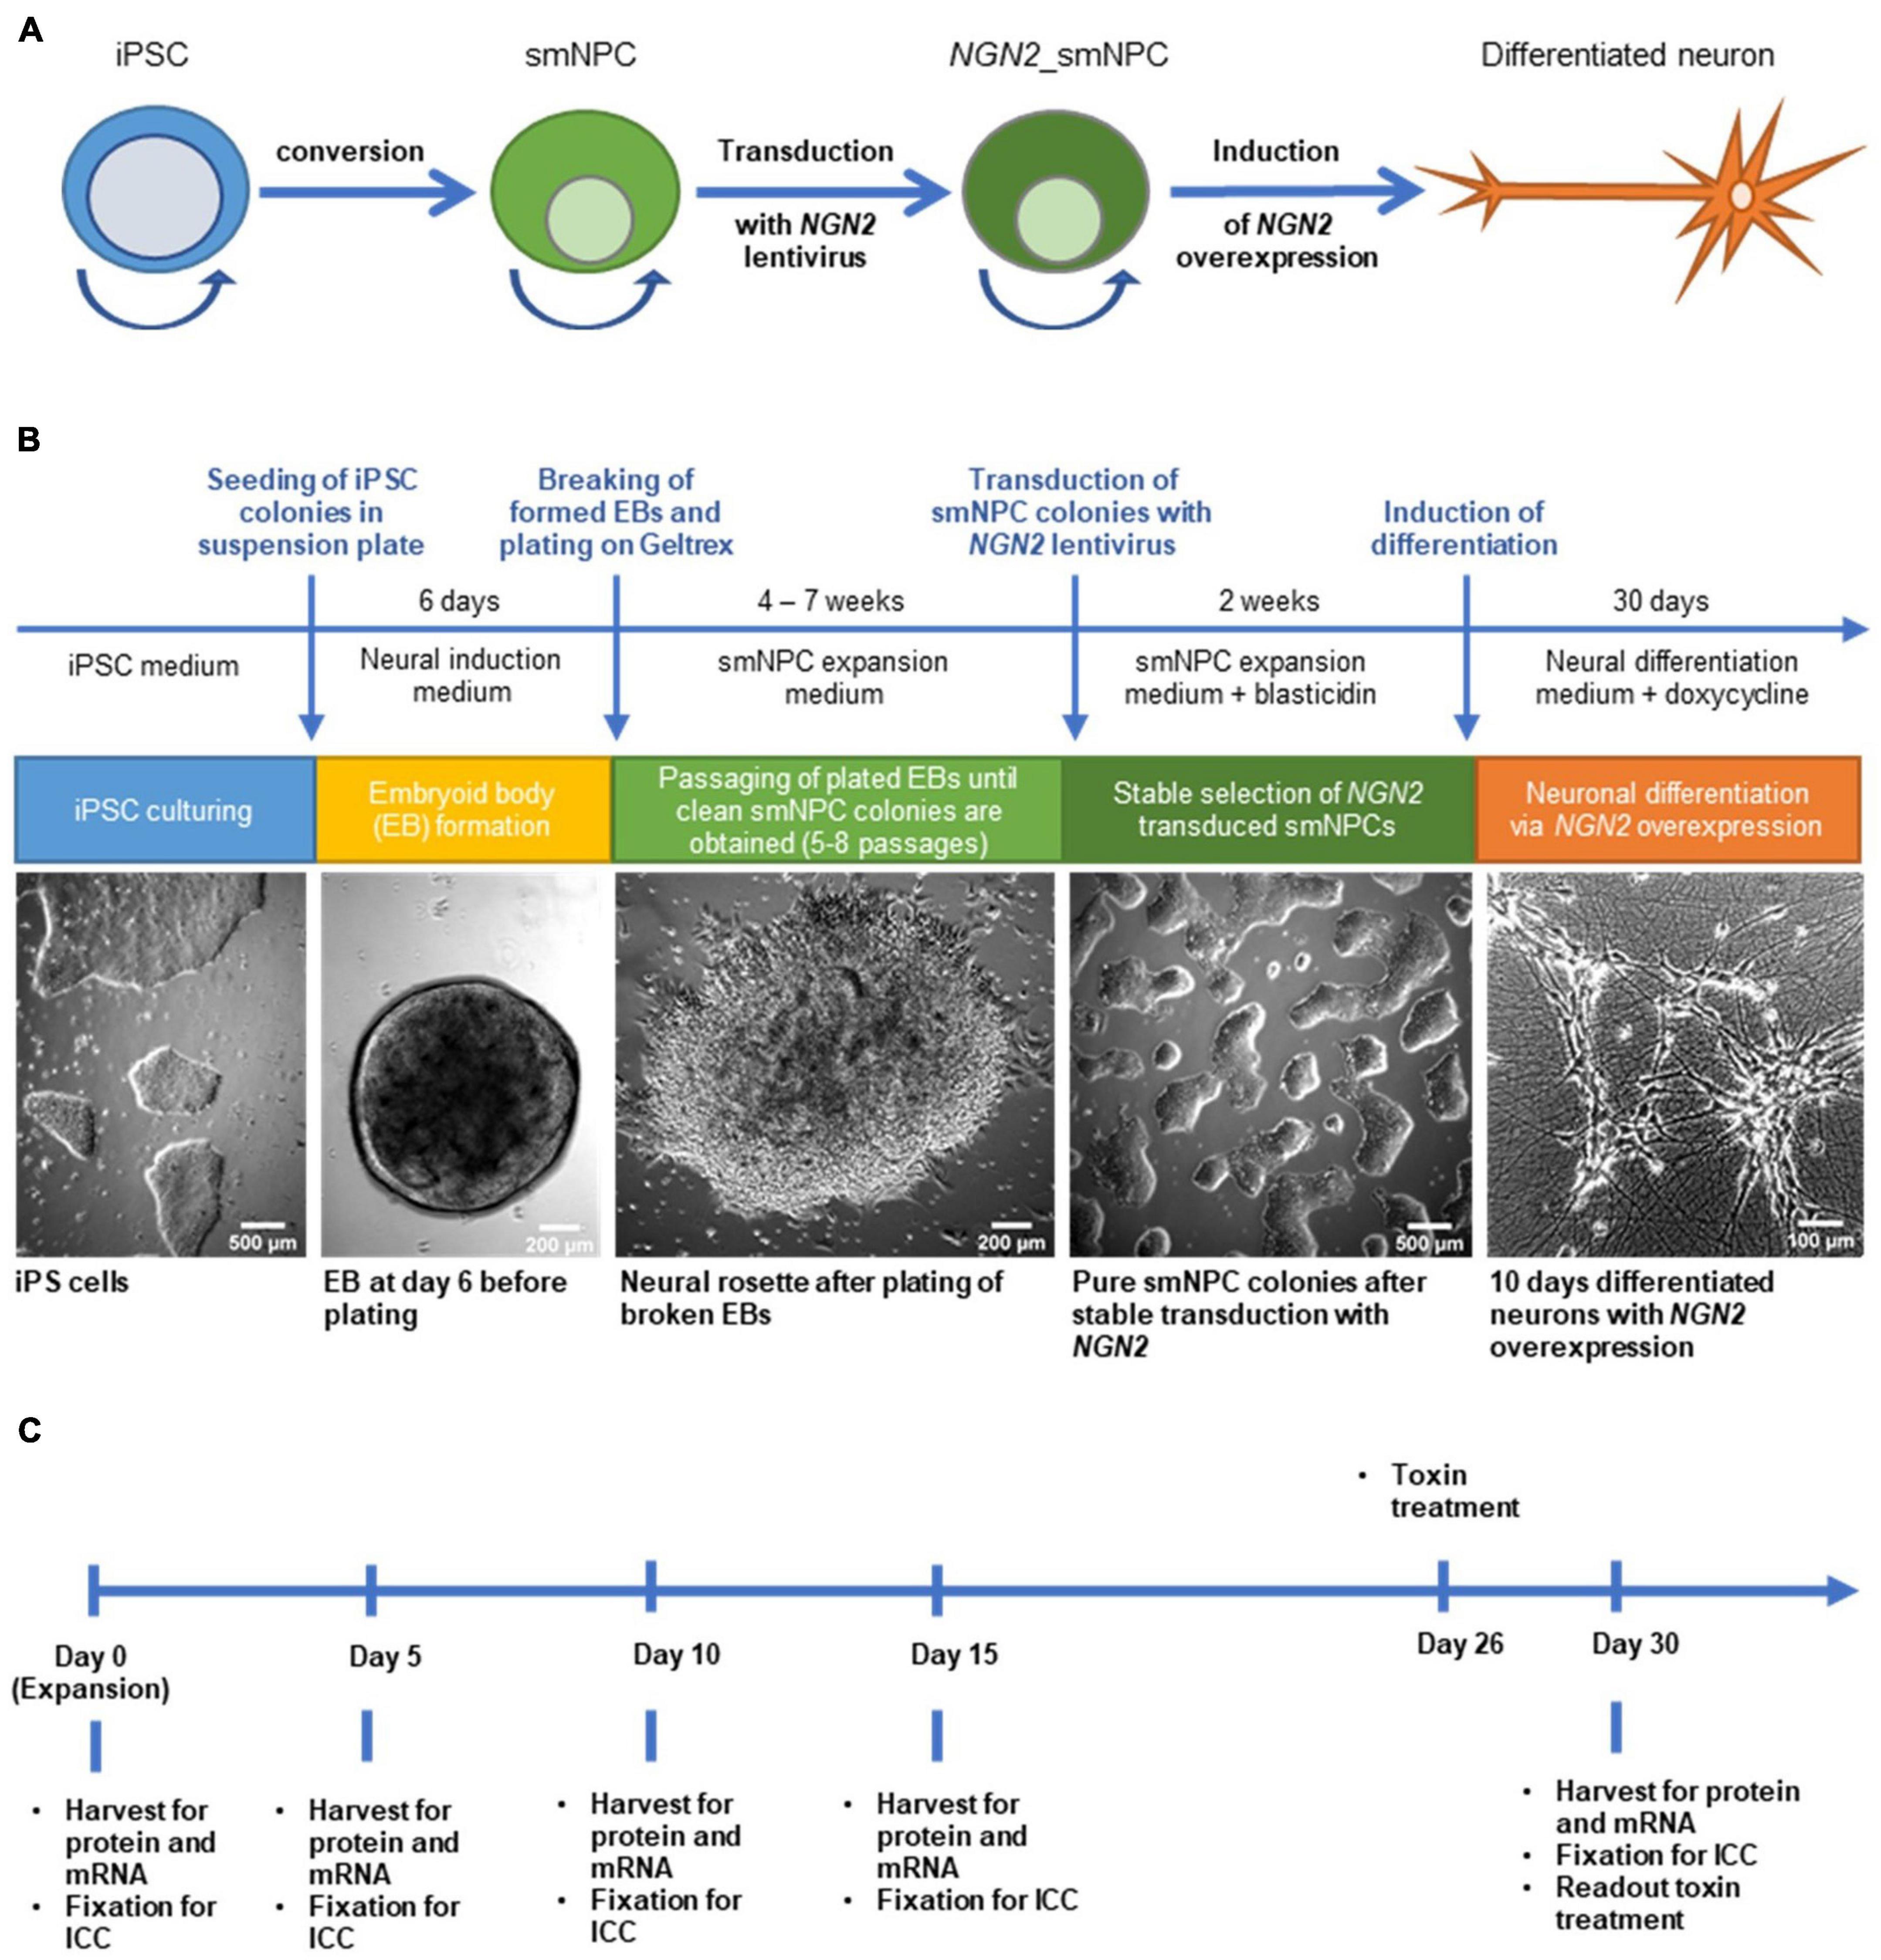
Figure 1. Generation of NGN2 inducible small molecule neural precursor cell lines (smNPC) from induced pluripotent stem cells (iPSC) and experimental timeline. (A) Schematic protocol overview. iPSC were converted into smNPC via embryoid body formation. Obtained smNPC colonies were transduced with NGN2-lentivirus to generate NGN2_smNPC which can be differentiated into neurons upon NGN2 overexpression. Round arrows indicate freezable and expandable cell populations. (B) Flow diagram of protocol procedure to generate differentiated neurons from iPSC. (C) Experimental timeline for differentiating neurons. Cells were harvested or fixed at five different time points for analysis.
Immunocytochemistry
Cells were seeded at a cell density of 30,000/cm2 in a 48 well plate on cover slips. The plates were fixed at different time points with 4% paraformaldehyde (Roth, Karlsruhe, Germany) for 10 min at room temperature and then washed twice with PBS. For immunofluorescent stainings, the cells were permeabilized with 0.2% triton-X in PBS. After washing twice with PBS, the cells were blocked in 1% BSA, 2% horse and goat serum, and 0.05% Tween in PBS for 1 h. Primary antibodies were diluted in blocking solution and incubated over night at 4°C (see Supplementary Table 1 for list of antibodies). The next day, the cells were washed twice with PBS-T and treated with secondary antibodies also diluted in blocking solution. After 2 h, cells were washed twice with PBS-T, then incubated for 10 min with DAPI (Thermo Fisher, Waltham, MA, United States; 1:1,000 in PBS) and washed with PBS. The cover slips were fixed on object slides with fluorescent mounting medium (Agilent Technologies, Santa Clara, CA, United States). The staining was analyzed using the Leica DMI6000B microscope (Leica Microsystems, Wetzlar, Germany) with a 40x air objective. Images were processed with the ImageJ software (Schindelin et al., 2012, 2015) and the brightness and contrast was set to the same values in all pictures from one staining. Cells were counted using the Cell Counter in the ImageJ software.
Quantitative Real-Time PCR
Cells were seeded at a cell density of 50,000/cm2 in a 6 well plate and harvested at different time points with RLT lysis buffer from the RNeasy plus mini kit (Qiagen, Hilden, Germany). mRNA was isolated according to the manufacturer’s instructions. For gene expression analysis by semi-quantitative real-time PCR (qPCR), cDNA was prepared from 500 ng mRNA per reaction with the iScript kit (Bio-Rad Laboratories, Hercules, CA, United States). The reverse transcription was performed according to the manufacture’s protocol. 5 ng of the complementary cDNA and 0.2 μM forward and reverse primers together with the SYBR green select qPCR supermix (Thermo Fisher, Waltham, MA, United States) were used for the qPCR reaction which was then run using the StepOne Plus system (Applied Biosystems, Waltham, MA, United States). Sequences of the utilized primers are listed in Supplementary Table 2. The following reaction protocol was applied: 2 min at 50°C, 2 min at 95°C, and 40 cycles of 15 s at 95°C and 60 s at 60°C. Afterward, the melting curve was recorded. The cycle threshold (Cτ) values represent cycle numbers at which reaction reaches exponential phase. A cDNA standard serial dilution was prepared from a pool of sample cDNA and was run for each primer on every plate. Relative mRNA expression levels from samples were calculated with this relative standard curve to ensure comparability of samples between plates. As internal control, three housekeeping genes were measured (UBQLN1, PSMC1, and GPBP1).
Western Blot
Cells were seeded in 6 well plates at a density of 50,000/cm2. At different time points, cells were harvested with M-PER lysis buffer (Thermo Fisher, Waltham, MA, United States) supplemented with protease inhibitors (cOmplete, Roche Basel, Switzerland) and phosphatase inhibitors (phoSTOP, Roche). The samples were incubated on ice for 15 min and then frozen at −80°C for at least 1 h to facilitate lysis of cells. After thawing, samples were incubated on ice for 15 min and then centrifuged at 2000 × g for 30 min. The supernatant containing the M-PER soluble protein fraction was transferred into a fresh tube and the protein concentration was measured with the BCA protein assay kit (Thermo Fisher, Waltham, MA, United States) with a BSA standard curve.
For insoluble protein extraction with sarkosyl, the remaining pellet was washed once with M-PER buffer and centrifuged at 45,000 rpm for 1 h. The supernatant was discarded, and the sarkosyl-buffer was added (1% sarkosyl, 10 mM Tris–HCl, 150 mM NaCl, and 5 mM EDTA). The pellet was disrupted by pipetting up and down, vortexing and was incubated at room temperature with shaking at 700 rpm. The samples were again ultracentrifuged at 45,000 rpm for 1 h and the supernatant (sarkosyl-soluble fraction) was collected as insoluble protein fraction. The protein concentration was measured as described before.
20 μg of protein were denatured with XT-buffer (95°C for 5 min) and loaded on 10% Bis-Tris Criterion polyacrylamide gels (Bio-Rad Laboratories, Hercules, CA, United States) and electrophoresis was run with MES running buffer at 150 V for 70 min (for detecting 4R TAU, 60 μg of protein was loaded). The protein transfer was carried out with a semidry blotting system (Trans-Blot Turbo Transfer System, Bio-Rad Laboratories, Hercules, CA, United States). Proteins were blotted on a 0.2 μm PVDF membrane for 40 min at 1 A and 25 V with transfer buffer containing 20% Methanol. After the transfer, the membrane was fixed in 0.4% paraformaldehyde for 20 min. After washing 3× with PBS, the membrane was blocked with 5% skimmed milk (Sigma-Aldrich, St. Louis, MO, United States) in TBS supplemented with 0.05% Tween-20 (Sigma-Aldrich, St. Louis, MO, United States; TBS-T) for at least 1 h and then incubated overnight at 4°C with the primary antibodies diluted in 1% BSA in TBS-T. The membrane was washed and incubated with secondary HRP-conjugated antibodies (diluted in 5% skimmed milk in TBS-T) for 1–2 h at room temperature. The blots were developed with Clarity Western ECL Substrate (Bio-Rad Laboratories, Hercules, CA, United States) or femto ECL (Thermo Fisher, Waltham, MA, United States) and the signal was detected with Odyssey Fc imaging system (LI-COR Biotechnology, Lincols, Netherlands). After imaging, the blots were analyzed with the Image StudioTM Software from LI-COR. The used primary antibodies are listed in Supplementary Table 3. The following secondary antibodies were used: HRP-coupled anti-mouse IgG (1:2,500, Vector Laboratories, Burlingname, CA, United States) and anti-rabbit IgG (1:5,000, Vector Laboratories, Burlingname, CA, United States).
For stripping, the membrane was rinsed after imaging with TBS-T and then incubated in stripping buffer for 20–30 min at 50°C. Thereafter, the membrane was washed thoroughly first with deionized water and then with TBS-T before blocking again with milk. The incubation with primary and secondary antibodies as well as the imaging was performed as described above.
Two protein standards were generated by pooling some microliter of samples from day 5 until day 30 from the MPER-soluble samples and the sarkosyl-soluble samples, respectively. The protein concentration was determined, and 20 μg protein was loaded on every SDS gel together with the samples of interest for the soluble and the insoluble fraction, respectively. Signals from every western blot were normalized to the signal from the protein standard. For 4R TAU western blots a separate protein standard was created only including samples from late differentiation time points to ensure a detectable signal. For every time point at least three independent replicates for each cell line were generated and analyzed via Western blot.
Toxin Treatment
Cells were seeded at a density of 20,000/well in a clear 96 well plate. At day 26 of differentiation, cells were treated with the mitochondrial inhibitor Annonacin. For the treatment, the toxin was diluted to a final concentration of 800 nM in differentiation medium. The medium in the plate was completely removed and replaced with medium containing the toxin. Cells were cultivated for four more days without media change. On day 30 of differentiation, the cell viability was assessed using the fluorescent dye Calcein-red-orange (Life Technologies, Carlsbad, CA, United States) and the MTT assay. First, the Calcein staining was carried out. An end concentration of 250 nM of the Calcein dye was added to the medium and the cells were incubated at 37°C for 30 min. Thereafter, the medium was completely removed and replaced by PBS. The fluorescence intensity was measured with the fluorescence microplate reader CLARIOstar from BMG Labtech (Ortenberg, Germany) at an excitation wavelength of 577 nm and emission wavelength of 620 nm. After the measurement, the cells were treated with the MTT solution to a final concentration of 500 ng/ml and incubated for an hour at 37°C. The medium was removed, and the plate was frozen at −80°C for at least 1 h and then thawed again to ensure cell lysis. The formed salt was dissolved in DMSO and the adsorption was measured at 570 nm. Each cell line was normalized to their own untreated control to account for possible differences in cell density.
Production of TAU Protein and Aggregates and TAU Uptake Experiment
Recombinant 2N4R TAU protein was produced as described before (Goedert and Jakes, 1990). In brief, TAU protein was expressed in E. coli BL21 under IPTG induction and extracted from bacterial cells by freeze-thawing cycle and sonication. The extract was purified by a boiling step followed by centrifugation and the supernatant was further purified by ion-exchange chromatography.
The aggregates were generated via incubation of TAU protein at 3 mg/ml (65 μM) in PBS pH 7.4 and 1 mM dithiothreitol in the presence of 130 μM Heparin (∼3,000 kDa, MP Biomedicals) and 1,500 rpm agitation for 36 h. To obtain pure fibrils, the aggregates were fractionated by using centrifugation at 100,000 × g for 30 min and subsequently to achieve oligomers, the supernatant was filtrated through a 100 kDa ultrafilter (Millipore). In order to fluorescently label TAU, monomers or aggregates were incubated for 1 h with 200 μM of ATTO488-NH-ester (ATTO-TEC, Siegen, Germany) at room temperature. The unbound probes were removed for monomers by using Bio-Spin 6 size exclusion spin columns (Bio-Rad Laboratories, Hercules, CA, United States) and for aggregates by three times washing with PBS after centrifugation and filtration. The concentration of the monomers and aggregates was measured with a BCA assay kit. The proteins were preserved in −80 after flash-freezing in liquid nitrogen for further experiments.
For the uptake assay, NGN2_smNPCs were cultured in clear bottom black 96 well tissue culture plates (PerkinElmer). Between day 8 and 10 of differentiation, cells were incubated with 500 nM labeled TAU monomers, oligomers or fibrils for 3 h. Then, the medium was changed and fluorobrite DMEM (Gibco) containing 0.05% Trypan Blue was added to quench the extracellular fluorescence signal. The fluorescence was measured by a 20 × 20 matrix using CLARIOStar microplate reader. Since the cell density of each line was slightly different, to compare the TAU uptake among various lines, we used the viable cell staining Calcein-green in different wells of the same line in parallel to the uptake assay. The overall fluorescence from TAU uptake was normalized to the Calcein fluorescence intensity.
Statistical Analysis
All statistical data analyses were performed with GraphPad Prism 9.1.0 for Windows (GraphPad Software, San Diego, CA, United States).4 Data displaying MAPT haplotype groups are represented as mean ± SEM of n = 4 cell lines for each haplotype. When individual cell lines are displayed, data are represented as mean ± SEM of independent experiments. Data with two factors (e.g., time and genotype) were analyzed with two-way ANOVA followed by a post hoc Tukey’s test or Sidak’s test. Otherwise, an unpaired t-test was used. Specifications are given in each figure legend.
Results
Differentiation and Characterization of All Human iPS Cell Lines
We selected 8 iPS cell lines from healthy donors from the European Collection of Authenticated Cell Cultures (ECACC; Table 1) according to their MAPT haplotype (four H1/H1 and four H2/H2 lines), their passage number and pluripotency scores, as well as their donors’ age and sex. All iPS cell lines were converted into smNPC via embryoid body formation and dual SMAD inhibition (Figures 1A,B). Thereafter, we treated the smNPCs with NEUROGENIN-2 (NGN2)-lentivirus and selected via antibiotic resistance for a stable integration (Dhingra et al., 2020). The obtained NGN2_smNPCs could be cryopreserved (master and working cell bank) or kept in expansion for several weeks (up to twelve passages). Differentiation was achieved by inducing the NGN2 overexpression via doxycycline addition. For the experimental procedures, we differentiated cells for 5, 10, 15, and 30 days and expanding cells were used as day 0 reference (Figure 1C). The cells were characterized with different markers via immunocytochemistry.
First, we stained the neural progenitor marker NESTIN, the neuronal marker MAP2 and the glial marker GFAP at all time points (Figure 2A and Supplementary Figures 1A,B). Nearly all proliferating cells expressed NESTIN (96%) while only 16% were MAP2 positive, indicating that some spontaneous differentiation is occurring in those cells. After 5 days of differentiation, MAP2 staining was upregulated significantly to 90% and stayed on this high level until day 30. NESTIN immunoreactive cells on the other hand were continuously decreasing until only 10% at day 15 and 30. The remaining NESTIN positive cells at day 30 were MAP2 negative and displayed a non-neuronal morphology (Figure 2D). This indicated an insufficient differentiation into neurons for these few cells. Supplementary Figure 2A shows similar MAP2 staining and cell morphology at 30 days of differentiation for all cell lines. Glial cells were absent from cell culture in nearly all cell lines over the whole differentiation period (Figure 2A). Only in one cell line, GFAP positive cells could be detected at day 30 (3%; Figure 2D).
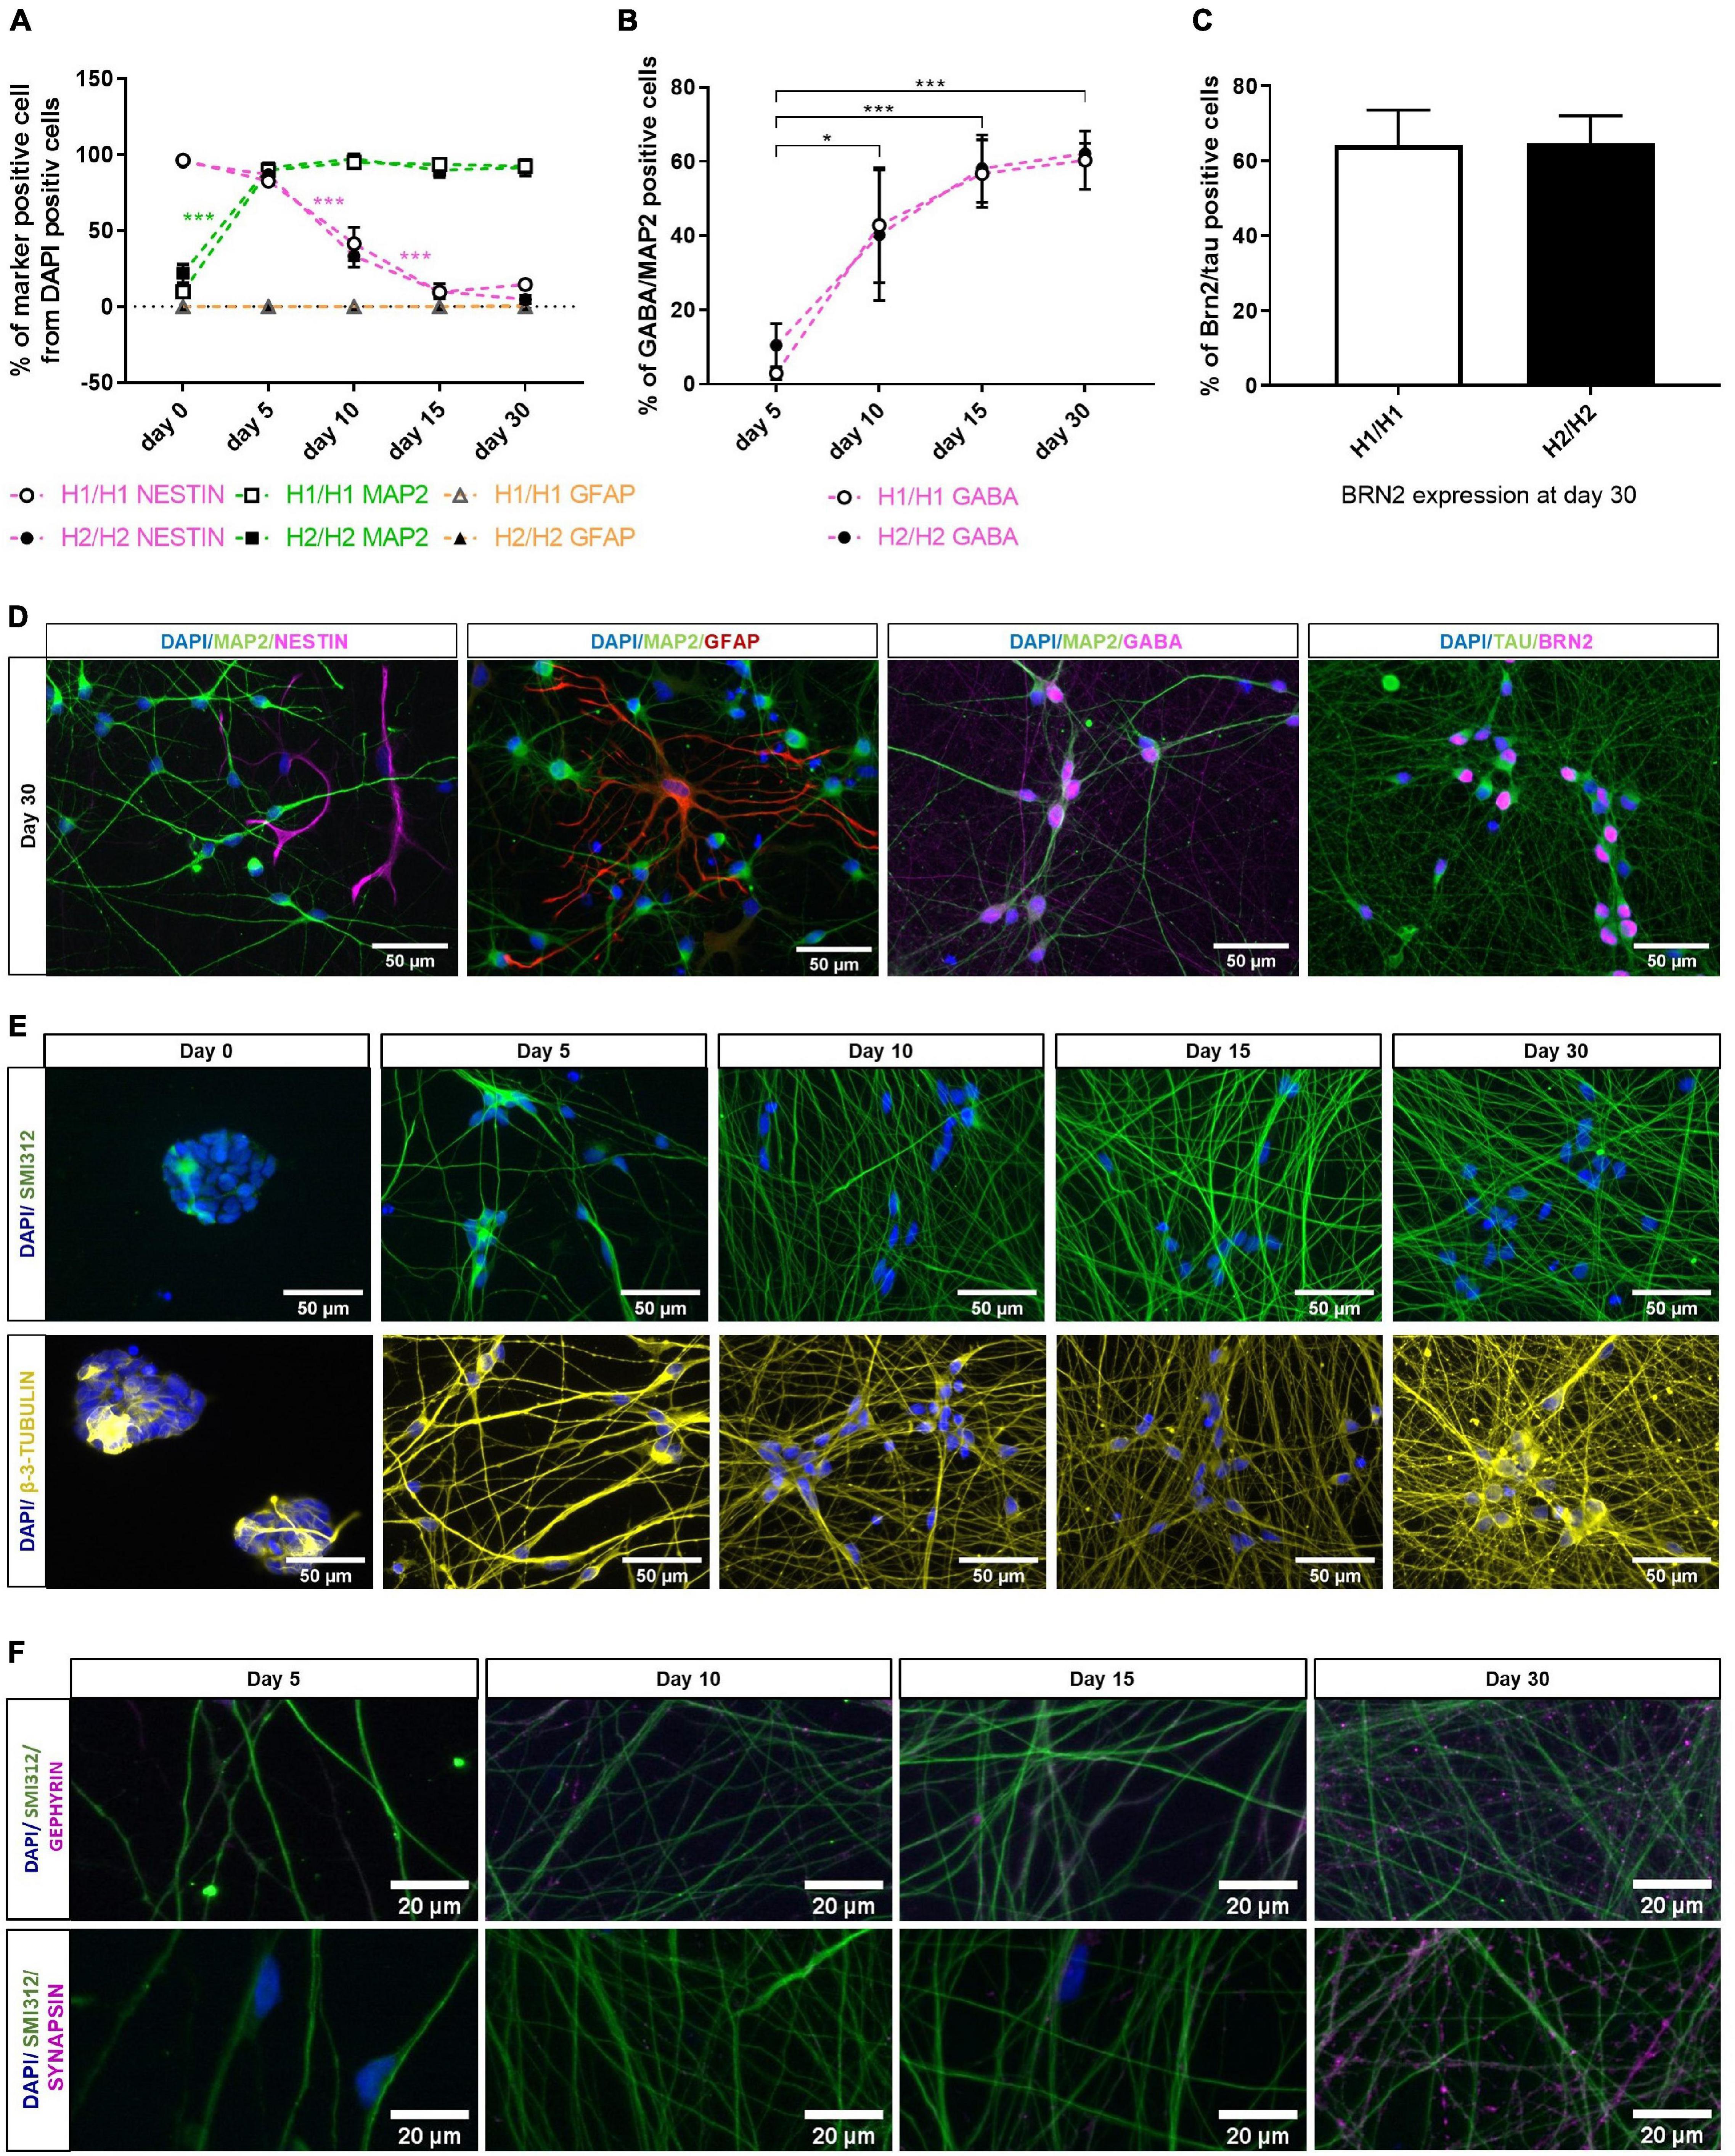
Figure 2. Characterization of differentiated neurons overtime with immunocytochemistry. (A) Quantification of different cell types with dendritic marker MAP2, neural progenitor marker NESTIN and glia marker GFAP over differentiation time of 30 days. MAP2 expression increases significantly upon differentiation, while percentage of NESTIN positive cells decreases. Glia cells are nearly absent from cell culture (under 1% at day 30). Data are represented as mean ± SEM of n = 4 cell lines for each haplotype group. Two-way ANOVA followed by Tukey’s test was performed. ***p < 0.001. (B) GABA expression is significantly upregulated during differentiation period. At day 30 of differentiation, 61% of neuronal cells (MAP2 positive cells) are GABAergic (GABA positive cells). Data are represented as mean ± SEM of n = 4 cell lines for each haplotype group. Two-way ANOVA followed by Tukey’s test was performed. *p < 0.05, ***p < 0.001. (C) 65% of TAU-positive neurons express marker for cortical layer 2/3 neurons (BRN2) at day 30 of differentiation. Data are represented as mean ± SEM of n = 4 cell lines for each haplotype group. (D) Representative immunofluorescent images at day 30 of differentiation with neuronal markers MAP2, TAU, GABA, and BRN2 as well as the neural progenitor marker NESTIN and the glia marker GFAP. See also Supplementary Figures 1, 2. (E) Immunofluorescent images of axonal markers SMI312 (neurofilament) and β-3-TUBULIN (microtubules) show a growing and maturing neuronal network over the differentiation time of 30 days. (F) Immunofluorescent staining with the presynaptic marker SYNAPSIN and the postsynaptic marker GEPHYRIN over time show presents of pre- and postsynapses along the axons (stained with SMI312) at day 30 of differentiation. Immunofluorescent images are taken from an H2/H2 cell line.
Initially described differentiation of iPSCs into neurons via NGN2 overexpression have found expression of cortical and GABAergic markers in the resulting neurons (Zhang et al., 2013). We therefore stained the cells for the neurotransmitter GABA (Figures 2B,D and Supplementary Figure 1C) and the cortical marker BRN2 (Figures 2C,D and Supplementary Figure 2D) for further specification of the neuronal identity of our cells. In expanding smNPCs, a strong unspecific staining with the GABA antibody was visible (Supplementary Figure 1C). This time point was therefore excluded from quantitative analysis of GABAergic cells. At day 5 of differentiation, only 7% of neurons expressed GABA. But with ongoing differentiation time, GABA is significantly upregulated so that the percentage of GABAergic neurons increased significantly to 61% at 30 days of differentiation. Until day 15, the signal was mainly localized in the soma and soma-near processes (Supplementary Figure 1C), at day 30, however, GABA expression was also visible along the neuronal network (Figure 2D). Although there was some variation in the signal intensity of the GABA staining (Supplementary Figure 2C) and the percentage of GABAergic neurons between cell lines (ranging from 41 to 78% at day 30), there was no statistically significant difference between the two haplotype groups H1/H1 and H2/H2 (Figure 2B).
Next, cells were stained with cortical layer 2/3 marker BRN2 (Figure 2C). Because BRN2 lacks specificity in expanding smNPC and early differentiating cells, we assessed BRN2 staining only at day 30 of differentiation, in combination with the pan-neuronal marker TAU as normalization for all neurons (Figure 2D). At this time point, on average 65% of TAU-positive neurons expressed BRN2 in both cell line groups. Supplementary Figure 2D shows a comparable staining pattern for the cortical marker BRN2 and the neuronal marker TAU for all cell lines at day 30 of differentiation.
Furthermore, one representative cell line was stained with the axonal markers SMI312 (neurofilament) and β-3-TUBULIN (microtubules; Figure 2E). Both markers showed a growing and maturing neuronal network over the differentiation time of 30 days. The same cell line was additionally stained with the presynaptic marker SYNAPSIN and the postsynaptic marker GEPHYRIN which show the presents of pre- and postsynapses along the axons at day 30 of differentiation (Figure 2F).
In general, NESTIN and MAP2 immunostaining could show an effective and fast differentiation of NGN2_smNPCs into 90% neurons via NGN2 overexpression. Although there were some minor differences, all cell lines had a comparable differentiation efficiency. Additionally, we could show the cortical and GABAergic identity of our cells at day 30 of differentiation. All in all, the cells generated a dense neuronal network and expressed important neuronal markers.
TAU Expression in Differentiated Neurons With Homozygous H1 or H2 MAPT Haplotypes
Although the MAPT haplotype spans a region of 1.8 Mb with several genes, the MAPT gene coding for TAU is of special interest when investigating the underlying mechanisms of the H1-dependent risk for tauopathies. Some studies have shown a differential TAU expression between H1/H1 and H2/H2 genotypes (mainly on mRNA level; Kwok et al., 2004; Caffrey et al., 2006; Myers et al., 2007). We therefore studied the TAU expression on an mRNA as well as on a protein level in our cell lines.
First, TAU expression was visualized during the differentiation period of 30 days by staining one cell line with total TAU, 3R TAU, and 4R TAU antibodies (Figure 3A). Total TAU and 3R TAU displayed a similar staining pattern with signals in the soma as well as in the axons of neurons. A staining was visible from day 5 (total TAU) or day 10 (3R TAU) onward and showed a more extensive neuronal network over time. The 4R TAU isoform was only detectable at a differentiation time of 30 days via immunostaining and even then, the signal remained weak and mainly visible in the soma and only faintly in the axons. At day 30 of differentiation all cell lines were stained with the total TAU antibody (Supplementary Figure 2B). Although there were a few minor differences in TAU staining, the neuronal network looks overall very similar and there were no obvious differences visible that manifested between the MAPT haplotype groups.
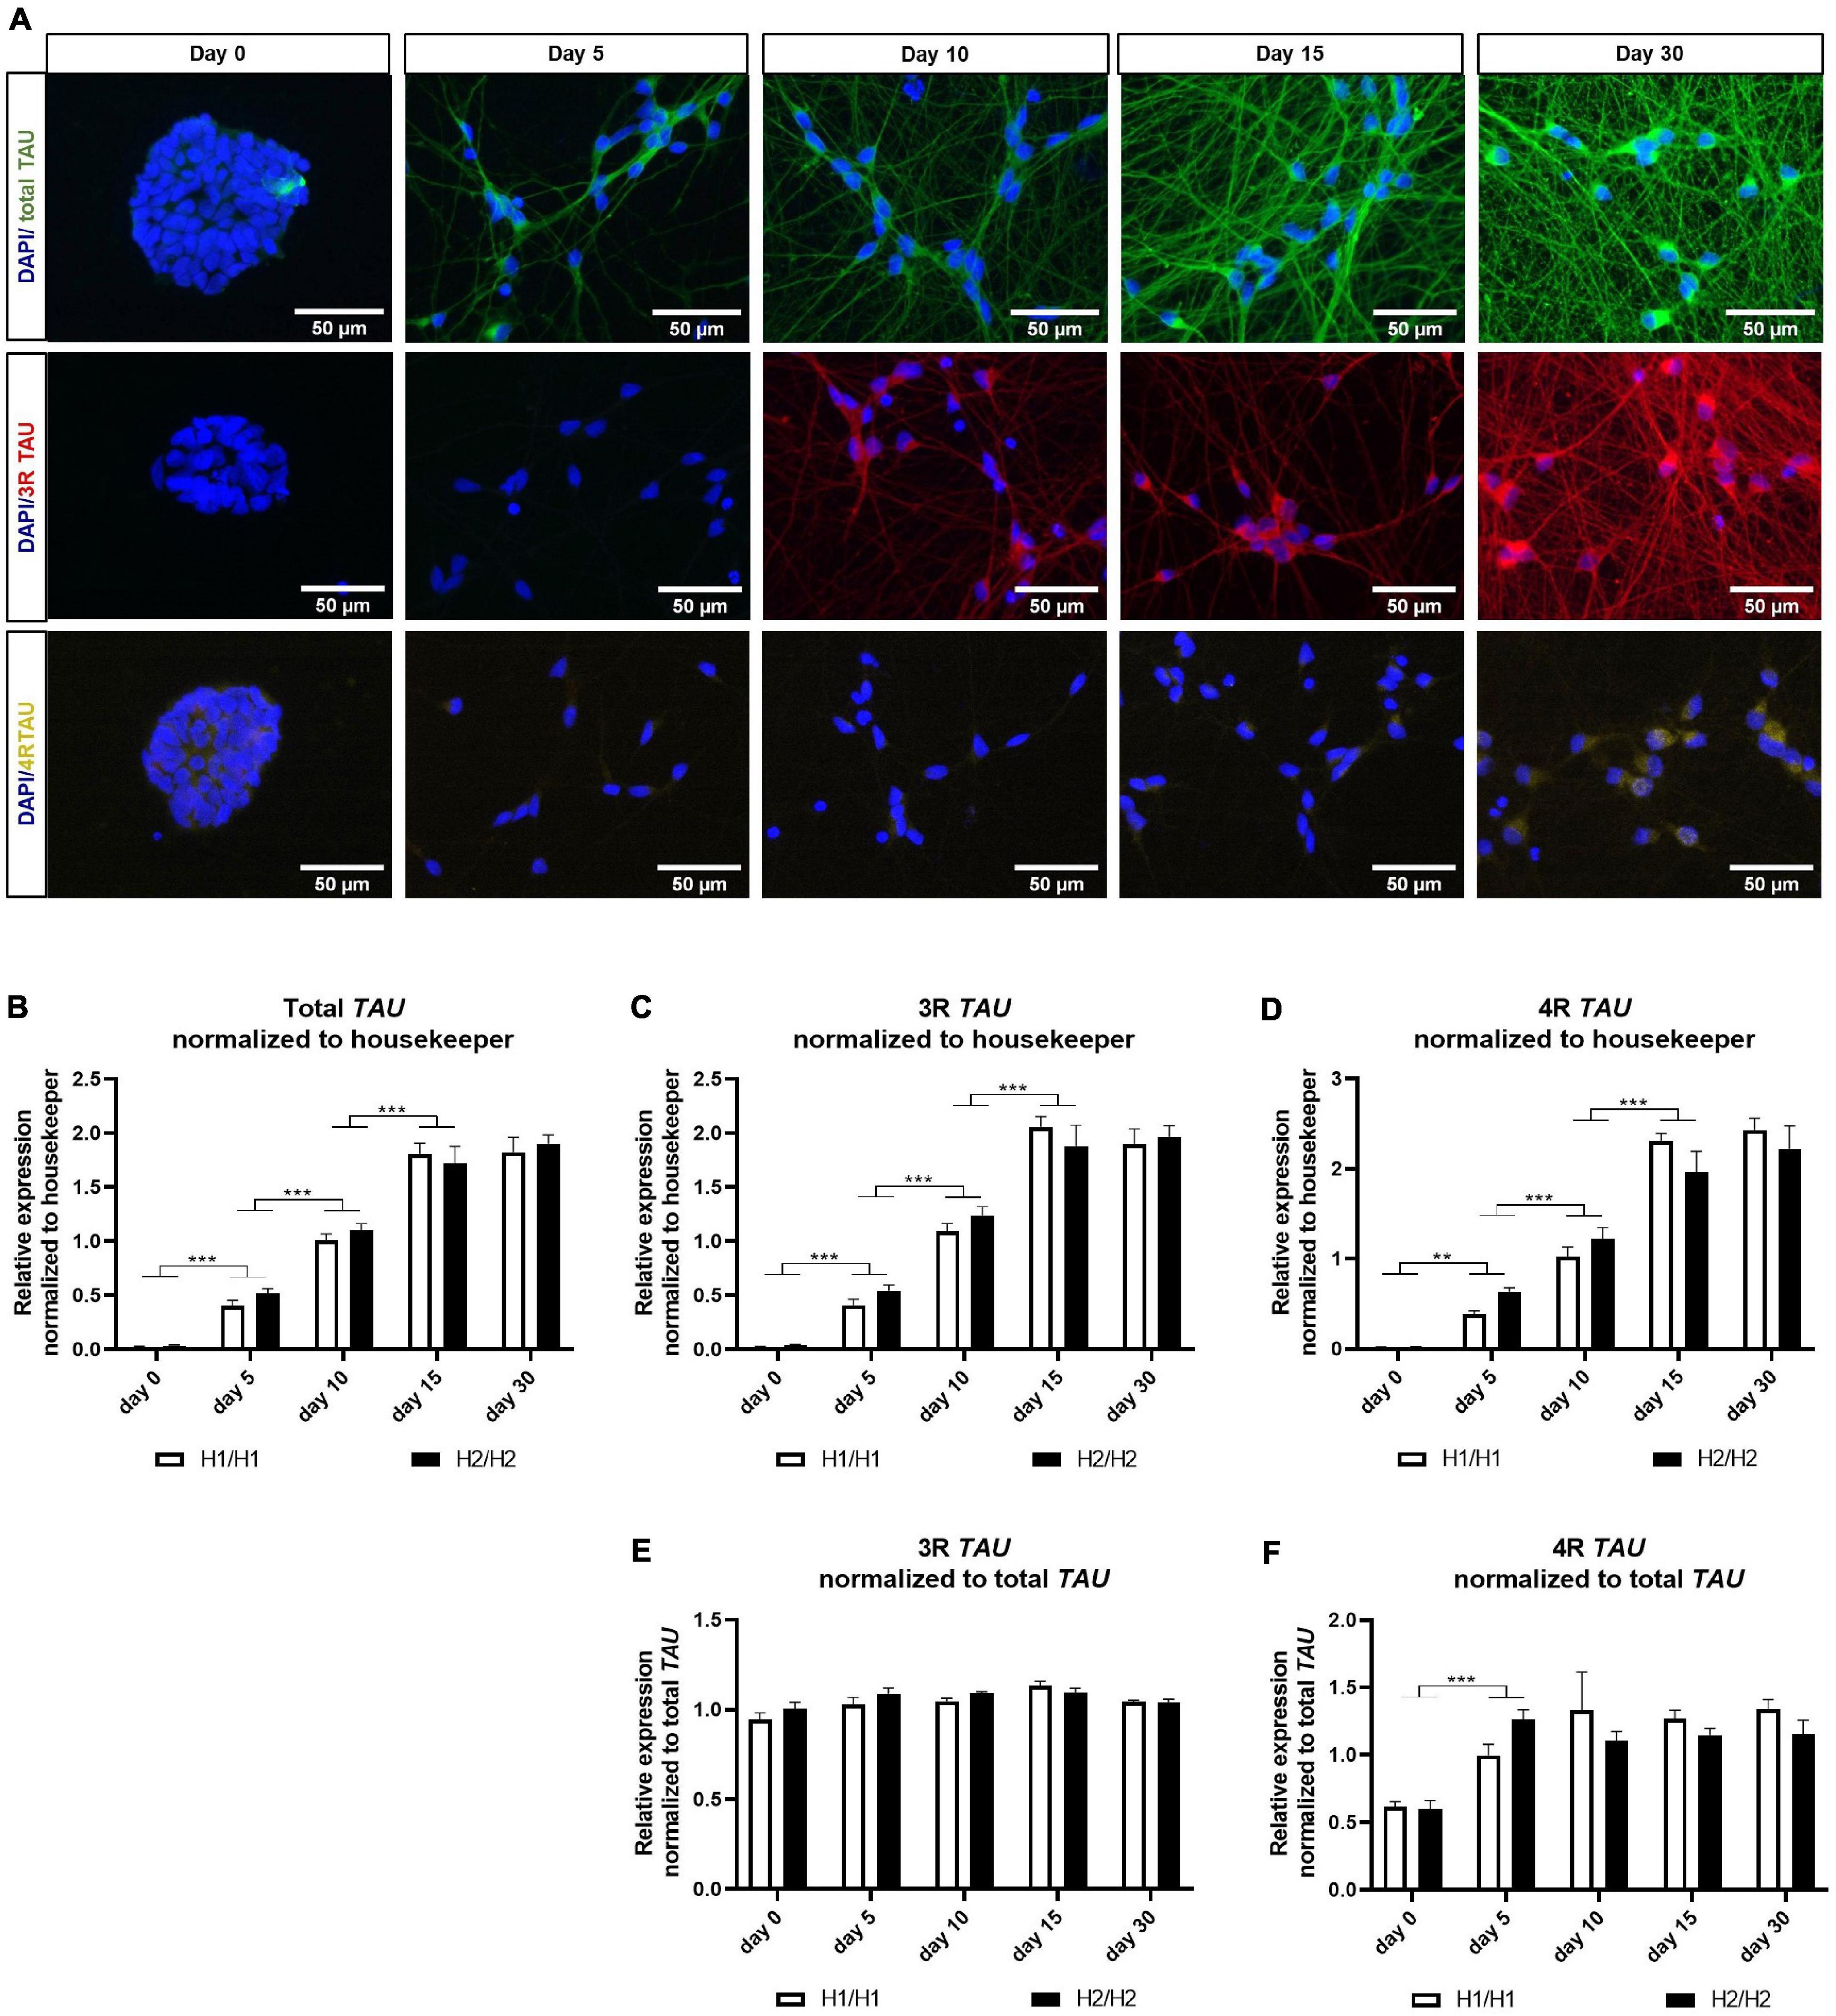
Figure 3. Immunofluorescent and qPCR analysis of TAU and its isoforms. (A) Immunofluorescent images of total TAU, 3R TAU, and 4R TAU over differentiation time of 30 days. Total TAU and 3R TAU stain the axons and the soma of cells from day 5 and 10 onward, respectively, and show a maturing neuronal network with increasing differentiation time. 4R TAU is only detectable at day 30 of differentiation. Images are taken from an H2/H2 cell line. (B–D) qPCR data for total TAU (B) 3R TAU isoform (C) and 4R TAU isoform (D) normalized to the three housekeeping genes UBQLN1, PSMC1, and GPBP1. Total TAU as well as 3R and 4R TAU mRNA levels increase significantly with differentiation time until day 15. No expression differences could be detected between H1/H1 and H2/H2 haplotype groups. Data are represented as mean ± SEM of n = 4 cell lines for each haplotype group. For each cell line at least two independent repeats were analyzed. Two-way ANOVA followed by Tukey’s test was performed. **p < 0.01, ***p < 0.001. (E,F) qPCR data for 3R and 4R TAU isoform normalized to total TAU levels. While 3R mRNA levels relative to total TAU levels stay constant over differentiation period, 4R TAU levels increase significantly from day 0 to day 5 and then also remain unchanged. No expression differences could be detected between H1/H1 and H2/H2 haplotype groups. Data are represented as mean ± SEM of n = 4 cell lines for each haplotype group. For each cell line at least two independent repeats were analyzed. Two-way ANOVA followed by Tukey’s test was performed. **p < 0.01, ***p < 0.001.
To investigate TAU expression on an mRNA level, we performed qPCR with primers specific for total TAU, 3R TAU, or 4R TAU isoforms (Figures 3B–F). We could observe a significant increase in all three mRNA levels from day 0 to day 15 of differentiation (Figures 3B–D). From day 15 to day 30, mRNA levels remained unchanged for both isoforms and total TAU. When normalizing the 3R and 4R data to total TAU levels (Figures 3E,F), the 3R TAU level stayed unchanged over time. 4R TAU on the other hand increased significantly from day 0 to day 5, indicating an upregulation of this isoform with the start of differentiation. For the remaining differentiation time the 4R level stagnated. No expression differences for total TAU or any of the isoforms could be detected between H1/H1 and H2/H2 haplotype groups.
Next, we studied the expression of the TAU protein with multiple TAU antibodies at different time points in the soluble as well as in the insoluble protein fraction (Figures 4, 5). The total TAU levels were assessed with two different antibodies: the polyclonal TAU antibody from Dako and the monoclonal TAU-5 antibody (Figures 4A,B). Both antibodies showed a strong increase in TAU expression during differentiation with the highest TAU levels at day 30. The same was visible in the insoluble fraction (Figures 4E,F). For 3R and 4R TAU, the data was normalized to total TAU to assess changes in isoform levels independent from overall TAU levels. 4R TAU was only detectable from day 15 onward and with a very weak signal, making 3R TAU the predominant TAU isoform expressed in this cell model during early maturation stages (Figures 4C,D). The 3R TAU level stayed constant during the differentiation time until day 15 and then significantly decreased to day 30. In accordance with these data, the 4R TAU level increased significantly from day 15 to day 30. In the insoluble protein fraction, no 4R TAU could be detected and the 3R TAU level remained unchanged over the whole differentiation period (Figures 4G,H). There were no significant expression differences in total TAU nor in one of the TAU isoforms between cell lines of different MAPT haplotype groups, neither in the soluble nor in the insoluble fraction.
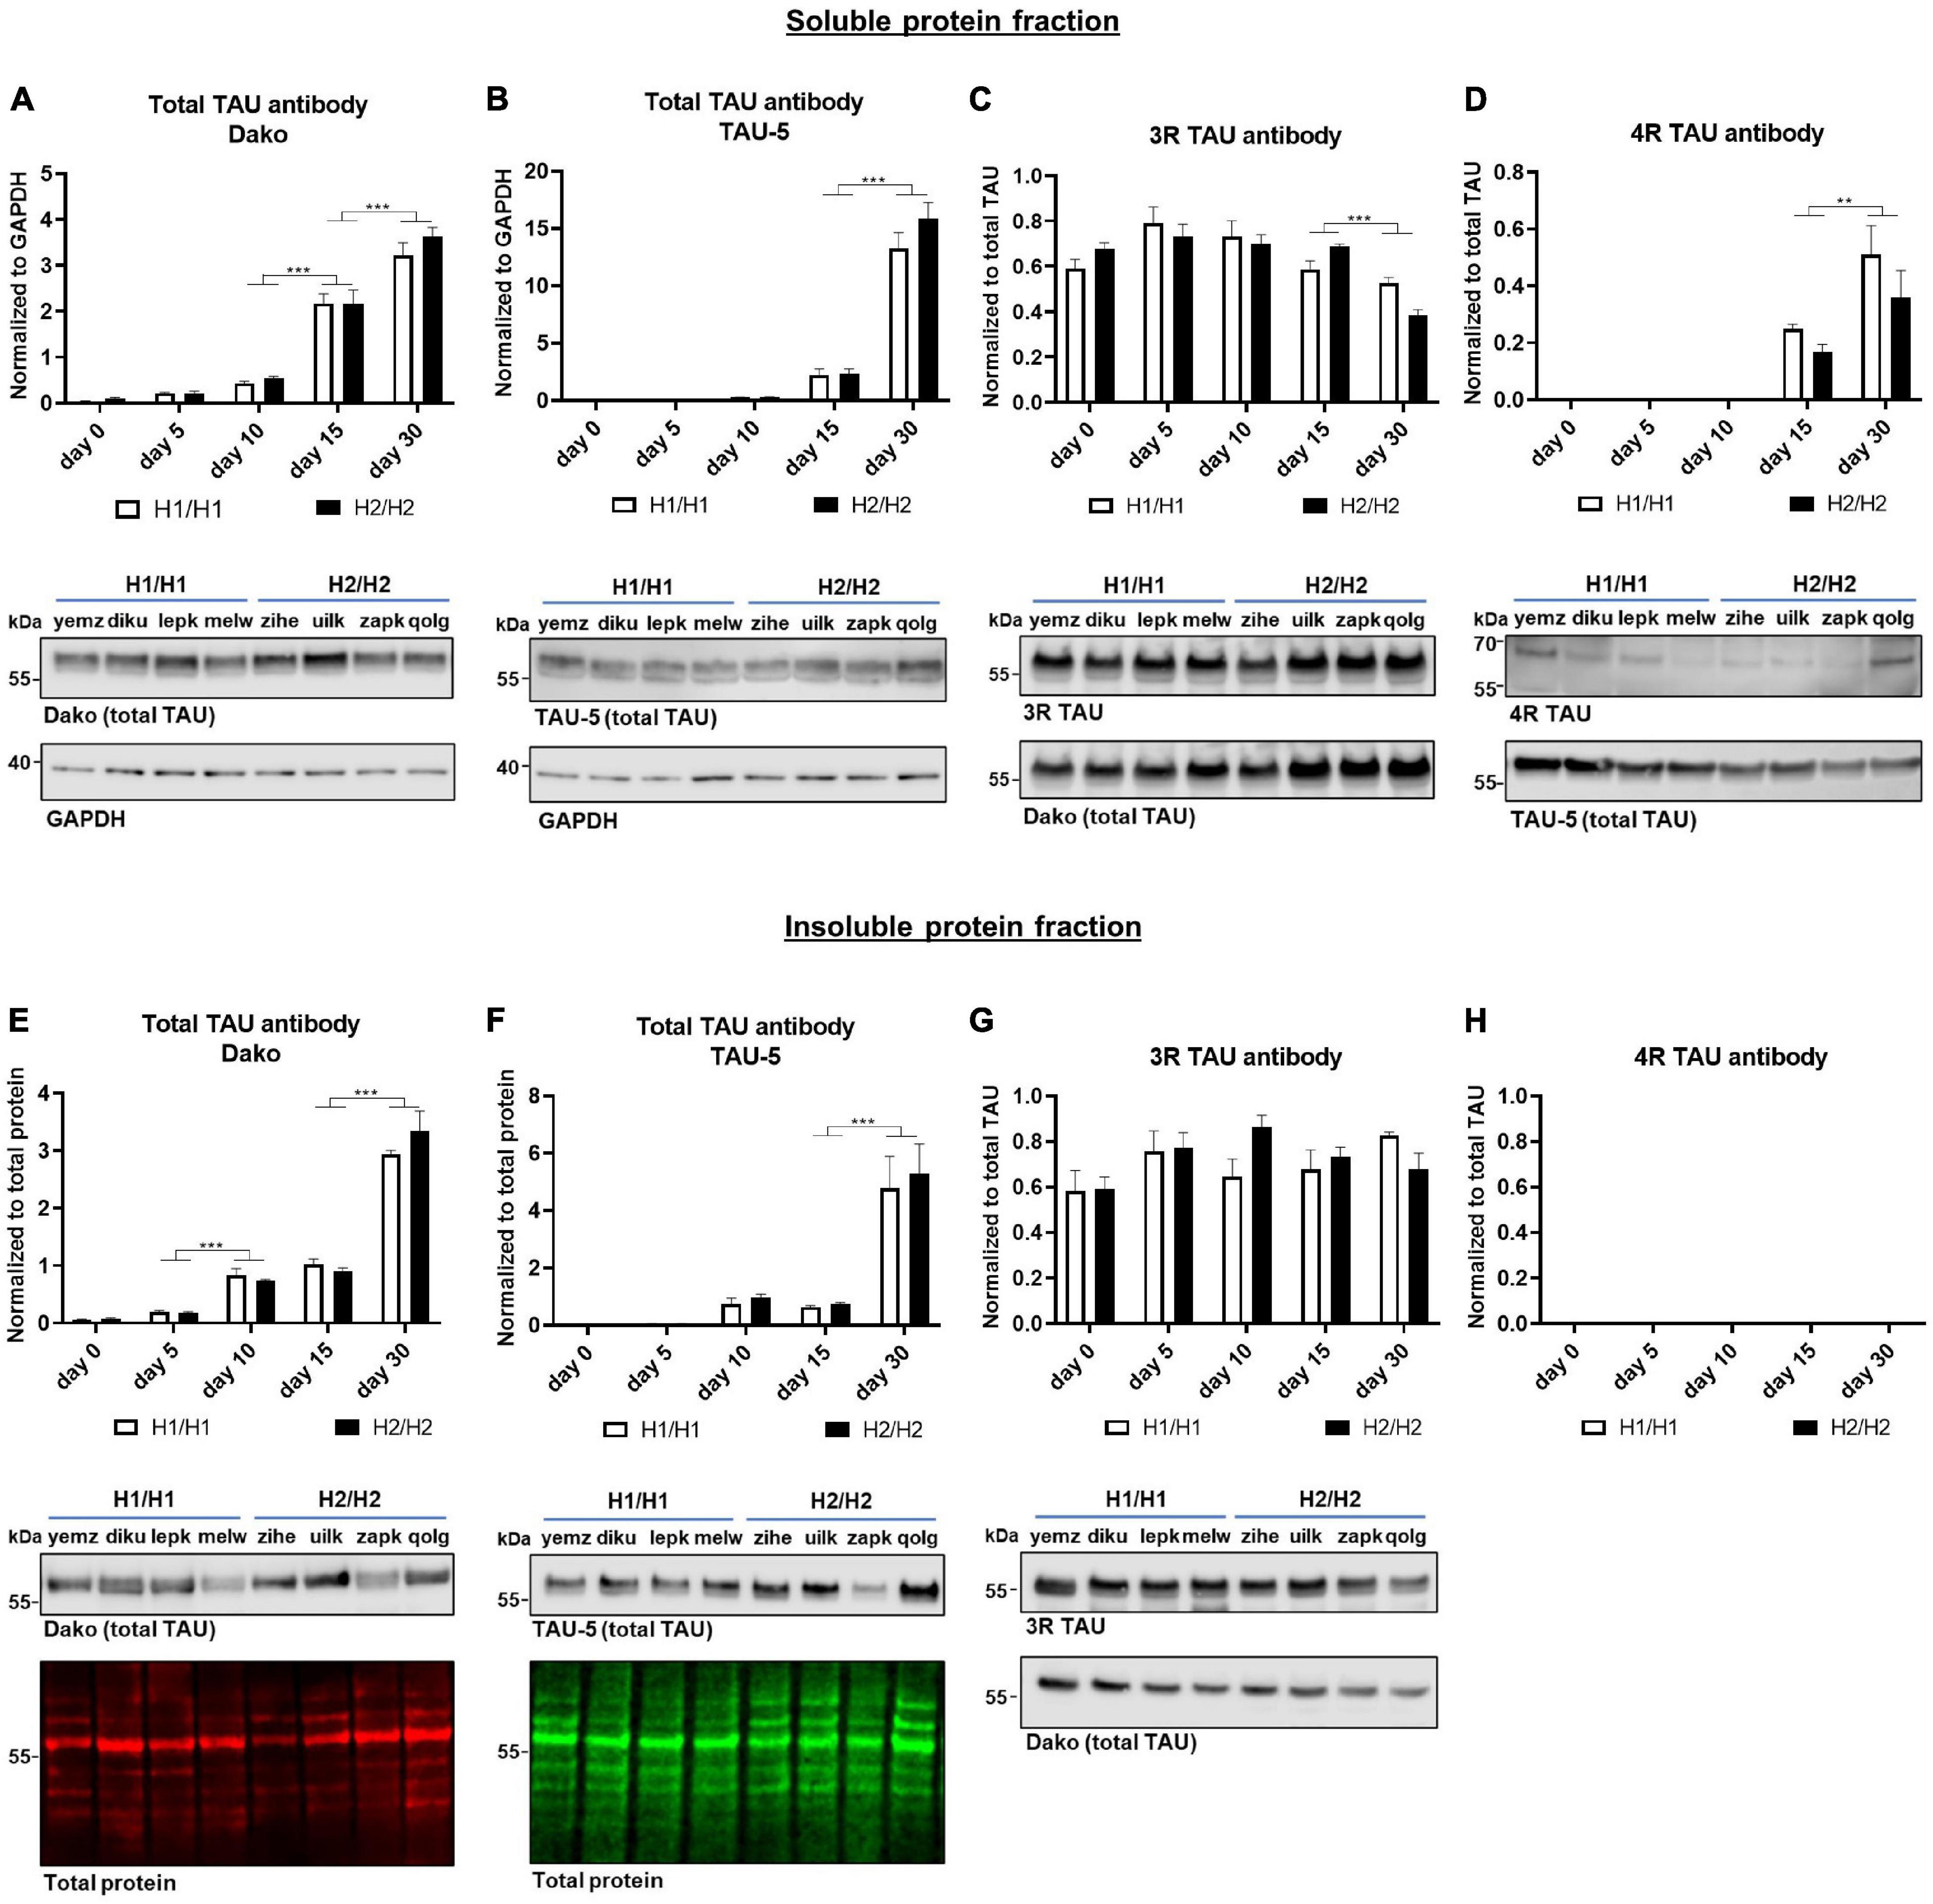
Figure 4. Western blot analysis over time with total TAU, 3R, and 4R TAU antibodies. (A–D) Western blot of soluble protein fraction. Total TAU expression was assessed with Dako and TAU-5 antibody (A,B) and normalized to GAPDH. Total TAU levels increase significantly over time. While 3R TAU expression relative to total TAU (C) stays constant until day 15 and then decreases significantly, 4R TAU (D) is only detectable from day 15 onward and increases further to day 30. (E–H) Western blot of insoluble protein fraction. Total TAU levels were assessed with Dako and TAU-5 antibody (E,F) and normalized to total protein. Total TAU expression in insoluble fraction increased significantly over time. 4R TAU (H) is not detectable while the 3R TAU level (G) remains unchanged over time when normalized to total TAU levels. No significant differences could be detected between H1/H1 and H2/H2 haplotype groups for any of the antibodies or fractions. Data are represented as mean ± SEM of n = 4 cell lines for each haplotype group. For each cell line at least three independent repeats were analyzed. Two-way ANOVA followed by Tukey’s test was performed. **p < 0.01, ***p < 0.001. Displayed Western blot pictures are representative blots from day 30 of differentiation for the respective antibody.
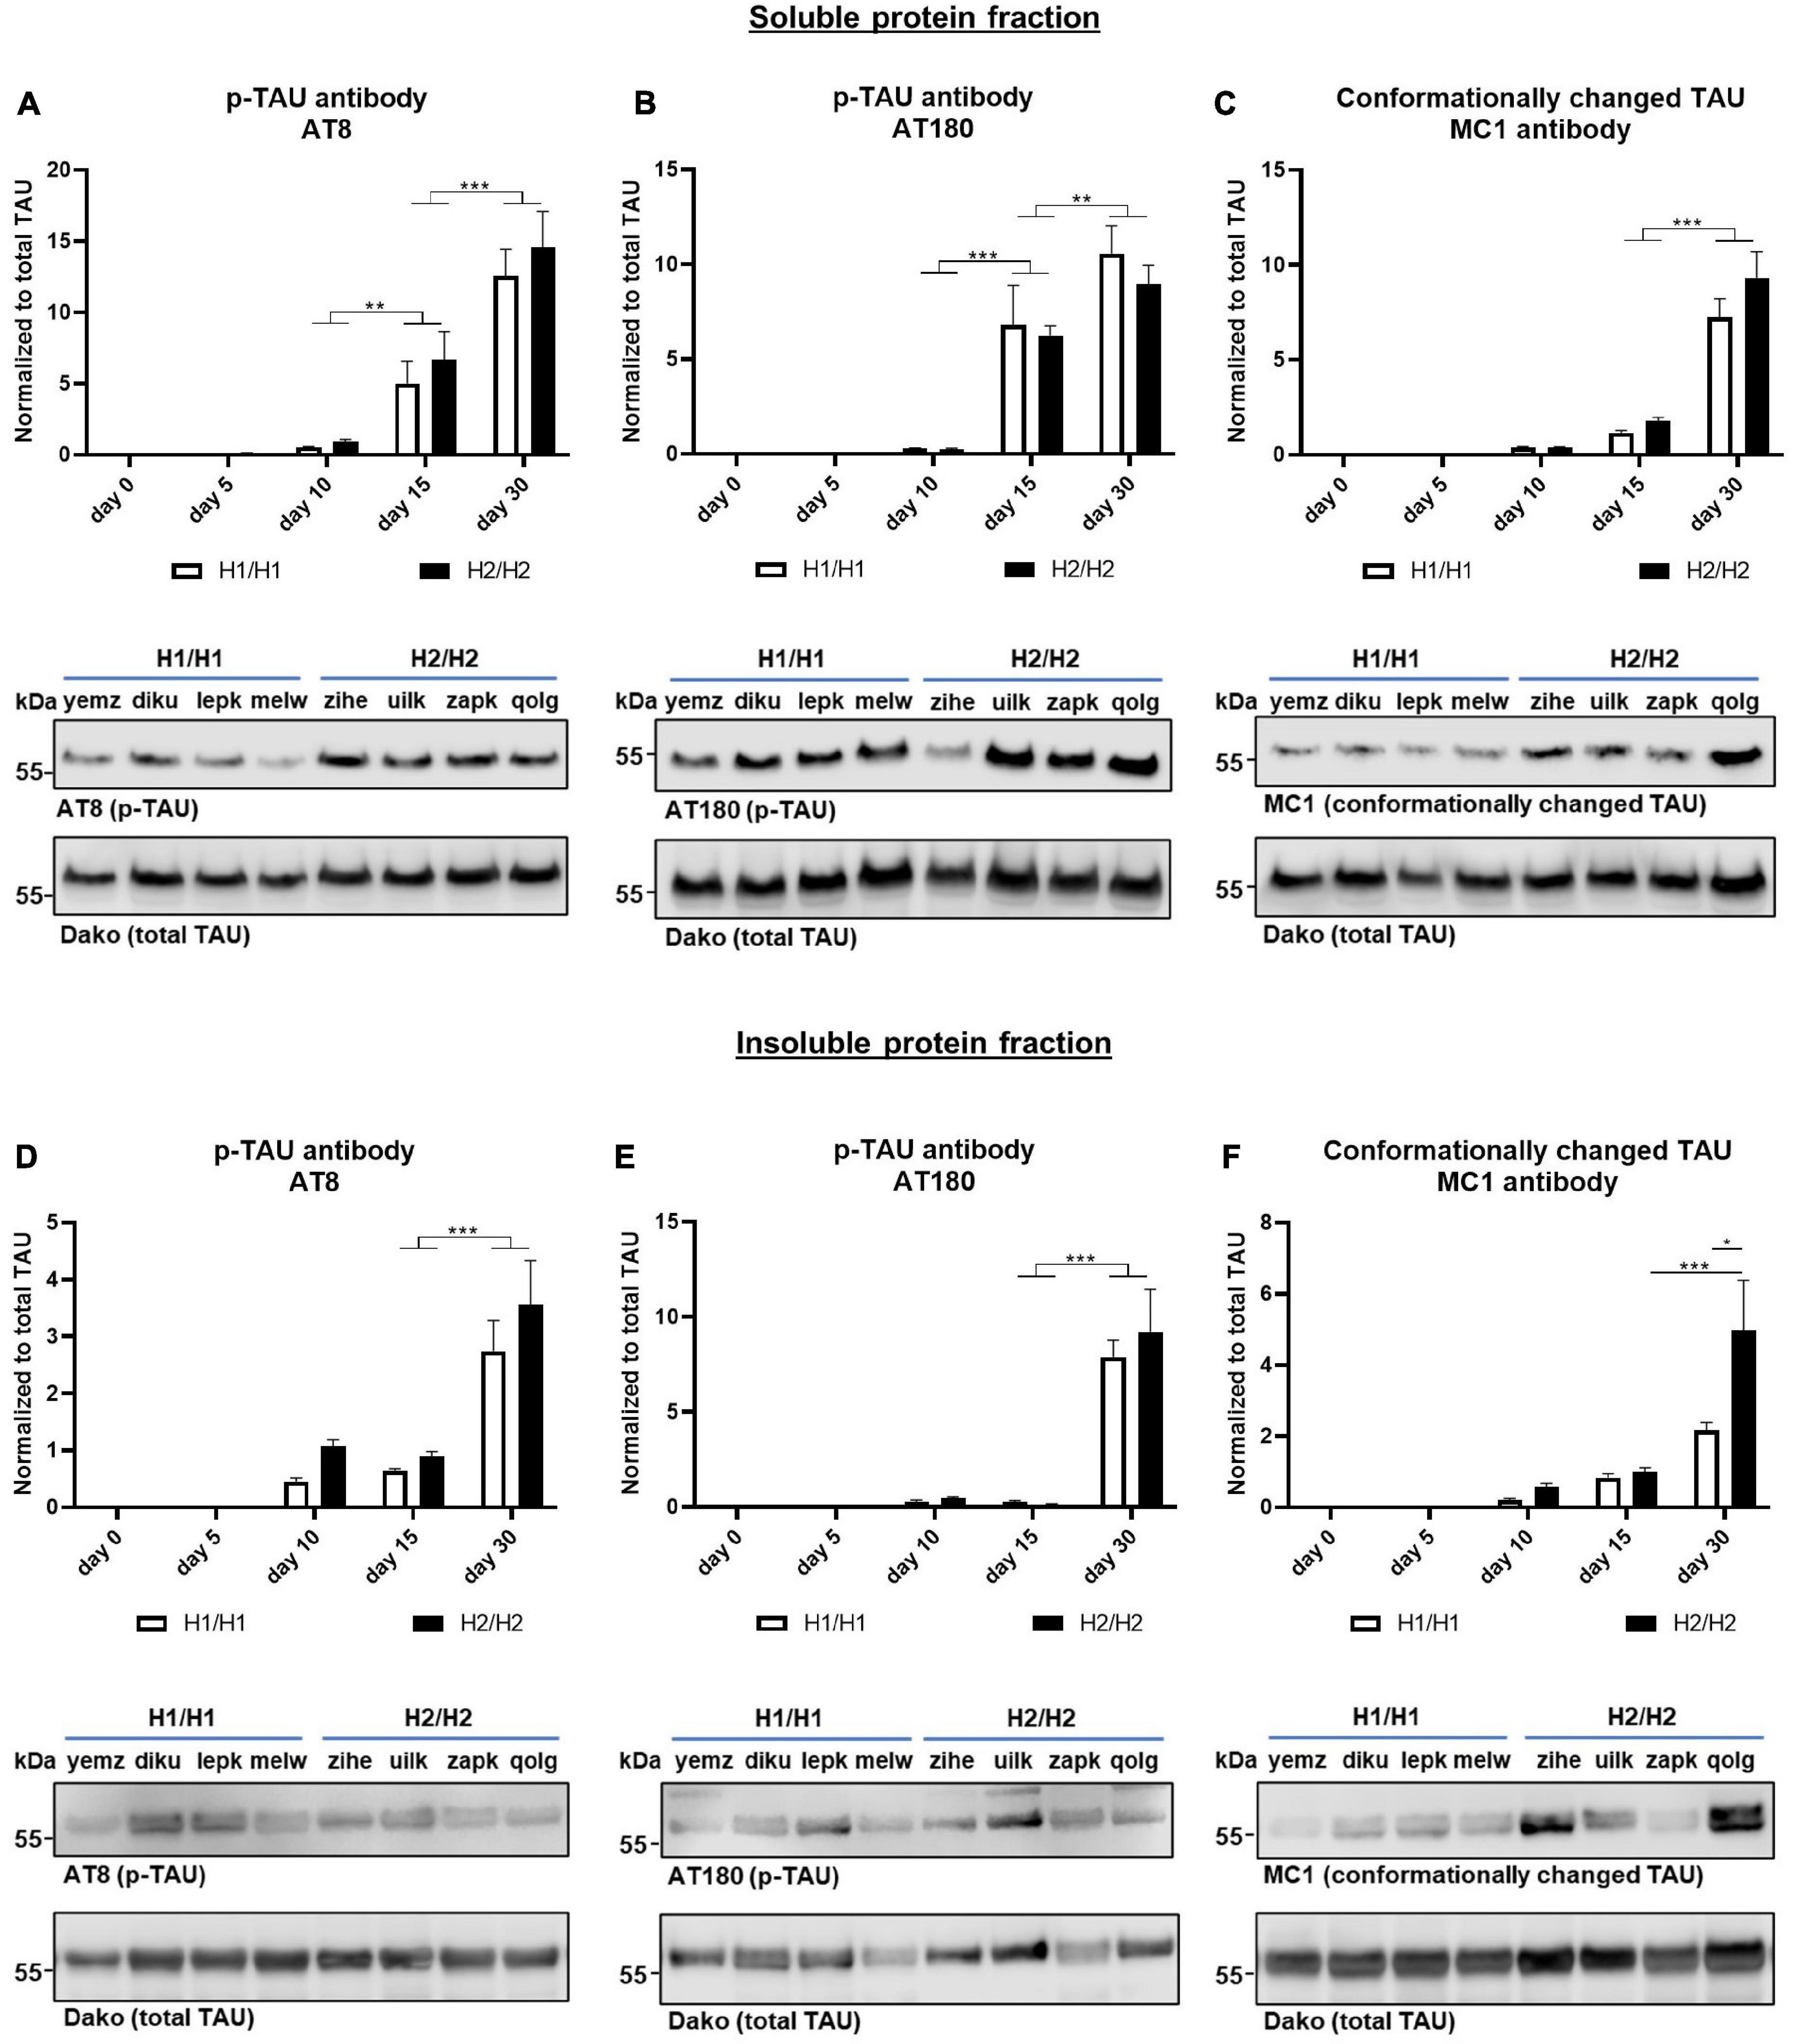
Figure 5. Western blots for phosphorylated and conformationally changed TAU. Phosphorylated TAU (p-TAU) levels were investigated with the antibodies AT8 and AT180, conformationally altered TAU is detected with the MC1 antibody. Data for all antibodies were normalized to total TAU levels. (A–C) In the soluble protein fraction, p-TAU (A,B) and MC1 positive TAU (C) levels increase significantly over time with day 30 displaying the highest levels. (D–F) In the insoluble protein fraction, p-TAU (D,E) and MC1 positive TAU (F) levels also increase significantly over time. No significant differences could be detected between H1/H1 and H2/H2 haplotype groups for any of the antibodies except for MC1. Here, at day 30, the level in the H2/H2 group is significantly higher in the insoluble fraction than in the H1/H1 group. Data are represented as mean ± SEM of n = 4 cell lines for each haplotype group. For each cell line at least three independent repeats were analyzed. Two-way ANOVA followed by Tukey’s or Sidak’s test (MC1 Western blot) was performed. *p < 0.05, **p < 0.01, *** p < 0.001. Displayed Western blot pictures are representative blots from day 30 of differentiation for the respective antibody.
To assess the levels of phosphorylated TAU (p-TAU), two different p-TAU antibodies were used that bind to different phosphorylated epitopes on the TAU protein. The AT8 antibody binds to phosphorylated Serin202 and Threonin205 while the AT180 clone binds to Threonin230. The p-TAU signal was normalized to the total TAU signal. Both antibodies could detect p-TAU from day 5 onward (Figures 5A,B). With further differentiation time, the p-TAU levels increased greatly until day 30, indicating that with extended differentiation time, more TAU becomes phosphorylated. Also in the insoluble fraction, we saw a significant rise of p-TAU until day 30 (Figures 5D,E). For both fractions and antibodies, p-TAU levels did not differ significantly, when comparing the H1/H1 and H2/H2 groups at any time point.
Additionally, we studied the levels of conformationally changed TAU with the MC1 antibody that recognizes a disease-specific TAU conformation dependent on the N-terminus and a sequence in the third microtubule binding repeat (Jicha et al., 1997; Figures 5C,F). Again, the data was normalized to total TAU levels. As already shown for the p-TAU antibodies, the MC1 signal increased during the differentiation time in the soluble as well as in the insoluble protein fraction with the highest levels of MC1 positive TAU at day 30. While there was no difference in conformationally changed TAU levels at any time point in the soluble fraction between MAPT haplotype groups, in the insoluble fraction at day 30 of differentiation, the H2/H2 cell lines showed significantly more MC1 positive TAU then the H1/H1 group. Although it needs to be noted that within the H2/H2 group there was great variability between cell lines, indicated by the great SEM and visible in the Western blots.
Since some studies have reported that only sub-haplotypes of the H1 haplotype are associated with a higher risk for neurodegenerative disease (Myers et al., 2005; Ezquerra et al., 2011), we genotyped the H1/H1 cell lines according to the SNPs that define the H1 sub-haplotypes (Table 2; Pittman et al., 2005). However, none of the H1 cell lines was homozygous for a sub-haplotype (Table 3), therefore, no further investigation was carried out.
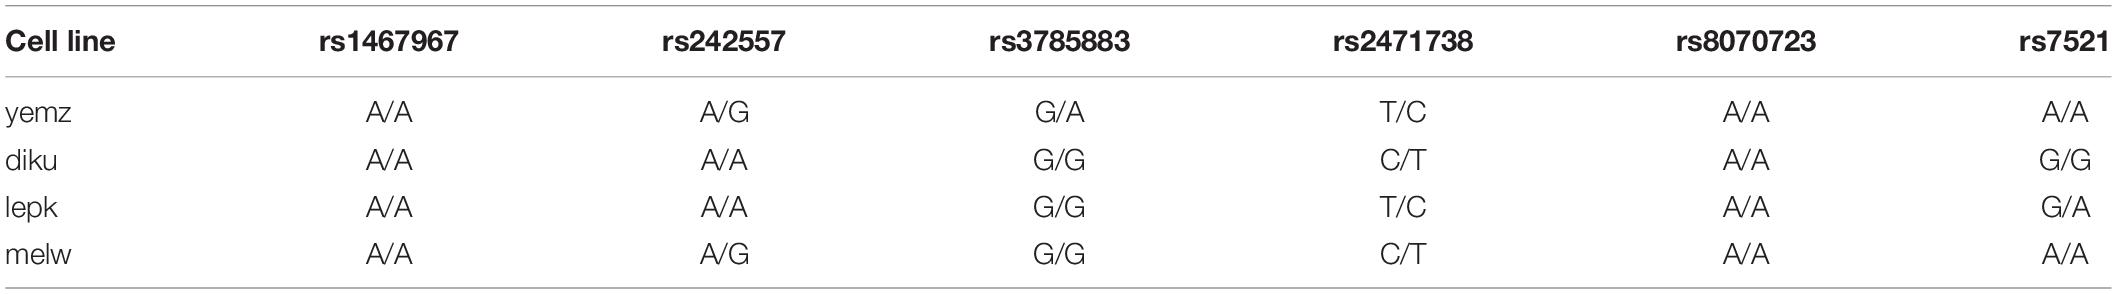
Table 3. Genotyping of H1/H1 cell lines for sub-haplotypes.
In summary, we could show that our cell model started to express the 4R TAU isoform on a protein level after 15 days of differentiation (even earlier on an mRNA level), although 3R TAU protein remained predominant until day 30. We could not find any haplotype specific differences in total TAU, 3R TAU, or 4R TAU expression nor in the phosphorylation levels neither in the soluble or in the insoluble protein fraction between cell lines of the two different MAPT genotype groups. Interestingly, our data showed a higher level of conformationally altered TAU in the insoluble protein fraction of H2/H2 cells compared to H1/H1.
α-SYNUCLEIN Expression in Differentiated Neurons With Homozygous H1 or H2 MAPT Haplotypes
The H1 haplotype is not only a major risk factor for several tauopathies but is also associated with a higher probability to develop PD (Zabetian et al., 2007; Ezquerra et al., 2011; Di Battista et al., 2014). This is somehow surprising since the primarily affected protein in PD is α-SYNUCLEIN and not TAU. Therefore, after studying TAU expression in our cell model, we also investigated the expression levels of α-SYNUCLEIN.
First, mRNA levels were measured by qPCR (Figure 6A). α-SYNUCLEIN mRNA levels increased continuously over the differentiation time of 30 days. Interestingly, cell lines with the H1/H1 haplotype expressed significantly more α-SYNUCLEIN than H2/H2 cell lines (two-way ANOVA p = 0.011).
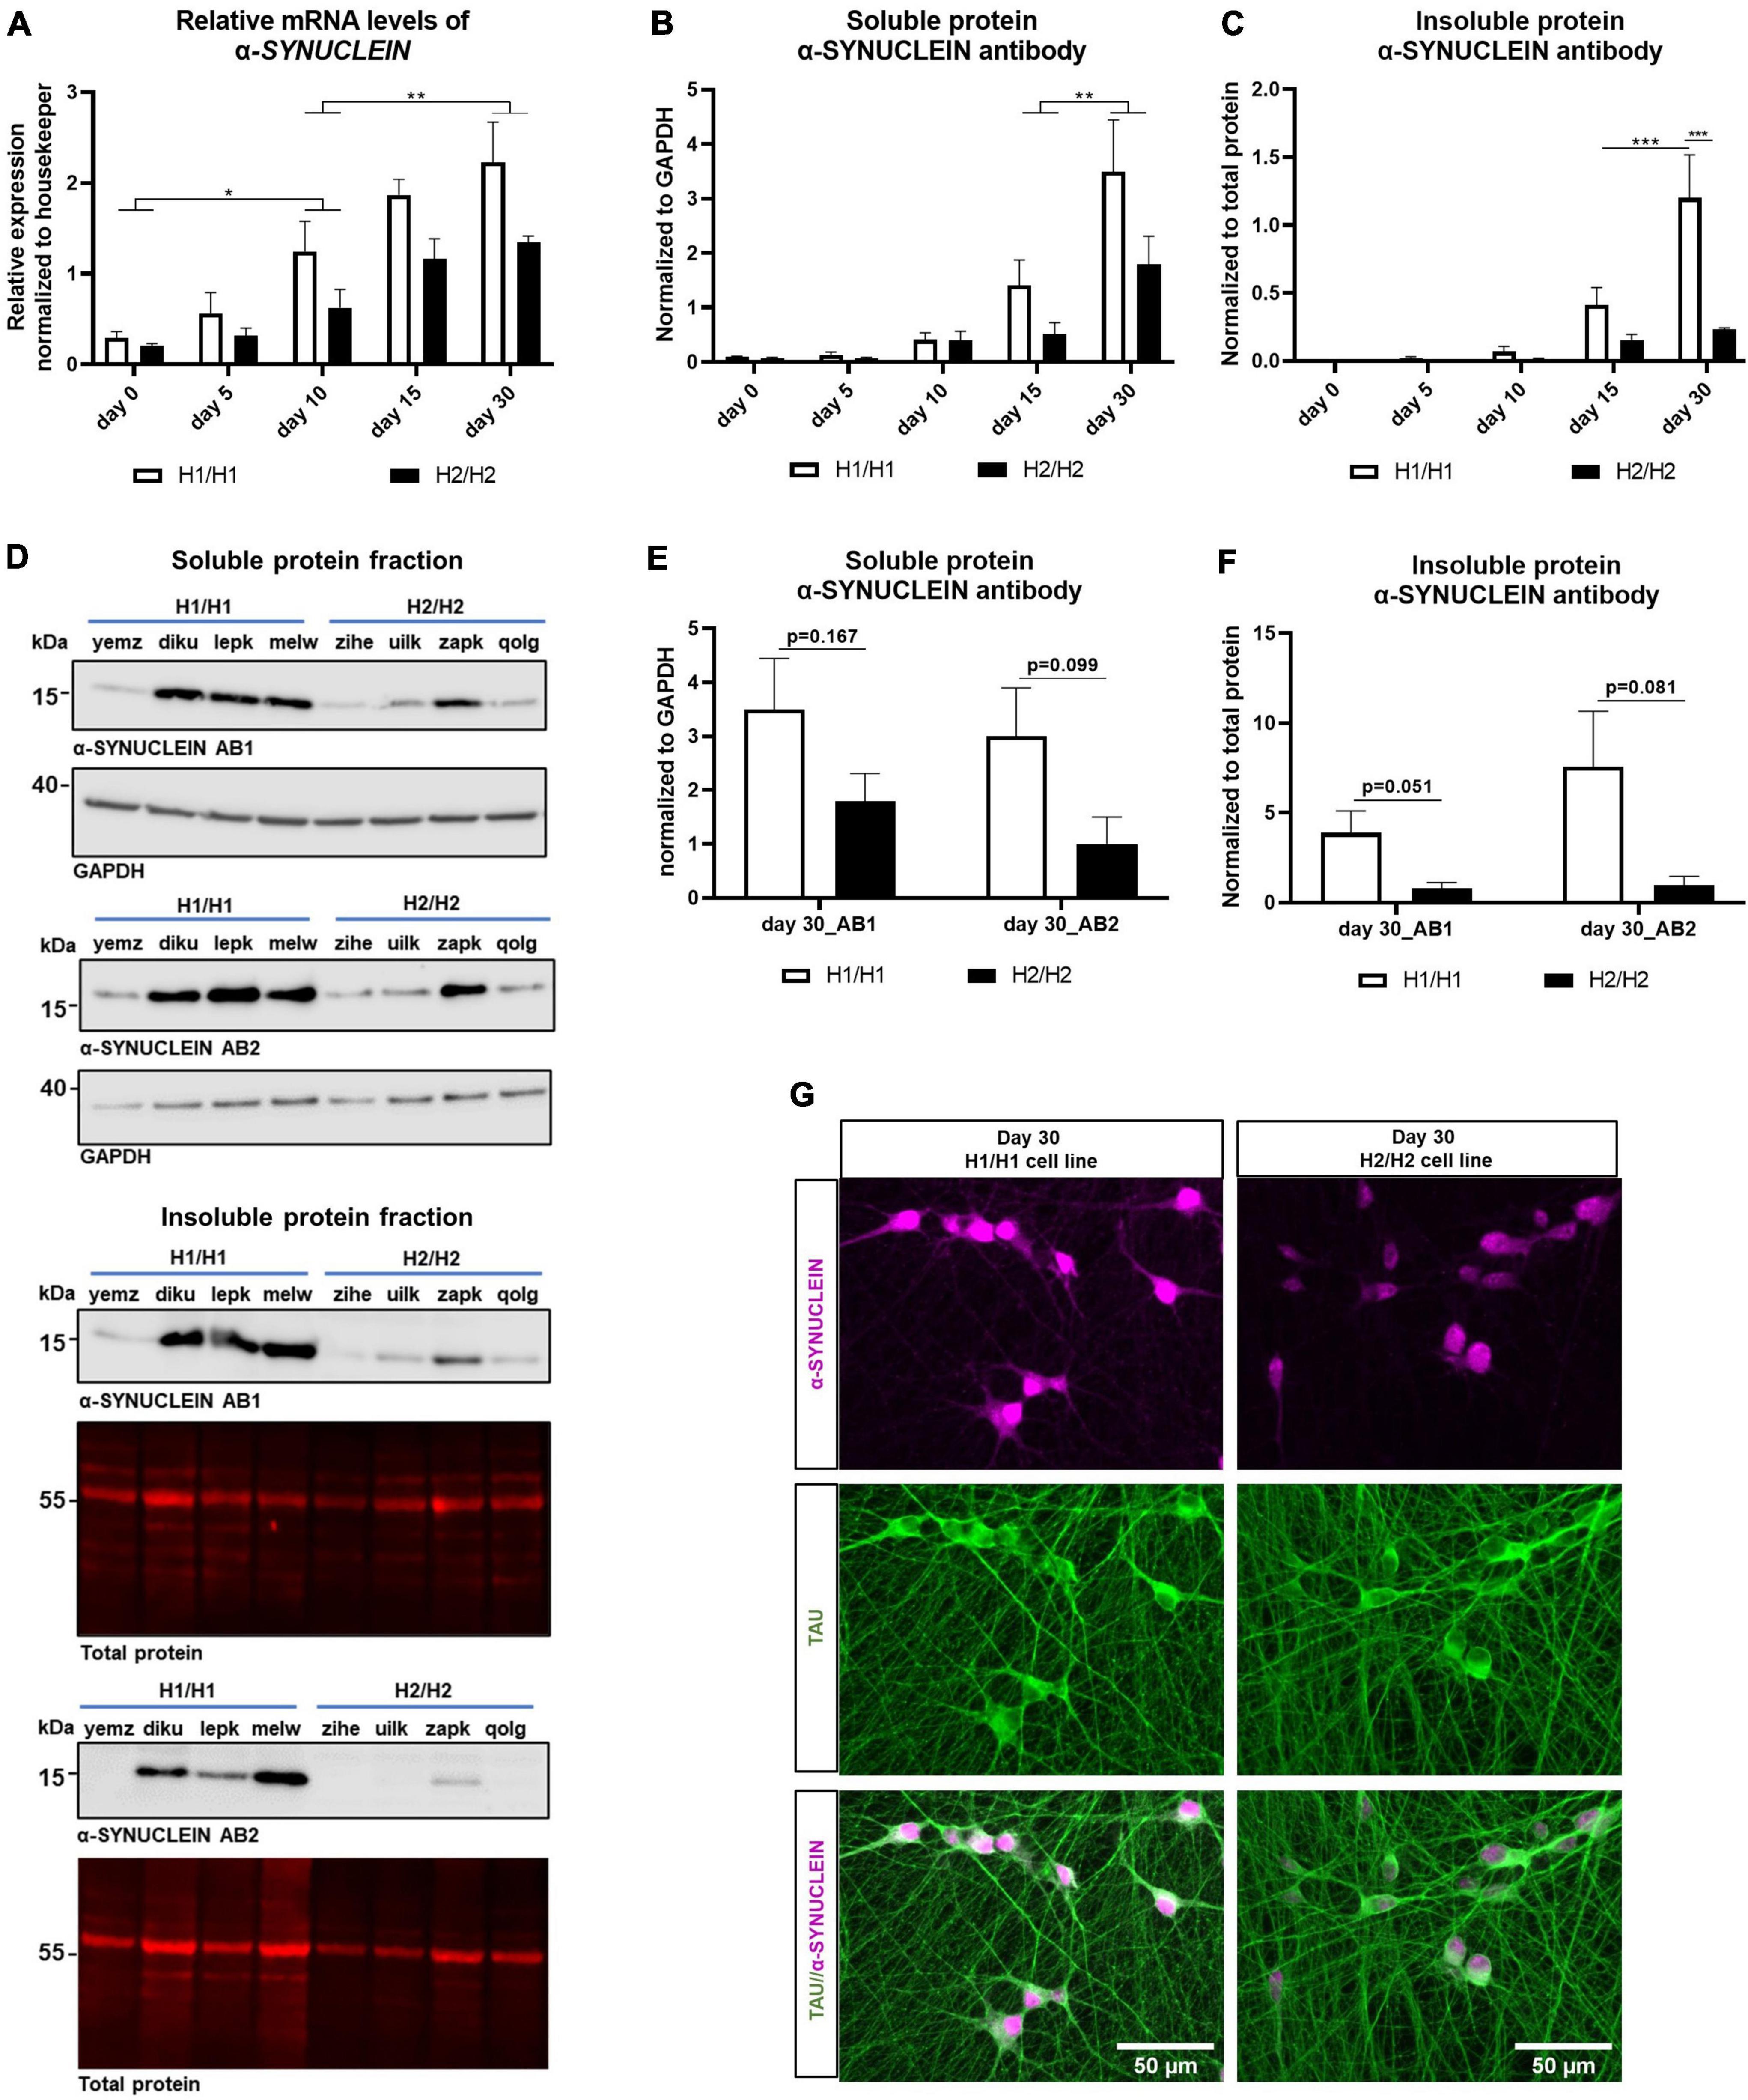
Figure 6. Analysis of α-SYNUCLEIN expression over time on protein and mRNA level. (A) qPCR for α-SYNUCLEIN over differentiation time of 30 days. α-SYNUCLEIN levels increase significantly over time. Data are represented as mean ± SEM of n = 4 cell lines for each haplotype group. For each cell line at least two independent repeats were analyzed. Two-way ANOVA was performed and revealed a significantly higher expression in H1/H1 cells (p = 0.0011). For the factor time, a Tukey’s test was performed. *p < 0.05, **p < 0.01. (B,C) Western blot of soluble and insoluble protein fraction with α-SYNUCLEIN antibody over differentiation time of 30 days. α-SYNUCLEIN levels increase significantly over time in both fractions. Data are represented as mean ± SEM of n = 4 cell lines for each haplotype group. For each cell line at least three independent repeats were analyzed. Two-way ANOVA was performed followed by Tukey’s or Sidak’s test and revealed an overall significantly higher expression in H1/H1 cells (p = 0.036) compared to H2/H2 in the soluble fraction and a significantly higher level in H1/H1 cells at day 30 in the insoluble fraction. **p < 0.01, ***p < 0.001. (D) Representative Western blots from 30-day old cells for two α-SYNUCLEIN antibodies (AB1 and AB2) for the soluble and the insoluble fraction. (E,F) Western blot of soluble and insoluble protein with two α-SYNUCLEIN antibodies (AB1 and AB2) at day 30 of differentiation could not detect a significant difference between H1/H1 and H2/H2 groups with unpaired t-test. Data are represented as mean ± SEM of n = 4 cell lines for each haplotype group. For each cell line at least three independent repeats were analyzed. (G) Immunofluorescent staining of two representative cell lines for α-SYNUCLEIN and TAU at day.
Next, the α-SYNUCLEIN protein expression was assessed by western blot in the soluble as well as in the insoluble protein fraction. Like the mRNA level, expression of α-SYNUCLEIN protein increased during the differentiation time in the soluble and in the insoluble fraction continuously until 30 days (Figures 6B,C). In accordance with the mRNA results, also on the protein level (soluble fraction) the H1/H1 haplotype group expressed significantly more α-SYNUCLEIN than the H2/H2 group (two-way ANOVA, p = 0.036). In the insoluble fraction, there was a statistically significant difference between MAPT groups only at day 30 of differentiation although the trend was also visible at earlier time points.
To further verify the western blot result, samples from day 30 of both fractions (time point with highest α-SYNUCLEIN level) were again analyzed with a different α-SYNUCLEIN antibody (Figures 6D–F). In Figures 6E,F the results for day 30 with both antibodies are displayed. The second α-SYNUCLEIN antibody could replicate the results from the originally used antibody for both fractions (see also Figure 6D). Statistical testing with an unpaired t-test, however, could not detect a statistically significant difference between H1/H1 and H2/H2 cell lines for neither antibody in both fractions at this time point.
Two representative cell lines, one from each MAPT haplotype group, was chosen to visualize the differential α-SYNUCLEIN protein expression with immunocytochemistry at day 30 of differentiation (Figure 6G). See also Supplementary Figure 3 for high-magnification images auf TAU and α-SYNUCLEIN staining showing no clear colocalization of the two proteins.
Several SNPs in the SNCA gene coding for α-SYNUCLEIN have been reported to increase the risk for synuleinopathies and potentially influence the expression of α-SYNUCLEIN (Campêlo and Silva, 2017; see Table 4). To investigate whether the differential expression in H1 versus H2 cells could be explained by SNPs in the SNCA gene, we selected SNPs that have reportedly been associated with increased risk for PD and/or with higher expression of α-SYNUCLEIN and genotyped our cell lines accordingly (Table 5).
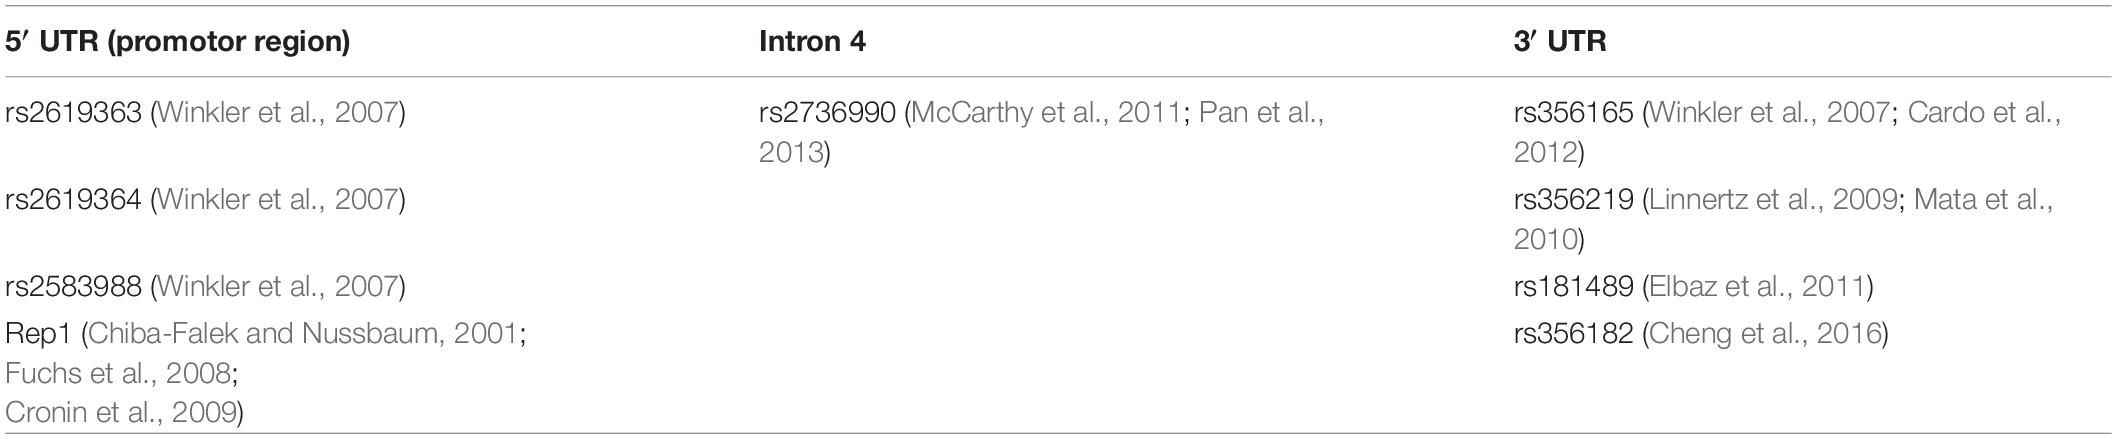
Table 4. Single nucleotide polymorphisms that have reportedly been associated with increased risk for Parkinson’s disease (PD) and/or with higher expression of α-SYNUCLEIN.
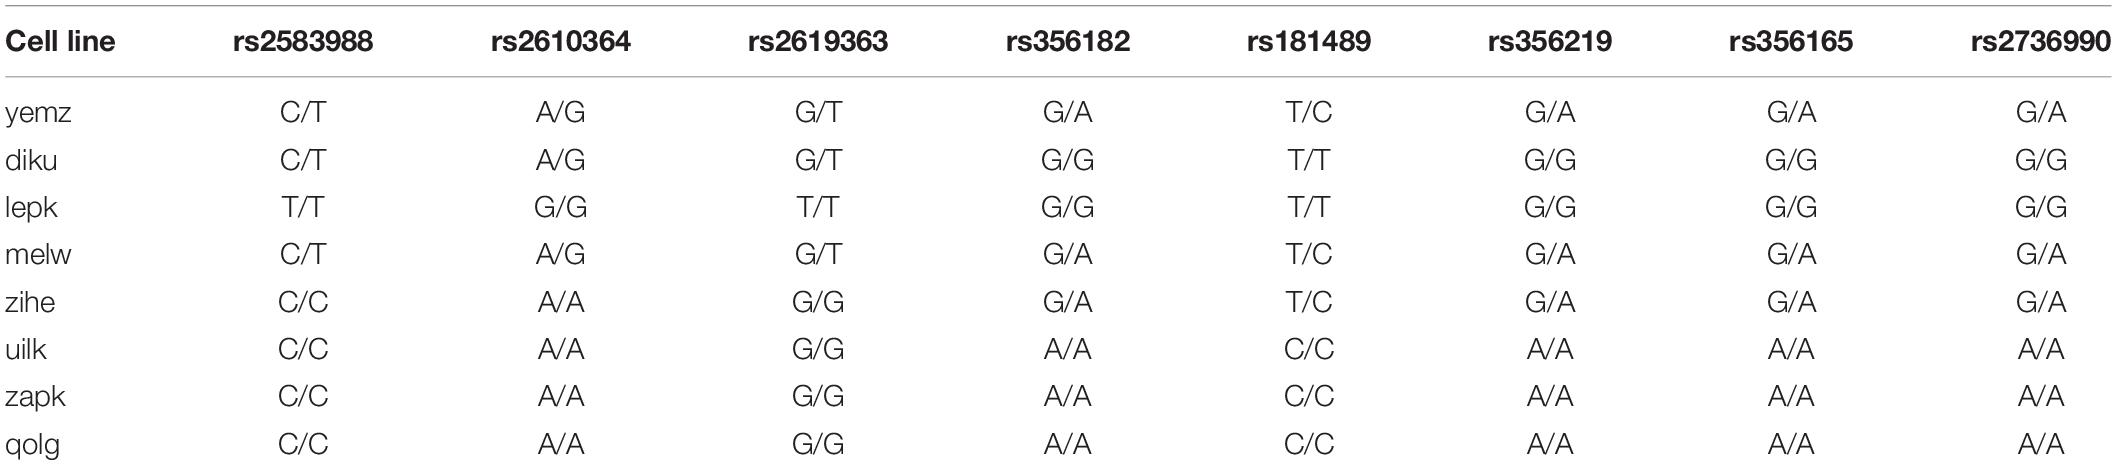
Table 5. Genotype of cell lines for certain SNPs in the SNCA gene.
Additionally to SNPs, a complex, polymorphic microsatellite called Rep1 (D4S3481) located approximately 10 kb upstream of the SNCA transcription start site has been linked to an increased risk for PD (Campêlo and Silva, 2017). The number of dinucleotide repeats in the microsatellite sequence can differ between individuals and studies have shown that longer repeats of Rep1 are associated with increased transcription levels of α-SYNUCLEIN (Chiba-Falek and Nussbaum, 2001; Cronin et al., 2009). Therefore, we also genotyped the cell lines according to their repeat sequence of Rep1 (Table 6). When grouping the cell lines according to their SNP or Rep1 genotype, no pattern that would explain the α-SYNUCLEIN expression data could be identified.
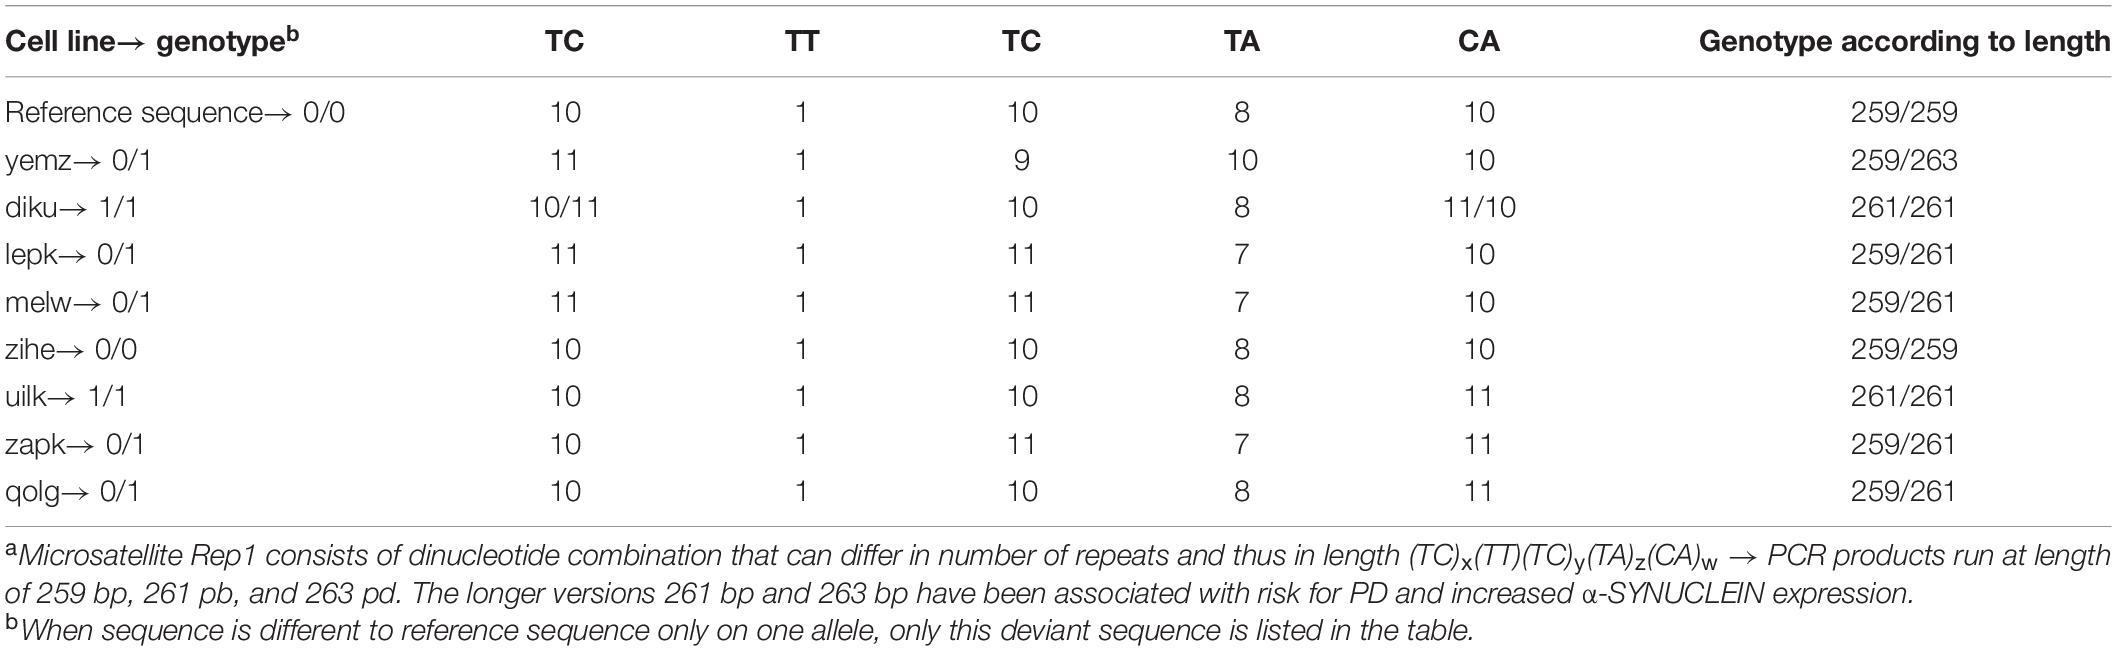
Table 6. Sequence and genotype of cell lines for Rep1 microsatellitea near the SNCA gene.
In summary, we detected a significantly higher α-SYNUCLEIN level in cell lines with the H1 haplotype compared to cells with the H2 haplotype. This difference manifested on an mRNA as well as on a protein level over the whole differentiation period. Variations in the α-SYNUCLEIN gene causing this expression pattern could not be identified.
Toxin Treatment of Differentiated Neurons With Homozygous H1 or H2 MAPT Haplotypes
Although there are several genetic risk factors that increase the possibility for developing a neurodegenerative disease (such as the MAPT haplotype), they do most likely not act alone but rather in concert with other genetic variations and/or environmental factors. Therefore, we investigated whether cell lines with homozygous H1 or H2 MAPT genotypes would differ in their vulnerability to external stressors like toxins.
We treated the cells with the mitochondrial inhibitor Annonacin which has been reported to cause atypical parkinsonism (Caparros-Lefebvre and Elbaz, 1999; Höglinger et al., 2005). 26-day old cells were treated with 800 nM Annonacin for 4 days to cause a significant toxic effect in all cell lines. At day 30 of differentiation, cell viability was assessed with Calcein staining, while mitochondrial activity was measured with an MTT assay. All cell lines showed a significant reduction of cell viability and metabolic activity 4 days after treatment. The toxic effect of Annonacin, however, differed greatly between the cell lines independent of the haplotype (Figures 7A,B). Reduced viability with Calcein staining ranged from 80 to 30% and mitochondrial activity from 80 to 10%. Strong reduction of mitochondrial function co-occured with greater reduction in general viability. Although there are variations between the cell lines in general, when comparing the two MAPT haplotype groups, there were no significant differences in the toxic effect of Annonacin neither in viability measured with Calcein nor the metabolic activity measured by the MTT assay (Figure 7C).
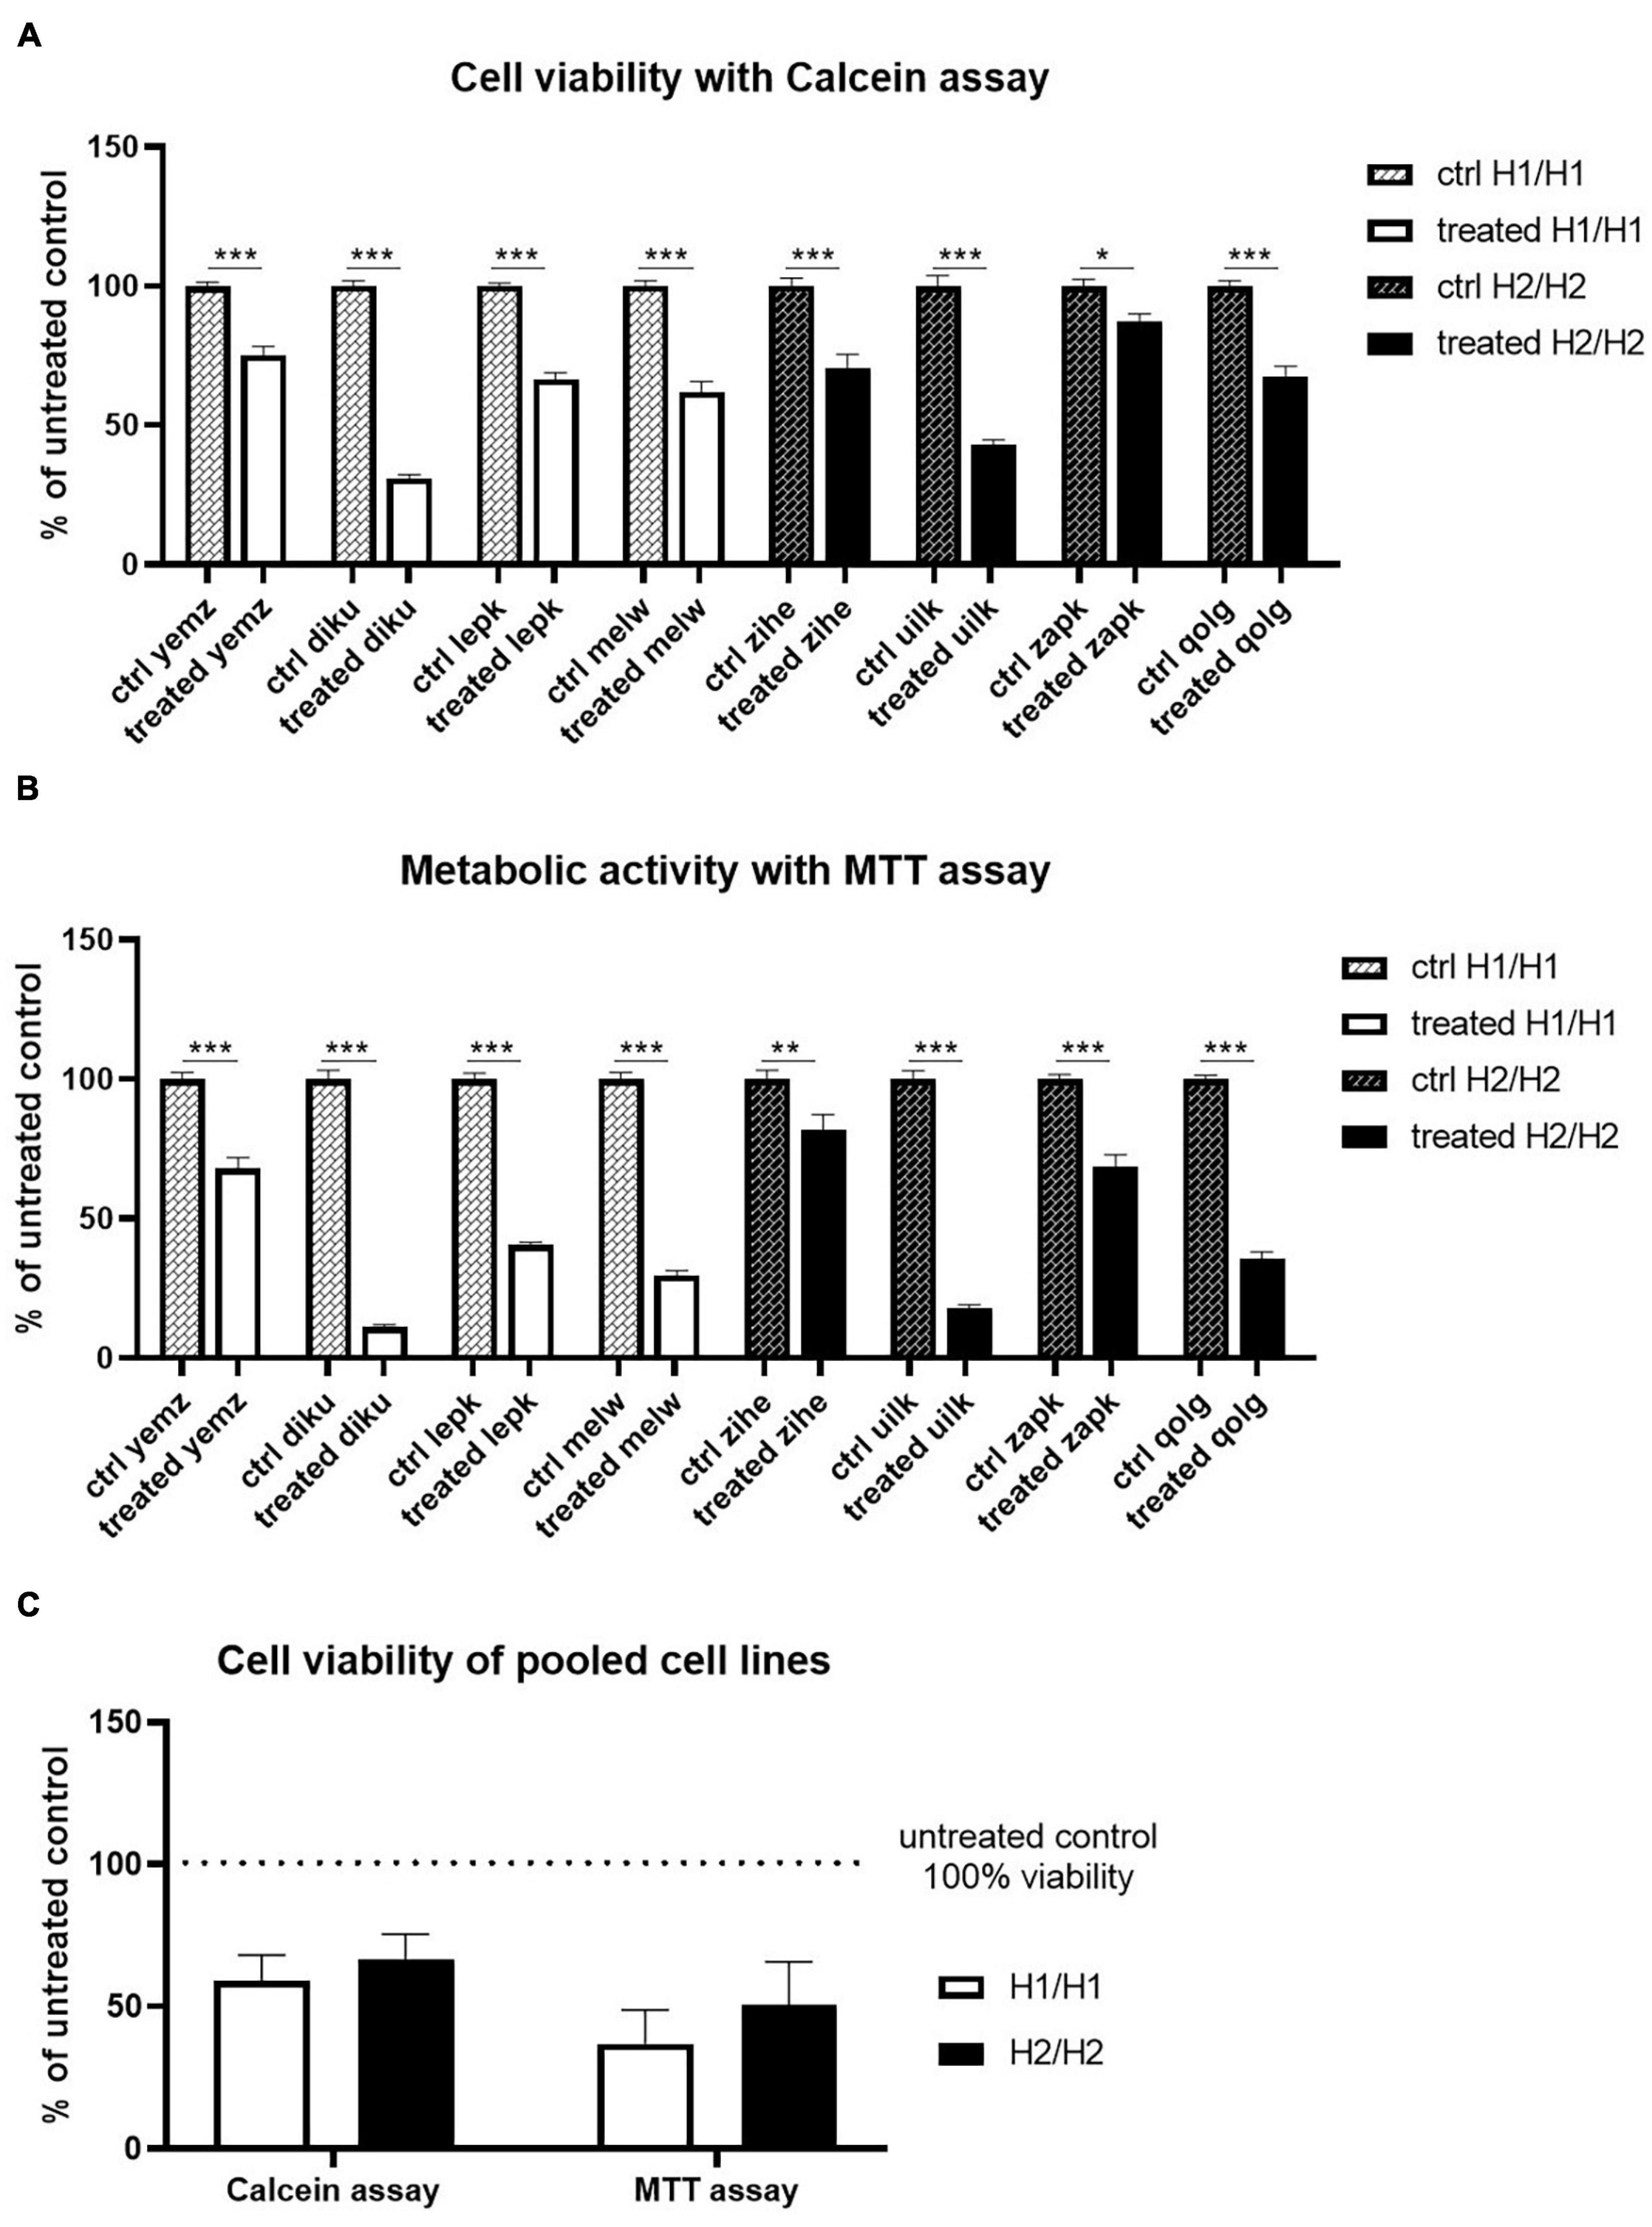
Figure 7. Treatment of cells with Annonacin. (A,B) Cell viability was analyzed using Calcein and MTT assay, respectively. Annonacin treatment reduced cell viability significantly in all cell lines. Data are represented as mean ± SEM of n = 8 independent experiments per cell line. Two-way ANOVA followed by Sidak’s test was performed. *p < 0.05, **p < 0.01, ***p < 0.001 (C) Pooling of cell lines into haplotype groups does not detect any significant difference in cell viability between H1/H1 and H2/H2 groups after Annonacin treatment. Data are represented as mean ± SEM of n = 4 cell lines for each haplotype group. Unpaired t-test was performed.
All in all, we could not detect a MAPT haplotype-dependent differential vulnerability to the toxin Annonacin.
TAU Uptake in Differentiated Neurons With Homozygous H1 or H2 MAPT Haplotypes
For the spreading of pathology throughout different brain regions in neurodegenerative tauopathies, TAU is released from diseased cells and taken up by neighboring cells in a Prion-like manner. Therefore, we tested in our cell model the ability of various cell lines to take up TAU monomers and aggregates generated from recombinant protein. We prepared fluorescently labeled TAU strains including monomers, oligomers, and fibrils (see Supplementary Figure 4 for characterization of aggregates). The cells were treated with each type of TAU strain and intracellular fluorescence signals were measured by a plate reader, while the extracellular signal was quenched with trypan blue (Figure 8). Fluorescence signal from TAU uptake was normalized to the whole cell stained with Calcein to eliminate the effect of variation in cell seeding for each line (see Supplementary Figure 5 for effect of trypan blue on plate reader signal and toxicity assessment of TAU treatment). Although there were some differences in the intensity of internalized TAU signal between the cell lines, we could not detect any MAPT haplotype-dependent differences in uptake signal for different TAU strains (Figure 8D).
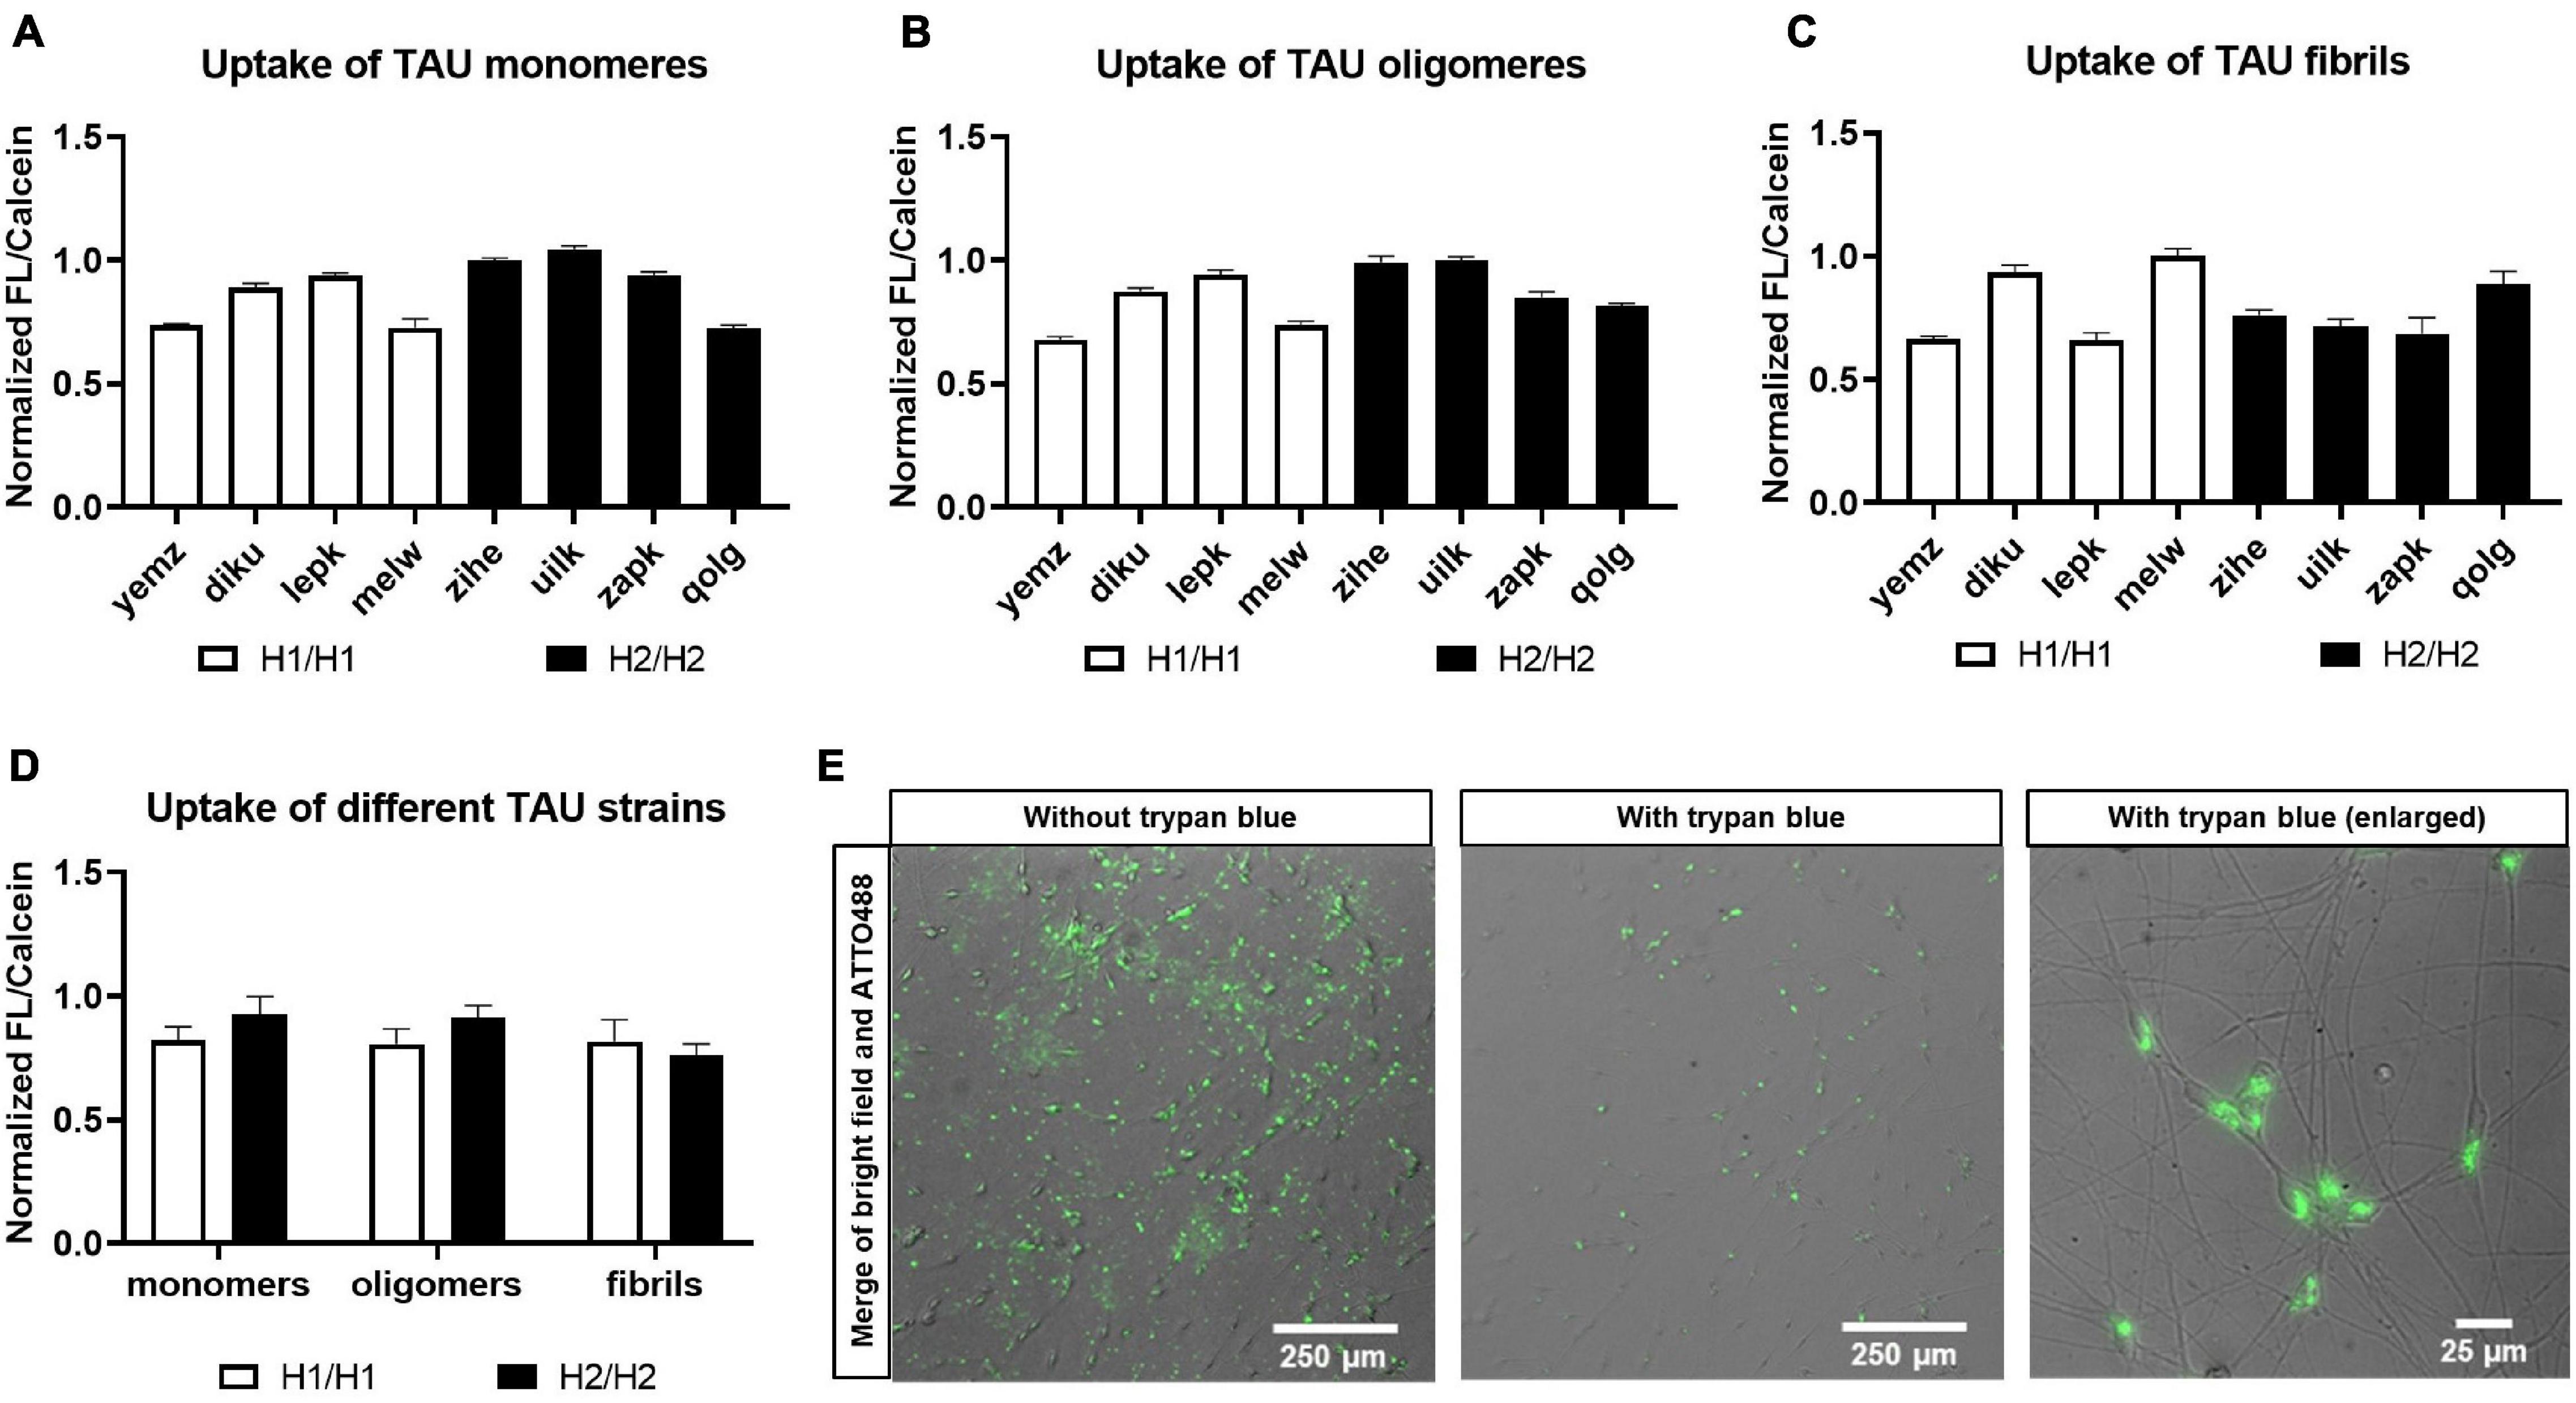
Figure 8. Treatment of cells with TAU seeds. Cells were treated with recombinant and fluorescently labeled TAU and uptake was monitored. Cells were treated with either TAU monomers (A), TAU oligomers (B), or fibrils (C). Data are represented as mean ± SEM of n = 3 technical repeats per cell line. (D) Pooling of cell lines into haplotype groups does not detect any significant difference in TAU uptake between H1/H1 and H2/H2 groups. Data are represented as mean ± SEM of n = 4 cell lines for each haplotype group. Unpaired t-test was performed. (E) Merge of bright field and fluorescent images of cells after treatment with ATTO488-labeled TAU seeds before and after addition of trypan blue for quenching of the outside signal.
Discussion
Over the last years, several protocols have been established to differentiate iPS cells into neurons to model neurodegenerative diseases. Direct differentiation methods include differentiation times from 70 to 200 days or longer (Iovino et al., 2015; Sposito et al., 2015; Silva et al., 2016; Garcia-Leon et al., 2018) and can vary greatly in the obtained cell type composition (Volpato et al., 2018). When comparing several cell lines generated from individuals with a different genetic background, reducing the variability within the differentiation process is of great importance. We therefore first converted the iPSC into smNPC and then used NGN2 overexpression for a fast and efficient differentiation into a high percentage (90%) of neurons that express important neuronal markers (Dhingra et al., 2020). All cell lines showed a comparable neuronal morphology when stained with MAP2 and TAU. Glial cells are either not present or only to a very small percentage at day 30. Cell lines of both haplotype groups showed similar differentiation efficiency and comparable percentages of cortical and GABAergic neurons. We could therefore show that our cell model is robust and suitable to compare different cell lines. The easily expandable NGN2_smNPCs and the short differentiation time makes the model additionally applicable for high-throughput approaches.
One of the main challenges when using iPSC to model tauopathies is the expression of the adult 4R TAU isoform. Differentiated neurons from iPSC mostly remain in an immature state of development (Miguel et al., 2019). Therefore, the predominantly expressed TAU isoform is the fetal 0N3R isoform (Fong et al., 2013; Nakamura et al., 2019). With most differentiation protocols, only extensive differentiation times (at least 100 days) are able to induce the developmental switch leading to the expression of 4R TAU (Iovino et al., 2015; Sposito et al., 2015; Garcia-Leon et al., 2018). Although, the predominant TAU isoform is also the 0N3R in our model, we could show that with our protocol 4R TAU is already detectable on a protein level at day 15 of differentiation and increases further until day 30. This indicates that the NGN2 overexpression does not only very efficiently induce a neuronal phenotype but also speeds up the maturation process, making our model a valuable tool to investigate TAU-related disease.
Furthermore, total TAU expression steadily increases during differentiation and in parallel also the TAU levels in the insoluble protein fraction increases, indicating that more TAU is aggregating with aging of the neurons. Additionally, TAU becomes more and more phosphorylated with ongoing differentiation time.
Since the MAPT haplotype has been reported a major risk factor for several neurodegenerative diseases, several studies have tried to understand the underlying mechanism, with MAPT being the predominant gene of interest. Experiments in neuroblastoma cell lines have reported a higher transcription efficiency of the H1 promotor over the H2 promotor (Kwok et al., 2004). In human brain, differential expression on an mRNA level was observed, although those findings have been contradictory between different studies. de Jong et al. (2012) and Valenca et al. (2016) for example reported higher MAPT expression in H1 haplotype brains compared to H2. Caffrey et al. (2006) and Trabzuni et al. (2012) on the other hand could not detect an overall higher MAPT expression from H1 alleles. Additionally, Myers et al. (2007) only found an increased MAPT expression in brains homozygous for the H1 sub-haplotype H1c compared to all other haplotypes. Some studies have also reported higher levels of transcripts that include exon 10 (4R TAU isoforms; Caffrey et al., 2006; Myers et al., 2007; Majounie et al., 2013). The only study so far conducted with iPSC concentrated on the allele-specific expression of MAPT transcripts in H1/H2 heterozygous cells (Beevers et al., 2017) reporting a higher overall TAU transcript from H1. A difference in exon 10 + transcripts between the alleles could not be found.
Since all the described studies focused on the expression levels of mRNA, it remains unclear if and how differences in the transcript levels would translate into differences on the protein level. Our study is therefore the first systematic comparison of several iPSC lines that are homozygous for either the H1 or the H2 haplotype investigating the MAPT expression not only on an mRNA but also on the protein level.
In accordance with the studies in iPSC from Beevers et al. we could not detect differences in the mRNA expression levels of the 4R TAU isoform between the two haplotype groups. However, also in the total TAU transcripts, we could not detect a difference between H1 and H2 cell lines. The same holds true for the 3R TAU isoform. Also on the protein level, there is no statistical difference between the haplotype groups, although the sample size of four cell lines per haplotypes may limit the identification of inter-haplotype differences when intra-individual variance is predominant.
Surprisingly, when we analyzed the levels of conformationally changed TAU, we could observe significantly higher levels in the insoluble fraction of H2/H2 cell lines when differentiating for 30 days. The variability between cell lines is quite high, especially within the H2/H2 group, but the detected difference is significant. A study conducted in patients with AD and Lewy body disease (LBD) compared TAU deposition in H1 and H2 carriers (Wider et al., 2012). Although AD and LBD are not primary tauopathies they can still display secondary tau pathology like neurofibrillary tangles (NFT; Jellinger, 2011). Wider et al. connected a higher NFT burden with the H2 haplotype. This finding would support our observation of higher levels of conformationally changed TAU in the insoluble protein fraction in H2 cell lines which could point to a higher aggregation in this haplotype.
Since the H1 haplotype is not only a major risk factor for tauopathies but also significantly increases the risk for PD, we also investigated the α-SYNUCLEIN levels in our cells. Interestingly, we could find significantly higher expression levels in H1/H1 cell lines compared to H2/H2 cell lines on the mRNA as well as on the protein level. How the H1 haplotype could influence the risk for synucleinopathies remains unclear. As mentioned above, TAU pathology can occur in synucleinopathies such as PD or Dementia with Lewy bodies (DLB). Two studies support our findings of higher α-SYNUCLEIN expression between H1 and H2 carriers on a pathophysiological level (Colom-Cadena et al., 2013; Robakis et al., 2016). α-SYNUCLEIN pathology, like the Lewy body (LB) count, in brains of patients with DLB or PD was significantly higher in carriers of the H1/H1 genotype. The TAU pathology, like NFT, however, did not significantly differ between H1 and H2 case. The Wider et al. (2012) study also found a higher LB count in patients with AD and DLB that carried the H1 haplotype in addition to a higher NFT count in H2/H2 carriers. This study supports both findings in our cell model: higher α-SYNUCLEIN levels in H1/H1 cells and higher conformationally changed TAU levels in the insoluble fraction in H2/H2 cells.
How the H1 haplotype could influence the increased expression of α-SYNUCLEIN already on an mRNA level is not clear. Since expression levels of α-SYNUCLEIN vary also within the haplotype groups, differential expression could be influenced by other genetic factors independent from the MAPT haplotype. We therefore genotyped our cell lines for genetic variants in the SNCA gene but could not identify an association with any of the chosen variants and the described α-SYNUCLEIN expression pattern.
Since the MAPT haplotype does not only comprise the MAPT gene but several other genes, the possibility that one of those genes could be differentially regulated in the H1 haplotype and then in turn regulate the α-SYNUCLEIN expression cannot be excluded. So far, little is known about the genes located in the MAPT haplotype. de Jong et al. (2012) reported that the inversion polymorphism of H2 affects expression of multiple other genes next to MAPT, none of which is known to regulate transcription of the SNCA gene.
In conclusion, we can present a valuable cell resource of 8 iPSC lines selected according to their MAPT haplotype, that we converted into NGN2_smNPC. Their fast and efficient differentiation into neurons makes them suitable for high-throughput approaches. Although limited with a sample size of four H1/H1 and four H2/H2 cell lines, this resource creates a physiologically relevant tool to investigate genetic variants associated with sporadic neurodegenerative diseases. We could, for example, show that H2 cell lines have higher levels of conformationally changed and thus aggregated TAU compared to H1 cells. Furthermore, we identified a differential expression of α-SYNUCLEIN between the haplotype groups. These results show that our cell resource is a valuable tool for future research with the aim to identify neurodegenerative disease mechanisms.
Data Availability Statement
The datasets presented in this study can be found in online repositories. The names of the repository/repositories and accession number(s) can be found in the article/Supplementary Material.
Author Contributions
TS, SS, and GH conducted the project design. TS carried out the experiments, analyzed the data, drafted the manuscript, and conceptualized the figures. AM-T carried out the TAU uptake experiments and their analysis, wrote sections of the manuscript. AD trained TS for iPSC and smNPC culture methods. ES, TS, and AD converted iPSC to NGN2_smNPC. GH, SS, PH, and WW provided conceptual guidance of the project. DT analyzed genomic data for cell line identification. FW and GH revised it critically for important intellectual content. All authors corrected and approved the final manuscript.
Funding
GH, WW, and PH were funded by the German Federal Ministry of Education and Research (01EK1605A HitTau), Deutsche Forschungsgemeinschaft (DFG, German Research Foundation) under Germany’s Excellence Strategy within the framework of the Munich Cluster for Systems Neurology (EXC 2145 SyNergy – ID 390857198 also to WW), DFG (HO2402/18-1 MSAomics), the VolkswagenStiftung/Lower Saxony Ministry for Science (Niedersächsisches Vorab), and Petermax-Müller Foundation (Etiology and Therapy of Synucleinopathies and Tauopathies). The open access publication fee was funded by the Open-Access-Publicationsfonds of the university library of the Technical University Munich.
Conflict of Interest
The authors declare that the research was conducted in the absence of any commercial or financial relationships that could be construed as a potential conflict of interest.
Publisher’s Note
All claims expressed in this article are solely those of the authors and do not necessarily represent those of their affiliated organizations, or those of the publisher, the editors and the reviewers. Any product that may be evaluated in this article, or claim that may be made by its manufacturer, is not guaranteed or endorsed by the publisher.
Acknowledgments
We acknowledge Wellcome Trust Sanger Institute as the source of all human induced pluripotent cell lines which were generated under the Human Induced Pluripotent Stem Cell Initiative funded by a grant from the Wellcome Trust and Medical Research Council, supported by the Wellcome Trust (WT098051) and the NIHR/Wellcome Trust Clinical Research Facility, and acknowledges Life Science Technologies Corporation as the provider of Cytotune.
Supplementary Material
The Supplementary Material for this article can be found online at: https://www.frontiersin.org/articles/10.3389/fcell.2021.726866/full#supplementary-material
Footnotes
- ^ https://www.phe-culturecollections.org.uk/products/celllines/ipsc/search.jsp
- ^ https://www.hipsci.org/lines
- ^ http://genome-euro.ucsc.edu/index.html
- ^ www.graphpad.com
References
Baker, M., Litvan, I., Houlden, H., Adamson, J., Dickson, D., Perez-Tur, J., et al. (1999). Association of an extended haplotype in the tau gene with progressive supranuclear palsy. Hum. Mol. Genet. 8, 711–715. doi: 10.1093/hmg/8.4.711
Beevers, J. E., Lai, M. C., Collins, E., Booth, H. D. E., Zambon, F., Parkkinen, L., et al. (2017). MAPT genetic variation and neuronal maturity alter isoform expression affecting axonal transport in iPSC-derived dopamine neurons. Stem Cell Reports 9, 587–599. doi: 10.1016/j.stemcr.2017.06.005
Caffrey, T. M., and Wade-Martins, R. (2007). Functional MAPT haplotypes: bridging the gap between genotype and neuropathology. Neurobiol. Dis. 27, 1–10. doi: 10.1016/j.nbd.2007.04.006
Caffrey, T. M., Joachim, C., Paracchini, S., Esiri, M. M., and Wade-Martins, R. (2006). Haplotype-specific expression of exon 10 at the human MAPT locus. Hum. Mol. Genet. 15, 3529–3537. doi: 10.1093/hmg/ddl429
Campêlo, C., and Silva, R. H. (2017). Genetic variants in SNCA and the risk of sporadic parkinson’s disease and clinical outcomes: a review. Parkinsons Dis. 2017:4318416.
Caparros-Lefebvre, D., and Elbaz, A. (1999). Possible relation of atypical parkinsonism in the French West Indies with consumption of tropical plants: a case-control study. Caribbean Parkinsonism Study Group. Lancet 354, 281–286. doi: 10.1016/s0140-6736(98)10166-6
Cardo, L. F., Coto, E., De Mena, L., Ribacoba, R., Lorenzo-Betancor, O., Pastor, P., et al. (2012). A search for SNCA 3’. UTR variants identified SNP rs356165 as a determinant of disease risk and onset age in Parkinson’s disease. J. Mol. Neurosci. 47, 425–430. doi: 10.1007/s12031-011-9669-1
Cheng, L., Wang, L., Li, N. N., Yu, W. J., Sun, X. Y., Li, J. Y., et al. (2016). SNCA rs356182 variant increases risk of sporadic Parkinson’s disease in ethnic Chinese. J. Neurol. Sci. 368, 231–234. doi: 10.1016/j.jns.2016.07.032
Chiba-Falek, O., and Nussbaum, R. L. (2001). Effect of allelic variation at the NACP-Rep1 repeat upstream of the alpha-synuclein gene (SNCA) on transcription in a cell culture luciferase reporter system. Hum. Mol. Genet. 10, 3101–3109. doi: 10.1093/hmg/10.26.3101
Colom-Cadena, M., Gelpi, E., Martí, M. J., Charif, S., Dols-Icardo, O., Blesa, R., et al. (2013). MAPT H1 haplotype is associated with enhanced α-synuclein deposition in dementia with Lewy bodies. Neurobiol. Aging 34, 936–942. doi: 10.1016/j.neurobiolaging.2012.06.015
Conrad, C., Andreadis, A., Trojanowski, J. Q., Dickson, D. W., Kang, D., Chen, X., et al. (1997). Genetic evidence for the involvement of tau in progressive supranuclear palsy. Ann. Neurol. 41, 277–281.
Crary, J. F., Trojanowski, J. Q., Schneider, J. A., Abisambra, J. F., Abner, E. L., Alafuzoff, I., et al. (2014). Primary age-related tauopathy (PART): a common pathology associated with human aging. Acta Neuropathol. 128, 755–766.
Cronin, K. D., Ge, D., Manninger, P., Linnertz, C., Rossoshek, A., Orrison, B. M., et al. (2009). Expansion of the Parkinson disease-associated SNCA-Rep1 allele upregulates human alpha-synuclein in transgenic mouse brain. Hum. Mol. Genet. 18, 3274–3285. doi: 10.1093/hmg/ddp265
de Jong, S., Chepelev, I., Janson, E., Strengman, E., van den Berg, L. H., Veldink, J. H., et al. (2012). Common inversion polymorphism at 17q21.31 affects expression of multiple genes in tissue-specific manner. BMC Genomics 13:458. doi: 10.1186/1471-2164-13-458
Dhingra, A., Täger, J., Bressan, E., Rodriguez-Nieto, S., Bedi, M. S., Bröer, S., et al. (2020). Automated production of human induced pluripotent stem cell-derived cortical and dopaminergic neurons with integrated live-cell monitoring. J. Vis. Exp. e61525.
Di Battista, M. E., Pascale, E., Purcaro, C., Passarelli, F., Passarelli, E., Guglielmi, R., et al. (2014). Clinical subtypes in Parkinson’s disease: the impact of MAPT haplotypes. J. Neural. Transm. 121, 353–356. doi: 10.1007/s00702-013-1117-7
Dickson, D. W., Ahmed, Z., Algom, A. A., Tsuboi, Y., and Josephs, K. A. (2010). Neuropathology of variants of progressive supranuclear palsy. Curr. Opin. Neurol. 23, 394–400.
Dickson, D. W., Bergeron, C., Chin, S. S., Duyckaerts, C., Horoupian, D., Ikeda, K., et al. (2002). Office of rare diseases neuropathologic criteria for corticobasal degeneration. J. Neuropathol. Exp. Neurol. 61, 935–946. doi: 10.1093/jnen/61.11.935
Elbaz, A., Ross, O. A., Ioannidis, J. P., Soto-Ortolaza, A. I., Moisan, F., Aasly, J., et al. (2011). Independent and joint effects of the MAPT and SNCA genes in Parkinson disease. Ann. Neurol. 69, 778–792.
Ezquerra, M., Pastor, P., Gaig, C., Vidal-Taboada, J. M., Cruchaga, C., Munoz, E., et al. (2011). Different MAPT haplotypes are associated with Parkinson’s disease and progressive supranuclear palsy. Neurobiol. Aging 32, 547.e11–547.e16.
Ezquerra, M., Pastor, P., Valldeoriola, F., Molinuevo, J. L., Blesa, R., Tolosa, E., et al. (1999). Identification of a novel polymorphism in the promoter region of the tau gene highly associated to progressive supranuclear palsy in humans. Neurosci. Lett. 275, 183–186. doi: 10.1016/s0304-3940(99)00738-7
Fong, H., Wang, C., Knoferle, J., Walker, D., Balestra, M. E., Tong, L. M., et al. (2013). Genetic correction of tauopathy phenotypes in neurons derived from human induced pluripotent stem cells. Stem Cell Reports 1, 226–234. doi: 10.1016/j.stemcr.2013.08.001
Fuchs, J., Tichopad, A., Golub, Y., Munz, M., Schweitzer, K. J., Wolf, B., et al. (2008). Genetic variability in the SNCA gene influences alpha-synuclein levels in the blood and brain. Faseb J. 22, 1327–1334. doi: 10.1096/fj.07-9348com
Garcia-Leon, J. A., Cabrera-Socorro, A., Eggermont, K., Swijsen, A., Terryn, J., Fazal, R., et al. (2018). Generation of a human induced pluripotent stem cell-based model for tauopathies combining three microtubule-associated protein TAU mutations which displays several phenotypes linked to neurodegeneration. Alzheimers Dement. 14, 1261–1280. doi: 10.1016/j.jalz.2018.05.007
Ghetti, B., Oblak, A. L., Boeve, B. F., Johnson, K. A., Dickerson, B. C., and Goedert, M. (2015). Invited review: frontotemporal dementia caused by microtubule-associated protein tau gene (MAPT) mutations: a chameleon for neuropathology and neuroimaging. Neuropathol. Appl. Neurobiol. 41, 24–46. doi: 10.1111/nan.12213
Goedert, M., and Jakes, R. (1990). Expression of separate isoforms of human tau protein: correlation with the tau pattern in brain and effects on tubulin polymerization. Embo J. 9, 4225–4230.
Goedert, M., Klug, A., and Crowther, R. A. (2006). Tau protein, the paired helical filament and Alzheimer’s disease. J. Alzheimers Dis. 9, 195–207.
Goedert, M., Spillantini, M. G., Potier, M. C., Ulrich, J., and Crowther, R. A. (1989). Cloning and sequencing of the cDNA encoding an isoform of microtubule-associated protein tau containing four tandem repeats: differential expression of tau protein mRNAs in human brain. Embo J. 8, 393–399. doi: 10.1002/j.1460-2075.1989.tb03390.x
Höglinger, G. U., Melhem, N. M., Dickson, D. W., Sleiman, P. M., Wang, L. S., Klei, L., et al. (2011). Identification of common variants influencing risk of the tauopathy progressive supranuclear palsy. Nat. Genet. 43, 699–705.
Höglinger, G. U., Michel, P. P., Champy, P., Feger, J., Hirsch, E. C., Ruberg, M., et al. (2005). Experimental evidence for a toxic etiology of tropical parkinsonism. Mov. Disord. 20, 118–119. doi: 10.1002/mds.20300
Imamura, K., Sahara, N., Kanaan, N. M., Tsukita, K., Kondo, T., Kutoku, Y., et al. (2016). Calcium dysregulation contributes to neurodegeneration in FTLD patient iPSC-derived neurons. Sci. Rep. 6:34904.
Iovino, M., Agathou, S., Gonzalez-Rueda, A., Del Castillo Velasco-Herrera, M., Borroni, B., Alberici, A., et al. (2015). Early maturation and distinct tau pathology in induced pluripotent stem cell-derived neurons from patients with MAPT mutations. Brain 138, 3345–3359. doi: 10.1093/brain/awv222
Jellinger, K. A. (2011). Interaction between alpha-synuclein and tau in Parkinson’s disease comment on Wills et al.: elevated tauopathy and alpha-synuclein pathology in postmortem Parkinson’s disease brains with and without dementia. Exp Neurol 2010; 225: 210-218. Exp. Neurol. 227, 13–18.
Jicha, G. A., Bowser, R., Kazam, I. G., and Davies, P. (1997). Alz-50 and MC-1, a new monoclonal antibody raised to paired helical filaments, recognize conformational epitopes on recombinant tau. J. Neurosci. Res. 48, 128–132. doi: 10.1002/(sici)1097-4547(19970415)48:2<128::aid-jnr5>3.0.co;2-e
Kouri, N., Ross, O. A., Dombroski, B., Younkin, C. S., Serie, D. J., Soto-Ortolaza, A., et al. (2015). Genome-wide association study of corticobasal degeneration identifies risk variants shared with progressive supranuclear palsy. Nat. Commun. 6:7247.
Kwok, J. B., Teber, E. T., Loy, C., Hallupp, M., Nicholson, G., Mellick, G. D., et al. (2004). Tau haplotypes regulate transcription and are associated with Parkinson’s disease. Ann. Neurol. 55, 329–334. doi: 10.1002/ana.10826
Linnertz, C., Saucier, L., Ge, D., Cronin, K. D., Burke, J. R., Browndyke, J. N., et al. (2009). Genetic regulation of alpha-synuclein mRNA expression in various human brain tissues. PLoS One 4:e7480. doi: 10.1371/journal.pone.0007480
Majounie, E., Cross, W., Newsway, V., Dillman, A., Vandrovcova, J., Morris, C. M., et al. (2013). Variation in tau isoform expression in different brain regions and disease states. Neurobiol. Aging 34, 1922.e7–1922.e12.
Mata, I. F., Shi, M., Agarwal, P., Chung, K. A., Edwards, K. L., Factor, S. A., et al. (2010). SNCA variant associated with Parkinson disease and plasma alpha-synuclein level. Arch. Neurol. 67, 1350–1356.
McCarthy, J. J., Linnertz, C., Saucier, L., Burke, J. R., Hulette, C. M., Welsh-Bohmer, K. A., et al. (2011). The effect of SNCA 3’ region on the levels of SNCA-112 splicing variant. NeuroGenetics 12, 59–64. doi: 10.1007/s10048-010-0263-4
Menden, K., Francescatto, M., Nyima, T., Blauwendraat, C., Dhingra, A., Castillo-Lizardo, M., et al. (2021). Integrated multi-omics analysis reveals common and distinct dysregulated pathways for genetic subtypes of Frontotemporal Dementia. bioRxiv doi: 10.1101/2020.12.01.405894
Miguel, L., Rovelet-Lecrux, A., Feyeux, M., Frebourg, T., Nassoy, P., Campion, D., et al. (2019). Detection of all adult Tau isoforms in a 3D culture model of iPSC-derived neurons. Stem Cell Res. 40:101541. doi: 10.1016/j.scr.2019.101541
Myers, A. J., Kaleem, M., Marlowe, L., Pittman, A. M., Lees, A. J., Fung, H. C., et al. (2005). The H1c haplotype at the MAPT locus is associated with Alzheimer’s disease. Hum. Mol. Genet. 14, 2399–2404. doi: 10.1093/hmg/ddi241
Myers, A. J., Pittman, A. M., Zhao, A. S., Rohrer, K., Kaleem, M., Marlowe, L., et al. (2007). The MAPT H1c risk haplotype is associated with increased expression of tau and especially of 4 repeat containing transcripts. Neurobiol. Dis. 25, 561–570. doi: 10.1016/j.nbd.2006.10.018
Nakamura, M., Shiozawa, S., Tsuboi, D., Amano, M., Watanabe, H., Maeda, S., et al. (2019). Pathological Progression Induced by the Frontotemporal Dementia-Associated R406W Tau Mutation in Patient-Derived iPSCs. Stem Cell Reports 13, 684–699. doi: 10.1016/j.stemcr.2019.08.011
Pan, F., Ding, H., Dong, H., Ye, M., Liu, W., Cui, G., et al. (2013). Association of polymorphism in rs2736990 of the α-synuclein gene with Parkinson’s disease in a Chinese population. Neurol. India 61, 360–364. doi: 10.4103/0028-3886.117595
Pascale, E., Di Battista, M. E., Rubino, A., Purcaro, C., Valente, M., Fattapposta, F., et al. (2016). Genetic architecture of MAPT gene region in Parkinson disease subtypes. Front. Cell. Neurosci. 10:96. doi: 10.3389/fncel.2016.00096
Pastor, P., Ezquerra, M., Tolosa, E., Muñoz, E., Martí, M. J., Valldeoriola, F., et al. (2002). Further extension of the H1 haplotype associated with progressive supranuclear palsy. Mov. Disord. 17, 550–556. doi: 10.1002/mds.10076
Pittman, A. M., Myers, A. J., Abou-Sleiman, P., Fung, H. C., Kaleem, M., Marlowe, L., et al. (2005). Linkage disequilibrium fine mapping and haplotype association analysis of the tau gene in progressive supranuclear palsy and corticobasal degeneration. J. Med. Genet. 42, 837–846.
Pittman, A. M., Myers, A. J., Duckworth, J., Bryden, L., Hanson, M., Abou-Sleiman, P., et al. (2004). The structure of the tau haplotype in controls and in progressive supranuclear palsy. Hum. Mol. Genet. 13, 1267–1274. doi: 10.1093/hmg/ddh138
Reinhardt, P., Glatza, M., Hemmer, K., Tsytsyura, Y., Thiel, C. S., Hoing, S., et al. (2013). Derivation and expansion using only small molecules of human neural progenitors for neurodegenerative disease modeling. PLoS One 8:e59252. doi: 10.1371/journal.pone.0059252
Robakis, D., Cortes, E., Clark, L. N., Vonsattel, J. P., Virmani, T., Alcalay, R. N., et al. (2016). The effect of MAPT haplotype on neocortical Lewy body pathology in Parkinson disease. J. Neural. Transm. 123, 583–588. doi: 10.1007/s00702-016-1552-3
Schindelin, J., Arganda-Carreras, I., Frise, E., Kaynig, V., Longair, M., Pietzsch, T., et al. (2012). Fiji: an open-source platform for biological-image analysis. Nat. Methods 9, 676–682. doi: 10.1038/nmeth.2019
Schindelin, J., Rueden, C. T., Hiner, M. C., and Eliceiri, K. W. (2015). The imageJ ecosystem: an open platform for biomedical image analysis. Mol. Reprod. Dev. 82, 518–529. doi: 10.1002/mrd.22489
Sergeant, N., Delacourte, A., and Buée, L. (2005). Tau protein as a differential biomarker of tauopathies. Biochim. Biophys. Acta 1739, 179–197. doi: 10.1016/j.bbadis.2004.06.020
Silva, M. C., Cheng, C., Mair, W., Almeida, S., Fong, H., Biswas, M. H., et al. (2016). Human iPSC-derived neuronal model of Tau-A152T frontotemporal dementia reveals Tau-mediated mechanisms of neuronal vulnerability. Stem Cell Reports 7, 325–340. doi: 10.1016/j.stemcr.2016.08.001
Sposito, T., Preza, E., Mahoney, C. J., Seto-Salvia, N., Ryan, N. S., Morris, H. R., et al. (2015). Developmental regulation of tau splicing is disrupted in stem cell-derived neurons from frontotemporal dementia patients with the 10 + 16 splice-site mutation in MAPT. Hum. Mol. Genet. 24, 5260–5269. doi: 10.1093/hmg/ddv246
Stefansson, H., Helgason, A., Thorleifsson, G., Steinthorsdottir, V., Masson, G., Barnard, J., et al. (2005). A common inversion under selection in Europeans. Nat Genet. 37, 129–137. doi: 10.1038/ng1508
Trabzuni, D., Wray, S., Vandrovcova, J., Ramasamy, A., Walker, R., Smith, C., et al. (2012). MAPT expression and splicing is differentially regulated by brain region: relation to genotype and implication for tauopathies. Hum. Mol. Genet. 21, 4094–4103. doi: 10.1093/hmg/dds238
Valenca, G. T., Srivastava, G. P., Oliveira-Filho, J., White, C. C., Yu, L., Schneider, J. A., et al. (2016). The Role of MAPT Haplotype H2 and Isoform 1N/4R in Parkinsonism of Older Adults. PLoS One 11:e0157452. doi: 10.1371/journal.pone.0157452
Verheyen, A., Diels, A., Reumers, J., Van Hoorde, K., Van Den Wyngaert, I., Van OUTRyve D’ydewalle, C., et al. (2018). Genetically engineered iPSC-derived FTDP-17 MAPT neurons display mutation-specific neurodegenerative and neurodevelopmental phenotypes. Stem Cell Reports 11, 363–379. doi: 10.1016/j.stemcr.2018.06.022
Volpato, V., Smith, J., Sandor, C., Ried, J. S., Baud, A., Handel, A., et al. (2018). Reproducibility of molecular phenotypes after long-term differentiation to human iPSC-derived neurons: a multi-site omics study. Stem Cell Reports 11, 897–911. doi: 10.1016/j.stemcr.2018.08.013
Vuono, R., Winder-Rhodes, S., De Silva, R., Cisbani, G., Drouin-Ouellet, J., Spillantini, M. G., et al. (2015). The role of tau in the pathological process and clinical expression of Huntington’s disease. Brain 138, 1907–1918. doi: 10.1093/brain/awv107
Wider, C., Ross, O. A., Nishioka, K., Heckman, M. G., Vilarino-Guell, C., Jasinska-Myga, B., et al. (2012). An evaluation of the impact of MAPT. SNCA and APOE on the burden of Alzheimer’s and Lewy body pathology. J. Neurol. Neurosurg. Psychiatry 83, 424–429.
Winkler, S., Hagenah, J., Lincoln, S., Heckman, M., Haugarvoll, K., Lohmann-Hedrich, K., et al. (2007). alpha-Synuclein and Parkinson disease susceptibility. Neurology 69, 1745–1750.
Zabetian, C. P., Hutter, C. M., Factor, S. A., Nutt, J. G., Higgins, D. S., Griffith, A., et al. (2007). Association analysis of MAPT H1 haplotype and subhaplotypes in Parkinson’s disease. Ann. Neurol. 62, 137–144. doi: 10.1002/ana.21157
Keywords: TAU, α-SYNUCLEIN, iPSC, disease modeling, NGN2 neurons, MAPT haplotype
Citation: Strauß T, Marvian-Tayaranian A, Sadikoglou E, Dhingra A, Wegner F, Trümbach D, Wurst W, Heutink P, Schwarz SC and Höglinger GU (2021) iPS Cell-Based Model for MAPT Haplotype as a Risk Factor for Human Tauopathies Identifies No Major Differences in TAU Expression. Front. Cell Dev. Biol. 9:726866. doi: 10.3389/fcell.2021.726866
Received: 17 June 2021; Accepted: 09 August 2021;
Published: 31 August 2021.
Edited by:
Mark Hamrick, Augusta University, United StatesReviewed by:
Danielle Mor, Augusta University, United StatesWei-Li Kuan, University of Cambridge, United Kingdom
Copyright © 2021 Strauß, Marvian-Tayaranian, Sadikoglou, Dhingra, Wegner, Trümbach, Wurst, Heutink, Schwarz and Höglinger. This is an open-access article distributed under the terms of the Creative Commons Attribution License (CC BY). The use, distribution or reproduction in other forums is permitted, provided the original author(s) and the copyright owner(s) are credited and that the original publication in this journal is cited, in accordance with accepted academic practice. No use, distribution or reproduction is permitted which does not comply with these terms.
*Correspondence: Günter U. Höglinger, Hoeglinger.Guenter@mh-hannover.de