The m6A RNA Modification Modulates Gene Expression and Fibrosis-Related Pathways in Hypertrophic Scar
 Si-Yu Liu1
  Jun-Jie Wu2 Zhong-hua Chen3 Ming-Li Zou1 Ying-ying Teng4 Kai-Wen Zhang1 Yue-Yue Li4 Dang-yang Guo4
  Feng-Lai Yuan1,2,4*
- 1Department of Medicine, Institute of Integrated Traditional Chinese and Western Medicine, Wuxi Hospital of Integrated Traditional Chinese and Western Medicine, Nanjing University of Traditional Chinese Medicine, Wuxi, China
- 2Institute of Integrated Chinese and Western Medicine, The Hospital Affiliated to Jiangnan University, Wuxi, China
- 3Department of Medicine, The Nantong University, Nantong, China
- 4The Hospital Affiliated to Jiangnan University, Wuxi, China
Purpose: To systematically analyze the overall m6A modification pattern in hyperplastic scars (HS).
Methods: The m6A modification patterns in HS and normal skin (NS) tissues were described by m6A sequencing and RNA sequencing, and subsequently bioinformatics analysis was performed. The m6A-related RNA was immunoprecipitated and verified by real-time quantitative PCR.
Results: The appearance of 14,791 new m6A peaks in the HS sample was accompanied by the disappearance of 7,835 peaks. The unique m6A-related genes in HS were thus associated with fibrosis-related pathways. We identified the differentially expressed mRNA transcripts in HS samples with hyper-methylated or hypo-methylated m6A peaks.
Conclusion: This study is the first to map the m6A transcriptome of human HS, which may help clarify the possible mechanism of m6A-mediated gene expression regulation.
Introduction
Hypertrophic scars (HS) normally occur after burns and trauma. The pathological features of hypertrophic scars include abnormal inflammation, excessive proliferation and differentiation of fibroblasts, increased angiogenesis, and excessive deposition of extracellular matrix (ECM) (Zhu et al., 2020; Zhang et al., 2021). The clinical manifestations are accompanied by itching (Lee et al., 2004), pain (Zhuang et al., 2021), infection (Zhu et al., 2007), and even dysfunction (Bijlard et al., 2017). When HS occur on the face, joints, or other important parts of the body, they will negatively impact the patient’s appearance and seriously affect physical and mental health (Gurtner et al., 2008; Eming et al., 2014). Current treatment methods for HS have certain limitations. It is difficult to achieve a complete cure by traditional surgery, radiotherapy, and hormone therapy, particularly in areas where HS are prone to recurrence (Jaloux et al., 2017). Therefore, scar repair has always been a difficult and hot spot in the field of wound repair and plastic surgery. At present, the etiology and molecular mechanisms that lead to the continuous over-synthesis of collagen in HS are still unclear. Studies have shown that regulatory factors including epigenetic DNA methyltransferase, non-coding RNA, and histones are dysregulated in skin fibrosis (Mann and Mann, 2013; Hardy and Mann, 2016; Lee et al., 2017). Evidence accumulated in preclinical studies and first proof-of-concept studies in patients with fibrosis indicates that targeted abnormal epigenetic modifications may provide potential for the treatment of skin fibrosis (Noda et al., 2014; Zeybel et al., 2017; Shin et al., 2019). The regulation of the apparent modification of m6A is one of the important foundations for cell fate changes and decisions, and it is also a new research hotspot in life sciences. Therefore, whether m6A can be used as a new target and mechanism for fibrotic diseases and provide new treatment method for skin fibrosis remains to be seen.
N6-methyladenosine (N6-methyladenosine, m6A) is the most significant modification of poly-adenylated mRNAs and long non-coding RNAs in higher eukaryotes, which was first reported during the early 1970s (Wei et al., 1975). The m6A is the most common mRNA modification in mammals (Zhang et al., 2017). In recent years, greater attention has again been paid to the fact that it plays an important role in many aspects of RNA metabolism. The m6A modification targets and regulates the stability (Wang et al., 2014), localization (Wang et al., 2014), transport, and translation of mRNA after transcription (Wang et al., 2015), thereby affecting various biological processes, including embryonic development, stem cell self-renewal, DNA damage response, and primary miRNA processing (Wang et al., 2014; Weng et al., 2019; Liu et al., 2021). The m6A modification is catalyzed by the m6A methyltransferases (termed m6A writers), including methyltransferase-like 3 and 14 (METTL3 and METTL14), and the co-factor, Wilm’s tumor 1 associated protein (WTAP) (Fu et al., 2014). In contrast, m6A demethylases, including fat mass and obesity-associated protein (FTO) and AlkB homolog 5 (ALKBH5) (also known as m6A erasers), can remove methyl radicals from RNA, maintaining the m6A modification in dynamic equilibrium (Li et al., 2019). Another group of m6A binding proteins (such as the YT521-B homology domain family YTHDF1/2/3) act as m6A readers to mediate specific functions of methylated mRNA transcripts (Fu et al., 2014; Deng et al., 2018). The m6A modification is a dynamic process; due to its tissue specificity, it has spatiotemporal characteristics, and it responds to internal and external signals. Indeed, ever increasing evidence shows that m6A modification is not only associated with normal biological processes but also with the occurrence and development of different types of diseases. In 2012, two independent studies reported for the first time the m6A RNA methylome in the mammalian genome, using the m6A-RNA immune-deposition method followed by high-throughput sequencing (MeRIP-seq). However, the distribution of the m6A transcriptome in most diseases is largely unknown. Skin has a high m6A content. Studies have shown that m6A can affect the selection of skin phenotype transformation (Xi et al., 2020), but the role of this regulatory mechanism remains unclear (Dominissini et al., 2012; Meyer et al., 2012). To date, the RNA m6A methylation profile of HS has not been determined. We report here for the first time the m6A profile within the transcriptome in HS samples and adjacent NS, showing a highly diverse m6A modification pattern between these two different types of skin. Abnormal m6A RNA modification in HS has been shown to regulate the expression of fibrosis-related genes and pathways. The present study will help in the further investigation of the potential role of m6A modification in HS pathogenesis.
Materials and Methods
Patients and Samples
This study was approved by the Ethics Committee of the Affiliated Hospital of Jiangnan University, and written informed consent was obtained from all the participants. All procedures performed in the research involving human participants complied with ethical committee. HS tissue and adjacent full-thickness normal skin (NS) tissue were collected during plastic surgery (Table 1). Following sample collection, this was immediately transferred into a 1.5-ml RNase-free centrifuge tube, rapidly frozen in liquid nitrogen, and stored at −80°C until RNA separation. Three pairs of scars for the HS group and normal skin samples for the NS groups were selected for MeRIP and RNA sequencing, and the remaining samples were stored at −80°C until used.
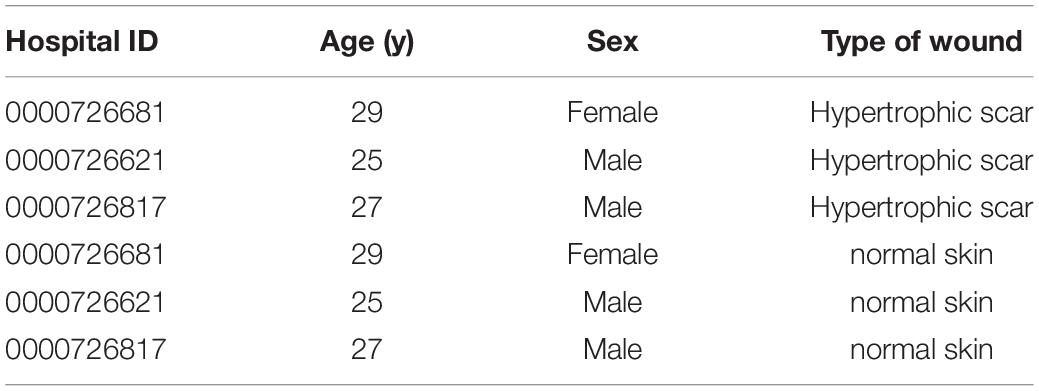
Table 1. Clinical characteristics of patients.
High-Throughput m6A and mRNA Sequencing
m6A RNA-Seq service was provided by Cloudseq Biotech Inc. (Shanghai, China). Briefly, m6A RNA immunoprecipitation was performed with the GenSeq m6A-MeRIP Kit (GenSeq Inc., China) by following the manufacturer’s instructions. Both the input samples without immunoprecipitation and the m6A IP samples were used for RNA-seq library generation with NEBNext Ultra II Directional RNA Library Prep Kit (New England Biolabs, Inc., United States). The library quality was evaluated with BioAnalyzer 2100 system (Agilent Technologies, Inc., United States). Library sequencing was performed on an Illumina Hiseq instrument with 150 bp paired-end reads. RNA high-throughput sequencing was performed by Cloud-Seq Biotech (Shanghai, China). Briefly, total RNA was used for removing the rRNAs with NEBNext rRNA Depletion Kit (New England Biolabs, Inc., MA, United States) following the manufacturer’s instructions. RNA libraries were constructed by using NEBNext Ultra II Directional RNA Library Prep Kit (New England Biolabs) according to the manufacturer’s instructions. Libraries were controlled for quality and quantified using the BioAnalyzer 2100 system (Agilent Technologies, Inc., United States). Library sequencing was performed on an Illumina Hiseq instrument with 150 bp paired-end reads. Raw data of RNA-seq and m6A-seq have been uploaded to GEO database (accession number GSE181540)1.
Sequencing Data Analysis
Briefly, paired-end reads were harvested from an Illumina HiSeq 4000 sequencer and were quality controlled by Q30. After 3′ adaptor-trimming, low quality reads were removed by cutadapt software (v1.9.3). First, clean reads of all libraries were aligned to the reference genome (HG19) by Hisat2 software (v2.0.4). Methylated sites on RNAs (peaks) were identified by MACS software. Differentially methylated sites were identified by diffReps. These peaks identified by both software overlapping with exons of mRNA were figured out and chosen by home-made scripts. Identified m6A peaks were subjected to motif enrichment analysis by HOMER (Heinz et al., 2010), while the compared reads can be visualized in the Integrative Genomics Viewer (IGV) to visually show the expression of mRNA (Thorvaldsdóttir et al., 2013). GO and pathway enrichment analysis were performed by the differentially methylated protein coding genes.
RNA Extraction and Quantitative Real-Time PCR
TRIzol Reagent (Life Technologies, CA, United States) was used to isolate total RNA, which was used to synthesize complementary DNA with the iScript cDNA Synthesis Kit (Takara, Liaoning, China). Real-time PCR was subsequently performed using an SYBR premix Ex Taq (Takara) and the ABI 7500 Sequence Detection System (Thermo Fisher Scientific, MA, United States). All procedures were performed according to the manufacturer’s protocols.
Gene-Specific m6A Quantitative Real-Time PCR Validation
Four genes with differentially methylated sites according to the m6A-seq were tested by reverse transcription (RT)-Quantitative Real-Time PCR (qPCR). A portion of fragmented RNA was saved as the input control. The remaining RNA was incubated with anti-m6A antibody-coupled beads. The m6A-containing RNAs were immunoprecipitated and eluted from the beads.
Both input control and m6A-IP samples were subjected to RT-qPCR with gene-specific primers. The gene-specific qPCR primers could be seen in Table 2.
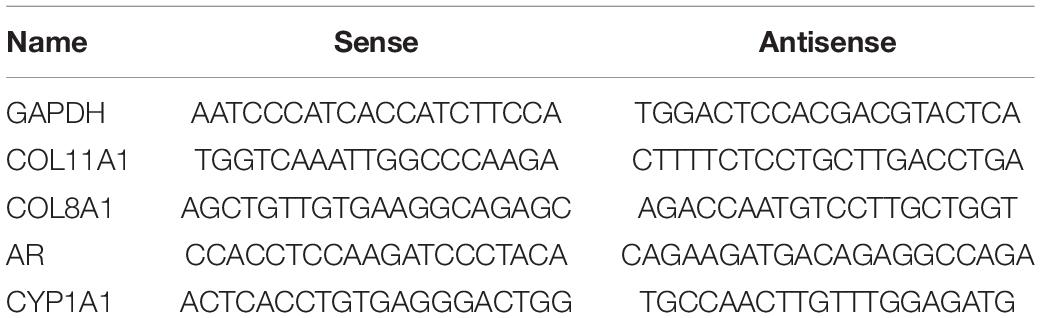
Table 2. Sequences of primers used for qRT-PCR analysis of mRNA levels.
RNA m6A Quantification
Total RNA was extracted from cells using TRIzol reagent (Life Technologies, CA, United States). The m6A RNA Methylation Assay Kit (ab185912; Abcam, United Kingdom) was used to detect the m6A content in the total RNA. In brief, 2 μl negative control, 2 μl diluted positive control, and 200 ng sample RNA were added to a 96-well plate. Subsequently, 50 μl diluted capture antibody, detection antibody, and diluted enhancer solution were added into each well. Following the addition of 100 μl diluted developer solution to each well, stop solution was added, and the signaling was detected within 2 to 10 min using a microplate reader at 450 nm. A simple calculation of the percentage of m6A in total RNA was performed using the following formula: m6A% = [(sample OD - NC OD) ÷ S]/[(PC OD - NC OD) ÷ P] × 100%. S is the amount of sample RNA (ng), P is the amount of positive control (PC, ng), and NC is the negative control (ng).
Statistical Analysis
Data from three or more independent experiments were presented as the mean ± SD. Statistical analysis was performed using SPSS 22.0 and GraphPad Prism 5.0 software. Paired Student’s t-tests were performed between HS and adjacent NS samples. One-way ANOVA was used to access the differences among three or more groups. Differences with p < 0.05 were defined as the threshold for significance.
Results
Transcriptome-Wide m6A-Seq Revealed Global m6A Modification Patterns in Hypertrophic Scar
Selected HS tissues and adjacent NS tissues from three patients were obtained for transcriptome m6A sequencing (m6A-seq) and RNA sequencing (RNA-seq) analysis methylated RNA immunoprecipitation sequencing IP or input in HS and NS. From these samples 37,973,160–43,157,012 original reads were obtained. After filtering out low-quality data, more than 33 million high-quality reads in each sample were mapped to the Gallus gallus reference genome (Gallus.gallus-5.0). The clean reads of above 82% obtained from all samples were uniquely mapped to the reference genome (Supplementary Table 1), which allowed us to effectively identify the m6A peak by analyzing paired MeRIP and input libraries.
Through the model analysis of the HS group ChIP-seq (MACS) (Zhang et al., 2008), a total of 27,210 m6A peaks were identified, representing 9,636 gene transcripts. In the adjacent NS group, 20,254 m6A peaks were identified, corresponding to 8,169 gene transcripts (Figures 1A,B). The difference and overlap of m6A RNA in the HS and NS groups are shown by the Venn diagrams in Figures 1A,B. Among them, there were a total of 12,419 m6A peaks corresponding to 6,973 m6A modifier genes in the two groups of samples. Compared with the NS group, 14,791 new peaks appeared in the HS group and 7,835 peaks disappeared, indicating that the overall m6A modification patterns of the HS and NS groups were significantly different (Figures 1A–C).
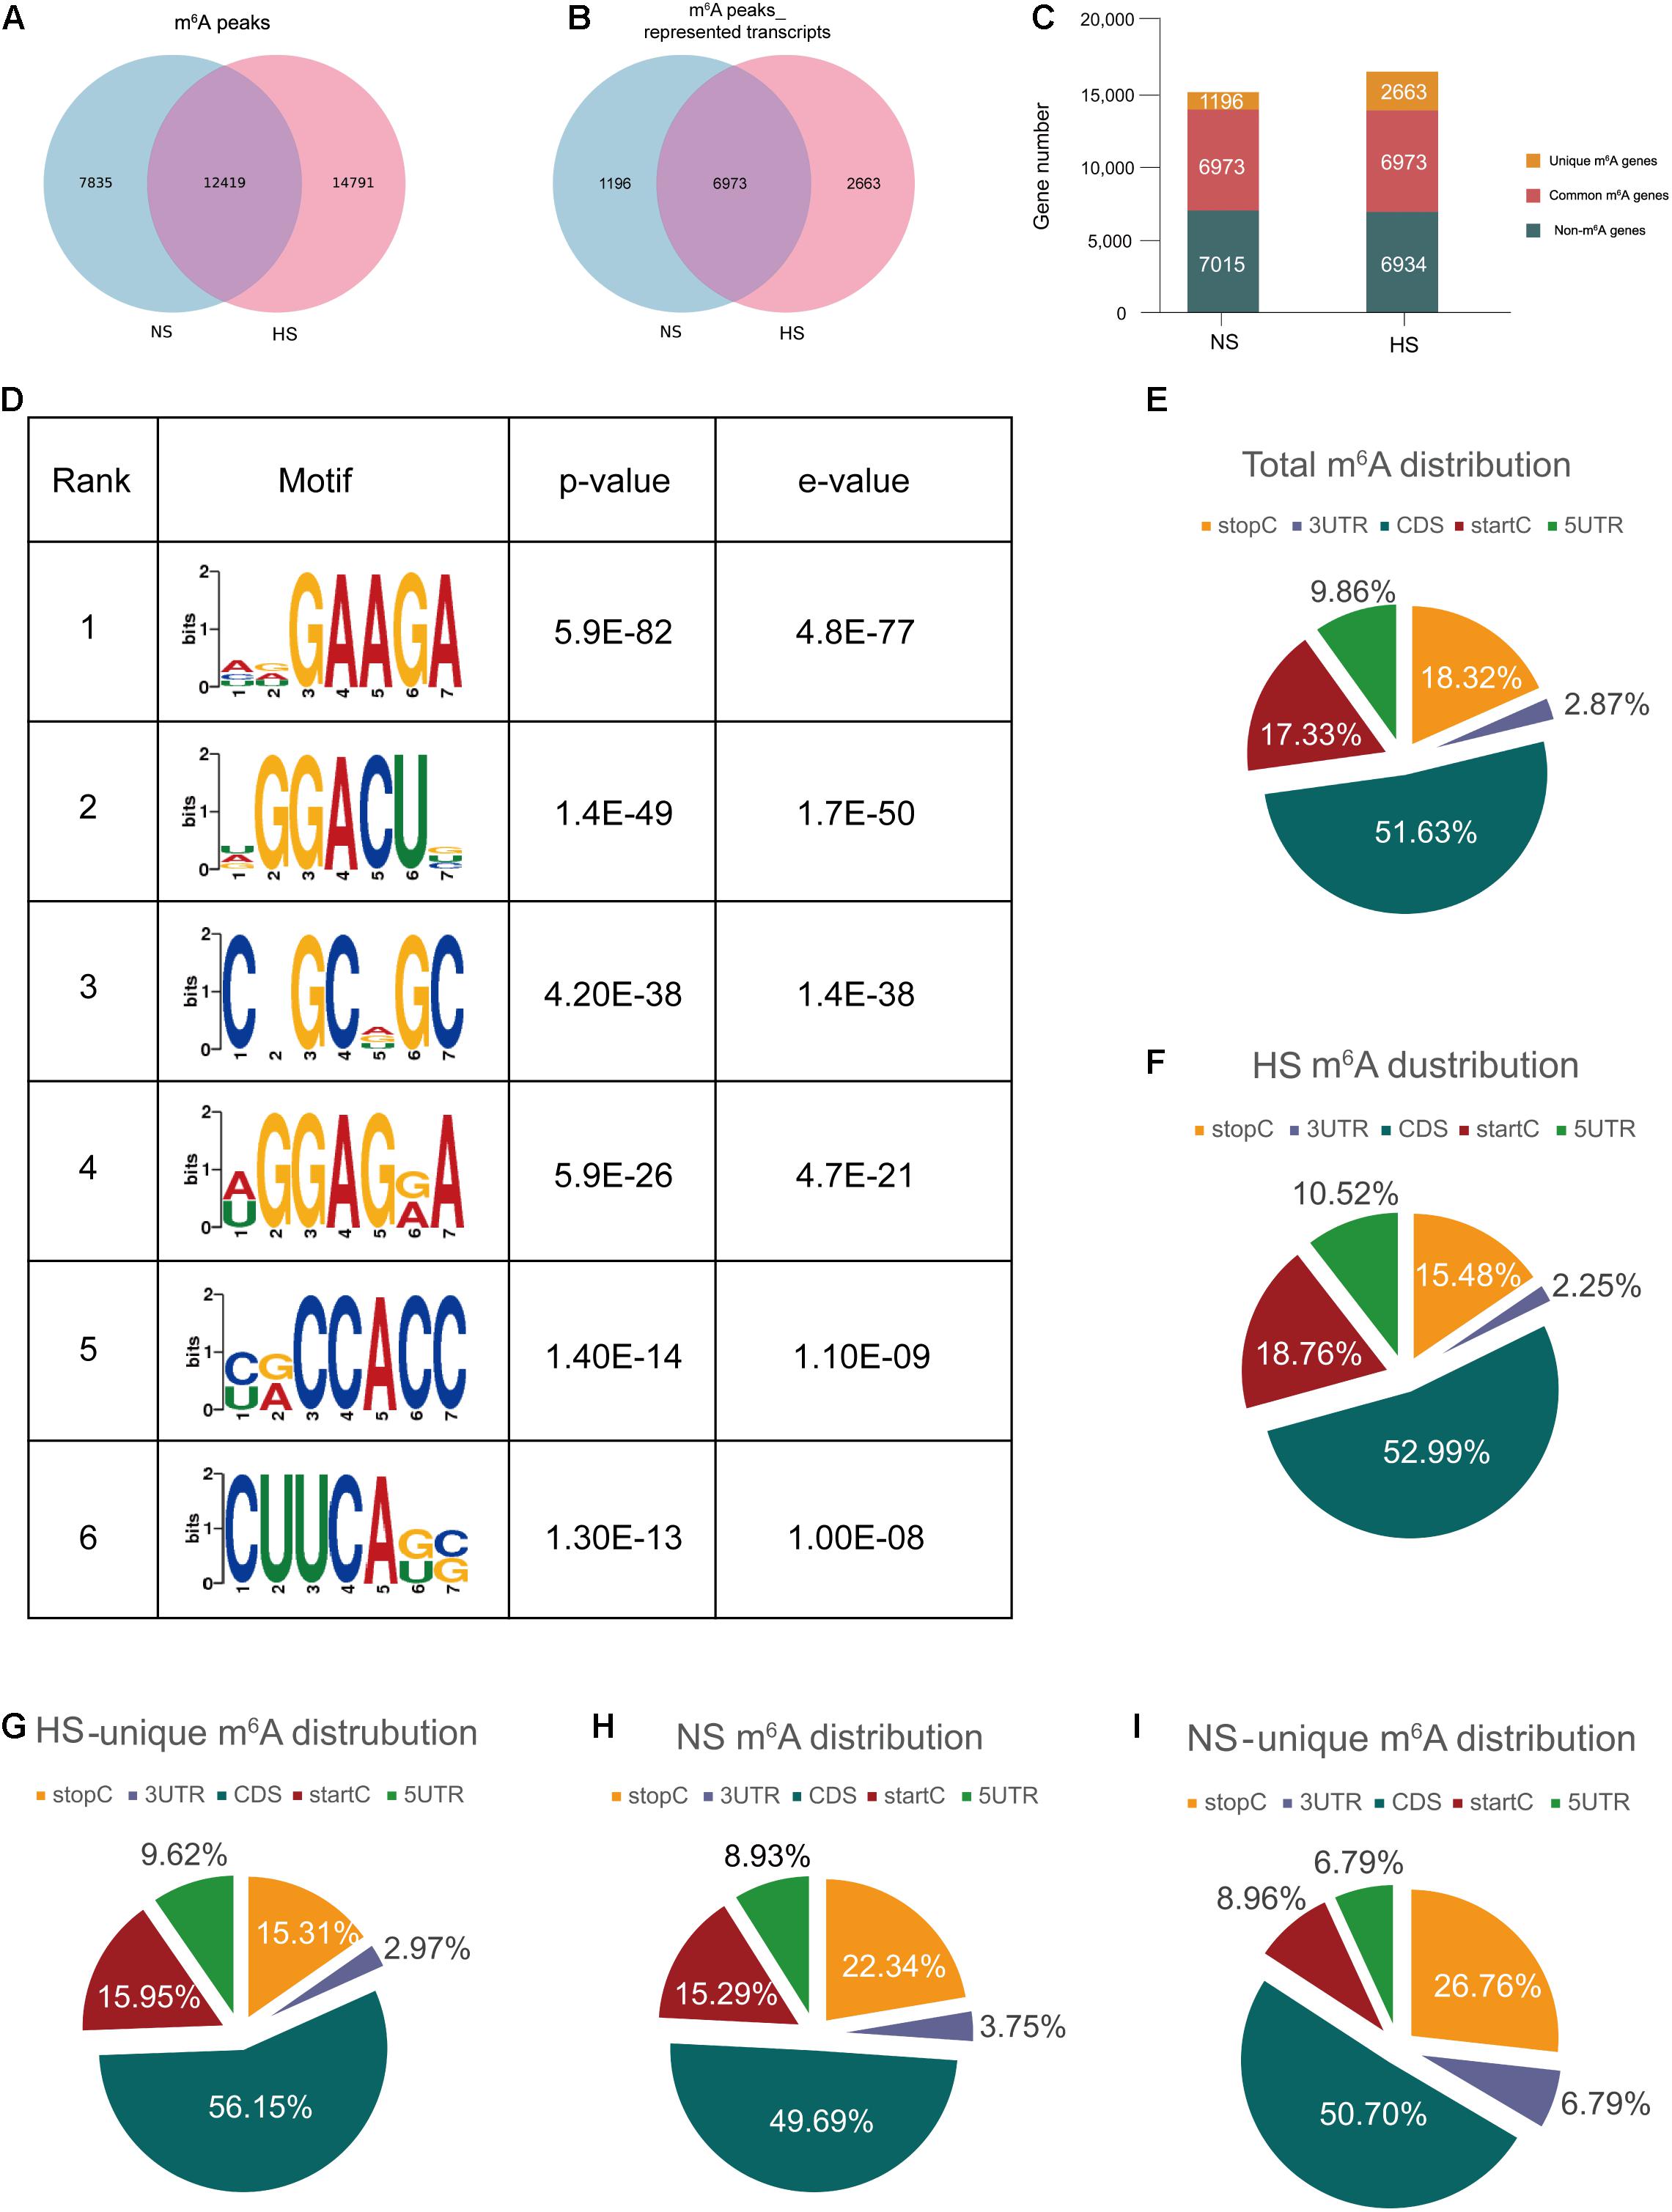
Figure 1. Transcriptome-wide m6A-seq and analysis of m6A peaks. (A) Identification of m6A peaks by model-based analysis of the ChIP-seq algorithm. The numbers of hypertrophic scar-unique, normal skin-unique, and common m6A peaks are shown; (B) Venn diagram of m6A peak–represented transcripts of the two groups; (C) summary of m6A-modified genes identified in the m6A-seq. (D) The top six motifs enriched across the m6A peaks identified from HS. (E–I) The proportion of m6A peak distributions: the proportion of m6A peak distribution in the indicated regions in NS and HS samples (E); the proportion of m6A peak distribution in the indicated regions in NS (F); the proportion of m6A peak distribution in the indicated regions in HS (G); the loss of existing m6A peaks (NS-unique peaks) (H) or appearance of new m6A peaks (HS-unique peaks) (I) in the HS group. HS, hypertrophic scar group; NS, normal skin group.
The m6A methylomes were further mapped using HOMER software. Among the 35,045 identified m6A peaks, the most consistent motifs were GAAGA and GGACU (Figure 1D). We analyzed the distribution of m6A in the entire transcriptome of HS and NS samples. The total and unique peaks of the two sets of m6A were analyzed. According to the position of the m6A peak in the RNA transcript, the m6A peak can be divided into the 5′-UTR, start codon segment (400 nucleotides centered on the start codon), coding sequence (CDS), stop codon segment (400 nucleotides centered on the stop codon), and 3′-UTR. In general, the m6A peak was particularly enriched near the start codon, CDS, and stop codon (Figure 1G), which was consistent with previous m6A-seq results (Dominissini et al., 2012; Meyer et al., 2012). The m6A peak of HS was significantly different from that of NS. The deposition of m6A in the HS start codon region was relatively increased, and the stop codon region was relatively reduced, whereas it was the opposite in the NS group (Figures 1E–I). The 7,835 unique peaks of NS included 700 peaks in the 5′-UTR region, 1,198 peaks in the start codon, 3,893 peaks in the CDS region, 1,750 peaks in the stop codon, and 294 peaks in the 3′-UTR region (Figure 1G), while in HS, 14,791 m6A-specific peaks included 1,556 peaks in the 5′-UTR region, 2,775 peaks in the start codon, 7,838 peaks in the CDS region, 2,290 peaks in the stop codon, and 333 peaks in the 3′-UTR region (Figure 1I).
Abnormal m6A-Modified Genes Were Enriched in Fibrosis-Related Signaling Pathways
The abundance of m6A peaks in the HS and NS samples were compared. In the 35,045 m6A peaks detected in the two samples, a total of 10,832 differential methylation sites were used for further study. The top 20 differently methylated m6A peaks are listed in Table 3. Compared with the NS group, the HS group had 2,071 significantly hyper-methylated m6A sites and 1,786 significantly hypo-methylated m6A sites (fold change > 2, p < 0.05) (Figure 2A). The remaining m6A peaks were regarded as unchanged m6A peaks. According to the Integrated Genomics Viewer (IGV) software (Oda et al., 2000), COL11A1 and NTF4, a significantly hypermethylated peak is shown in Figure 2B. The intensity of the differentially methylated sites in the two groups changed, and the GGACU motif surrounded the corresponding m6A peak. To determine the biological significance of m6A methylation in HS/NS, the GO and KEGG pathways were analyzed for genes (differentially methylated genes, DMGs) with significantly changed m6A peaks in HS/NS. GO analysis found that the hypermethylated genes in HS/NS were significantly involved in system development (ontology: biological process Figure 2C), fibrillar collagen trimer (ontology: cellular component Supplementary Figure 1A), and binding (ontology: molecular function; Supplementary Figure 1C). Hypomethylated genes were significantly related to tissue development (ontology: biological process Figure 2D), intracellular part (ontology: Supplementary Figure 1B), and MAP kinase activity (ontology: molecular function; Supplementary Figure 1D) regulation. Of note, the KEGG pathway analysis showed that hypermethylated genes in HS/NS were closely associated with the P13K-Akt signaling pathway, focal adhesion, and ECM-receptor interaction (Figure 2E), while hypomethylated genes in HS/NS were closely related to the MAPK signaling pathway and the NF-kappa B signaling pathway (Figure 2F).
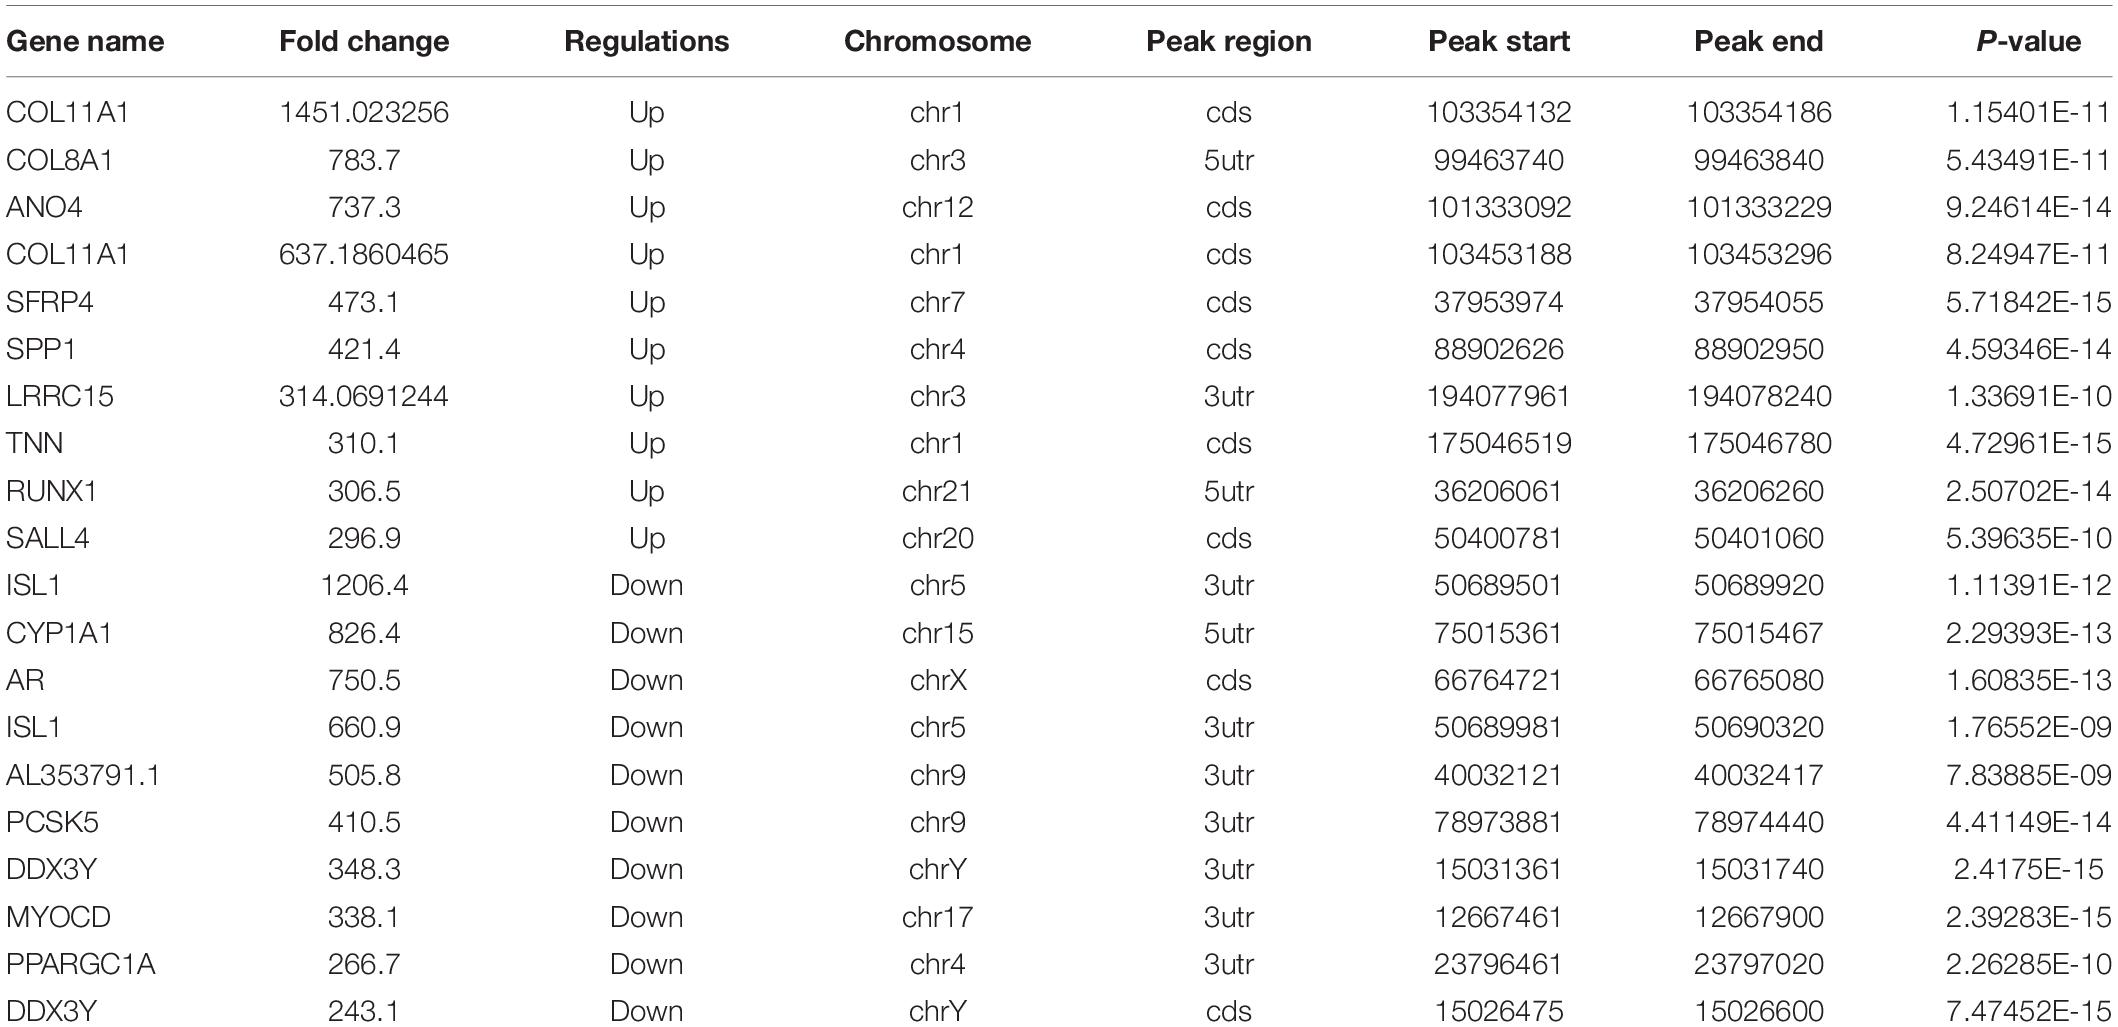
Table 3. The top 20 differently expressed m6A peaks (SC vs. NS).
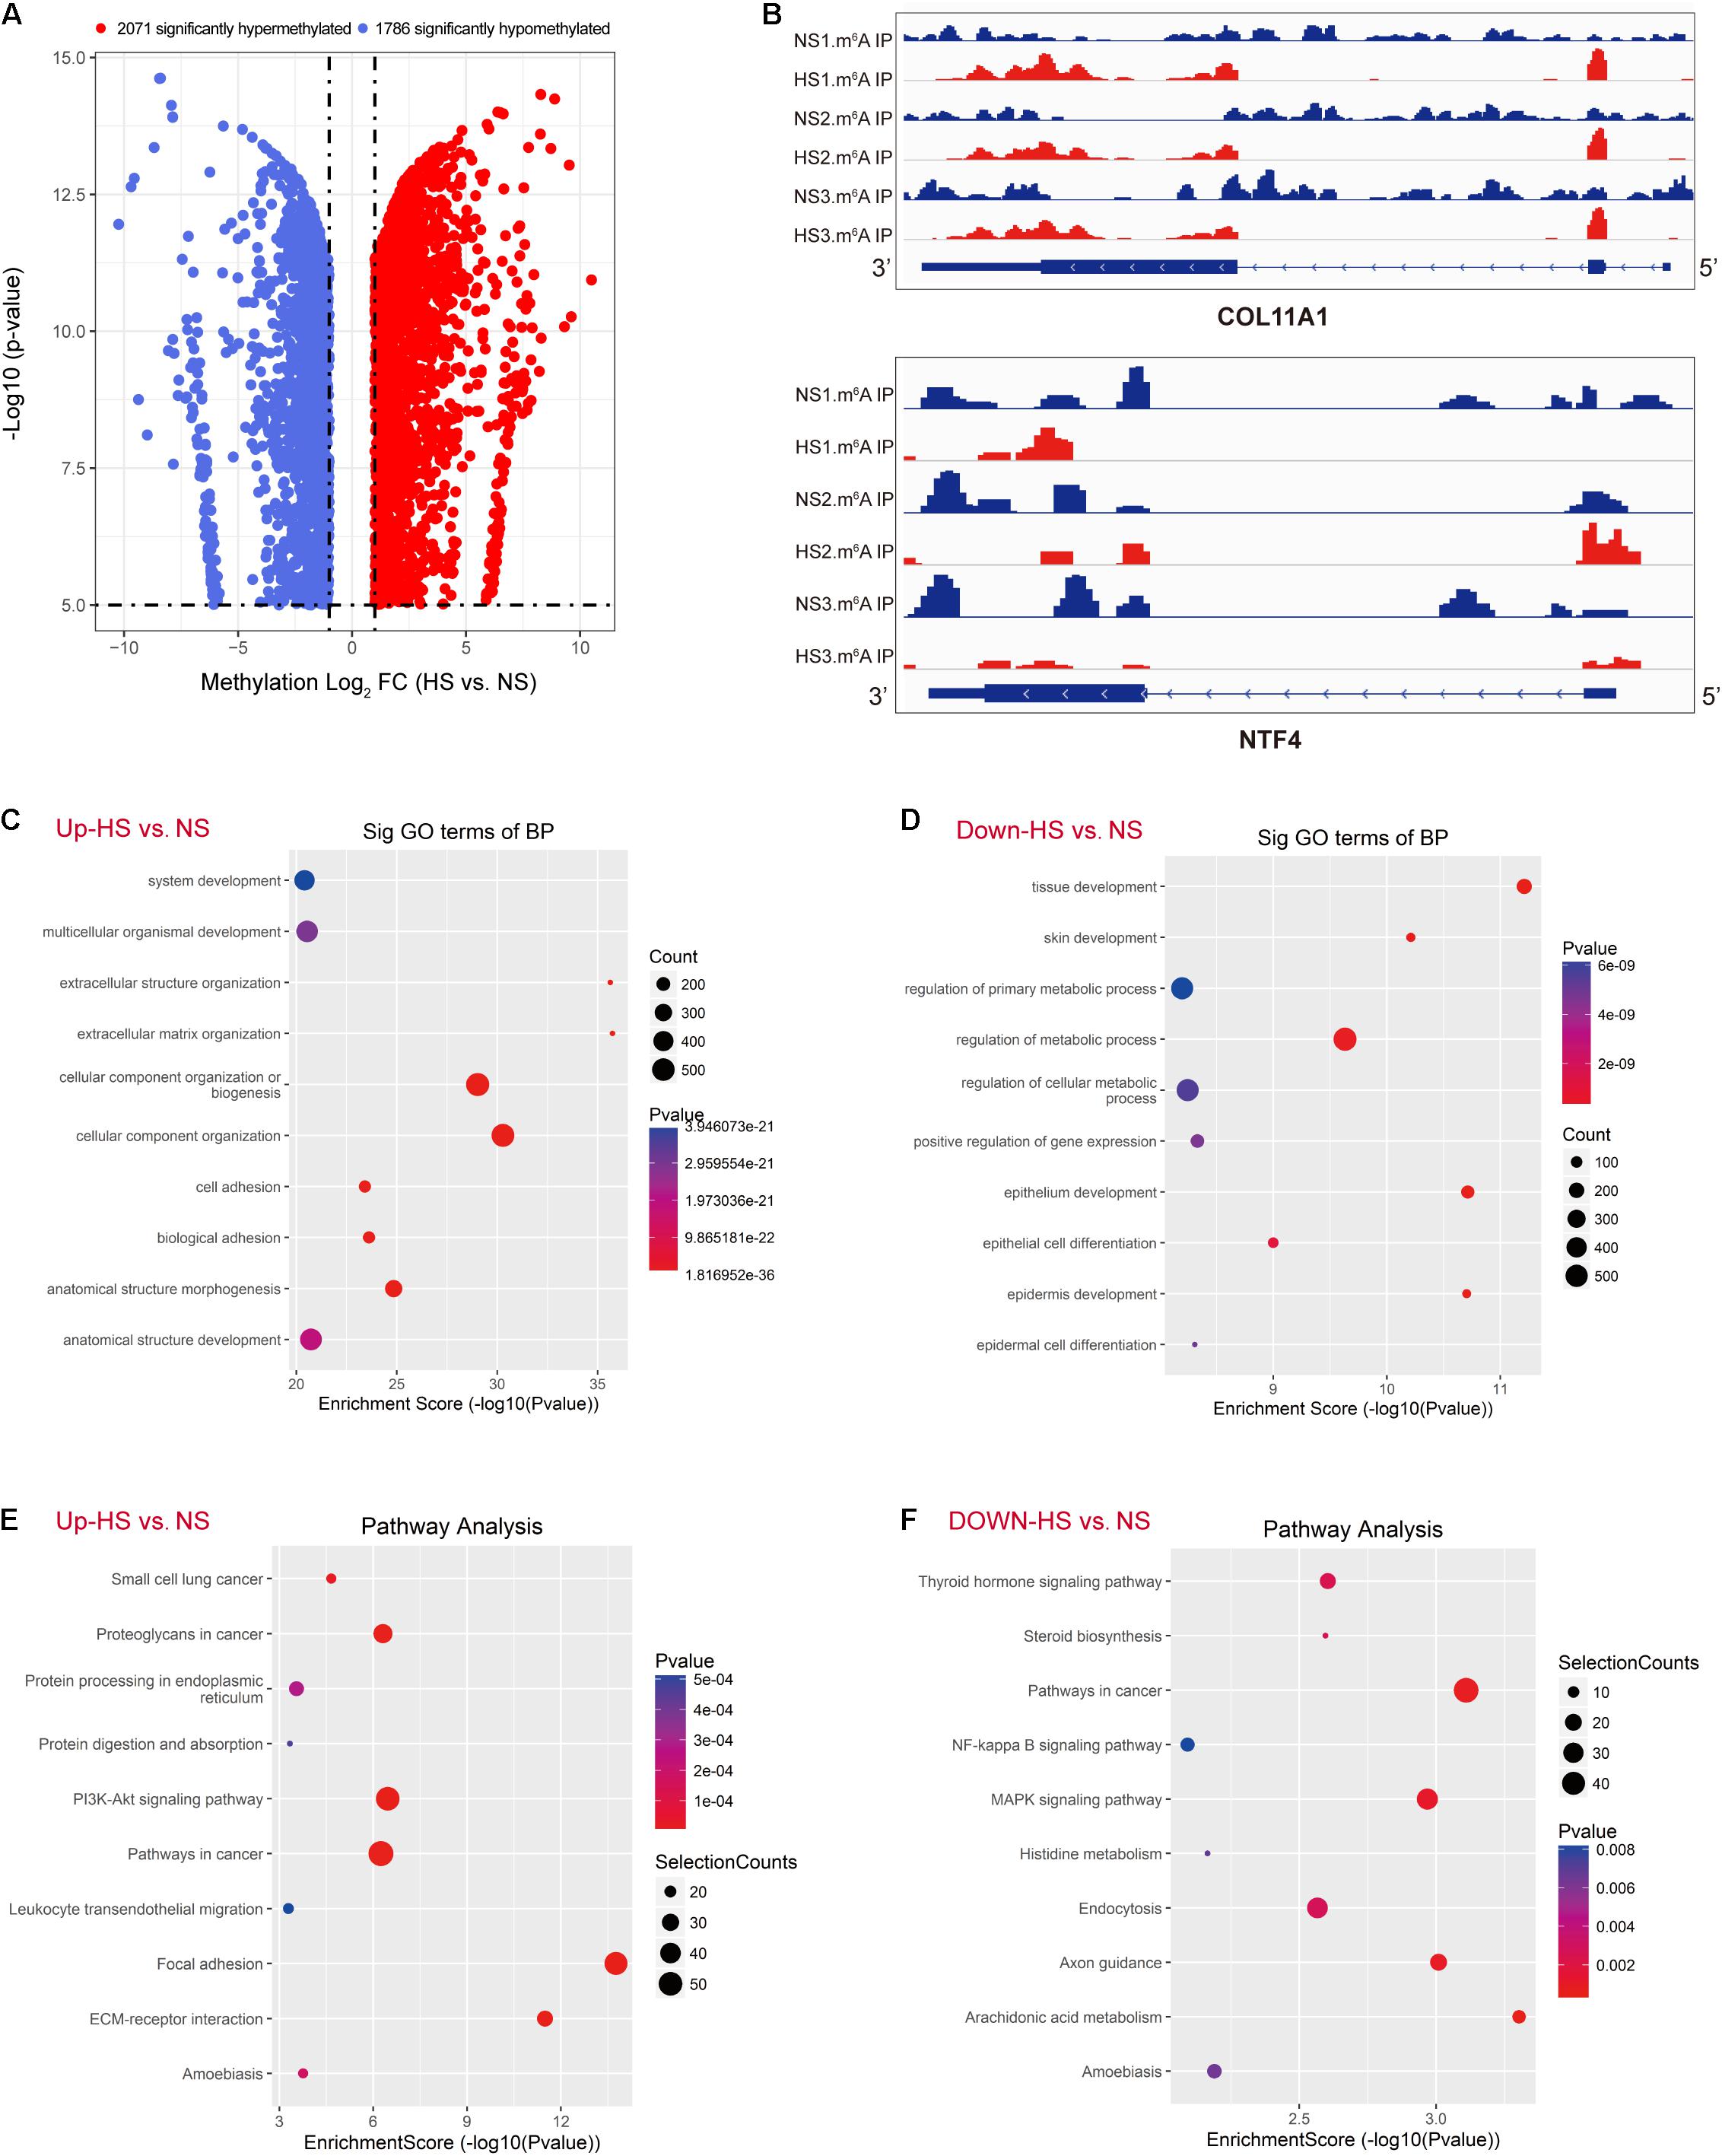
Figure 2. Global m6A modification changes in hypertrophic scar (HS) tissues compared with normal skin (NS) tissues. (A) Volcano plots displaying the distinct m6A peaks (fold change > 2, p < 0.05). (B) The m6A abundances in COL10A1 and NTF4 transcripts in NS and HS samples, as detected by m6A-seq. (C) Gene ontology (GO) analysis of biological process involved in up-methylated genes in HS samples conducted by top GO. (D) GO analysis of the biological process involved in down-methylated genes in HS samples conducted by top GO. (E) Gene set enrichment pathway analysis of transcripts with increased m6A modification in HS samples compared with NS samples by top GO. (F) Pathway analysis of transcripts with reduced m6A modification in HS samples compared with NS samples. HS, hypertrophic scar group; NS, normal skin group.
Identification of Differentially Expressed Genes in Hypertrophic Scar/Normal Skin by RNA-Seq
In the RNA-seq data set (m6A-seq input library), we found significant differences in the overall mRNA expression patterns between HS samples and adjacent NS. The results of the mRNA expression profile analysis showed that compared with the control group, 5,458 mRNA expressions were significantly altered in the HS group, of which 1,227 mRNA expressions were upregulated and 4,231 mRNA expressions were downregulated (fold change > 2, p < 0.05). The top 20 altered genes are listed in Table 4. Figures 3A,B shows scatter plots and hierarchical clustering of the RNA-seq data. The GO and KEGG pathways were analyzed for differentially expressed genes (DEGs). The results showed that abnormally upregulated genes in the HS/NS samples were related to collagen fibril organization (ontology: biological process Figure 3C), the endomembrane (ontology: Supplementary Figure 2A), and collagen binding (ontology: molecular function; Supplementary Figure 2C). Regulation is closely related. Abnormally downregulated genes were significantly associated with the positive regulation of muscle tissue development (ontology: biological process Figure 3D), cornified envelope (ontology: cellular component Supplementary Figure 2B), and binding (ontology: molecular function; Supplementary Figure 2D). It is of note that the KEGG pathway analysis showed that abnormally upregulated genes in HS/NS were closely associated with the P13K-Akt signaling pathway, focal adhesion, and ECM–receptor interaction (Figure 3E), while the abnormally downregulated genes in HS/NS were closely associated with the MAPK signaling and NF-kappa B signaling pathways (Figure 3F).
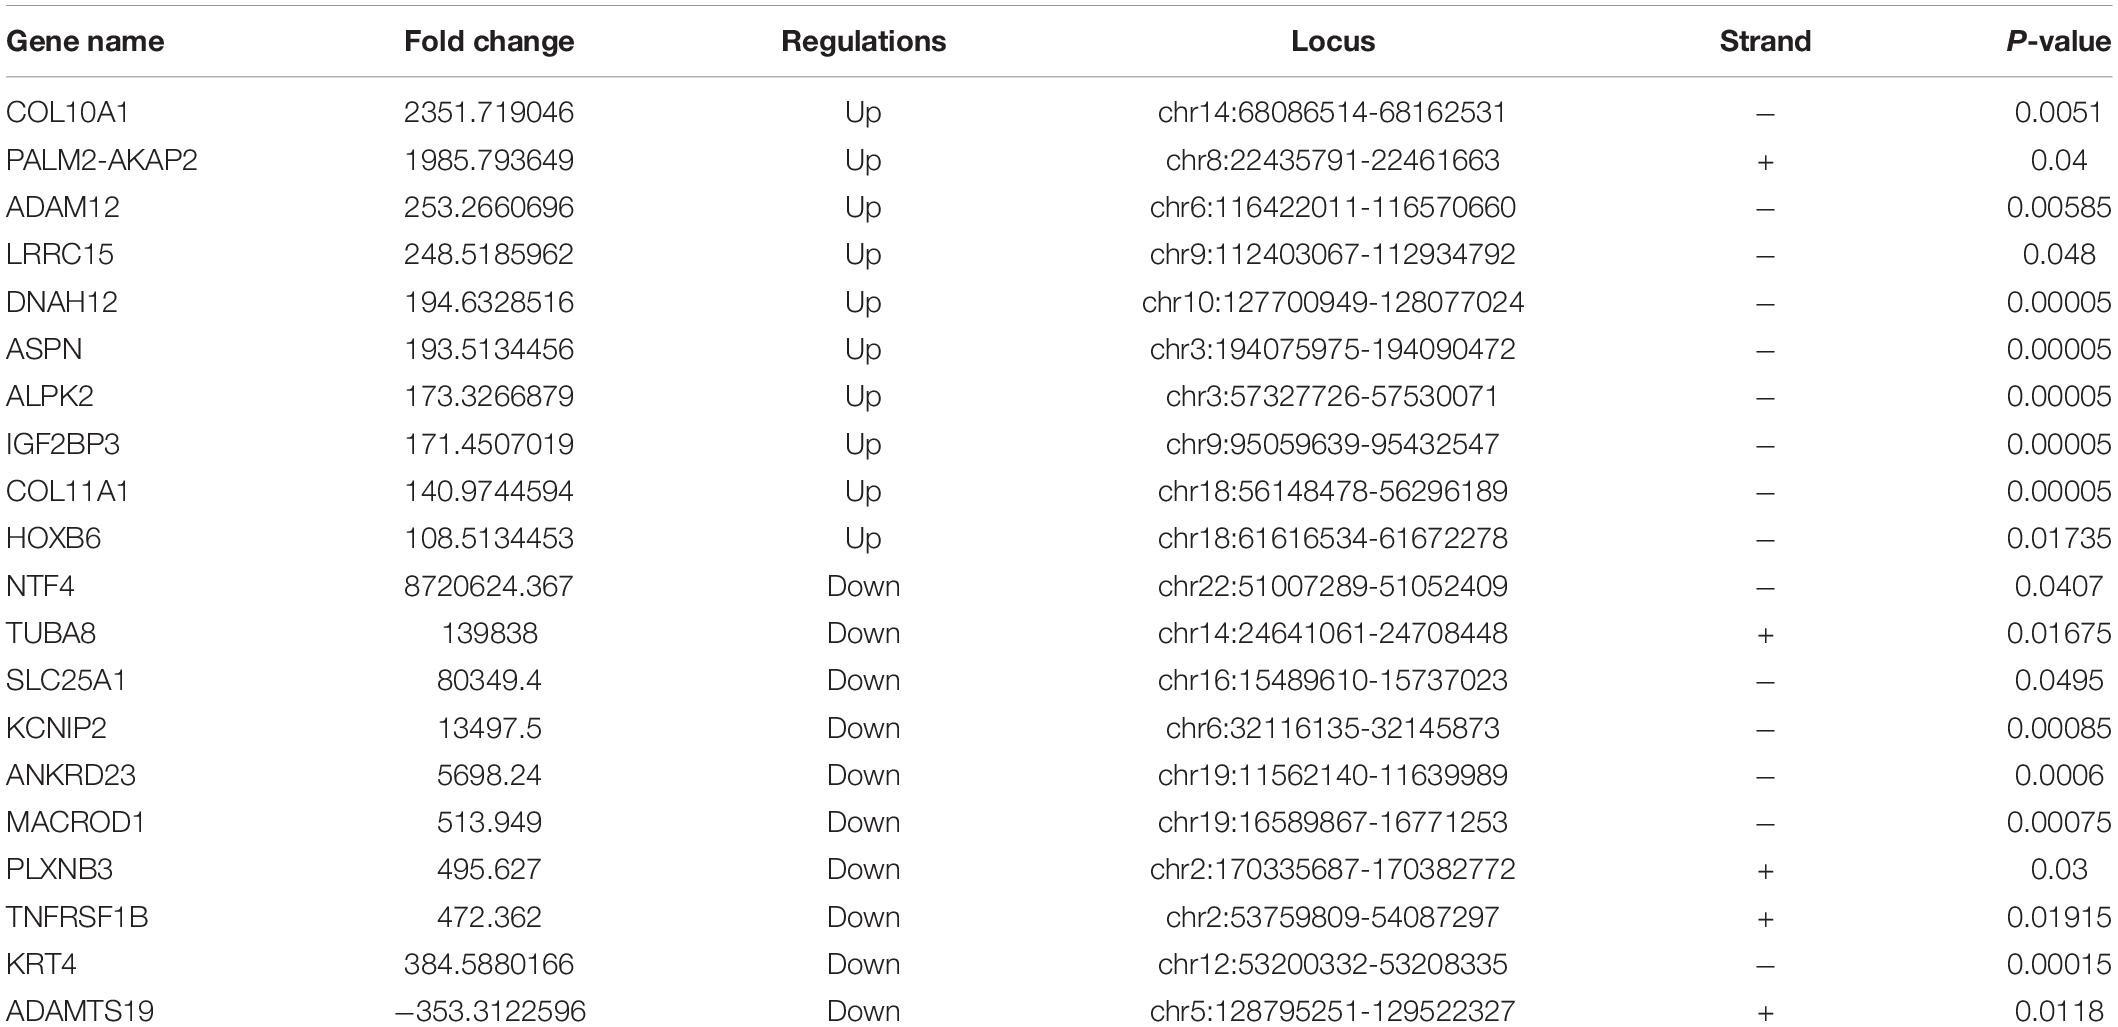
Table 4. The top 20 differently expressed genes (SC vs. NS).
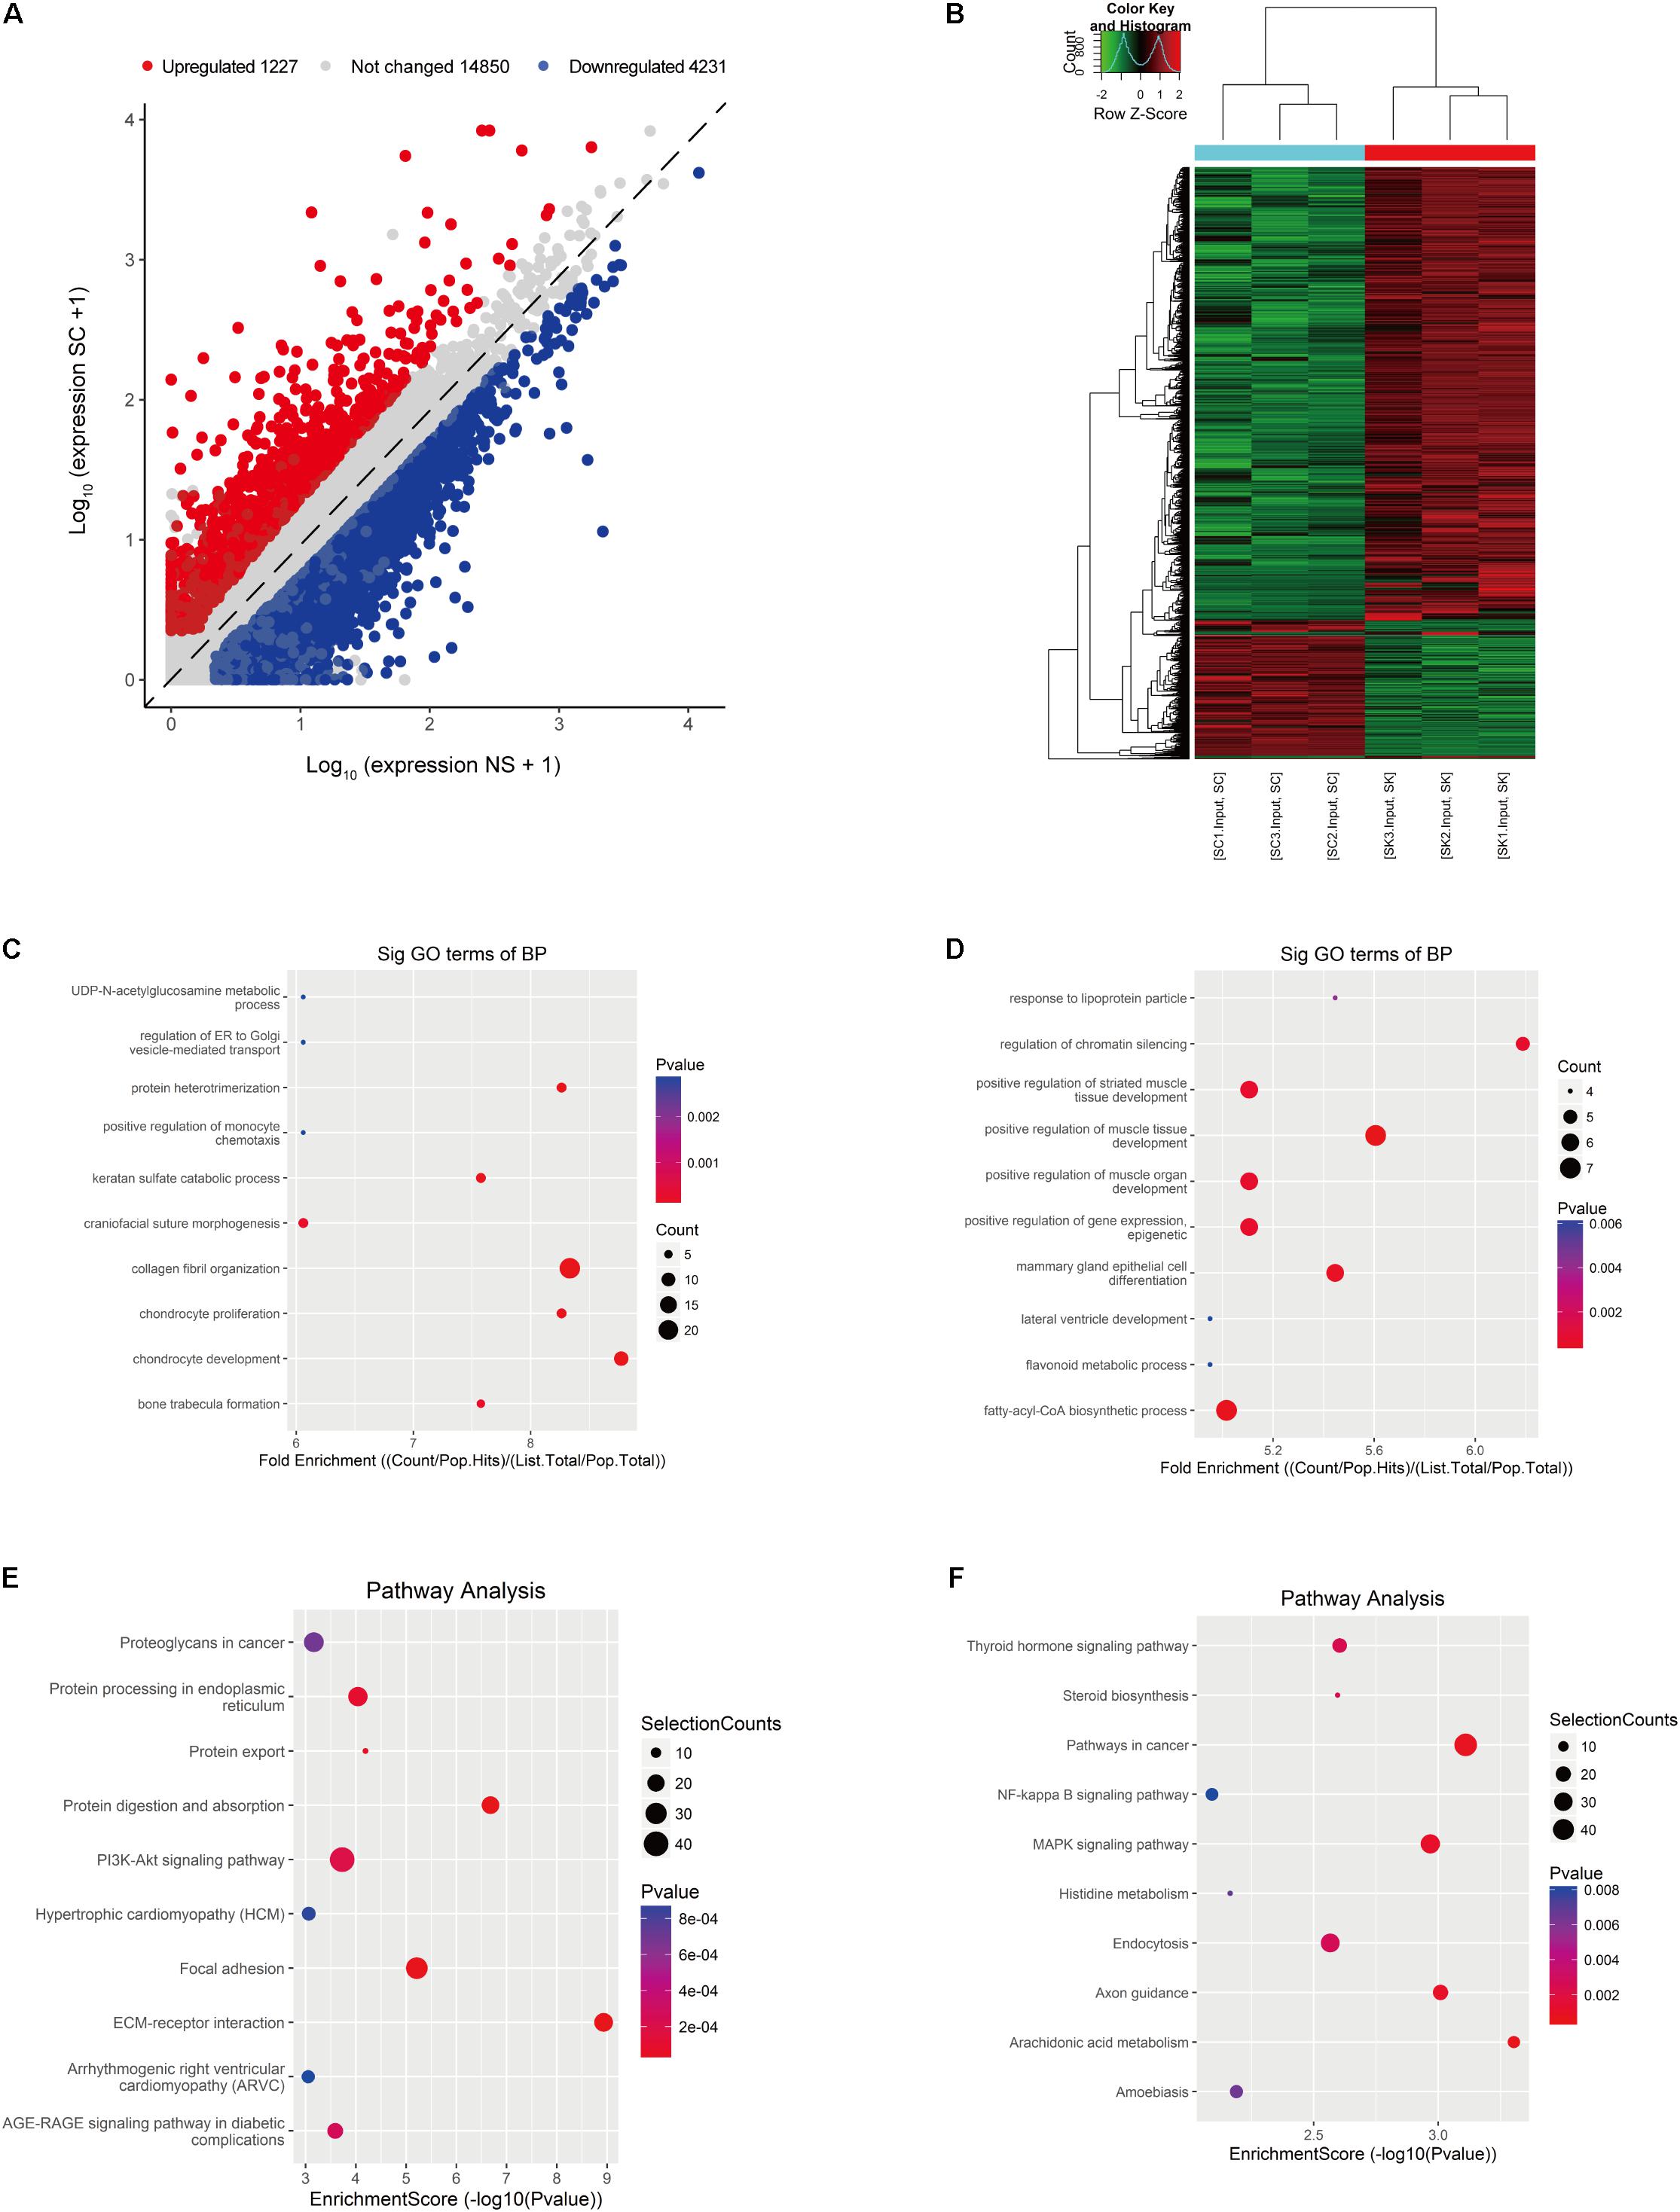
Figure 3. Identification of differentially expressed genes (DEGs) in HS by RNA-seq. (A) Scatter plot of the RNA-seq data. (B) Heat map of RNA-seq data of HS and NS samples. Rows: mRNAs; columns: normal skin group and hypertrophic scar samples. Red, black, and green indicate the upregulation, unchanged expression, and downregulation of mRNAs, respectively. (C) Gene ontology (GO) analysis of the biological process involved in upregulated genes in HS samples conducted by top GO. (D) GO analysis of the biological process involved in downregulated genes in HS samples conducted by top GO. (E) Gene set enrichment pathway analysis of transcripts with increased mRNA modification in HS samples compared with NS samples by top GO. (F) Pathway analysis of transcripts with reduced mRNA modification in HS samples compared with NS samples. HS, hypertrophic scar group; NS, normal skin group.
Conjoint Analysis of m6A-RNA Binding Protein Immunoprecipitation (MeRIP)-Seq and RNA-Seq Data of Hypertrophic Scar and Normal Skin
MeRIP-seq was used to detect DMGs between HS and NS (Figure 2A), while RNA-seq was used to detect DEGs between HS and NS (Figure 3A). Through the conjoint analysis of the DMGs and DEGS, all genes were mainly divided into four groups, including 984 hypermethylated and upregulated genes (hyper-up), 1,066 hypomethylated and downregulated genes (hypo-down), 43 hypermethylated but downregulated genes (hyper-down), and 12 hypomethylated but upregulated genes (hypo-up) (Figure 4A). Compared with the normal control, the genes with significant changes in m6A levels and mRNA transcription abundance in HS samples are listed in Table 5, and then hierarchical cluster analysis was performed on these genes (Figure 4B). It is of note that 96% (1,066/1,109) of downregulated mRNA transcripts were associated with m6A hypomethylation in the HS samples. In addition, the numbers of “hyper-up” and “hypo-down” genes were more than those of the “hyper-down” and “hypo-up” genes, with larger fold changes and smaller p-values. These results showed that m6A modification was positively correlated with mRNA expression in HS. In the conjoint analysis of DMGs and DEGS, we performed GO enrichment analysis on hyper-up and hypo-down genes. The “hyper-up” genes were associated with ECM organization, extracellular structure organization, and anatomical structure morphogenesis (ontology: biological process Figure 4C), while the “hypo-down” genes were related to tissue development, system development, and multicellular organization development (ontology: biological process Figure 4D). The enrichment analysis of cell components and molecular functions are presented in Supplementary Figure 3. Data visualization of the top four differently expressed genes (COL11A1, COL8A1, CYP1A1, and AR) containing differently methylated peaks are presented in Figures 4E–H. To further confirm the results of our m6A-seq data, we conducted gene-specific m6A qPCR assays for several hyper-methylated and hypo-methylated genes (COL11A1, COL8A1, and CYP1A1, AR) (Figure 5A). We observed changes in m6A levels consistent with the sequencing results in these four genes, which indicated the reliability of our transcriptome-wide m6A-seq data. In turn, the mRNA levels of the above genes were detected in three pairs of NS and HS samples (Figure 5B). These results showed that the trend for m6A methylation was similar and the mRNA expression was consistent with the sequencing results. Finally, the overall m6A level of NS and HS samples was measured using an m6A colorimetry kit. HS samples showed higher relative total m6A levels than NS samples (Figure 5C). This showed that the HS samples had a unique m6A modification pattern that was different from normal tissues, including the transcriptome range and gene-specific scale.
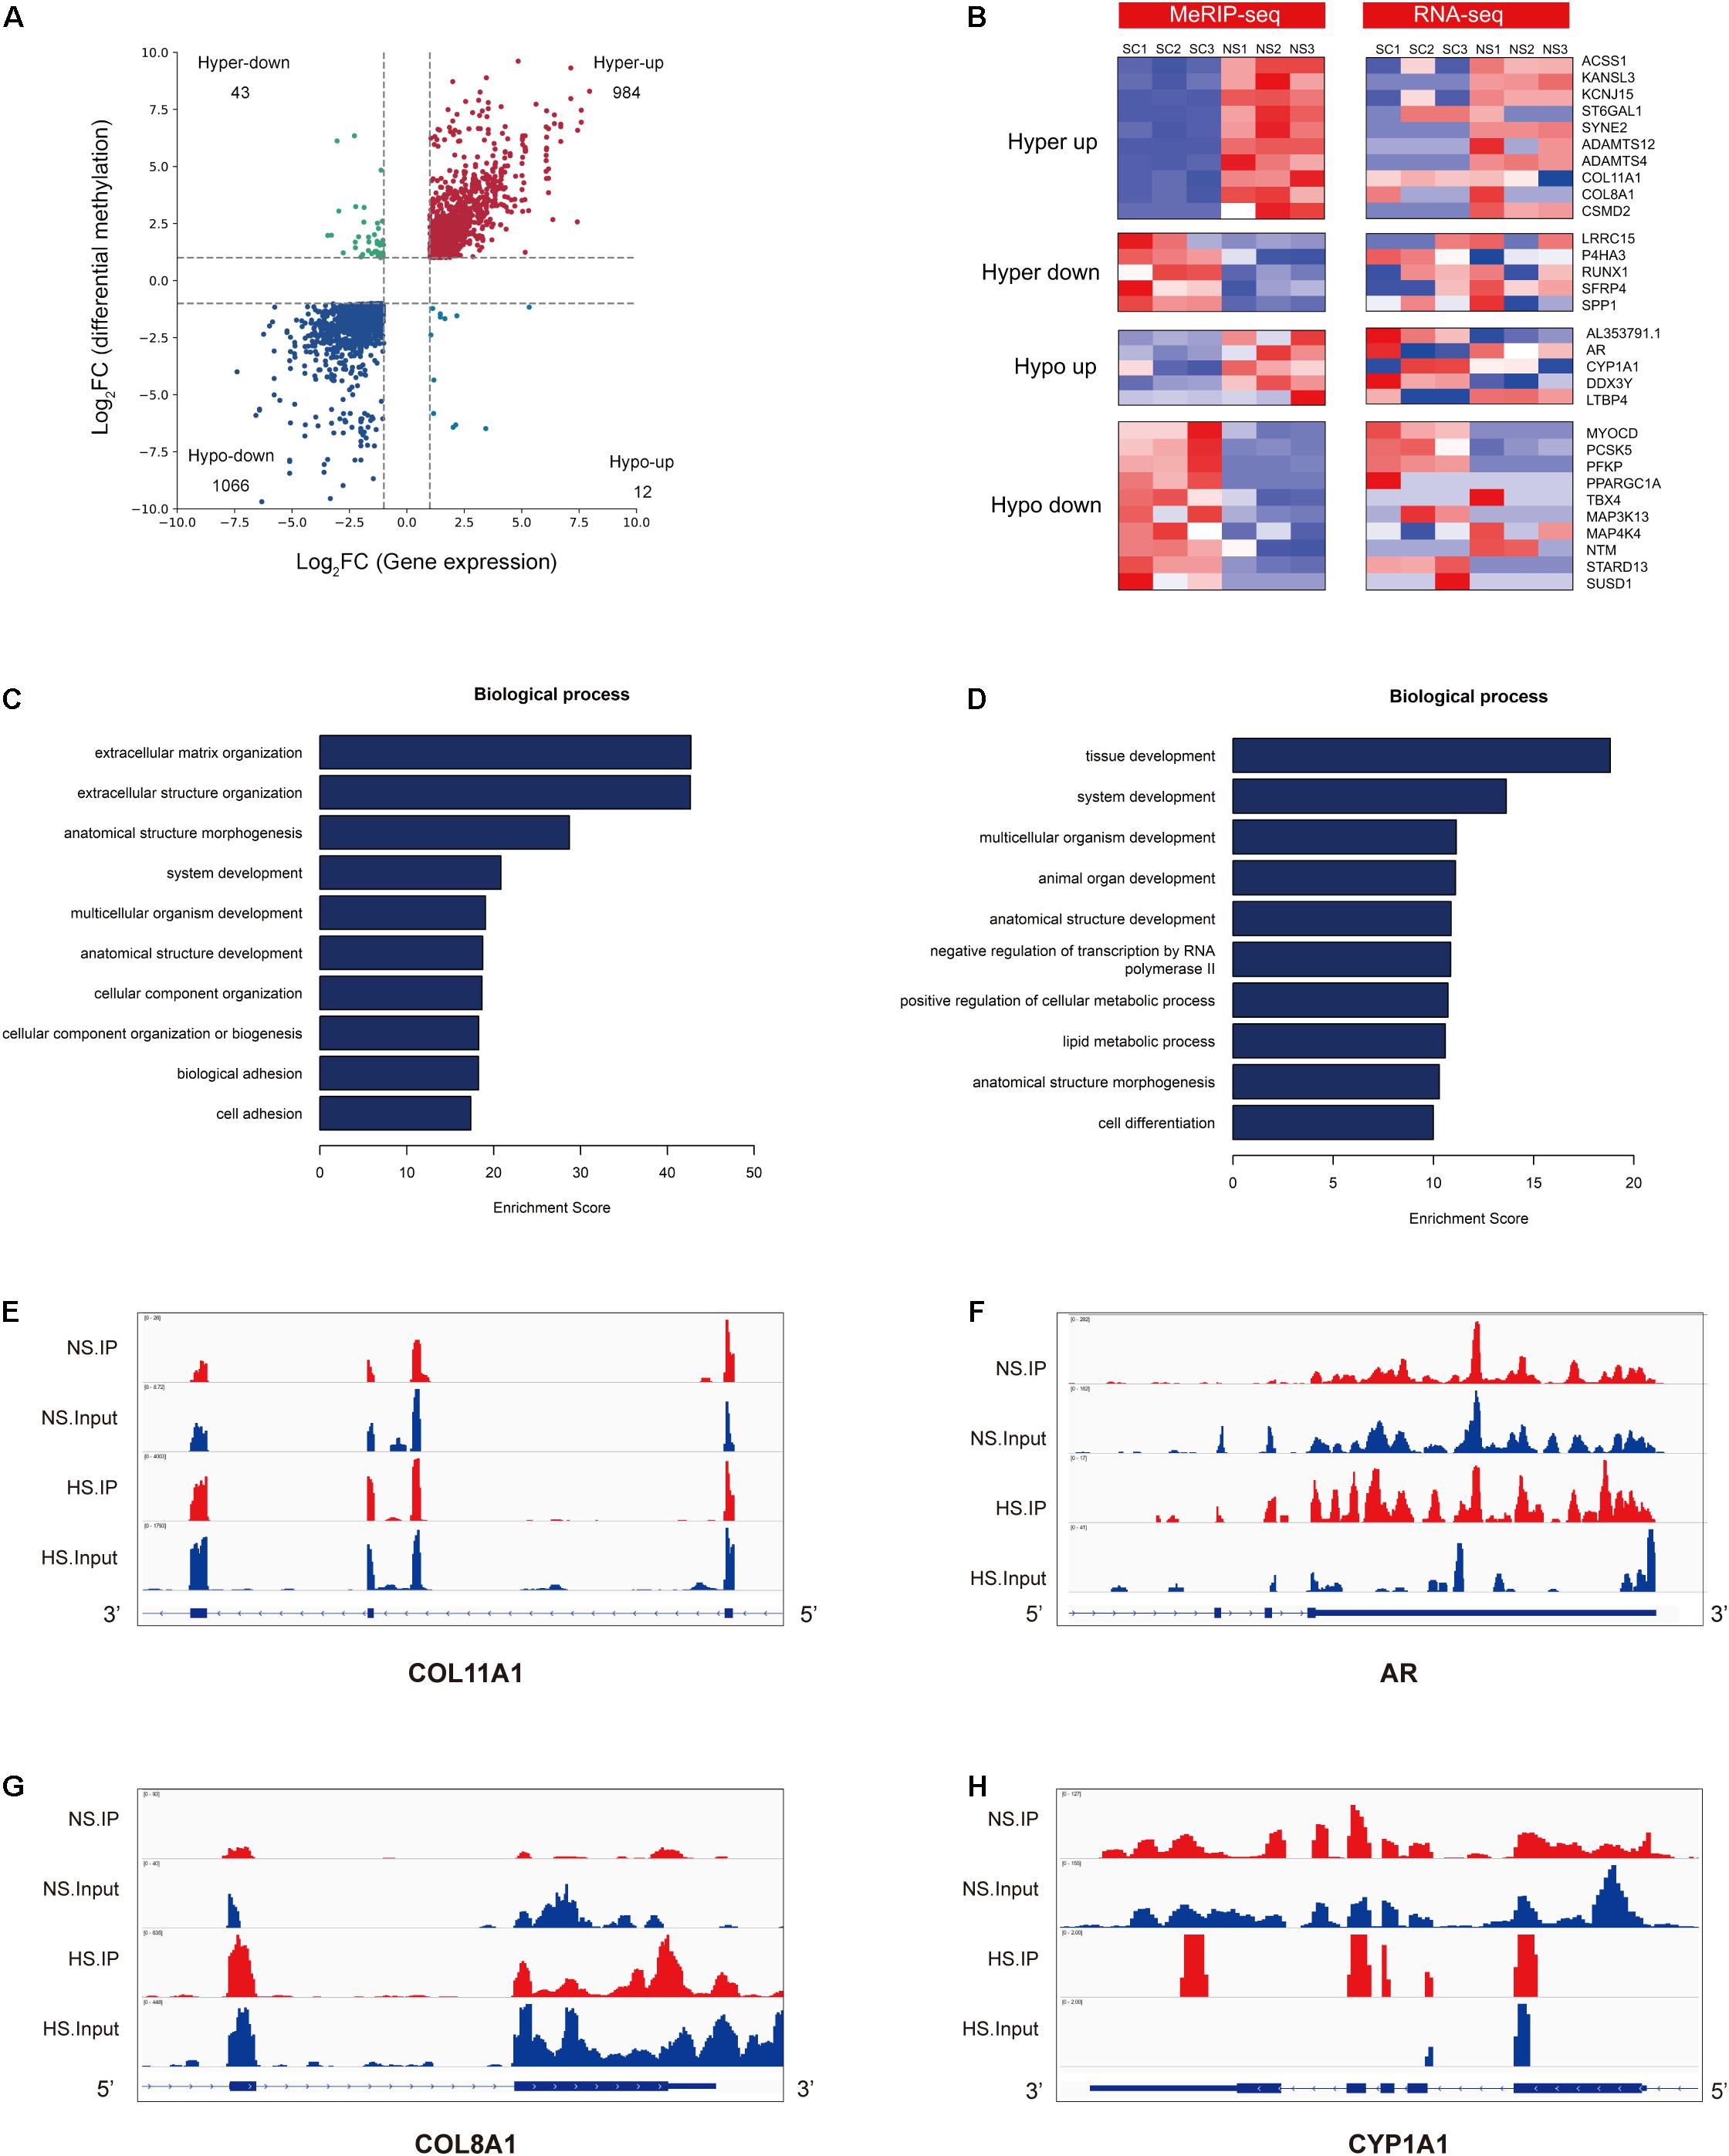
Figure 4. Conjoint analysis of m6A-RIP-seq and RNA-seq data. (A) Distribution of genes with a significant change in both m6A and mRNA levels in hypertrophic scar (HS) samples compared with normal skin (NS) tissues (fold change > 2, p < 0.05). (B) Heat map of “hyper-up,” “hyper-down,” “hypo-up,” and “hypo-down” genes represented in panel (A). (C) The top 10 gene ontology (GO) terms of the biological process for the “hyper-up” genes in HS compared with NS. (D) The top 10 GO terms of the biological process for the “hypo-down” genes in HS compared with NS. (E–H) Data visualization of the top four differently expressed genes containing differently methylated peaks in Table 5. (E) Data visualization of COL11A1 mRNA m6A modification in HS compared with NS. (F) Data visualization of AR mRNA m6A modification in HS compared with NS. (G) Data visualization of COL8A1 mRNA m6A modification in HS compared with NS. (H) Data visualization of CYP1A1 mRNA m6A modification in HS compared with NS.
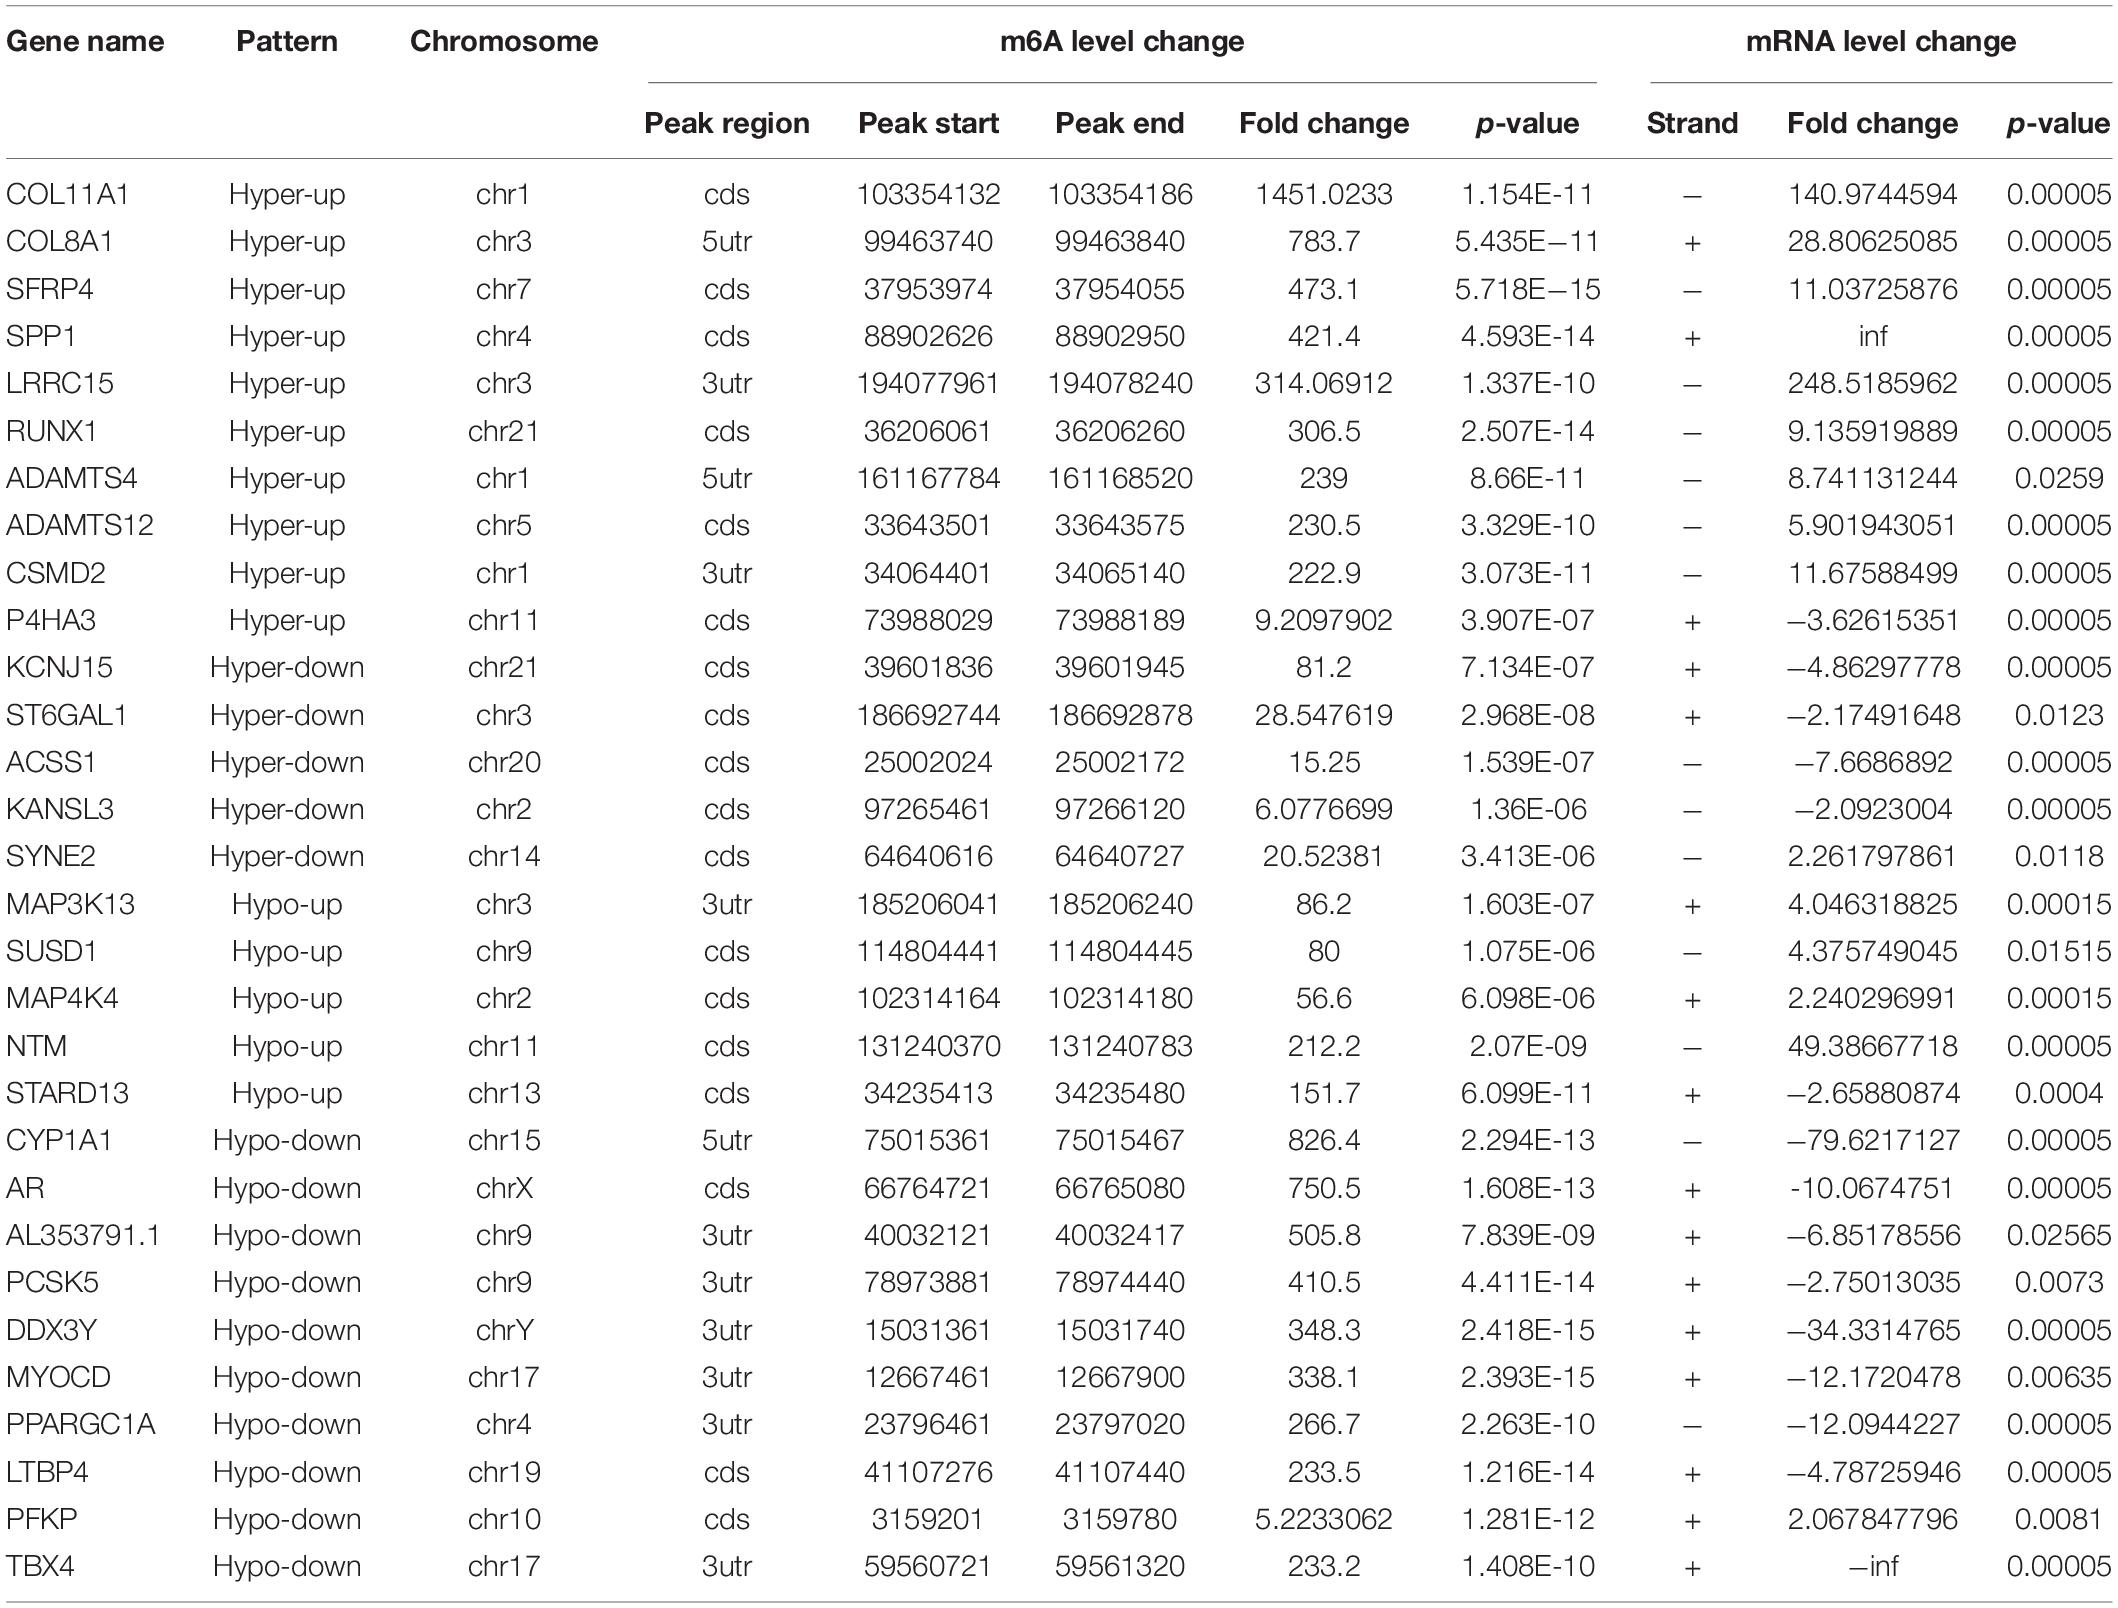
Table 5. Thirty genes that exhibit a significant change in both m6A and mRNA transcript abundance (SC vs. NS).
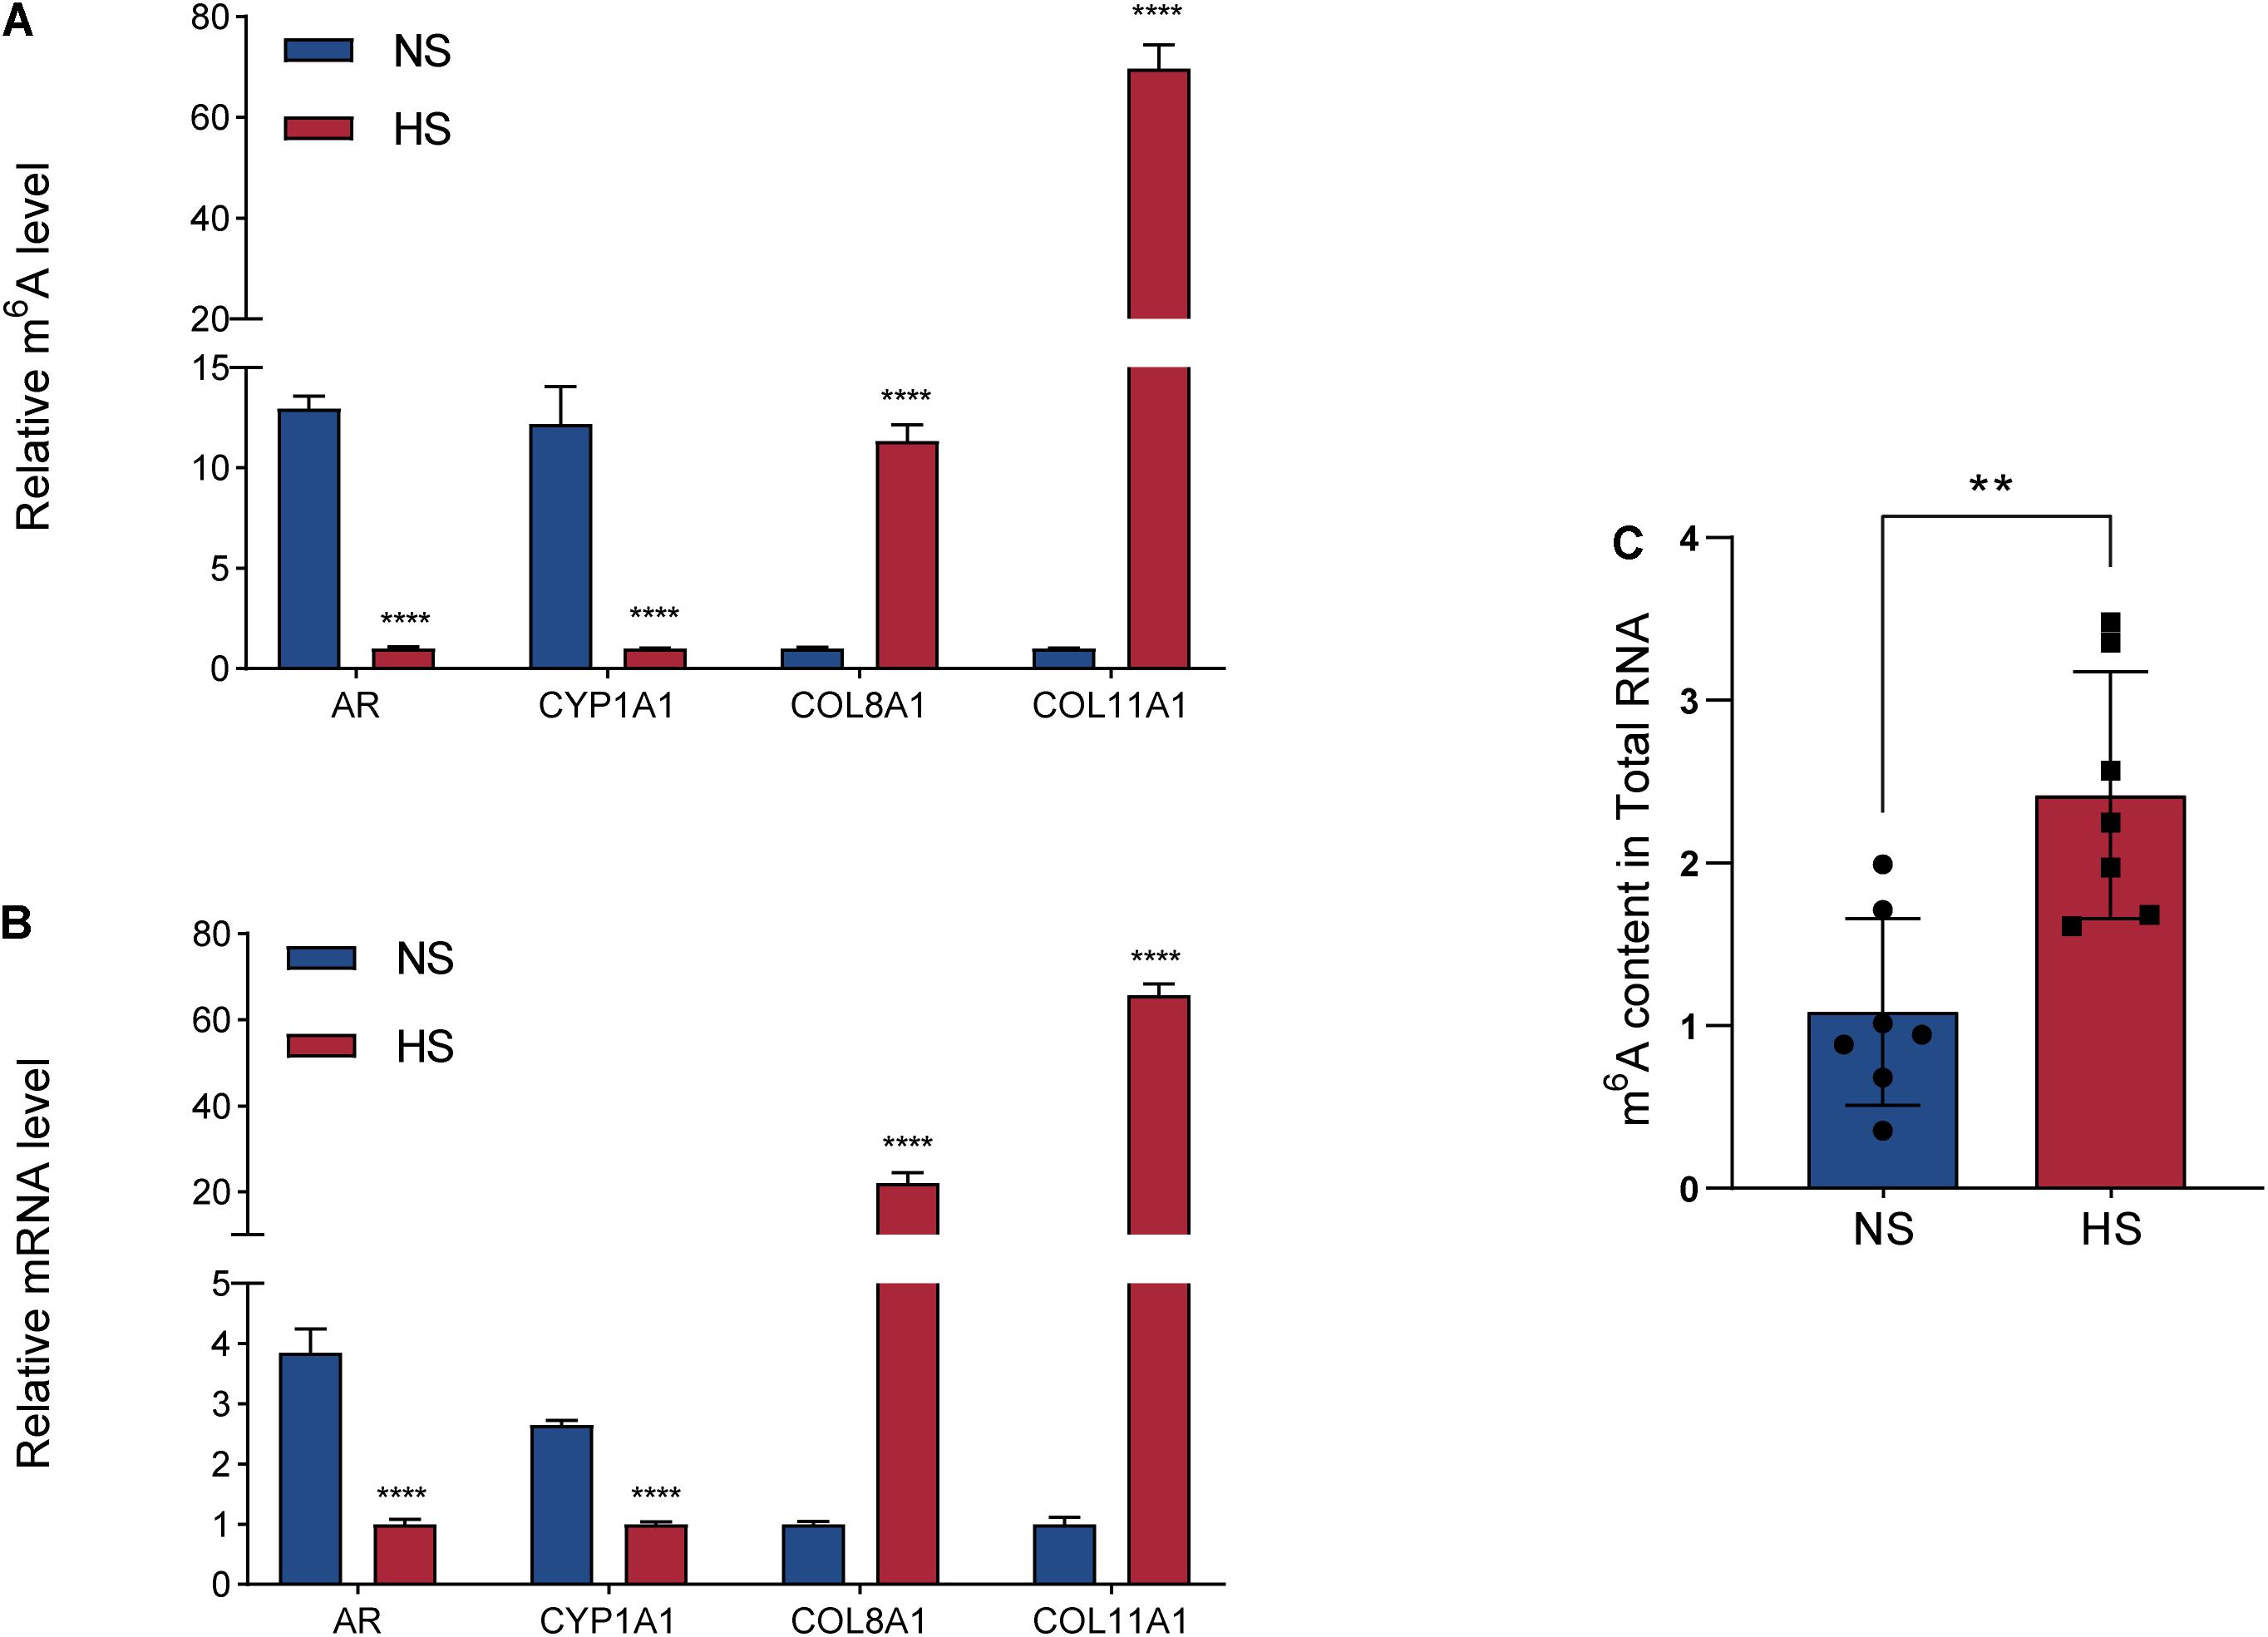
Figure 5. Gene-specific m6A qPCR assays and detection of global m6A levels. (A) Gene-specific m6A qPCR validation of m6A level changes of four representative hypermethylated or hypomethylated genes in the normal skin (NS) and hypertrophic scar (HS) groups. (B) Relative mRNA levels of four representative genes were measured by real-time PCR in the NS and HS groups. (C) m6A/A ratio of polyA-RNAs isolated from the NS and HS samples were determined using the m6A RNA Methylation Assay Kit. The bar shows the mean from n = 7 technical replicates. **P = 0.0030, ****P < 0.0001.
Discussion
Similar to DNA modification, there are a series of reversible modifications on RNA. m6A modification is one of the most common RNA modifications. The m6A modification targets and regulates the stability (Wang et al., 2014), localization (Wang et al., 2014), transport, and translation of mRNA after transcription (Wang et al., 2015), thereby affecting various biological processes, including embryonic development, stem cell self-renewal, DNA damage response, and primary miRNA processing (Wang et al., 2014; Weng et al., 2019; Liu et al., 2021). The epigenetic layer of this emerging role in HS has not yet been characterized. In this study, we showed the overall m6A modification pattern in HS samples and in adjacent NS tissues. Analysis found that the genes regulated through abnormal m6A RNA modification were closely associated with fibrosis-related pathways. In addition, we found that the m6A modification pattern in the HS samples was different from that of the normal control. A higher total m6A level and more than 6,956 m6A peaks were identified in the HS group. In addition, we performed GO and KEGG pathway analyses to infer the potential function of m6A-modified transcript changes. Finally, conjoint analysis of m6A-RIP-seq and RNA-seq data revealed that m6A-modified mRNA transcripts were hypermethylated or hypomethylated, and their expressions are significantly different. Based on the potential role of m6A modification in the pathogenesis of HS, reversing the changes in m6A levels may be an attractive new treatment strategy. The combined analysis of our m6A-seq and mRNA-seq data revealed 30 genes in the HS group that had different methylated m6A sites and changes in mRNA abundance compared with the NS group (fold change > 2, p < 0.05, Table 5). These genes may play a key role in the occurrence and development of hypertrophic scar, thus these are of interest for further investigation. Through GO enrichment analysis, COL11A1, COL8A1, CYP1A1, and AR were shown to be associated with ECM organization and tissue development. To study polymorphisms of genes encoding enzymes in alcohol-related diseases, an investigation involving 120 Brazilian alcoholics and 221 controls with similar ethnic backgrounds was performed. The results showed that subjects with an m2/m2 CYP1A1 genotype were more likely to have alcoholic liver cirrhosis (Burim et al., 2004). It has been reported that CYP1A1 polymorphism may increase the risk for oral submucosal fibrosis (Chaudhuri et al., 2013). Excessive collagen accumulation is frequently used to assess fibrosis development to determine the collagen gene associated with conjunctival fibrosis after glaucoma filtering surgery (GFS). The study used a mouse model of GFS to identify collagen transcripts through RNA-seq that were upregulated during the fibrotic stage of wound healing. The most increased collagen transcripts were encoded by Col8A1, Col11A1, and Col8A2. They increased 67, 54, and 18 times, respectively, in the fibrosis stage (Seet et al., 2017). Therefore, further functional studies may help to clarify the molecular mechanisms of the aforementioned genes in the occurrence and development of HS. In addition, regulating m6A modification may become a strategy for the treatment of human diseases in the future.
In the present study, when depicted on a global scale, m6A modification and mRNA expression in HS samples tended to have a positive correlation (Figure 4A). This result was further confirmed by gene-specific m6A qPCR and mRNA qPCR analyses (Figures 5A,B). The results of our study proved for the first time the association between m6A methylation and HS pathogenesis, and its potential clinical significance for HS patients. In addition, it was reported that m6A modification affected the stability, localization, transportation, and translation of the target mRNA. The sample size in this study is limited. Follow-up studies require a larger sample size to study the reasons for the overall m6A change in HS. The specific effect of m6A methylation on gene expression largely depends on the modification of methylases, demethylases, and methylation recognition enzymes (Fu et al., 2014; Deng et al., 2018). In addition, functional experiments are needed to further confirm the regulatory role of m6A RNA modifications upon gene expression in HS. To further confirm the regulatory effect of m6A RNA modification on gene expression in HS, knocking-out or overexpressing the key enzymes of m6A modification may provide a good strategy for studying the cellular response mediated by m6A methylation.
Conclusion
This study presented the first m6A full transcriptome map of human HS. It provided a potential link between abnormal m6A RNA modification and fibrosis-related gene expression. We hope this may provide a starting point to investigate the features of m6A and may offer some guidance for further research on m6A modification in HS.
Data Availability Statement
The original contributions presented in the study are publicly available. This data can be found here: Gene Expression Omnibus GSE181540 at: https://www.ncbi.nlm.nih.gov/geo/query/acc.cgi?acc=GSE181540.
Ethics Statement
The studies involving human participants were reviewed and approved by The Affiliated Hospital of Jiangnan University. The patients/participants provided their written informed consent to participate in this study.
Author Contributions
F-LY and S-YL designed and supervised the whole study. S-YL performed the experiments. J-JW and Z-HC provided the statistical analysis and wrote the article. D-YG, K-WZ, M-LZ, Y-YT, and Y-YL collected the samples and clinical data, and revised the article. F-LY gave final approval of the version to be published. All authors contributed to the article and approved the submitted version.
Funding
Funding for this study was provided by the Natural Science Foundation of China (81770876) and the Natural Science Foundation of Jiangsu Province (BK20191141).
Conflict of Interest
The authors declare that the research was conducted in the absence of any commercial or financial relationships that could be construed as a potential conflict of interest.
Publisher’s Note
All claims expressed in this article are solely those of the authors and do not necessarily represent those of their affiliated organizations, or those of the publisher, the editors and the reviewers. Any product that may be evaluated in this article, or claim that may be made by its manufacturer, is not guaranteed or endorsed by the publisher.
Acknowledgments
We thank the patients who contributed to this study. We also thank Cloudseq Biotech, Inc. (Shanghai, China) for the m6A meRIP sequencing service and bioinformatics support. We also thank International Science Editing (http://www.internationalscienceediting.com) for editing this article.
Supplementary Material
The Supplementary Material for this article can be found online at: https://www.frontiersin.org/articles/10.3389/fcell.2021.748703/full#supplementary-material
Supplementary Figure 1 | Gene ontology enrichment of altered m6A transcripts. (A) Gene ontology (GO) analysis of the cellular component involved in up-methylated genes in HS samples conducted by top GO. (B) GO analysis of the cellular component involved in down-methylated genes in HS samples conducted by top GO. (C) GO analysis of the molecular function involved in up-methylated genes in HS samples conducted by top GO. (D) GO analysis of the molecular function involved in down-methylated genes in HS samples conducted by top GO.
Supplementary Figure 2 | Gene ontology enrichment of altered mRNA transcripts. (A) Gene ontology (GO) analysis of the cellular component involved in upregulated genes in HS samples conducted by top GO. (B) GO analysis of the cellular component involved in downregulated genes in HS samples conducted by top GO. (C) GO analysis of the molecular function involved in upregulated genes in HS samples conducted by top GO. (D) GO analysis of the molecular function involved in downregulated genes in HS samples conducted by top GO. HS, hypertrophic scar.
Supplementary Figure 3 | Gene ontology enrichment of altered m6A and mRNA transcripts in hypertrophic scar samples compared with normal skin tissues. (A) Gene ontology analysis of the cellular component involved in “hyper-up” genes in HS samples conducted by top GO. (B) GO analysis of the cellular component involved in “hypo-down” genes in HS samples conducted by top GO. (C) GO analysis of the molecular function involved in “hyper-up” genes in HS samples conducted by top GO. (D) GO analysis of the molecular function involved in “hypo-down” genes in HS samples conducted by top GO. HS, hypertrophic scar.
Footnotes
References
Bijlard, E., Kouwenberg, C. A., Timman, R., Hovius, S. E., Busschbach, J. J., and Mureau, M. A. (2017). Burden of keloid disease: a cross-sectional health-related quality of life assessment. Acta Derm. Venereol. 97, 225–229. doi: 10.2340/00015555-2498
Burim, R. V., Canalle, R., Martinelli Ade, L., and Takahashi, C. S. (2004). Polymorphisms in glutathione S-transferases Gstm1, Gstt1 and Gstp1 and cytochromes P450 Cyp2e1 and Cyp1a1 and susceptibility to cirrhosis or pancreatitis in alcoholics. Mutagenesis 19, 291–298. doi: 10.1093/Mutage/Geh034
Chaudhuri, S. R., Mukherjee, S., Paul, R. R., Haldar, A., and Chaudhuri, K. (2013). Cyp1ai and Cyp2e1 gene polymorphisms may increase susceptibility to oral submucous fibrosis among betel quid chewers of Eastern India. Gene 513, 268–271. doi: 10.1016/J.Gene.2012.10.043
Deng, X., Su, R., Weng, H., Huang, H., Li, Z., and Chen, J. (2018). Rna N(6)-methyladenosine modification in cancers: current status and perspectives. Cell Res. 28, 507–517. doi: 10.1038/S41422-018-0034-6
Dominissini, D., Moshitch-Moshkovitz, S., Schwartz, S., Salmon-Divon, M., Ungar, L., Osenberg, S., et al. (2012). Topology of the human and mouse M6a Rna methylomes revealed by M6a-Seq. Nature 485, 201–206. doi: 10.1038/Nature11112
Eming, S. A., Martin, P., and Tomic-Canic, M. (2014). Wound repair and regeneration: mechanisms, signaling, and translation. Sci. Transl. Med. 6:265sr6. doi: 10.1126/Scitranslmed.3009337
Fu, Y., Dominissini, D., Rechavi, G., and He, C. (2014). Gene expression regulation mediated through reversible M6A Rna methylation. Nat. Rev. Genet. 15, 293–306. doi: 10.1038/Nrg3724
Gurtner, G. C., Werner, S., Barrandon, Y., and Longaker, M. T. (2008). Wound repair and regeneration. Nature 453, 314–321. doi: 10.1038/Nature07039
Hardy, T., and Mann, D. A. (2016). Epigenetics in liver disease: from biology to therapeutics. Gut 65, 1895–1905. doi: 10.1136/Gutjnl-2015-311292
Heinz, S., Benner, C., Spann, N., Bertolino, E., Lin, Y. C., Laslo, P., et al. (2010). Simple combinations of lineage-determining transcription factors prime Cis-regulatory elements required for macrophage and B cell identities. Mol. Cell 38, 576–589. doi: 10.1016/J.Molcel.2010.05.004
Jaloux, C., Bertrand, B., Degardin, N., Casanova, D., Kerfant, N., and Philandrianos, C. (2017). [Keloid scars (Part II): treatment and prevention]. Ann. Chir. Plast. Esthét. 62, 87–96. doi: 10.1016/J.Anplas.2016.04.006
Lee, J., Kim, Y., Friso, S., and Choi, S. W. (2017). Epigenetics in non-alcoholic fatty liver disease. Mol. Aspects Med. 54, 78–88. doi: 10.1016/J.Mam.2016.11.008
Lee, S. S., Yosipovitch, G., Chan, Y. H., and Goh, C. L. (2004). Pruritus, pain, and small nerve fiber function in keloids: a controlled study. J. Am. Acad. Dermatol. 51, 1002–1006. doi: 10.1016/J.Jaad.2004.07.054
Li, T., Hu, P. S., Zuo, Z., Lin, J. F., Li, X., Wu, Q. N., et al. (2019). Mettl3 facilitates tumor progression via an M(6)A-Igf2bp2-dependent mechanism in colorectal carcinoma. Mol. Cancer 18:112. doi: 10.1186/S12943-019-1038-7
Liu, X., Wang, H., Zhao, X., Luo, Q., Wang, Q., Tan, K., et al. (2021). Arginine methylation of mettl14 promotes Rna N(6)-methyladenosine modification and endoderm differentiation of mouse embryonic stem cells. Nat. Commun. 12:3780. doi: 10.1038/S41467-021-24035-6
Mann, J., and Mann, D. A. (2013). Epigenetic regulation of wound healing and fibrosis. Curr. Opin. Rheumatol. 25, 101–107. doi: 10.1097/Bor.0b013e32835b13e1
Meyer, K. D., Saletore, Y., Zumbo, P., Elemento, O., Mason, C. E., and Jaffrey, S. R. (2012). Comprehensive analysis of Mrna methylation reveals enrichment in 3′ Utrs and near stop codons. Cell 149, 1635–1646. doi: 10.1016/J.Cell.2012.05.003
Noda, S., Asano, Y., Nishimura, S., Taniguchi, T., Fujiu, K., Manabe, I., et al. (2014). Simultaneous downregulation Of Klf5 and Fli1 Is a key feature underlying systemic sclerosis. Nat. Commun. 5:5797. doi: 10.1038/Ncomms6797
Oda, Y., Matsumoto, Y., Harimaya, K., Iwamoto, Y., and Tsuneyoshi, M. (2000). Establishment of new multidrug-resistant human osteosarcoma cell lines. Oncol. Rep. 7, 859–866. doi: 10.3892/Or.7.4.859
Seet, L. F., Toh, L. Z., Chu, S., Finger, S. N., Chua, J., and Wong, T. T. (2017). Upregulation of distinct collagen transcripts in post-surgery scar tissue: a study of conjunctival fibrosis. Dis. Models Mech. 10, 751–760. doi: 10.1242/Dmm.028555
Shin, J. Y., Beckett, J. D., Bagirzadeh, R., Creamer, T. J., Shah, A. A., Mcmahan, Z., et al. (2019). Epigenetic activation and memory at a Tgfb2 enhancer in systemic sclerosis. Sci. Transl. Med. 11:eaaw0790. doi: 10.1126/Scitranslmed.Aaw0790
Thorvaldsdóttir, H., Robinson, J. T., and Mesirov, J. P. (2013). Integrative genomics viewer (Igv): high-performance genomics data visualization and exploration. Brief. Bioinform. 14, 178–192. doi: 10.1093/Bib/Bbs017
Wang, X., Lu, Z., Gomez, A., Hon, G. C., Yue, Y., Han, D., et al. (2014). N6-methyladenosine-dependent regulation of messenger Rna stability. Nature 505, 117–120. doi: 10.1038/Nature12730
Wang, X., Zhao, B. S., Roundtree, I. A., Lu, Z., Han, D., Ma, H., et al. (2015). N(6)-methyladenosine modulates messenger Rna translation efficiency. Cell 161, 1388–1399. doi: 10.1016/J.Cell.2015.05.014
Wei, C. M., Gershowitz, A., and Moss, B. (1975). Methylated nucleotides block 5′ terminus of hela cell messenger Rna. Cell 4, 379–386. doi: 10.1016/0092-8674(75)90158-0
Weng, H., Huang, H., and Chen, J. (2019). Rna N (6)-methyladenosine modification in normal and malignant hematopoiesis. Adv. Exp. Med. Biol. 1143, 75–93. doi: 10.1007/978-981-13-7342-8_4
Xi, L., Carroll, T., Matos, I., Luo, J. D., Polak, L., Pasolli, H. A., et al. (2020). M6a Rna methylation impacts fate choices during skin morphogenesis. Elife 9:e56980. doi: 10.7554/Elife.56980
Zeybel, M., Luli, S., Sabater, L., Hardy, T., Oakley, F., Leslie, J., et al. (2017). A proof-of-concept for epigenetic therapy of tissue fibrosis: inhibition of liver fibrosis progression by 3-deazaneplanocin A. Mol. Ther. 25, 218–231. doi: 10.1016/J.Ymthe.2016.10.004
Zhang, D., Li, B., and Zhao, M. (2021). Therapeutic strategies by regulating interleukin family to suppress inflammation in hypertrophic scar and keloid. Front. Pharmacol. 12:667763. doi: 10.3389/Fphar.2021.667763
Zhang, S., Zhao, B. S., Zhou, A., Lin, K., Zheng, S., Lu, Z., et al. (2017). M(6)A demethylase Alkbh5 maintains tumorigenicity of glioblastoma stem-like cells by sustaining foxm1 expression and cell proliferation program. Cancer Cell 31, 591–606.e6. doi: 10.1016/J.Ccell.2017.02.013
Zhang, Y., Liu, T., Meyer, C. A., Eeckhoute, J., Johnson, D. S., Bernstein, B. E., et al. (2008). Model-based analysis of chip-seq (Macs). Genome Biol. 9:R137. doi: 10.1186/Gb-2008-9-9-R137
Zhu, G., Cai, J., Zhang, J., Zhao, Y., and Xu, B. (2007). Abnormal nuclear factor (Nf)-Kappab signal pathway and aspirin inhibits tumor necrosis factor alpha-induced Nf-Kappab activation in keloid fibroblasts. Dermatol. Surg. 33, 697–708. doi: 10.1111/J.1524-4725.2007.33146.X
Zhu, Z., Hou, Q., Li, M., and Fu, X. (2020). Molecular mechanism of myofibroblast formation and strategies for clinical drugs treatments in hypertrophic scars. J. Cell. Physiol. 235, 4109–4119. doi: 10.1002/Jcp.29302
Keywords: hypertrophic scar, m6A sequencing, modification patterns, N6-methyladenosine, MeRIP-seq
Citation: Liu S-Y, Wu J-J, Chen Z-h, Zou M-L, Teng Y-y, Zhang K-W, Li Y-Y, Guo D-y and Yuan F-L (2021) The m6A RNA Modification Modulates Gene Expression and Fibrosis-Related Pathways in Hypertrophic Scar. Front. Cell Dev. Biol. 9:748703. doi: 10.3389/fcell.2021.748703
Received: 28 July 2021; Accepted: 22 September 2021;
Published: 15 November 2021.
Edited by:
Tin Lap Lee, The Chinese University of Hong Kong, ChinaReviewed by:
Christos K. Kontos, National and Kapodistrian University of Athens, GreeceTaiping Chen, University of Texas MD Anderson Cancer Center, United States
Copyright © 2021 Liu, Wu, Chen, Zou, Teng, Zhang, Li, Guo and Yuan. This is an open-access article distributed under the terms of the Creative Commons Attribution License (CC BY). The use, distribution or reproduction in other forums is permitted, provided the original author(s) and the copyright owner(s) are credited and that the original publication in this journal is cited, in accordance with accepted academic practice. No use, distribution or reproduction is permitted which does not comply with these terms.
*Correspondence: Feng-Lai Yuan, bjjq88@163.com