Microfluidic Reproduction of Dynamic Bioreactor Environment Based on Computational Lifelines
 Phuong Ho
 Sarah Täuber
 Birgit Stute
 Alexander Grünberger
 Eric von Lieres
- 1Institute of Bio‐and Geosciences, IBG‐1: Biotechnology, Forschungszentrum Jülich, Jülich, Germany
- 2RWTH Aachen University, Aachen, Germany
- 3Multiscale Bioengineering, Technical Faculty, Bielefeld University, Bielefeld, Germany
- 4Center for Biotechnology (CeBiTec), Bielefeld University, Bielefeld, Germany
The biotechnological production of fine chemicals, proteins and pharmaceuticals is usually hampered by loss of microbial performance during scale-up. This challenge is mainly caused by discrepancies between homogeneous environmental conditions at laboratory scale, where bioprocesses are optimized, and inhomogeneous conditions in large-scale bioreactors, where production takes place. Therefore, to improve strain selection and process development, it is of great interest to characterize these fluctuating conditions at large-scale and to study their effects on microbial cells. In this paper, we demonstrate the potential of computational fluid dynamics (CFD) simulation of large-scale bioreactors combined with dynamic microfluidic single-cell cultivation (dMSCC). Environmental conditions in a 200 L bioreactor were characterized with CFD simulations. Computational lifelines were determined by combining simulated turbulent multiphase flow, mass transport and particle tracing. Glucose availability for Corynebacterium glutamicum cells was determined. The reactor was simulated with average glucose concentrations of 6 g m−3, 10 g m−3 and 16 g m−3. The resulting computational lifelines, discretized into starvation and abundance regimes, were used as feed profiles for the dMSCC to investigate how varying glucose concentration affects cell physiology and growth rate. In this study, each colony in the dMSCC device represents a single cell as it travels through the reactor. Under oscillating conditions reproduced in the dMSCC device, a decrease in growth rate of about 40% was observed compared to continuous supply with the same average glucose availability. The presented approach provides insights into environmental conditions observed by microorganisms in large-scale bioreactors. It also paves the way for an improved understanding of how inhomogeneous environmental conditions influence cellular physiology, growth and production.
Introduction
Biotechnological production of chemicals, enzymes for industrial usage and pharmaceuticals takes place in bioreactors with sizes of up to several 100 cubic meters (Noorman, 2011). In such large-scale bioreactors, the environmental conditions experienced by the cultivated organisms cannot be maintained homogeneous. This applies especially to the availability of nutrients such as glucose and other substrates such as oxygen. Cells traveling through large-scale reactors experience rapid changes between starvation/limitation and excess/abundance regimes regarding glucose and oxygen as well as gradients of other process parameters like pH or temperature. Having to adjust their metabolism or even transcriptional programs costs a lot of energy (Enfors et al., 2001; Lara et al., 2006). In bioprocess development, organisms are usually selected and optimized based upon their performance at laboratory scale where homogeneous conditions prevail. However, these conditions do not mirror the conditions the organisms are ultimately exposed to in large-scale reactors. Numerous studies have shown that discrepancies between laboratory and production scales cause undesired effects such as deteriorated performance of the microbial cells, i.e. reduced growth and productivity, at industrial scale (Nadal-Rey et al., 2021). Understanding the impact of substrate gradients on cellular physiology has not only become a key aspect in academic research over the last decades, but from an economical perspective also plays a vital role in improving industrial bioprocess performance.
From a physico-biological standpoint, nutrient gradients in large-scale bioreactors occur because microbial cells often consume nutrients or take up oxygen faster than these substrates are transported (Sweere et al., 1987). The higher the uptake rate or biomass concentration the more severe becomes the impact of the resulting gradients. Another cause of substrate gradients is the hampered transport of nutrients. Nutrient transport generally depends on various factors ranging from operating conditions, e.g., feed rate, aeration rate and stirrer speed, to design parameters, e.g., reactor type, reactor design and internal hardware such as baffles. Understanding the impact of changing environmental conditions on cellular well-being is paramount to optimize biotechnological processes at production scales.
Effects of nutrient gradients on metabolism and growth of microbial cells have been experimentally investigated in literature (Larsson et al., 1996; Lara et al., 2009). With so-called scale-down bioreactors, it is possible to mimic changes in nutrient availability that represent large-scale conditions (Neubauer and Junne, 2010; Lemoine et al., 2015; Limberg et al., 2016). These laboratory scale bioreactors consist of combined compartment systems. Each reactor imitates a compartment with conditions that can be found in a certain region of the large-scale bioreactor. Cellular responses were quantified by measuring changes in nutrient uptake or product formation. By modifying the reactor number, type (stirred tank/plug-flow), volume, connectivity, feed rate and residence time (through pump rates) as well as overall nutrient availability it is possible to represent a variety of changing conditions. Traditionally, the design of scale-down bioreactors is based upon global correlations like mixing time or even without large-scale reference (Delvigne et al., 2006; Noorman, 2011). It is still challenging to experimentally measure local nutrient concentration in large-scale bioreactors. Free-floating sensors can potentially measure parameters like pressure, pH, temperature and dissolved oxygen but are yet in development (Reinecke et al., 2012; Lauterbach et al., 2019; Bisgaard et al., 2020).
In recent years, researchers have become increasingly interested in computing hydrodynamics and mass transfer within bioreactors to characterize the environment of cultivated cells. Computational Fluid Dynamic (CFD) simulations can provide detailed spatio-temporal information on flow fields and nutrient distributions in different large-scale bioreactors without physical setup and operational effort. The concept of lifeline has received considerable attention in the last years (Haringa et al., 2016; Kuschel and Takors, 2020; Hajian et al., 2021). It was coined by Lapin et al. (2004) and describes the environmental conditions, e.g., glucose or oxygen concentration, that an organism is exposed to on its way through the bioreactor. These transient conditions reflect the history of the organism. Lifelines can be statistically analyzed to determine residence time distributions in different regimes, e.g., starvation or abundance of nutrients (Haringa et al., 2016). This information can be used for selecting number, type and volume of laboratory reactors and thus, CFD simulations can guide the rational design and operation of representative scale-down experiments.
Insights provided by current scale-down bioreactors are limited to the average response of microbial cells in the whole system. So far it was not possible to investigate how representative large-scale conditions affect microbes at single-cell level. Novel microfluidic single-cell cultivation tools can fill this gap. In the last years, considerable attention and research has been devoted to microfluidic single-cell cultivation systems and their application to examine the relation between nutrient availability and cell physiology (Grünberger et al., 2014). Most recently, dynamic microfluidic single-cell cultivation (dMSCC) offers the possibility to analyze cellular response upon controlled changes of the environment at single-cell level (Täuber et al., 2020). Grünberger et al. (2013) have shown that physiology (growth, morphology, division etc.) of the cell is not negatively affected compared to the lab scale bioreactor. Obtained maximum growth rates are even higher (μmax = 0.6 h−1 compared to μmax = 0.4 h−1) when cultivated in perfusion based microfluidic systems.
Computational
In the last years, an increasing interest in CFD simulation of bioreactors can be observed (Table 1). This trend is supported by ever increasing computational capacity which progressively accelerates the computation of hydrodynamics and mass transfer. CFD is often the only option to determine substrate gradients in large-scale bioreactors, since industrial equipment is hardly available for fundamental research (Nadal-Rey et al., 2021). In addition, experimental accessibility of spatio-temporal details is very limited in steel bioreactors. CFD on the other hand offers the chance to gain information about the environment observed by cultivated organisms. In most cases, only a few minutes of real time can be simulated due to computational constraints. However, this allows to repeatedly simulate temporal snapshots at different stages of much longer fermentation processes.
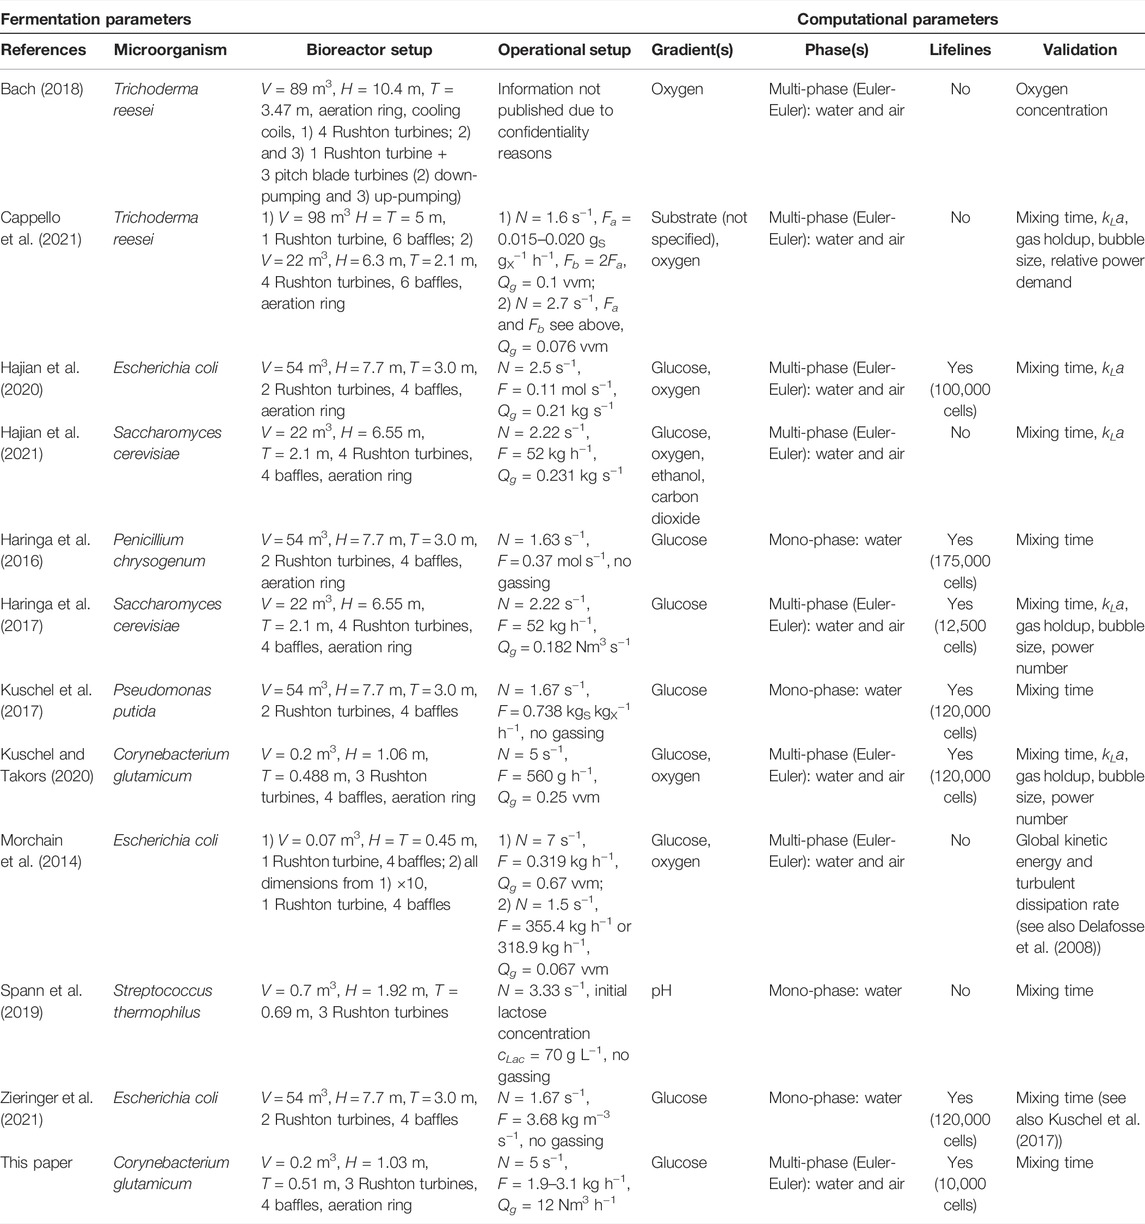
TABLE 1. CFD simulations for fermentation processes in stirred tank bioreactors (see supplement for further details).
CFD models can be coupled with metabolic models to investigate interactions between cells and their local environment. These models describe substrate uptake and product formation and can also consider the intracellular state such as ATP availability or gene expression (Haringa et al., 2018a; Kuschel and Takors, 2020; Zieringer et al., 2021). Lifelines are based on computed concentration fields and particle trajectories. The statistical analysis of lifelines in regard to frequency and duration of exposure to certain conditions, e.g., nutrient and oxygen limitation or excess, have been used to guide the design of scale-down bioreactors (Haringa et al., 2017; Kuschel and Takors, 2020; Hajian et al., 2021). Furthermore, CFD can be used to optimize bioprocesses by adjusting operating conditions (Spann et al., 2019) or modifying the geometrical setup, e.g., size, shape and position of impellers and baffles or position of the feed (Morchain et al., 2014; Bach, 2018; Haringa et al., 2018b). However, it is crucial to compare simulation results with experimental data to validate the methodology. In this regard, several metrics are available such as the mixing time, gas hold-up, power number, kLa and bubble diameter (Kuschel and Takors, 2020).
The governing equations are solved in two steps. First, the velocity and pressure fields are computed by solving Navier-Stokes equations. Then, mass transfer is computed by solving convection-diffusion equations based on the velocity field. These problems can be solved subsequently, as velocity and pressure fields are largely independent of concentration fields typically occurring in bioreactors. The computational demand is usually reduced by applying the Reynolds-Averaged Navier-Stokes (RANS) approach. In contrast to Large Eddy Simulations (LES) or Direct Numerical Simulations (DNS), which are more accurate, RANS averages over all eddies. For simulating bioreactors, the RANS approach yields a reasonable trade-off between accuracy and computational demand (Kelly, 2008). Turbulence is widely addressed using the standard k-ɛ or realizable k-ɛ models. Both turbulence models apply turbulent kinetic energy k and turbulent dissipation ɛ to close the Reynolds stress terms in the RANS equations. Realizable k-ɛ shows better performance for flows with rotation and recirculation but causes longer compute times (Versteeg and Malalasekera, 2007).
Different approaches have been applied to account for the rotational effect of impellers in stirred tank bioreactors, depending on the required level of accuracy and available compute resources. The multiple reference frame (MRF) or frozen rotor (FR) method (Haringa et al., 2016; Hajian et al., 2020; Kuschel and Takors, 2020) and the sliding mesh (SM) method (Kuschel et al., 2017) are most widely used in biotechnology. They are based on the concept of subdividing the bioreactor into two domains: a rotating domain that covers the impeller and an immediately influenced zone, and a stationary domain that covers static elements such as baffles and the rest of the reactor volume. MRF and FR assume a fixed rotor position, i.e., impellers do not move in relation to the static parts. The rotational effect is considered by introducing centrifugal and Coriolis forces in the momentum equations for the rotating domain, whereas the momentum equations in the stationary domain remain unchanged. This yields a stationary velocity field. The SM approach accounts for transient rotation and yields an unsteady flow field, i.e. the impeller moves in relation to static parts. Rotating and stationary domains are coupled through a sliding interface along which fluxes of mass, momentum etc. are conserved. The SM approach is more accurate in resolving unsteady flow effects and is used when a time-accurate solution is needed. MRF and FR provide a more efficient way to compute time-averaged solutions. Furthermore, studies have shown that MRF and FR yield comparable results to SM in terms of global flow characteristics, e.g., power demand and gas holdup (Scargiali et al., 2007; Cappello et al., 2021).
Aerobic bioprocesses require to consider multiphase flow. Aeration can substantially influence the overall velocity field and consequently mass transfer. Moreover, oxygen is an important substrate and required for both growth and synthesis of desired products by many microorganisms. When oxygen is not abundant for all cells, gradients are formed in the reactor and mass transfer of dissolved oxygen (DO) must be included in the computational model. Most commonly the Euler-Euler approach is used, where both phases are modeled as interpenetrating continua (Bach et al., 2017; Cappello et al., 2021; Hajian et al., 2021). Sophisticated Euler-Euler simulations are based upon population balance models for different classes of bubble sizes with coalescence and breakup, which adds to the computational burden (Haringa et al., 2017; Kuschel and Takors, 2020). Resolving single bubbles with the Euler-Lagrange approach would be even more accurate but is computationally infeasible in most cases.
The turbulent Schmidt number
Experimental
Scale-down bioreactors are currently the system of choice for reproducing and analyzing gradients in process performance and production strains in large scale bioreactor cultivations (Lara et al., 2006; Neubauer and Junne, 2010; Nadal-Rey et al., 2021). In conventional scale-down systems, e.g., stirred tank reactor (STR) or plug flow reactor (PFR), it is difficult to implement specific oscillations of one parameter without capturing the influence of other process parameters (Täuber et al., 2021a). Control of the microenvironment of each cell is limited in typical scale-down devices, and cell history data are expressed only as average residence time. These cultivation systems calculate microbial growth based upon biomass and optical density, which are mass measurements. Therefore, the data is always based on averaged populations (Kovárová-Kovar and Egli, 1998), and no representative information can be collected for individual cells. Thus, the effects of population heterogeneity on production cannot be analyzed with temporal resolution (Templer and Ces, 2008). Conventional systems have not been able to reproduce and analyze lifelines from large-scale bioreactors. However, it is very important to find out how individual cells behave on their journey through the large-scale bioreactor and how changing environmental conditions affect growth to improve overall bioprocess development.
Microfluidic cultivation systems can be used to precisely study different environments and their effects, e.g., on growth, cell-to-cell heterogeneity or gene expression, at single-cell level. Microfluidic cultivation offers many advantages such as laminar flow, small size and volumes (pL - μL), and a high surface-to-volume ratio (Ortseifen et al., 2020; Grünberger et al., 2015). In recent years, systems have evolved for cultivation at constant conditions (Grünberger et al., 2012), in batch mode (Kaganovitch et al., 2018) and under changing environmental conditions to study cellular behavior and physiological responses of single cells to fluctuations. CFD studies were used to investigate the feasibility of reproducing large-scale substrate oscillations on microfluidic chips (Ho et al., 2019). Dynamic microfluidic cultivation systems, such as dMSCC devices, can also be used for the targeted and precise study of the effects of regularly and irregularly oscillating medium conditions and media changes (Täuber et al., 2020). The combination of this system with live-cell imaging provides high spatial and temporal resolution for studying the behavior of populations at single-cell level under specific environmental fluctuations. In dMSCC devices (Figure 1A), environmental conditions can be precisely controlled at timescales ranging from 5 s to several hours within the cultivation chambers (Figures 1C,D). The limiting oscillation frequency of the dMSCC system has been theoretically determined with CFD simulations of the medium exchange within the cultivation chamber and experimentally validated with fluorescine measurements. It has been shown that at relatively low oscillation frequencies, 100% medium exchange occurs within the cultivation chamber during oscillation. With increasing oscillation frequency, a complete medium exchange can no longer be ensured. Up to an oscillation frequency of 0.2 Hz, a complete medium exchange in the cultivation chamber can be ensured (Figure 1D). The dMSCC device allows cultivation with oscillating environments of two parameter levels, e.g., different glucose concentrations. In addition, high oscillation frequency can be achieved, providing the possibility of implementing cellular lifelines (Täuber et al., 2021a). At the same time, control measurements of the different media can be performed (Figure 1B). The chosen flow profile allows for such control measurements on both sides. Between the control zones is the so called “switching zone” where cells can be cultivated under oscillating conditions between the two medium conditions.
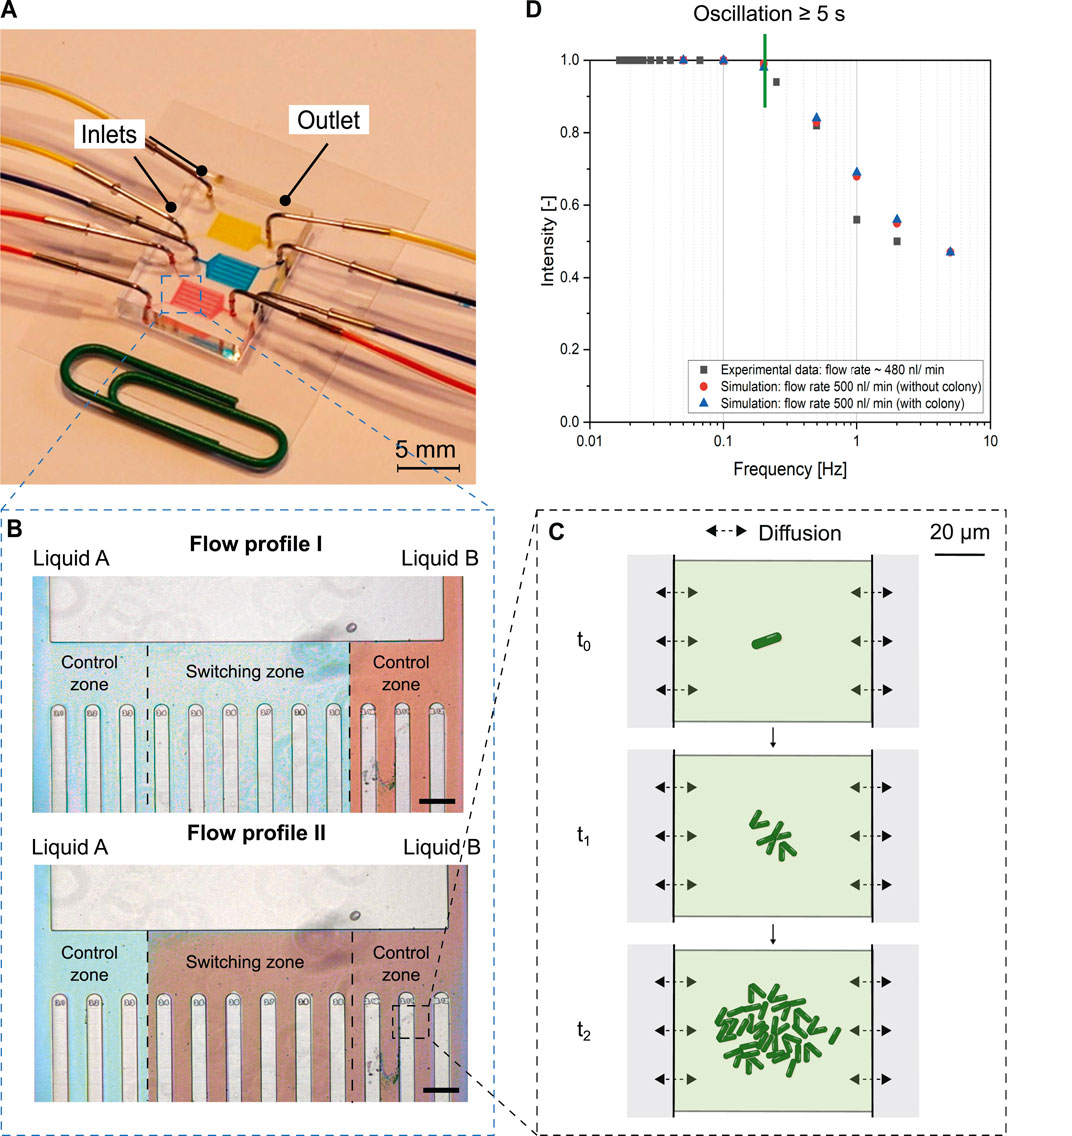
FIGURE 1. Overview of dMSCC device for cultivation of single cells under dynamic environmental conditions. (A) Microfluidic chip with two inlets and one outlet. Each chip has three parallel cultivation units, each of which enables one measurement. (B) Flow profile within dMSCC device. Scale bar is 200 μm. (C) Monolayer growth chambers by observing growth under dynamic conditions starting from 1-4 cells, often called as cultivation chamber. (D) Bode plot showing fluorescence intensity within a cultivation chamber at oscillation frequencies from 100 s (0.01 Hz) to 0.2 s (5 Hz), experimental validation (black squares). Corresponding CFD simulated concentrations (red circles: simulation without colony, blue triangles: simulation with colony as steric hindrance) are normalized to maximum substrate concentration, measured in cultivation chamber at lowest frequency. dMSCC allows oscillation intervals greater than or equal to 5 s. Copyright from Royal Society of Chemistry, adapted from Täuber et al. (2020).
In microfluidics, only medium oscillations of one selected parameter can be performed, whereas in traditional scale-down reactors, different parameters such as substrate and oxygen concentration can be studied in combination. Moreover, currently only two or three discrete concentrations can be chosen, whereas in traditional scale-down systems continuous changes/oscillations can be performed.
Scope
Most published CFD studies for fermentation processes have focused mainly on describing environmental conditions. Lately, this information is often applied for the design and operation of conventional scale-down reactors. The generated statistical data indicate evidence for population heterogeneity, but to this date no study has specifically targeted experimental validation of this hypothesis. Little is understood of the influence of large-scale gradients on the physiology of single cells. Microfluidic systems with changeable and controllable nutrient supply are suitable to investigate this causal relationship, but also here only few attempts have been made so far to investigate the impact of changing conditions on single cells. Furthermore, to the best of our knowledge, only one proof-of-concept study (Täuber et al., 2020) has focused on mimicking realistic large-scale conditions in microfluidic systems to analyze the effect on growth behaviour.
In this study, we present a framework to investigate the impact of dynamic large scale conditions on microbial cells, combining two state-of-the art technologies in bioprocess development: CFD and dMSSC. In a first step, example cellular lifelines, i.e. fluctuating extracellular glucose concentration experienced by microbial cells, are determined by a CFD simulation of a fed-batch snapshot. The lifelines are postprocessed to be suitable as feeding input signals for dMSCC devices, which are then applied for experiments with tightly controlled glucose concentration profiles. The impact of these oscillations on microbial growth is observed at single-cell level by stretching snapshot conditions. Several lifelines with same and varied average glucose availability are compared to growth under homogeneous supply of the respective glucose amount.
Case
The studied model bioreactor has 200 L working volume and four baffles. It is stirred with three Rushton turbines. The reactor is equipped with a sensor box mounted to an elevator which additionally disturbs the flow (Figure 2). An aeration ring is situated in the bottom part of the reactor. The stirrer speed is 5 s−1 and air is supplied with one vvm. Further details on parameters and operating conditions can be found in the Supplementary Table S3.
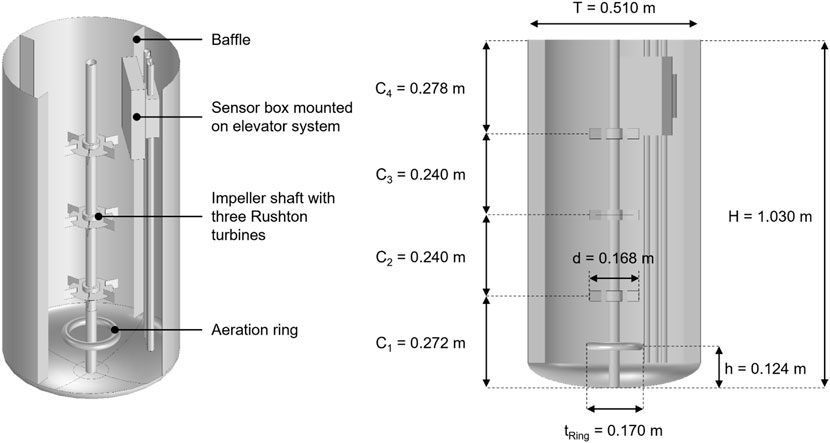
FIGURE 2. Geometry and dimensions of studied bioreactor with three Rushton turbines, impeller shaft, aeration ring, four baffles and elevator-mounted sensor box.
The computational model is designed using literature data on Corynebacterium glutamicum fed on glucose. A snapshot of a fed-batch cultivation is simulated, hence phenomena happening on longer time-scales, e.g. cellular growth, can be neglected in the large-scale context. In three scenarios, the substrate feed is chosen such as to establish average glucose concentrations of 6 g m−3, 10 g m−3 and 16 g m−3 in the bioreactor. Substrate uptake is determined using Monod’s equation,
Methods and Materials
Computational
All simulations were performed with COMSOL Multiphysics 5.5 (COMSOL AB, Stockholm, Sweden) and postprocessed using MATLAB. Two-phase flow was modelled using the bubby flow interface based on the RANS standard k-ɛ turbulence model. The velocity field was computed using a frozen-rotor approach, assuming stationarity. This is computationally less demanding than transient approaches while yielding comparable results (Scargiali et al., 2007; Cappello et al., 2021). Based on the stationary velocity field, transient mass transfer was calculated. DO concentration was assumed to be non-limiting and hence neglected in this study. Cell metabolism was implemented as a sink that continuously depletes glucose from the fermentation broth. The concentration field also becomes stationary after a certain simulation time. Based on a published study with similar reactor setup (Kuschel and Takors, 2020), the turbulent Schmidt number was chosen at 0.2.
Gas was introduced at holes in the aeration ring via wall boundary conditions where slip boundary condition was selected for the liquid and gas flux for the gas. The feed inlet was modelled by a small cylinder with radius r = 0.0025 m closely under the surface, assuming a fully developed flow field with the corresponding flow rate, to account for a constant substrate supply. At the upper liquid surface, an outlet boundary condition was defined for the liquid and gas phases to maintain a constant operating volume. At all other walls, no slip boundary conditions were applied for the liquid phase and no gas flux for the gas phase. Cultivation broth was assumed to have similar properties as water at 24 °C and atmospheric pressure (density ρL = 995.6 kg m−3 and dynamic viscosity μL = 7.97 ⋅ 10–4 Pa s). Gas density was calculated from ideal gas law with a molecular weight of Mg = 0.02 kg mol−1 and mean bubble diameter of db = 3 mm. Impeller blades and discs, as well as baffles was modelled as 2D internals.
Over a period of 60 s 10,000 particles with the same density of the fluid were traced. Turbulent dispersion of the particles was considered with a discrete random walk model. Particle traces over 30 min were created by concatenating 30 of these fragments such that end and start points of subsequent pieces are nearest neighbors. This was done systematically applying a MATLAB script. Lifelines, i.e., time series of substrate concentration, were determined by aligning the position information of the particles with the stationary concentration field of glucose. The lifelines were then smoothed using a convolution filter of length 10 s. The dMSCC device can reproduce changes between discrete glucose levels. Thus, the lifelines were partitioned into regimes with cs ≤ KS (starvation) and cs > KS (abundance). In the starvation regime, the concentration was set to 0 g m−3. In the abundance regime, the concentration was set to a value so that the mean concentration of the discretized lifeline equals the average concentration in the bioreactor. This was achieved by identifying and selecting original and consequently discretized lifelines that have the same average concentration as in the bioreactor. Finally, postprocessed lifelines were selected as dMSCC feed profiles. Glucose concentration in the bioreactor was 6 g m−3, 10 g m−3 and 16 g m−3 respectively, which corresponds to an average concentration that is results in steady state in the bioreactor when 25%, 33 and 42% of maximal glucose uptake by all cultivated cells is being used as feed rate. In the following, lifelines 1-2 represent 6 g m−3 average glucose concentration, lifelines 3-6 represent 10 g m−3 and lifelines 7-8 represent 16 g m−3.
Experimental
Bacterial Strain and Medium
C. glutamicum WT ATCC 13032 was cultivated in defined minimal medium CGXII (Unthan et al., 2014) at 30°C in a rotated shaker at 120 rpm (Ecotron, Infors, Germany). The minimal medium CGXII for the shaking flasks was supplemented with MOPS buffer for pH buffering and a final glucose concentration of 40 g L−1. The preculture was inoculated from a glycerol stock in a 100 ml shaking flask with 10 ml working volume and cultivated overnight. The main culture was inoculated from the preculture with a starting OD600 of around 0.05. When the main culture had a OD600 of around 0.2, the inoculation of the dMSCC device can be started. The medium was prepared a maximum of 24 h before the experiment. For the cultivation in the dMSCC device, no buffer was needed. The media for lifeline 1-2 were prepared with 0 g m−3 and 15 g m−3 glucose, for lifeline 3-6 with 0 g m−3 and 20 g m−3 and for lifeline 7-8 with 0 g m−3 and 30 g m−3. Also perfusion experiments were performed with a final glucose concentration of 6 g m−3 (25%), 10 g m−3 (33%) and 16 g m−3 (42%). The media were sterile filtrated to prevent channel clogging during the experiments.
Chip Design and Preparation
The microfluidic chip design for the emulation of lifelines has two inlets, for media with different glucose concentrations. Between the two inlets are twelve arrays of cultivation chambers (a linear row of cultivation chambers). The arrays are divided into three zones, two control zones (left and right) and one oscillation zone (centre). The different zones are separated by a channel with a width of 400 μm. The supply channels have a width of 100 μm and a height of 11 μm. The monolayer cultivation chambers are 80 μm × 90 μm x 700 nm in size. For a detailed description of the chip design and the flow profiles the reader is referred to Täuber et al. (2020).
The polydimethylsiloxane (PDMS)-glass chip was manufactured using soft lithography. PDMS was prepared in a ratio of 1:10 current agent and linker (Sylgard 184 silicone elastomer, Dow Corning Corporation, United States) and placed on a master mold. The PDMS was then baked at 80°C for 2 h. After baking, the PDMS chips were cut from the wafer and the inlets and outlets were punched using a 0.75 mm biopsy puncher (Reusable Biopsy Punch, 0.75 mm, WPI, United States). The PDMS chip as well as the glass slide (D 263 T eco, 39.5 × 34.5 × 0.175 mm, Schott, Germany) were cleaned with isoproanol and O2 plasma oxidized (Femto Plasma Cleaner, Diener Electronics, Ebhausen, Germany). After plasma oxidation, the PDMS chip and the cover glass were pre-sealed and finally baked for 2 min at 80°C to strengthen the bonding.
Loading and Flow Procedure
The cell suspension at a OD600 of around 0.2 was inoculated through the outlet of the dMSCC chip with reciprocating motion of the syringe pistons. After filling a sufficient number of cultivation chambers, the flow was stopped, and the medium was connected to the inlets. Precision pressure driven pumps (Fluigent, Jena, Germany) were used for medium supply, starting pressures were set to 150 and 50 mbar. The flow profiles were applied with a specific tailor made lifeline profile implemented in an automated software tool (microfluidic automation tool (MAT), Fluigent, Jena, Germany). After loading, the cells were perfused 2 hours with the starting pressure setting. After the adaptation phase, the lifeline oscillation started, which has a length of 30 min. This 30 min lifeline is repeated until the end of cultivation.
Live-Cell Imaging
A Nikon inverted automated microscope (Nikon Eclipse Ti2, Nikon, Germany) was used for the live-cell imaging. The microscope stage was in a cage incubator (Cage incubator, OKO Touch, Okolab S.R.L., Italy) for optimal temperature control of 30°C. The dMSCC chip was mounted on an in-house fabricated chip holder placed in the cage incubator on the motorized microscope stage. For live-cell imaging a ×100 oil objective (CFI P-Apo DM Lambda ×100 Oil, Nikon GmbH, Germany), a DS-Qi2 camera (Nikon camera DSQi2, Nikon GmbH, Germany) and an autofocus system (Nikon PFS, Nikon GmbH, Germany) to compensate the thermal drift during the cultivation was used. For each cultivation experiment, around 100 cultivation chambers were selected manually and were targeted with the NIS-Elements Imaging Software (Nikon NIS Elements AR software package, Nikon GmbH, Germany) for live-cell microscopy observation.
Image and Data Analysis
Image analysis was performed with the “analyze particle” function of the open-source software Fiji (Schindelin et al., 2012). For a detailed image and data analysis protocol, the reader is referred to Täuber et al. (2021b). The growth rate was determined by semilogarithmic regression of the cell number against the cultivation time, using OriginPro 2019b (OriginLab Corporation, Northampton, United States) for each colony. Here, the growth rate was calculated over the colony growth inside the cultivation chamber. For each lifeline condition, three cultivation chambers were evaluated and the mean and standard deviation were calculated.
Results and Discussion
This study targets the impact of heterogeneous substrate supply in a 200 L pilot-scale reactor on the growth of cultivated C. glutamicum cells. Computational lifelines were determined from CFD simulations, based on the stationary flow field, glucose distribution and particle trajectories (Figure 3). A selection of discretized lifelines with representative oscillation patterns and varying glucose availability (Figure 4) was applied as feed profiles to a microfluidic dMSCC device. Growth rate was observed over time to examine the influence of environmental conditions typically observed in large-scale reactors on microbial physiology (Figure 5).
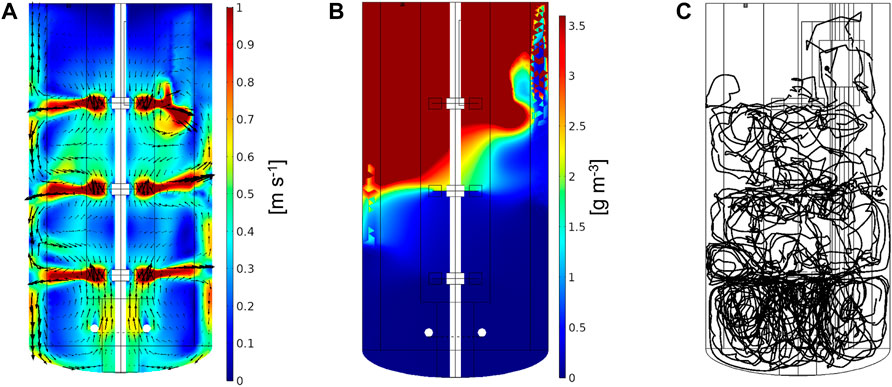
FIGURE 3. Simulation results for 200 L bioreactor fed with 33% of maximal glucose consumption corresponding to an average glucose concentration of 10 g m−3 in the reactor. (A) Stationary flow, (B) concentration field, and (C) representative particle trajectory over 180 s.
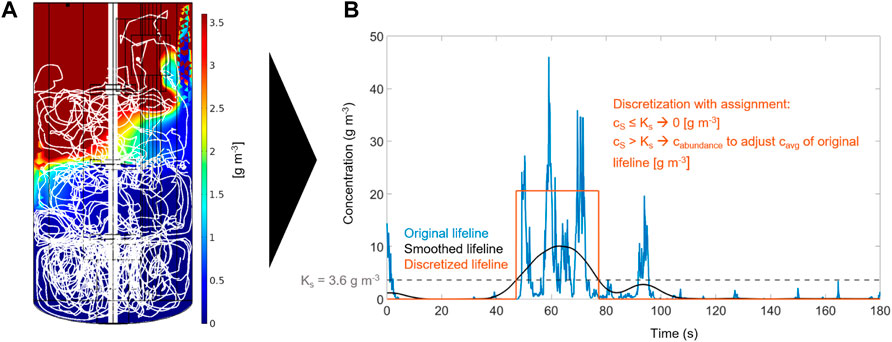
FIGURE 4. Computational workflow for lifeline generation: (A) CFD simulation of concentration field and representative particle trajectory over 180 s (scale maximum is adjusted to KS to visualize the boundary between the regimes), and (B) smoothing and discretization of the lifeline.
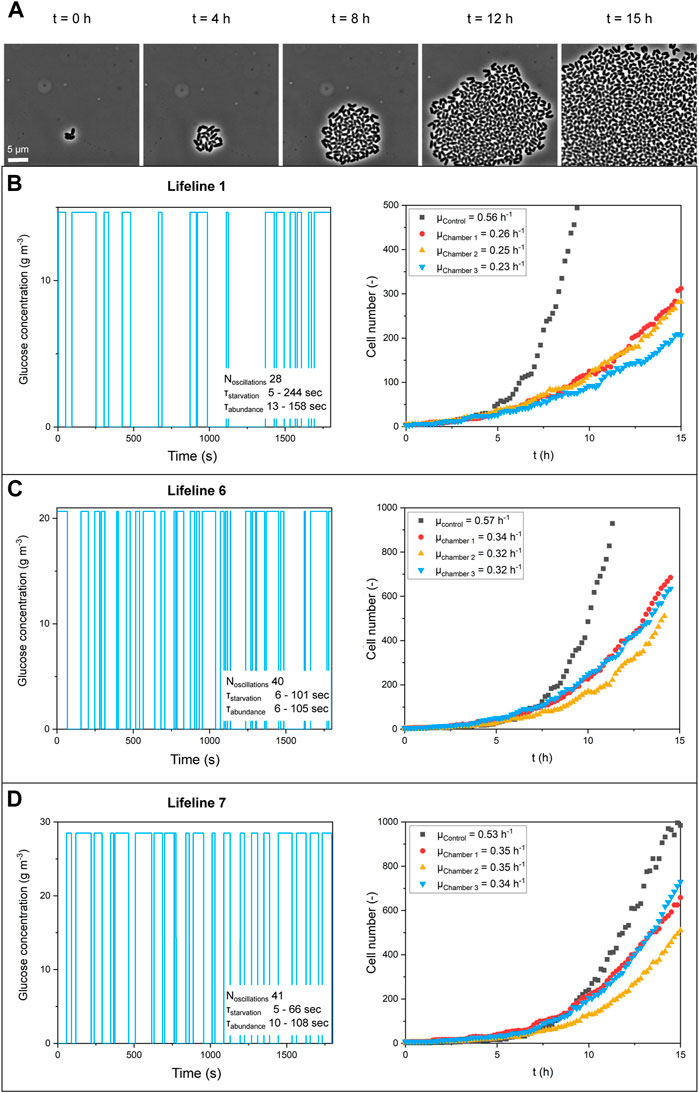
FIGURE 5. (A) Microscope images of growing colonies for lifeline six at selected time points. Feed profiles and growth curves (n = 3; biological replicates) for (B) lifeline 1, 6 g m−3 average concentration, (C) lifeline 6, 10 g m−3 average concentration, and (D) lifeline 7, 16 g m−3 average concentration.
Computational
Figure 3 shows the cross-sectional stationary velocity field of the studied bioreactor. As expected, the highest liquid velocities are observed near the impellers where the fluid is radially displaced. Between the impellers, recirculation zones are formed. Gas flow has the highest impact on liquid velocity between the sparger and the lowest impeller. The sensor elevator positioned at the top right (invisible as out of the cross-sectional plane) acts as an additional flow disturber. This also impacts the concentration field shown in Figure 3B, where the glucose is not evenly distributed at the top right. Glucose is consumed at such a high rate at the top of the reactor, that it hardly reaches the bottom. At an average glucose concentration of 10 g m−3 (33% of maximal consumption), substrate abundance (cs > KS) prevails in about one third of the reactor. This indicates that the characteristic uptake time of the cells is much shorter than the circulation time of the reactor. The concentration fields for the other two cases (6 g m−3 and 16 g m−3 average glucose concentration) can be found in the Supplementary Figure S7. The particle trajectory of lifeline three over a period of 180 s is shown in Figure 3C.
Figure 4 illustrates the generation and postprocessing of lifelines by example of lifeline 3. Particle tracing data are matched with concentration field data (Figure 4A). 30 min lifelines were obtained by concatenating 30 fragments of 1 min each. They are smoothed and discretized into starvation and abundance regimes to obtain suitable input signals for the dMSCC device with a response time of 10 s. Figure 4B shows an example of this postprocessing step. For comparison, the lifelines were also discretized into three regimes (starvation, limitation, abundance). However, the limiting zones were mostly passed very quickly, i.e., within 10 s (Supplementary Figure S10).
Experimental
In microfluidic single-cell cultivation (MSCC) experiments, the lifelines were applied as feed profiles to a dMSCC device to study the growth of C. glutamicum. Cultivation chambers containing growing populations with an initial size of less than five cells were observed over time. Figure 5A shows a representative colony. Growth rates were determined by counting the increase in cell number. The maximum growth rate was derived from the colony growth.
Table 2 summarises the growth rates obtained for the different lifelines for two technical replicates. The different characteristics of the lifelines were compared, such as the number of oscillations and the starvation and abundance time ranges. It can be clearly seen that for lifelines with the same average glucose concentration, the same growth rate was achieved regardless of the number of oscillations. Comparing the three cases with average glucose concentrations of 6 g m−3, 10 g m−3 and 16 g m−3, a clear correlation of the growth rate with glucose concentration has been observed. A maximum growth rate of μ = (0.24 ± 0.01) h−1 was determined for 6 g m−3 glucose supply, μ = (0.3 ± 0.03) h−1 for 10 g m−3, and μ = (0.36 ± 0.01) h−1 for 16 g m−3.
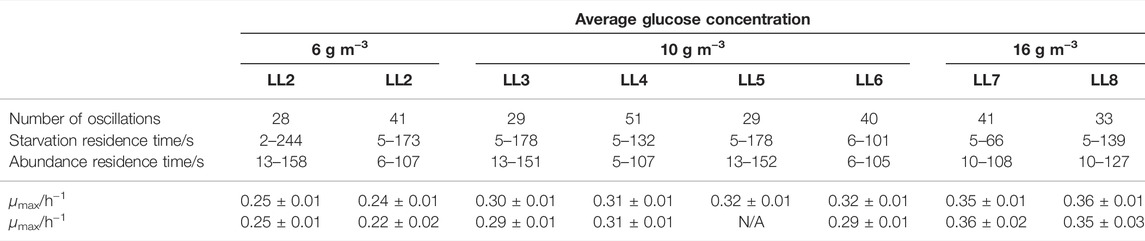
TABLE 2. Key characteristics and maximum growth rates (two technical replicates, each averaged over three biological replicates) for the eight studied lifelines (LL1-LL8).
Various scale-down approaches have already been performed for C. glutamicum under oscillating substrate concentration in combination with DO concentration. Limberg et al. (2016) investigated the effect of oxygen deprivation and nutrient oscillations in STR-PFR and STR-STR devices on l-lysine production by C. glutamicum DM 1800. They found a reduction of growth rate of about 25% and an increase in the formation of l-lactate and l-glutamate as by-products. Under well aerated batch conditions, μmax = 0.41 h−1 was observed, and under oscillating conditions, μmax = 0.31 h−1 in the STR-PFR device and μmax = 0.29 h−1 in STR-STR device (Limberg et al., 2016). Here, a reduction in growth rate of about 25% under oscillating conditions was observed compared to batch conditions. Käß et al. (2014) analysed the effect of fluctuating oxygen and substrate supply to l-lysine producing C. glutamicum DM 1933. No effect on the productivity and growth was observed in this study. In a multi-omics analysis of the strain, no changes were found in the response to process inhomogeneity (Käß et al., 2014). The specific growth rate was not shown. Lemoine et al. (2015) simulated the effect of oscillating substrates and oxygen concentrations in STR-PFR and STR-PFR-PFR devices in fed-batch mode. The effects of oscillations on product formation and growth of C. glutamicum DM1800 with two point mutations in pycP458S and lysCT311L were investigated. No effects of oscillation on growth rate were observed. A two-fold higher production of lactate and succinate and other amino acids was observed in the STR-PFR-PFR system as compared to the STR-PFR system (Lemoine et al., 2015). In this study, a higher reduction of the growth rate of around 40% was observed compared to 25% in the study of Limberg et al. (2016), which is not comparable with our scale-down studies, since in these studies no isolated parameter was considered. In summary, representative cultivations of C. glutamicum under the conditions and scales of the present study have not yet been published. A future study will address the validation of our microfluidic results with experiments in different large-scale bioreactors.
For comparison, we performed control experiments with MSCC (Grünberger et al., 2015). Here, cultivation of C. glutamicum was performed under continuous perfusion conditions with the same average glucose concentrations as during oscillations. The results show a μmax = (0.45 ± 0.02) h−1 for a glucose concentration of 6 g m−3, μmax = (0.50 ± 0.01) h−1 for a glucose concentration of 10 g m−3, and μmax = 0.57 h−1 for a glucose concentration of 16 g m−3. Figure 6 shows the growth rates as a function of glucose availability in the reactor for the conditions of lifelines 1-8 and control experiments performed in perfusion mode. The results of the perfusion experiments show a similar trend as under oscillating conditions, as to when the glucose concentration increases, the growth rate also increases.
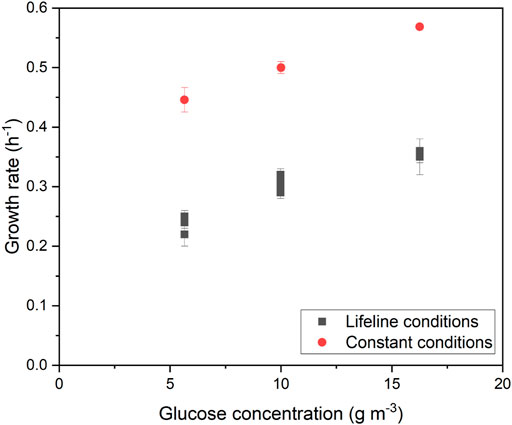
FIGURE 6. Maximum growth rates of C. glutamicum for different average glucose concentrations under oscillating and constant supply.
In literature, growth rates μmax between 0.59 h−1 and 0.64 h−1 were obtained in a constant microfluidic perfusion system (Unthan et al., 2014; Täuber et al., 2021b). In these studies, the minimal medium CGXII containing 40 g L−1 glucose and PCA as iron chelator was used. The iron chelator PCA can be metabolized by the cells in the microfluidic system as an additional carbon source (Unthan et al., 2014), resulting in higher growth rates. In our study, citrate was used as an iron chelator, which cannot be metabolized as a carbon source. This resulted in lower growth rates of μmax = 0.5 h−1 at 10 g m−3 glucose and of μmax = 0.57 h−1 at 16 g m−3 glucose.
At 6 g m−3 glucose, a growth rate of 0.45 h−1 was obtained under perfusion conditions. The reason for this lower growth rate compared to the other perfusion measurements may be the reduced glucose concentration, which is only slightly above the Ks value of 3.6 g m−3, which reflects the concentration at the half maximum growth rate. Comparing the growth rates achieved under perfusion conditions with those under oscillation conditions, a decrease of 45% was observed for 6 g m−3 glucose, 41% for 10 g m−3, and 38% for 16 g m−3. This shows that a similar decrease in growth rate of about 40% was measured for all analyzed glucose concentrations performed in oscillation mode compared to perfusion mode.
The reduction in growth rate for lifeline conditions compared to perfusion conditions can be attributed to oscillating environmental conditions. The oscillations may have affected various metabolic processes or regulatory processes, causing the cells to grow slower. It could be possible that constantly changing glucose concentrations at non-symmetric intervals causes cells to continuously adjust their uptake, which requires rapid redirection of intracellular fluxes. In S. cerevisiae, the regulatory mechanisms for glucose uptake in the presence of highly fluctuating glucose availability have already been studied (Busti et al., 2010), but similar information is still lacking for C. glutamicum. Maintenance of biochemical functions includes energy consumed for functions unrelated to the production of new cellular material. These include changes in stored polymeric carbon or osmoregulation (van Bodegom, 2007). During oscillations, it may be necessary for the cell to supply more energy to components unrelated to growth in order to maintain cell integrity, as well as to optimally store and utilize the changing carbon source, thereby showing reduced growth. A recent study examining growth of C. glutamicum under symmetrical nutrient oscillations also found a 38% reduction in growth rate at oscillation intervals
Each colony cultivated under lifeline conditions represents a single cell traveling through the large-scale bioreactor. This implies that for a feed rate of 25% of maximal glucose consumption (6 g m−3 average concentration in the bioreactor) there are cells that grow about half as fast as cells that are cultivated under constant perfusion glucose supply. The quantification of the effects of gradients on individual cells was possible due to the combined and novel application of two enabling technologies of CFD and dMSCC.
Conclusion and Outlook
The presented computational and experimental framework offers the opportunity to gain better understanding of scale-up effects on microbial growth. The difference between growth under homogeneous and under fluctuating glucose supply is quantified. Fluctuating conditions are representative for the environment experienced by cells cultivated in large-scale bioreactors. The velocity field of turbulent multi-phase flow in a typical pilot-scale bioreactor was simulated. Based on this, concentration fields with three different levels of glucose supply (6 g m−3, 10 g m−3 and 16 g m−3 average concentration in the bioreactor) and the trajectories of 10,000 microbial particles were computed. From the resulting data, lifelines were determined to study the impact of changing glucose availability from a microbial cell’s perspective. After smoothing and discretization, the computational lifelines were applied as feed profiles of a microfluidic system with rapidly changeable and controllable environmental conditions. Average microbial growth was analysed on a single-cell level using live-cell imaging. Growth rates for three average glucose concentrations (6 g m−3, 10 g m−3 and 16 g m−3) were compared to growth rates for continuous availability of the same glucose amount.
The results show that colonies growing on different lifelines, but with the same average glucose concentration have the same growth rate. This indicates that frequency and duration of glucose exposure or limitation play a minor role for growth in the observed ranges. At very high oscillation frequencies, a nearly constant supply would be achieved, resulting in different growth rates. The average glucose concentration of the lifeline or in the bioreactor significantly influences the growth rate. As the average concentration increases, so the growth rate increases. Comparison with constant perfusion shows that colonies growing under lifeline conditions have a deteriorated growth by an average of 40%. The cause of the reduced growth rates cannot be answered in this study. We speculate that the oscillations may have resulted in altered glucose uptake leading to energy consuming adjustments in metabolism and transcriptional programming.
The combination of CFD and dMSCC can provide a basis for future improvements in strain selection and process development. The comparison with growth rates determined in different large-scale bioreactors is important to validate the presented methodology. A comprehensive study is planned for the future, where also the role of cell concentration, uneven cell distribution and cell status should be addressed. In industrial production, multiple process parameters typically interact with each other, leading to the formation of complex gradients in several parameters simultaneously (Lara et al., 2006). In this study, only the influence of glucose gradients on the cell behavior was investigated. To improve representativeness of microfluidic lifeline emulation, dMSCC systems need to be further developed to allow simultaneous manipulation of multiple parameters such as glucose and oxygen. To date, there are no systems described in the literature covering oxygen oscillations. However, the possibility to fabricate gas-impermeable chips has been demonstrated by Sticker et al. (2019). They use a non-stoichiometric thiol-epoxy polymer to efficiently remove dissolved oxygen. Integrating this technology into the dMSCC system will allow investigation of oscillating oxygen. This will facilitate more complex lifelines with simultaneous changes in glucose and oxygen.
The current dMSCC determined maximal growth rates are based on colony growth rates. Although this provides first estimates of cell growth under oscillating and limiting conditions, the result can be compromised by gradient formation within the colony at late cultivation stages under limiting conditions (Hornung et al., 2018). To enable precise determination of the growth rate, especially under extreme limiting conditions (cs < Ks), 1D cultivation chambers (Yang et al., 2018) in the dMSCC system are most promising. Here, up to 4 cells can be cultivated in one chamber from the start of a single mother cell. Changes in the single-cell dynamic can be investigated without the influence of gradients within colonies.
Data Availability Statement
The raw data supporting the conclusions of this article will be made available by the authors, without undue reservation.
Author Contributions
PH, ST, AG and Ev contributed to the conceptualization and design of the study. PH and ST wrote the first draft. ST and PH designed the methodology. PH and BS performed the CFD simulations. ST performed the microfluidic experiments. ST and PH analyzed the data. PH, ST, AG and Ev interpreted the results, edited, and reviewed the manuscript. AG and Ev provided the financial resources. All authors contributed to the article and approved the submitted version.
Funding
PH and Ev gratefully acknowledge funding from the European Union’s Horizon 2020 research and innovation programme (ERA CoBioTec Call1: ScaleApp, grant no 031B0622A). Open access publication funded by the Deutsche Forschungsgemeinschaft (DFG, German Research Foundation, grant no 491111487).
Conflict of Interest
The authors declare that the research was conducted in the absence of any commercial or financial relationships that could be construed as a potential conflict of interest.
Publisher’s Note
All claims expressed in this article are solely those of the authors and do not necessarily represent those of their affiliated organizations, or those of the publisher, the editors and the reviewers. Any product that may be evaluated in this article, or claim that may be made by its manufacturer, is not guaranteed or endorsed by the publisher.
Acknowledgments
Parts of this work were performed at the cleanroom facilities of the Department of Biophysics and Nanoscience as well as the Department for Physics of Supramolecular Systems and Surfaces at Bielefeld University. The authors are thankful for all the help and support.
Supplementary Material
The Supplementary Material for this article can be found online at: https://www.frontiersin.org/articles/10.3389/fceng.2022.826485/full#supplementary-material
References
Bach, C. (2018). Modelling of Gradients in Large Scale Bioreactors. Kongens Lyngby, Denmark: Technical University of Denmark DTU.
Bach, C., Yang, J., Larsson, H., Stocks, S. M., Gernaey, K. V., Albaek, M. O., et al. (2017). Evaluation of Mixing and Mass Transfer in a Stirred Pilot Scale Bioreactor Utilizing Cfd. Chem. Eng. Sci. 171, 19–26. doi:10.1016/j.ces.2017.05.001
Bisgaard, J., Muldbak, M., Cornelissen, S., Tajsoleiman, T., Huusom, J. K., Rasmussen, T., et al. (2020). Flow-Following Sensor Devices: A Tool for Bridging Data and Model Predictions in Large-Scale Fermentations. Comput. Struct. Biotechnol. J. 18, 2908–2919. doi:10.1016/j.csbj.2020.10.004
Busti, S., Coccetti, P., Alberghina, L., and Vanoni, M. (2010). Glucose Signaling-Mediated Coordination of Cell Growth and Cell Cycle in saccharomyces Cerevisiae. Sensors 10, 6195–6240. doi:10.3390/s100606195
Cappello, V., Plais, C., Vial, C., and Augier, F. (2021). Scale-up of Aerated Bioreactors: Cfd Validation and Application to the Enzyme Production by Trichoderma Reesei. Chem. Eng. Sci. 229, 116033. doi:10.1016/j.ces.2020.116033
Delafosse, A., Line, A., Morchain, J., and Guiraud, P. (2008). Les and Urans Simulations of Hydrodynamics in Mixing Tank: Comparison to Piv Experiments. Chem. Eng. Res. Des. 86, 1322–1330. doi:10.1016/j.cherd.2008.07.008
Delvigne, F., Destain, J., and Thonart, P. (2006). A Methodology for the Design of Scale-Down Bioreactors by the Use of Mixing and Circulation Stochastic Models. Biochem. Eng. J. 28, 256–268. doi:10.1016/j.bej.2005.11.009
Enfors, S.-O., Jahic, M., Rozkov, A., Xu, B., Hecker, M., Jürgen, B., et al. (2001). Physiological Responses to Mixing in Large Scale Bioreactors. J. Biotechnol. 85, 175–185. doi:10.1016/S0168-1656(00)00365-5
Grünberger, A., Paczia, N., Probst, C., Schendzielorz, G., Eggeling, L., Noack, S., et al. (2012). A Disposable Picolitre Bioreactor for Cultivation and Investigation of Industrially Relevant Bacteria on the Single Cell Level. Lab. Chip 12, 2060–2068. doi:10.1039/C2LC40156H
Grünberger, A., Probst, C., Helfrich, S., Nanda, A., Stute, B., Wiechert, W., et al. (2015). Spatiotemporal Microbial Single-Cell Analysis Using a High-Throughput Microfluidics Cultivation Platform. Cytometry 87, 1101–1115. doi:10.1002/cyto.a.22779
Grünberger, A., van Ooyen, J., Paczia, N., Rohe, P., Schiendzielorz, G., Eggeling, L., et al. (2013). Beyond Growth Rate 0.6: Corynebacterium Glutamicum Cultivated in Highly Diluted Environments. Biotechnol. Bioeng. 110, 220–228. doi:10.1002/bit.24616
Grünberger, A., Wiechert, W., and Kohlheyer, D. (2014). Single-Cell Microfluidics: Opportunity for Bioprocess Development. Curr. Opin. Biotechnol. 29, 15–23. doi:10.1016/j.copbio.2014.02.008
Hajian, C., Haringa, C., Noorman, H., and Takors, R. (2020). Predicting By-Product Gradients of Baker's Yeast Production at Industrial Scale: A Practical Simulation Approach. Processes 8, 1554. doi:10.3390/pr8121554
Hajian, C. S. S., Zieringer, J., and Takors, R. (2021). Euler-Lagrangian Simulations: A Proper Tool for Predicting Cellular Performance in Industrial Scale Bioreactors. Cham: Springer International Publishing, 229–254. doi:10.1007/10_2020_133
Haringa, C., Deshmukh, A. T., Mudde, R. F., and Noorman, H. J. (2017). Euler-Lagrange Analysis towards Representative Down-Scaling of a 22 M3 Aerobic s. cerevisiae Fermentation. Chem. Eng. Sci. 170, 653–669. doi:10.1016/j.ces.2017.01.014
Haringa, C., Mudde, R. F., and Noorman, H. J. (2018a). From Industrial Fermentor to Cfd-Guided Downscaling: What Have We Learned? Biochem. Eng. J. 140, 57–71. doi:10.1016/j.bej.2018.09.001
Haringa, C., Tang, W., Deshmukh, A. T., Xia, J., Reuss, M., Heijnen, J. J., et al. (2016). Euler-Lagrange Computational Fluid Dynamics for (Bio)reactor Scale Down: An Analysis of Organism Lifelines. Eng. Life Sci. 16, 652–663. doi:10.1002/elsc.201600061
Haringa, C., Tang, W., Wang, G., Deshmukh, A. T., van Winden, W. A., Chu, J., et al. (2018b). Computational Fluid Dynamics Simulation of an Industrial P. Chrysogenum Fermentation with a Coupled 9-Pool Metabolic Model: Towards Rational Scale-Down and Design Optimization. Chem. Eng. Sci. 175, 12–24. doi:10.1016/j.ces.2017.09.020
Ho, P., Westerwalbesloh, C., Kaganovitch, E., Grünberger, A., Neubauer, P., Kohlheyer, D., et al. (2019). Reproduction of Large-Scale Bioreactor Conditions on Microfluidic Chips. Microorganisms 7, 105. doi:10.3390/microorganisms7040105
Hornung, R., Grünberger, A., Westerwalbesloh, C., Kohlheyer, D., Gompper, G., and Elgeti, J. (2018). Quantitative Modelling of Nutrient-Limited Growth of Bacterial Colonies in Microfluidic Cultivation. J. R. Soc. Interf. 15, 20170713. doi:10.1098/rsif.2017.0713
Jurtshuk, P. J. (1996). Bacterial Metabolism. Galveston, Texas: University of Texas Medical Branch at Galveston. Chapter 4.
Kaganovitch, E., Steurer, X., Dogan, D., Probst, C., Wiechert, W., and Kohlheyer, D. (2018). Microbial Single-Cell Analysis in Picoliter-Sized Batch Cultivation chambers. New Biotechnol. 47, 50–59. doi:10.1016/j.nbt.2018.01.009
Käß, F., Hariskos, I., Michel, A., Brandt, H.-J., Spann, R., Junne, S., et al. (2014). Assessment of Robustness against Dissolved Oxygen/substrate Oscillations for C. Glutamicum Dm1933 in Two-Compartment Bioreactor. Bioproc. Biosyst Eng 37, 1151–1162. doi:10.1007/s00449-013-1086-0
Kelly, W. J. (2008). Using Computational Fluid Dynamics to Characterize and Improve Bioreactor Performance. Biotechnol. Appl. Biochem. 49, 225–238. doi:10.1042/BA20070177
Kovárová-Kovar, K., and Egli, T. (1998). Growth Kinetics of Suspended Microbial Cells: From Single-Substrate-Controlled Growth to Mixed-Substrate Kinetics. Microbiol. Mol. Biol. Rev. 62, 646–666. doi:10.1128/MMBR.62.3.646-666.1998
Kuschel, M., Siebler, F., and Takors, R. (2017). Lagrangian Trajectories to Predict the Formation of Population Heterogeneity in Large-Scale Bioreactors. Bioengineering 4, 27. doi:10.3390/bioengineering4020027
Kuschel, M., and Takors, R. (2020). Simulated Oxygen and Glucose Gradients as a Prerequisite for Predicting Industrial Scale Performance A Priori. Biotechnol. Bioeng. 117, 2760–2770. doi:10.1002/bit.27457
Lapin, A., Müller, D., and Reuss, M. (2004). Dynamic Behavior of Microbial Populations in Stirred Bioreactors Simulated with Euler−Lagrange Methods: Traveling along the Lifelines of Single Cells. Ind. Eng. Chem. Res. 43, 4647–4656. doi:10.1021/ie030786k
Lara, A. R., Galindo, E., Ramírez, O. T., and Palomares, L. A. (2006). Living with Heterogeneities in Bioreactors: Understanding the Effects of Environmental Gradients on Cells. Mol. Biotechnol. 34 (3), 355–382. doi:10.1385/mb:34:3:355
Lara, A. R., Taymaz-Nikerel, H., Mashego, M. R., van Gulik, W. M., Heijnen, J. J., Ramírez, O. T., et al. (2009). Fast Dynamic Response of the Fermentative Metabolism of Escherichia Colito Aerobic and Anaerobic Glucose Pulses. Biotechnol. Bioeng. 104, 1153–1161. doi:10.1002/bit.22503
Larsson, G., Törnkvist, M., Wernersson, E. S., Trägårdh, C., Noorman, H., and Enfors, S. O. (1996). Substrate Gradients in Bioreactors: Origin and Consequences. Bioproc. Eng. 14, 281–289. doi:10.1007/BF00369471
Lauterbach, T., Lüke, T., Büker, M.-J., Hedayat, C., Gernandt, T., Moll, R., et al. (2019). Measurements on the Fly- Introducing mobile Micro-sensors for Biotechnological Applications. Sensors Actuators A: Phys. 287, 29–38. doi:10.1016/j.sna.2019.01.003
Lee, H.-W., Pan, J.-G., and Lebeault, J.-M. (1998). Enhanced L -lysine Production in Threonine-Limited Continuous Culture of Corynebacterium Glutamicum by Using Gluconate as a Secondary Carbon Source with Glucose. Appl. Microbiol. Biotechnol. 49, 9–15. doi:10.1007/s002530051130
Lemoine, A., Maya Martίnez-Iturralde, N., Spann, R., Neubauer, P., and Junne, S. (2015). Response ofCorynebacterium Glutamicumexposed to Oscillating Cultivation Conditions in a Two- and a Novel Three-Compartment Scale-Down Bioreactor. Biotechnol. Bioeng. 112, 1220–1231. doi:10.1002/bit.25543
Limberg, M. H., Pooth, V., Wiechert, W., and Oldiges, M. (2016). Plug Flow versus Stirred Tank Reactor Flow Characteristics in Two-Compartment Scale-Down Bioreactor: Setup-Specific Influence on the Metabolic Phenotype and Bioprocess Performance ofCorynebacterium Glutamicum. Eng. Life Sci. 16, 610–619. doi:10.1002/elsc.201500142
Lu, L., Mao, Y., Kou, M., Cui, Z., Jin, B., Chang, Z., et al. (2020). Engineering central Pathways for Industrial-Level (3r)-Acetoin Biosynthesis in Corynebacterium Glutamicum. Microb. Cel Fact 19, 102. doi:10.1186/s12934-020-01363-8
Morchain, J., Gabelle, J.-C., and Cockx, A. (2014). A Coupled Population Balance Model and Cfd Approach for the Simulation of Mixing Issues in Lab-Scale and Industrial Bioreactors. Aiche J. 60, 27–40. doi:10.1002/aic.14238
Nadal-Rey, G., McClure, D. D., Kavanagh, J. M., Cornelissen, S., Fletcher, D. F., and Gernaey, K. V. (2021). Understanding Gradients in Industrial Bioreactors. Biotechnol. Adv. 46, 107660. doi:10.1016/j.biotechadv.2020.107660
Neubauer, P., and Junne, S. (2010). Scale-Down Simulators for Metabolic Analysis of Large-Scale Bioprocesses. Curr. Opin. Biotechnol. 21, 114–121. doi:10.1016/j.copbio.2010.02.001
Noorman, H. (2011). An Industrial Perspective on Bioreactor Scale-Down: What We Can Learn from Combined Large-Scale Bioprocess and Model Fluid Studies. Biotechnol. J. 6, 934–943. doi:10.1002/biot.201000406
Ortseifen, V., Viefhues, M., Wobbe, L., and Grünberger, A. (2020). Microfluidics for Biotechnology: Bridging Gaps to foster Microfluidic Applications. Front. Bioeng. Biotechnol. 8, 589074. doi:10.3389/fbioe.2020.589074
Reinecke, S., Deutschmann, A., Jobst, K., Kryk, H., Friedrich, E., and Hampel, U. (2012). Flow Following Sensor Particles-Validation and Macro-Mixing Analysis in a Stirred Fermentation Vessel with a Highly Viscous Substrate. Biochem. Eng. J. 69, 159–171. doi:10.1016/j.bej.2012.09.010
Scargiali, F., D’Orazio, A., Grisafi, F., and Brucato, A. (2007). Modelling and Simulation of Gas-Liquid Hydrodynamics in Mechanically Stirred Tanks. Chem. Eng. Res. Des. 85, 637–646. doi:10.1205/cherd06243
Schindelin, J., Arganda-Carreras, I., Frise, E., Kaynig, V., Longair, M., Pietzsch, T., et al. (2012). Fiji: An Open-Source Platform for Biological-Image Analysis. Nat. Methods 9, 676–682. doi:10.1038/nmeth.2019
Spann, R., Glibstrup, J., Pellicer-Alborch, K., Junne, S., Neubauer, P., Roca, C., et al. (2019). Cfd Predicted Ph Gradients in Lactic Acid Bacteria Cultivations. Biotechnol. Bioeng. 116, 769–780. doi:10.1002/bit.26868
Sticker, D., Rothbauer, M., Ehgartner, J., Steininger, C., Liske, O., Liska, R., et al. (2019). Oxygen Management at the Microscale: A Functional Biochip Material with Long-Lasting and Tunable Oxygen Scavenging Properties for Cell Culture Applications. ACS Appl. Mater. Inter. 11, 9730–9739. doi:10.1021/acsami.8b19641
Sweere, A. P. J., Luyben, K. C. A. M., and Kossen, N. W. F. (1987). Regime Analysis and Scale-Down: Tools to Investigate the Performance of Bioreactors. Enzyme Microb. Technol. 9, 386–398. doi:10.1016/0141-0229(87)90133-5
Täuber, S., Blöbaum, L., Steiner, V., Oldiges, M., and Grünberger, A. (2021a). Microfluidic Single-Cell Scale-Down Bioreactors: A Proof of Concept for Growth of Corynebacterium Glutamicum at Oscillating Ph Values. bioRxiv In submission. doi:10.1101/2021.12.30.474512
Täuber, S., Blöbaum, L., Wendisch, V. F., and Grünberger, A. (2021b). Growth Response and Recovery of Corynebacterium Glutamicum Colonies on Single-Cell Level upon Defined Ph Stress Pulses. Front. Microbiol. 12, 711893. doi:10.3389/fmicb.2021.711893
Täuber, S., Golze, C., Ho, P., von Lieres, E., and Grünberger, A. (2020). Dmscc: A Microfluidic Platform for Microbial Single-Cell Cultivation of Corynebacterium Glutamicum under Dynamic Environmental Medium Conditions. Lab. Chip 20, 4442–4455. doi:10.1039/D0LC00711K
Templer, R. H., and Ces, O. (2008). New Frontiers in Single-Cell Analysis. J. R. Soc. Interf. 5, S111–S112. doi:10.1098/rsif.2008.0279.focus
Unthan, S., Grünberger, A., van Ooyen, J., Gätgens, J., Heinrich, J., Paczia, N., et al. (2014). Beyond Growth Rate 0.6: What Drives Corynebacterium Glutamicum to Higher Growth Rates in Defined Medium. Biotechnol. Bioeng. 111, 359–371. doi:10.1002/bit.25103
van Bodegom, P. (2007). Microbial Maintenance: A Critical Review on its Quantification. Microb. Ecol. 53, 513–523. doi:10.1007/s00449-013-1086-010.1007/s00248-006-9049-5
Versteeg, H. K., and Malalasekera, W. (2007). An Introduction to Computational Fluid Dynamics. Harlow, England: Pearson.
Yang, D., Jennings, A. D., Borrego, E., Retterer, S. T., and Männik, J. (2018). Analysis of Factors Limiting Bacterial Growth in Pdms Mother Machine Devices. Front. Microbiol. 9, 871. doi:10.3389/fmicb.2018.00871
Zieringer, J., Wild, M., and Takors, R. (2021). Data‐Driven In Silico Prediction of Regulation Heterogeneity and ATP Demands of Escherichia C in Large‐Scale Bioreactors. Biotechnol. Bioeng. 118, 265–278. doi:10.1002/bit.27568
Glossary
ATP Adenosine Triphosphate
CDW Cell dry weight
CFD Computational Fluid Dynamics
dMSCC Dynamic Microfluidic Single-Cell Cultivation
DNS Direct Numerical Simulation
DO Dissolved oxygen
FR Frozen Rotor
LES Large Eddy Simulation
LL Lifeline
MOPS 3-(N-morpholino)propanesulfonic acid
MRF Multiple Reference Frame
MSCC Microfluidic single-cell cultivation
OD Optical density
PCA Protocatechuate
PDMS Polydimethylsiloxane
PFR Plug flow reactor
RANS Reynolds-Averaged Navier-Stokes
rpm rounds per minute
SM Sliding Mesh
STR Stirred Tank Reactor
vvm Volume air per volume liquid per minute
WT Wild-type
μL Liquid viscosity (Pa s)
μ growth rate (h-1)
ν Kinematic viscosity (m2 s−1)
ρ Liquid density (kg m−3)
ɛ (Turbulent) Dissipation rate (m2 s−3)
C Clearance (m)
cS Substrate concentration (g m−3)
cX Biomass concentration (g m−3)
D Diffusion coefficient (m2 s−1)
d Impeller diameter (m)
db Mean bubble diameter (mm)
F Feeding rate of substrate (gS h−1)
H Reactor height (m)
h Aeration ring height (m)
k (Turbulent) Kinematic energy (m2 s−2)
kLa Volumetric mass transfer coefficient (h−1)
KS Half-velocity constant (g L−1)
Mg Gas molecular weight (kg mol−1)
N Agitation rate (s−1)
Qg Gassing rate (Nm3 h−1 or vvm)
qS, max Maximum substrate uptake rate (g m−3 s−1)
qS Substrate uptake rate (g m−3 s−1)
r Inlet radius (m)
ScT Turbulent Schmidt number (1)
T Reactor diameter (m)
tRing Aeration ring diameter (m)
V Reactor liquid volume (m3)
Keywords: large-scale bioreactor, heterogeneous environment, Corynebacterium glutamicum, computational fluid dynamics, cellular lifeline, microfluidic cultivation, growth rate
Citation: Ho P, Täuber S, Stute B, Grünberger A and von Lieres E (2022) Microfluidic Reproduction of Dynamic Bioreactor Environment Based on Computational Lifelines. Front. Chem. Eng. 4:826485. doi: 10.3389/fceng.2022.826485
Received: 30 November 2021; Accepted: 17 February 2022;
Published: 31 March 2022.
Edited by:
Luis H. Reyes, University of Los Andes, ColombiaReviewed by:
Helena Junicke, Technical University of Denmark, DenmarkChristos Chatzidoukas, Aristotle University of Thessaloniki, Greece
Copyright © 2022 Ho, Täuber, Stute, Grünberger and von Lieres. This is an open-access article distributed under the terms of the Creative Commons Attribution License (CC BY). The use, distribution or reproduction in other forums is permitted, provided the original author(s) and the copyright owner(s) are credited and that the original publication in this journal is cited, in accordance with accepted academic practice. No use, distribution or reproduction is permitted which does not comply with these terms.
*Correspondence: Alexander Grünberger, alexander.gruenberger@uni-bielefeld.de; Eric von Lieres, e.von.lieres@fz-juelich.de
†These authors have contributed equally to this work