Oxygen Modulates the Effectiveness of Granuloma Mediated Host Response to Mycobacterium tuberculosis: A Multiscale Computational Biology Approach
 Cheryl L. Sershen
 Steven J. Plimpton2
  Elebeoba E. May
- 1Department of Biomedical Engineering, University of Houston, Houston, TX, USA
- 2Center for Computing Research, Sandia National Laboratories, Albuquerque, NM, USA
Mycobacterium tuberculosis associated granuloma formation can be viewed as a structural immune response that can contain and halt the spread of the pathogen. In several mammalian hosts, including non-human primates, Mtb granulomas are often hypoxic, although this has not been observed in wild type murine infection models. While a presumed consequence, the structural contribution of the granuloma to oxygen limitation and the concomitant impact on Mtb metabolic viability and persistence remains to be fully explored. We develop a multiscale computational model to test to what extent in vivo Mtb granulomas become hypoxic, and investigate the effects of hypoxia on host immune response efficacy and mycobacterial persistence. Our study integrates a physiological model of oxygen dynamics in the extracellular space of alveolar tissue, an agent-based model of cellular immune response, and a systems biology-based model of Mtb metabolic dynamics. Our theoretical studies suggest that the dynamics of granuloma organization mediates oxygen availability and illustrates the immunological contribution of this structural host response to infection outcome. Furthermore, our integrated model demonstrates the link between structural immune response and mechanistic drivers influencing Mtbs adaptation to its changing microenvironment and the qualitative infection outcome scenarios of clearance, containment, dissemination, and a newly observed theoretical outcome of transient containment. We observed hypoxic regions in the containment granuloma similar in size to granulomas found in mammalian in vivo models of Mtb infection. In the case of the containment outcome, our model uniquely demonstrates that immune response mediated hypoxic conditions help foster the shift down of bacteria through two stages of adaptation similar to thein vitro non-replicating persistence (NRP) observed in the Wayne model of Mtb dormancy. The adaptation in part contributes to the ability of Mtb to remain dormant for years after initial infection.
Introduction
Tuberculosis (TB) disease, caused by the bacilli Mycobacterium tuberculosis (Mtb), remains a major global health concern, with an estimated 8.6 million infected globally and 1.2 million Mtb related deaths in 2012 (World Health Organization, 2013). After inhalation of Mtb in the form of microdroplet nuclei, the bacteria are phagocytized by lung alveolar macrophages. An initial innate immune response ensues followed by presentation of Mtb antigens by professional antigen presenting cells (e.g., macrophage and dendritic cells) to lymphocytes, leading to cell-mediated immune response. Immune response to Mtb infection is characterized by sequential recruitment of leukocytes such as T, B, and NK cells as well as uninfected macrophages to the site of infection (Co, 2004). In the event that immune cells are unable to eliminate the infection (clearance scenario), these cells attempt to contain the spread of infection by aggregating in multiple layers around the infected host cell leading to the formation of granulomatous structures (containment scenario). In the event, that the host fails to clear or contain the pathogen, Mtb can spread, infecting other cells, tissues, and organs (dissemination scenario).
A granuloma can be viewed as an equilibrium state where the host contains the infection while the pathogen persists by transitioning into a dormant or latent state, resulting in latent TB infection (LTBI). The WHO estimates one-third of all individuals have LTBI, with the risk of reactivation to active disease ranging from 5 to 20% depending on the health of the individual (World Health Organization, 2013). Within human pulmonary macrophages and granuloma structures, Mtb is believed to be in a microenvironment that has diminished oxygen availability and increased nitric oxide (NO) concentrations (Gomez and McKinney, 2004; Shiloh et al., 2008). The physical structure of the granuloma with a central focus of Mtb infection surrounded by multiple layers of epithelioid cells and a mantle of lymphocytes is likely a key contributing factor to the depletion of oxygen in the in vivo microenvironment of Mtb (Via et al., 2008). How oxygen depletion within the granuloma microenvironment influences Mtb proliferation and persistence is important to understanding and ultimately treating LTBI.
The role of host response mediated oxygen depletion on Mtb survival has been the focus of several empirical studies, most notably the Wayne model of non-replicating persistence (NRP) which provided an in vitro platform for analyzing Mtbs metabolic response to oxygen depletion (Wayne and Hayes, 1996; Voskuil et al., 2004; Shiloh et al., 2008; Deb et al., 2009). To effectively treat Mtb and LTBI, increased understanding of the multiscale mechanistic impact of host biochemical and physiological immune response on Mtb metabolic viability is necessary to identify possible molecular targets that impact infection outcome. In this work, we focus on understanding the contribution of the granuloma in dynamic modulation of the microenvironment of Mtb, and Mtbs response as evidenced by the pathogens consequential elimination, containment, or dissemination.
While there are well-established computational models of infection, most notably Segovia-Juarez et al. (2004) and Ray et al. (2009), the majority of existing models do not explicitly consider or investigate the role of oxygen on infection outcome and disease. Integrating in vitro and in vivo empirical data, several agent based models (ABM) of tuberculosis infection have been developed and used to capture the spatio-temporal dynamics of granuloma formation in humans and the impact of TNF-α (tumor necrosis factor) on Mtb within a single granuloma (Segovia-Juarez et al., 2004; Warrender et al., 2006; Ray et al., 2009; Fallahi-Schani et al., 2011; Marino et al., 2011). In these models of TB infection, cellular entities (macrophages at various stages of infection, inflammatory T cells, cytotoxic T-lymphocytes, T regulatory cells) are represented as discrete elements or agents. Chemokines, cytokines such as TNF-α, and extracellular Mtb are modeled using continuous valued fields. Recent extensions to the TB ABM models include the expansion of the macrophage rule based model into a systems biology based model that includes the signal transduction mediated response of the host to cytokines in the extracellular compartment (Cilfone et al., 2013). An advancement needed in the ABM modeling approach is incorporation of variables describing physiological changes in the lung parenchyma and explicit consideration of Mtb biochemical dynamics to capture the metabolic response of the pathogen to the host modulated microenvironment.
Recently Datta et al. (2015) developed an empirical-based model of an idealized granuloma that captures oxygen transport and consumption using Michaelis–Menten based kinetic approximations. Their model was used to predict the size and shape of granulomas, and outcomes were comparable to in vivo rabbit models of disease. However, to our knowledge there is not yet an in silico study that fully links host physiological response and oxygen availability, with the dynamics of molecular and cellular mechanisms in order to establish that the environment of the caseous granulomas is hypoxic in humans. Using computation and simulated results, we demonstrate how hypoxia can occur in the human response to granuloma formation by considering oxygen levels, diffusion dynamics, and cellular interactions prevailing in the human lung. The dynamic genetic and metabolic adaptation of Mtb captured in our model helps explain how the pathogens biochemical response enables transition to long-term dormancy after initial infection, something that has not yet been demonstrated in existing models.
In the sections that follow we describe the model development process, including modeling of oxygen dynamics in the human lung, and the integration of the ABM and systems biology based model of Mtb. We present results of using our integrated model to simulate and study oxygen dynamics during tuberculosis infection and granuloma formation. In the final sections we conclude with a discussion of the mechanistic contribution of host physiological response to the development of hypoxia and the outcome of infection in human tuberculosis.
Materials and Methods
Integrated Multiscale Model
Multiscale modeling has become increasingly necessary in computational biology in order to capture dynamics occurring at the diverse biological length and time scales germane to living systems. To study the impact of changes in the host physiological environment on Mtb persistence we developed ABM-PHYS, an integrated multiscale model of host physiological and immunological response to Mtb infection. Schema of the ABM-PHYS Model. Figure 1 outlines the structure and computational flow of the integrated ABM-PHYS model of TB granuloma formation. The model is comprised of three main components:
• ABM simulator developed using a Python-based software platform with C++ kernels to increase the speed of solving transient finite-difference diffusion equations;
• Octave routines to numerically solve the steady-state floating-point oxygen field;
• BioXyce, a systems biology modeling platform that solves a series of ODEs that determine substrate levels, overall microbial fitness and adenosine triphosphate (ATP) levels for the bacterial population in each ABM-PHYS grid cell (extracellular) or internally within a macrophage (intracellular). BioXyce enables parallel execution of Mtb systems biology models.
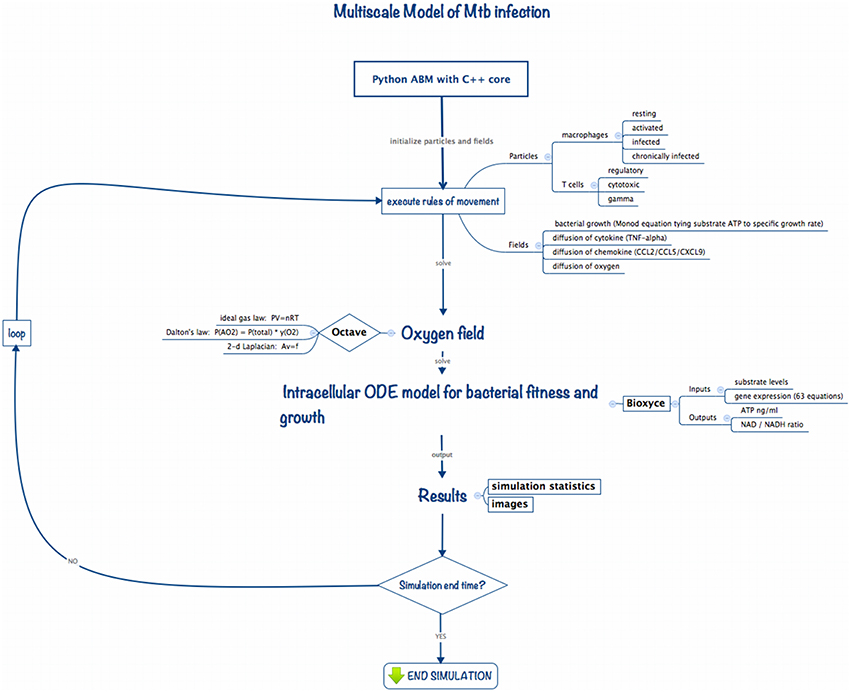
Figure 1. Implementation schema for the integrated multiscale model of Mtb infection.
During an iteration of the model the ABM moves and updates cellular-scale particles (immune cells, bacterial populations), and recalculates cytokine and chemokine fields according to deterministic or probabilistic rules and analytical equations of state. The states of agents (host cells) in the model are updated, with each macrophage characterized based on its relative bacterial load and activation state as resting, infected, chronically infected or activated. The cell state can change due to interactions with environmental cytokines and chemokines, biological cells in neighboring grid cells, or due to the presence of bacteria in the macrophage's grid cell. These transitions are encoded as probabilistic or deterministic rules. The current state of a macrophage determines its immune response as well as its lifespan, which is tracked by an internal timer associated with each macrophage (and T cell).
We use an Octave-based routine (Eaton et al., 2014) to model and generate the steady state solution to the diffusion and uptake equation, and to calculate the dispersal for the updated oxygen concentrations on the cellular grid. Based on the oxygen levels in the extracellular environment or within the macrophage intracellular environment, the BioXyce-based systems biology model of bacterial response determines ATP levels and metabolic fitness variables (NAD/NADH ratio) for Mtb, which are used to calculate bacterial growth rates (via a Monod equation). This cycle is repeated to model the time evolution of the system. In the remainder of this section we describe the components of the model and how they interconnect to form the integrated ABM-PHYS multiscale model.
Agent-Based Model (ABM)
In order to incorporate spatiotemporal varying physiological and bacterial response into current in silico TB modeling methodologies we developed an integrable ABM platform. Using rules from published in silico models we implemented a standard TB ABM (ABM-ST) to verify the functionality of our Python-based simulation platform (Segovia-Juarez et al., 2004; Ray et al., 2009). While non-trivial and not the focus of this work, re-implementation of the standard TB ABM provided a comparative control for our in silico studies. We expanded on the standard TB ABM and designed a multiscale integrated model, ABM-PHYS, composed of an agent-based model to account for cellular-level host-pathogen interactions, a floating-point field model to represent spatiotemporal physiological changes in oxygen levels in the alveolar space, and multiple continuous valued fields to represent cytokine/chemokine gradients (TNF-α, CCL2, CCL5, CXCL9/10/11) in the extracellular space (Figure 1). We coupled our ABM to an ordinary differential equation (ODE) based dynamic systems biology model of Mtb metabolic pathways important in cellular respiration and energy (i.e., ATP) production, which we implemented using the BioXyce biological simulation platform (May and Schiek, 2009; May et al., 2013). (For notational distinction we will refer to the re-implemented standard agent based model of TB as ABM-ST and our extended model with the integrated physiological oxygen and Mtb systems biology models as ABM-PHYS. Both the re-implemented and our extended model are multiscale in nature.)
We developed our core ABM in the manner of Segovia-Juarez et al. (2004) and Ray et al. (2009) using the supplementary Materials and rules from the Ray et al. model (included in Ray et al., 2009 Supplement 1). As shown in Table 2, general parameters and parameter relationships for ABM-ST were implemented as reported in Ray et al. (2009) (Tables I–III, respective). We extended the ABM-ST framework to accommodate oxygen supply and consumption and included oxygen specific rules for cellular entities (see Appendices 1.2, 2, and 3 for new model rules implemented). We developed a host–pathogen interface module that translates grid-specific microenvironmental changes and Mtb metabolic state into pathogen specific gene regulation, thus enabling integration of the systems biology models of bacterial metabolism and growth [measured in colony forming units (CFUs)] with the ABM. The overall integrated, framework can thus be used as a multiscale model to capture the process of initial infection, host immune modulated physiological response, granuloma formation, and disease progression in a pulmonary tissue sample. The details of both the oxygen and intracellular extensions are described in the sub-sections that follow.
Modeling the extracellular microenvironment
The ABM treats two-dimensional (2D) space as a regular 2D grid. An individual grid point thus represents a small area or volume (in the case of 3D) of space, which can contain one or more cells of different types, e.g., macrophages, T-cells, bacteria. The two-dimensional computational model represents a 2 × 2 mm section of lung parenchyma, with 20 × 20 μm sized single grid cells (large enough to support the cell size of the largest agent, the macrophage) for a total of 10,000 grid cells. A grid cell may contain either 1 macrophage, a macrophage and a T cell, or two T cells, and up to 200 bacteria.
All of the parameters governing cell motion, the cell cycle (reproduction, infection, dying), and cell/cell interactions are encoded as heuristic rules with empirically-based parameters (see Tables 1–3). Diffusion equations capture the increase (production by either macrophages, T cells and bacteria), degradation (half-life), and diffusion of continuous-valued concentration species. Host cells secrete chemokines and cytokines depending on their state (e.g., CCL2, CCL5, CXCL9/10/11, and TNF-α), and bacteria secrete chemotactic factors or chemo-attractants that attract macrophages and T cells to their location. As cells in the model produce or consume chemokines and cytokines, the local concentration of species in their neighborhood affects movement of surrounding cells and attracts other cells to the site of infection or granuloma. There are sources and sinks for each species in the model, with the species represented as floating-point fields on the grid and their spatiotemporal diffusion equation defined as in Equation 1 below.
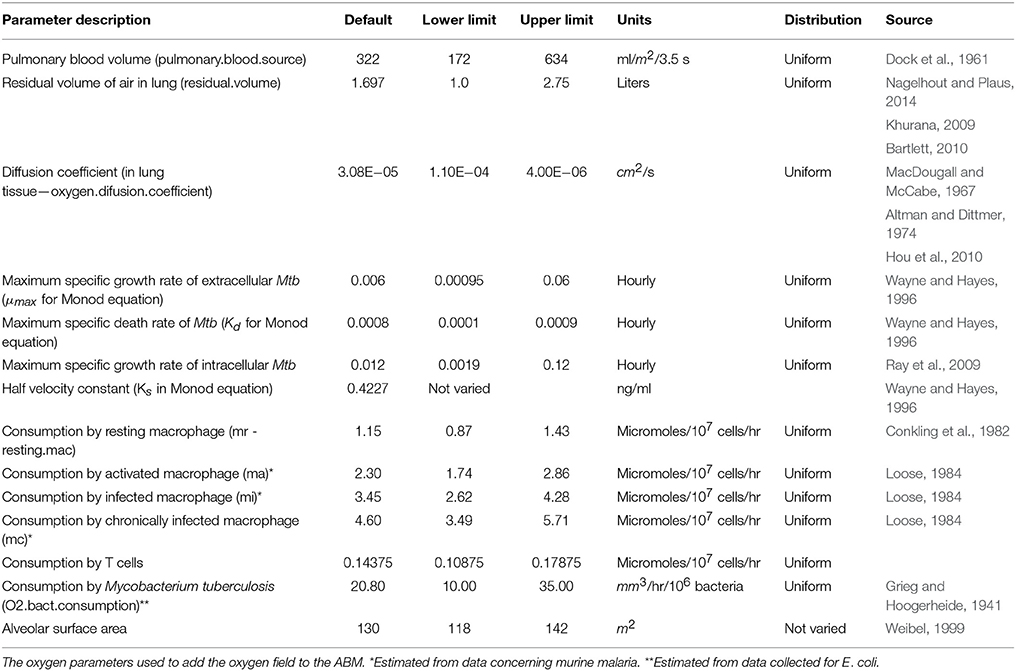
Table 1. Oxygen parameters used in the integrated multiscale ABM.
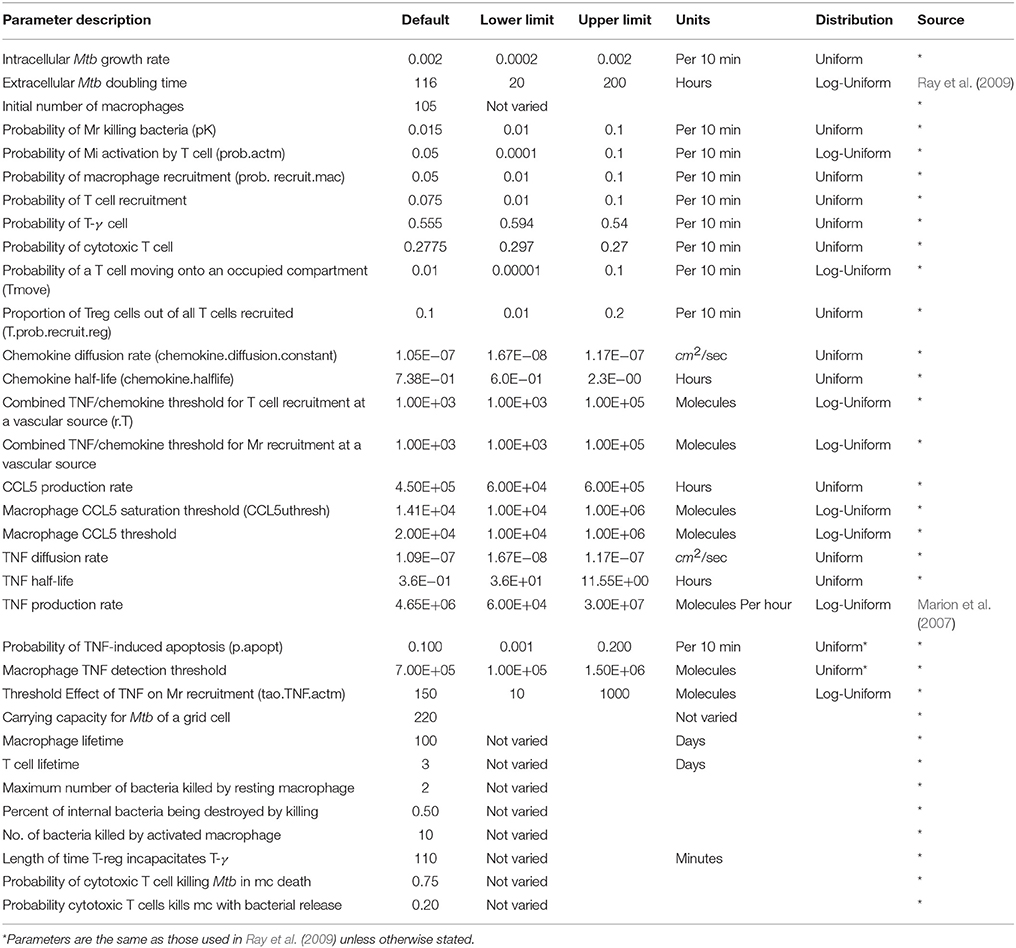
Table 2. Model parameters used for the standard and integrated ABM.
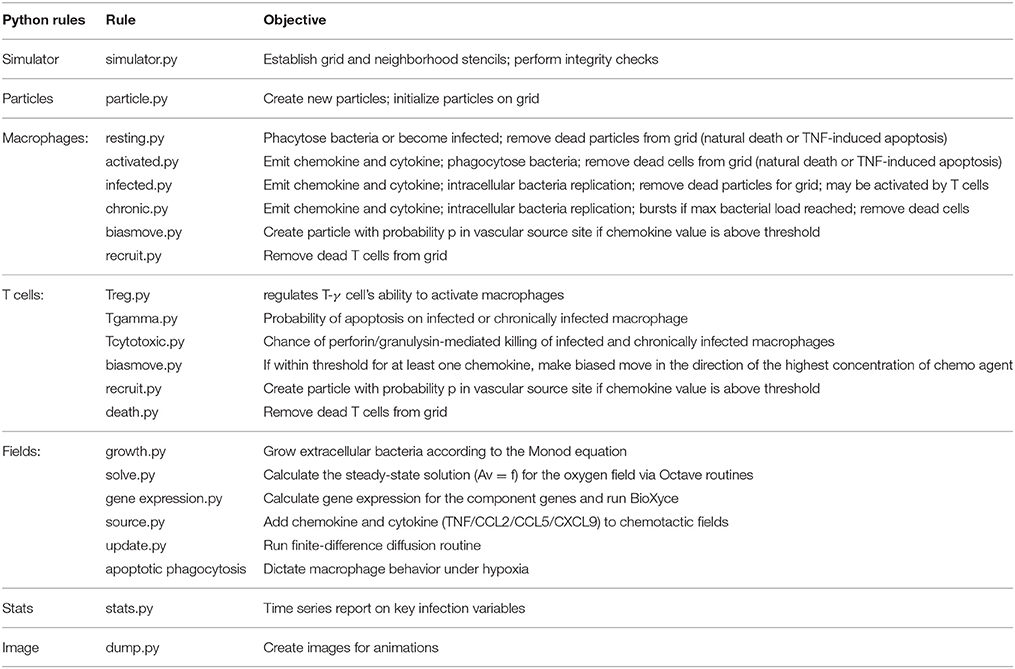
Table 3. Summary of the Python modules developed for the multiscale simulator.
In Equation (1) u(x, y, t) is the concentration of the species at the grid point (x, y) at time t, D is the diffusion coefficient, and g(x, y, t) represents the source or sink function.
The diffusion equation is solved as a two-dimensional, second order, parabolic diffusion (heat) equation using an explicit finite difference method, which updates all the grid cells at each time step. For efficiency, this operation is performed with a custom C-routine called by the core ABM component, which is implemented in Python. Using the Courant stability criterion for solving diffusion equations on a grid of a given resolution, we chose the size of the time step for evolving the ABM-PHYS model based on the timescale required to track the most rapidly diffusing extracellular species in our model, which was oxygen. Rules that operate on a slower timescale (e.g., diffusion of large cells) are only invoked once every tens or hundreds of time steps. We set our time step to 4 s (average length of 1 breath) and updated the grid every 10 minutes of clock time, except for the oxygen field, which is solved every 18 h.
Modeling Oxygen Dynamics in the Lung
We derived steady state oxygen levels for oxygen entering the system from two sources, the residual volume in the lung and the pulmonary blood volume, based on the ideal gas law:
where P and V represent pressure and volume, n, R, and T represent moles of oxygen, ideal gas constant, and temperature, respective. Using the ideal gas law we calculate the amount of oxygen available at the boundary (source) cells and each sink cell on the grid. Source cells are either grid cells located on the periphery (residual oxygen in the lung) or randomly distributed within the interior of the grid (pulmonary blood volume). Sink cells are grid cells where macrophage, extracellular bacteria, or T cells reside. A sample calculation is presented in Appendix 2 in Supplementary Material (See Sershen et al., 2014 Section Materials and Methods for an extended discussion of the implementation of the oxygen field).
We compute the drop in partial pressure of oxygen for the 2 × 2 mm parenchymal section in order to calculate oxygen levels and determine the occurrence of hypoxia during the course of our simulation model. We assume that the overall partial pressure change in the lung alveoli is negligible. This means that overall the pressure remains at the rate of a healthy male (≈ 99.7–105 mmHg) but the drop in partial pressure over the individual grid cells and granuloma aggregates are computed. We also assume that the drop in the partial pressure of oxygen in the alveoli (PAO2) is directly proportional to the mole fraction of oxygen in alveolar tissue (yO2), as per Dalton's law of partial pressure:
We use the computed mole fraction of oxygen in alveolar tissue (yO2) to determine the amount of O2 flowing in from source grid cells in our model.
We implement oxygen diffusion within the grid as a floating-point field in our ABM-PHYS model in the manner described in Sershen et al. (2014). The spatial and time dependence of the concentration is represented by the diffusion equation (Equation 1) with Dirichlet boundary conditions. In our model, grid cells that contain macrophages, T cells or bacteria that consume oxygen are sinks. Boundary grid cells, which receive an influx of oxygen from adjacent tissue, are sources. Because oxygen diffuses quickly (D≈3.08e−5 in lung tissue Hou et al., 2010), accurately tracking transient variations in oxygen concentration would require a time step equal to 0.032 s to satisfy the Courant–Friedrichs–Lewy (CFL) condition for an explicit finite-difference method (Sershen et al., 2014). However, for our model we are mainly interested in the quasi-static oxygen concentration profile, which assumes the concentration quickly comes to equilibrium with any change in the sources and sinks. Therefore, we consider steady-state levels of oxygen in and through the lung parenchyma derived from the net amount left in tissue deposits due to respiration and the amount of oxygen available from pulmonary blood volume (see Table 1). Given that the overall change in spatial distribution of O2 sources and sinks is relatively slow compared to the rate of oxygen diffusion, as the ABM evolves we solve and update the oxygen concentration profile once every 18 h, which is a much longer timescale than the timescale for diffusion. Numerically, this is accomplished by dropping the time-dependent left-hand-side of the diffusion equation (Equation 1) and solving the resulting matrix equation D*Au = g, where A is a sparse matrix representing the connectivity of the grid cells (five point stencil in 2D), u is the concentration vector (one unknown for each of the 1002 grid cells), and g is the source/sink vector for each grid cell. The matrix equation can be solved efficiently using iterative conjugate gradient methods (Calvert, 2014), available in GNU Octave.
Oxygen tension or the partial pressure of oxygen in the blood in well-irrigated human parenchymal tissue is generally between and 14% (30–106 mmHg; Iovanic, 2009) of atmospheric pressure, In hypoxic tissue the oxygen tension is generally below 2% (15 mmHg; Lewis et al., 1999). We characterized hypoxia in our simulated ABM-PHYS granuloma as oxygen tension less than two percent. We could thus determine whether a granuloma contained hypoxic areas and/or anoxic areas (0 % oxygen). The oxygen parameters in Table 1 represent the steady state oxygen levels for a range of air intake values (12–20 breaths per minute; Silverthorn, 2013). These were varied within the biological ranges shown in Table 1 in the sensitivity analysis.
Expanding the cellular response models to account for oxygen dynamics
Consumption of oxygen is based on the number and type of macrophages, T cells and bacteria present within a grid cell. Oxygen consumption values for bacteria are based on data from E. coli (Grieg and Hoogerheide, 1941). Activated and infected macrophages consume more oxygen than resting macrophages, with infected macrophages consuming up to 12 times more oxygen (Loose, 1984). To approximate state-dependent oxygen consumption rates for macrophages in our model, we assume that activated macrophages consume twice that of resting macrophages, infected macrophages consume three times more oxygen than resting macrophages and that chronically infected macrophages consume four times more oxygen than resting macrophages. Since T cells are approximately 1/8 the volume of the macrophage, they consume 1/8 the amount of oxygen of resting macrophages.
We added rule-based mechanisms to reflect macrophage response to oxygen dynamics in the host environment and within containment granulomas. Hypoxia affects the activity and function of host cells in areas such as morphology, expression of cell surface markers, cell survival, phagocytosis, metabolic activity, and production of nitric oxide, as well as cytokine secretion. In healthy tissues, oxygen tension is usually between 2.5 and 9 % (20–70 mmHg; Lewis et al., 1999), therefore in the model we define hypoxia as oxygen tension <2 % (15 mmHg), which is double the level of dissolved oxygen in the Wayne model's NRP stage 1 (1 % oxygen; Wayne and Hayes, 1996). Hypoxia/anoxia has been shown in vitro to reduce cell viability by about 20 percent in rat and murine macrophages (Lewis et al., 1999). Human macrophages under low oxygen conditions switch from oxidative phosphorylation to anaerobic glycolysis, Simon et al. (1977); Roiniotis et al. (2009) with the outcome being that cells adapt to low O2 conditions and very little cell death occurs due to hypoxia Lewis et al. (1999). Accordingly, we allowed for a small probability (p < 0.001) of macrophage apoptosis under enduring hypoxic or anoxic conditions; see Appendix 1 in Supplementary Material for details.
Another function that is affected by low oxygen conditions is phagocytosis. In short duration (6 h or less) hypoxia tends to degrade the ability of macrophages to phagocytose viral particles (Leeper-Woodford and Mills, 1992). But upon adaptation of the alveolar macrophage and onset of anaerobic glycolysis, phagocytosis increases two-fold in mice under enduring hypoxic conditions (up to 96 h; Lewis et al., 1999), but decreased in rabbits. Since there was not a clear consensus regarding how hypoxia affects phagocytosis, this feature was not implemented in the model.
Hypoxia also stimulates cytokine secretion by macrophages, in particular TNF-α production (Lewis et al., 1999). To capture this effect TNF-α secretion was doubled for macrophages under hypoxia. Though Lewis et. al did not specify the exact amount of TNF-alpha induction, they did note that other cytokines, such as prostaglandin E2 (PGE2) doubled secretion under hypoxic conditions.
Alveolar macrophages also experience changes in metabolic activity and production of nitric oxide in the presence of low oxygen tension as a result of hypoxia-mediated modulation of gene regulation and the binding of the transcription factor hypoxia-inducible-factor-1 (HIF-1). These dynamics were not included but can be addressed by additional systems biological models for macrophages response to hypoxia in future versions of the model.
Metabolic Model of Mtb Adaptation and Growth
Using an in vitro model of Mtb during active growth and persistence, Wayne and Hayes (1996) demonstrated that when the rate of oxygen depletion is sufficiently slow, Mtb metabolically adjusts to the lack of oxygen by shifting through two stages of non-replicating persistence (NRP1 and NRP2). Conversely under growth conditions that result in high rates of oxygen depletion, Mtb failed to persist presumably due to the inability of the mycobacterium to metabolically adapt to the rapid microenvironmental change. We use a systems biology based metabolic model of Mtb metabolism to link the physiological effect of host immune response, namely modulation of physiological oxygen gradients, to pathogen adaptation and persistence (May et al., 2013). We model biochemical pathways involved in Mtb oxygen-dependent energy production and the recycling of key metabolic co-factors under varying oxygen conditions for both intracellular (bacteria within macrophages) and extracellular bacteria (bacteria outside of macrophages but within the lung parenchyma). Since oxygen is critical to ETC function and ATP production, we expect physiologically low oxygen levels to reduce bacterial ATP production, which then would foster a decline in the metabolic fitness of Mtb populations and a consequential reduction in bacterial load. However, the Wayne NRP model suggests that the dynamics of oxygen depletion as opposed to simple bioavailability is an important determinant to pathogen elimination vs. persistence, therefore the dynamics of the physiological host response will also contribute to Mtb elimination.
Using our existing model of Mtb metabolic response to low oxygen and small molecule inhibition (May et al., 2013), we expanded the model to include a more mechanistic representation of the electron transport chain. Our metabolic model of mycobacteria includes the TCA cycle, glyoxylate bypass, glyoxylate-to-glycine shunt, electron transport chain, and oxidative phosphorylation and was derived from published theoretical models and empirical descriptions of the biochemical networks (Table 4; Wayne and Hayes, 1996; Singh and Ghosh, 2006; Beste et al., 2007; Fisher et al., 2009; May et al., 2013). The model implicitly takes into account the role of menaquinone/menaquinol in the production of the proton motive force, however we do not explicitly track menaquinone levels in the model. We account for cellular growth through a simplified ATP dependent biomass production reaction (47 ATP = 1 BIOMASS). The Mtb reaction rate equations were generated using kinetic parameters from the BRENDA Enzyme database, empirical data on Mtb growth under low oxygen conditions, and a Michaelis–Menten reaction kinetics framework with initial enzyme concentrations nominally set to values up to two orders of magnitude less than initial substrate levels (Wayne and Hayes, 1996; Smith et al., 2003; Nelson and Cox, 2005; Scheer et al., 2011).
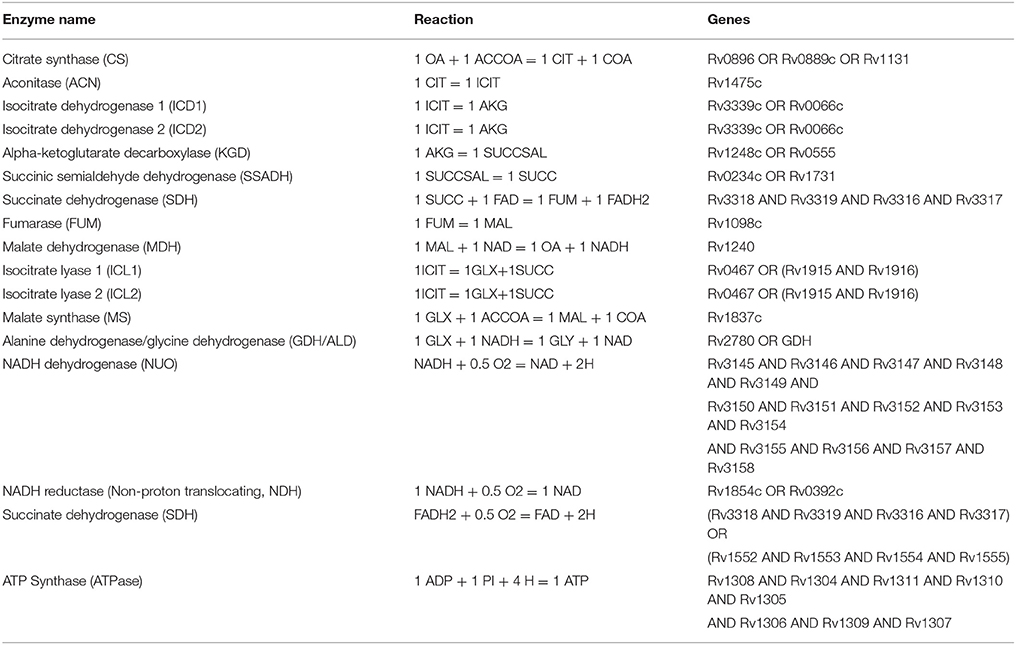
Table 4. Reactions included in the Mtb systems biology model to capture the TCA cycle, glyoxylate to glycine shunt, electron transport chain, and oxidative phosphorylation.
To relate the enzyme concentration used in the Mtb metabolic model to empirically observed growth and oxygen related fold changes, we multiply reaction velocity by the relative fold change value of genes associated with the production of the enzyme. Gene to enzyme correlations are based on the Beste et al. metabolic network model of Mtb (Beste et al., 2007). Using a fractional occupancy approach, the effective reaction rate is represented as a function of gene expression: vEffective = Y*v, with Y = active/(sum all forms), where active indicates the activating form of the gene or gene complex needed to produce the enzyme and the denominator consists of all genetic forms associated with the enzyme (Sauro, 2012). We use empirical data from in vitro studies of Mtb NRP to develop a theoretical approximation for gene expression (Wayne and Hayes, 1996; Voskuil et al., 2004).
Dynamic control of gene expression
To predict gene expression levels in our metabolic model of Mtb we used experimental data from the Wayne and Hayes in vitro NRP study (Wayne and Hayes, 1996) and supplementary data from Voskuil, et al.'s study of gene expression during Mtb hypoxia induced NRP (Voskuil et al., 2004). We fit both aerobic and hypoxic (slow-stirred) gene expression data from Voskuil et al. (2004) to a statistical model of gene regulation using percent oxygen consumption and ATP production values from Wayne and Hayes (1996). For these two independent measures, we found the polynomial curves of best fit in order to extract data at consistent time points for the two oxygen-dependent scenarios. We correlate four independent variables: change in time, change in percent oxygen consumed, depletion rates for oxygen, and ATP production to the gene expression levels for each of the 59 genes that are components of enzymes active in the ETC cycle (see Table 4, third column for list of genes). By using change in time and change in percent oxygen instead of explicit time and percent oxygen, we were able to correlate the rate of gene expression to the relative dynamics of the microenvironment rather than a fixed chronological time frame. We used a combination of linear and non-linear fits to construct individual multiple regression models for each of the 59 genes of interest. The model was trained using gene expression data from the 80 day interval in the Voskuil et al. study (Voskuil et al., 2004), which reports data up to 60 days for the aerated model and 80 days for the slow-stirred/NRP model. We combined the aerated and NRP data sets to generate a single 80-day data set representing Mtb response to two different environmental conditions. The combined observation dataset was used to generate a separate regression equation for each gene model. While there was not a unique empirical dataset available for cross-validation of the model, we validated the gene model using the non-combined data for the fully aerated or the hypoxic slow-stirred condition (see Supplementary Figure 1 for profiles of two of the genes modeled). The predicted gene expression trajectories were in agreement with the actual data from the training interval; R-square values were in the range of 0.80–0.99 and regression F statistics were generally < 0.01 for the 59 genes included in our model. The resulting regression-based models are used to predict gene expression levels for genes corresponding to enzymes in the Mtb metabolic model.
Bacterial growth model
To model ATP-dependent bacterial growth and death, we used the Monod equation:
where μ is the specific growth rate under the current microenvironmental conditions, μmax is the maximum specific growth rate, Ks is the concentration of ATP corresponding to the half growth rate constant, Kd is the death rate, NAD is the oxidized form of nicotinamide adenine dinucleotide and NADH is the reduced form of the coenzyme. Once the growth rate is determined via the Monod equation, extracellular bacterial growth is modeled according to the ODE:
where αBE is set to the value of μ determined using the Monod Equation. αBI is a multiple (1.5–2X) of αBE (Segovia-Juarez et al., 2004). Growth rates of intracellular bacteria are generally higher than that of extracellular bacteria (Zhang et al., 1998; Segovia-Juarez et al., 2004). Accordingly we set the maximum base intracellular growth rates to 1.5–2 times higher than their extracellular counterparts. Intracellular bacteria grow according to the ODE model (Segovia-Juarez et al., 2004):
The growth rate equation is fit to the data from Wayne and Hayes (1996) to relate growth rate to the level of bacterial ATP in the system and normalized to a value between 0 and 1. The death rate is modulated by the metabolic fitness of the bacteria as measured by the substrate ratio based on values given by the intracellular systems biology model. The number of extracellular bacteria in one grid cell is bounded by the carrying capacity of the occupied grid cell. When a grid cell reaches capacity, the excess bacteria are distributed to neighboring cells.
The gene expression and the metabolic models of Mtb adaptation and growth were integrated into the multiscale model using the algorithm outlined in Appendix 3 in Supplementary Material. Using our ABM-PHYS model, we study how the host cellular immune response can dynamically modulate physiological oxygen levels and investigate the contribution of oxygen dynamics to the three possible infection outcomes (clearance, containment, and dissemination).
Uncertainty Quantification, Model Integration, and Model Validation
Using a modular approach, we optimized and validated the Mtb systems biology model implemented using BioXyce and then performed uncertainty quantification on the integrated multiscale model. The metabolic model was calibrated using growth and ATP data presented in the Wayne and Hayes study for the aerated condition (Wayne and Hayes, 1996). In addition to constraining the model to positive ATP values, NAD:NADH and FAD:FADH ratios were constrained to correspond to ratios observed for wildtype Mtb (Singh et al., 2009). We used the DAKOTA (Adams et al., 2010) software to formulate a simple genetic algorithm that identified globally optimal Mtb metabolic model parameters that fit the experimental ATP data trajectories to accuracy within 1e-04.
We coupled the python-based host ABM platform to the BioXyce platform (May and Schiek, 2009; May, 2011) by passing spatiotemporally varying oxygen levels and gene expression values calculated by the ABM to the BioXyce Mtb model. Using key metabolite concentrations (NAD, NADH, ATP) returned by the BioXyce simulation the host ABM calculates the extracellular and intracellular bacterial growth rates at each simulation time point in the multiscale model (see Appendix 3 in Supplementary Material for additional integration rules). We implemented a parallel LHS-based sensitivity analysis of our integrated model using the DAKOTA toolkit (Marino et al., 2008; Adams et al., 2010). We treat our model as a black box (a sink for varied parameter inputs and source of outputs for variables of interest), and developed a Perl wrapper to parallelize the model analysis, thus minimizing the simulation time required for running multiple model replicates concurrently. We performed sensitivity analysis to investigate the two sources of randomness in our multiscale model: aleatory (stochastic) and episystemic uncertainty. To minimize the impact of aleatory uncertainty, we ran three simulations each with the same LHS parameters but with different random number seeds and averaged the results. To identify episystemic uncertainty, we performed LHS over the biological range for each parameter, generating N = 300 individual sample runs which were averaged to produce a total of 100 multi-sample average runs. Among other analytical measures, DAKOTA returns matrices of partial correlation coefficients (PCC) and partial ranked correlation coefficients (PRCC), which we used to identify statistically significant model drivers. PCC measures the degree of linear correlation between the output and input variables. The PRCC measures the degree of correlation between the input and output variables provided that the relationship between both is monotonic (may also be non-linear).
We categorized the phenotypic outcome of each sample run as a clearance, containment (granuloma formed), or dissemination outcome using the algorithm described in Appendix 1 in Supplementary Material. Treating the sample outcomes as a representative population, we validated our integrated model by comparing the percentages associated with the relative number of samples in each qualitative outcome to in vivo data from primate studies conducted by Gideon et al. (2015) and epidemiological data from the WHO on the rates of latent TB disease (represented as containment; World Health Organization, 2013). We used Chi-square tests for normal data and the non-parametric K–S test to compare distributions derived from in vitro and in vivo experiments with our in silico distributions using bacterial loads as an indicator of disease outcomes. Using data from the sensitivity analysis, we evaluated how closely the distribution of lesions resulting from simulated Mtb infection emulated the latent infection outcome. In the section that follows we present results of individual simulations and results that represent an average of multiple simulations as outlined in Table 7.
Results
Simulated Host–Pathogen Interactions and the Role of Oxygen in Structural Immune Response
We simulate the outcome of an infected macrophage in a host with normal pulmonary capacity. Figure 2 shows a simulation that resulted in a containment granuloma with most of the bacteria in a state of NRP at 500 days post-infection. As stated previously, containment reflects a state of equilibrium in which the rate of host immune cell recruitment, activation, death and renewal are balanced by Mtb growth, death, and metabolic adaptation to the physiological microenvironment, resulting in the maintenance of the Mtb infection in a latent or persistent state. In our in silico ABM-PHYS studies, in addition to clearance, containment, and dissemination outcomes we often encountered a fourth category of scenarios where Mtb is transiently contained in granulomas at 200 days post-infection but the granuloma either clears the infection or the bacteria disseminates by 500 days post-infection. We named this category ”transient containment,” and mathematically defined transient containment according to the behavior of the derivatives of external bacteria and resting macrophage recruitment. (See Appendix 1 in Supplementary Material for detailed algorithm used to separate the qualitative outcomes, including transient containment.) We simulated up to 500 days post-infection to capture the true containment scenario. However, simulating up to 500 days required substantial computational time, therefore in our sensitivity analysis studies and results we show the averages from 200-day simulations given that the majority of outcomes are determined by the 200 day simulation time step. Figure 2A represents a 2 × 2 mm section of the lung parenchyma where the host cell and Mtb interactions lead to granuloma formation. Following the representation convention of previously published TB ABMs (Segovia-Juarez et al., 2004; Marion et al., 2007; Ray et al., 2009), which facilitates comparative analysis, in the legend mr, mi, ma, mc refer to resting, infected, activated and chronically infected macrophages, respectively; T-γ, Tc, and Treg refer to T-γ cells, cytotoxic T cells and regulatory T cells, respectively. Note in Figure 2A the extensive caseous regions within the core of the granuloma, caused by repeated bursting of macrophages during the infection cycle. A grid cell is designated as caseous if six or more macrophages burst within the grid cell over the course of the simulation; see for example Ray et al. (2009). Figure 2B shows the partial pressure of oxygen in units of mmHg across the cellular grid, with oxygen diffusing into the center from the boundary grid cells. Figure 2C shows the rate of oxygen depletion across the granuloma, which is calculated as the difference in oxygen levels over time. As shown in Figure 2C the highest oxygen depletion rate is within the inner region of the granuloma, presumably due to host cells infiltrating the site of infection. The center has very low depletion levels, as does the outer regions of the grid. However, while the center is hypoxic and possibly anoxic (Figure 2B and caseous regions in Figure 2A), the outer regions are well oxygenated.
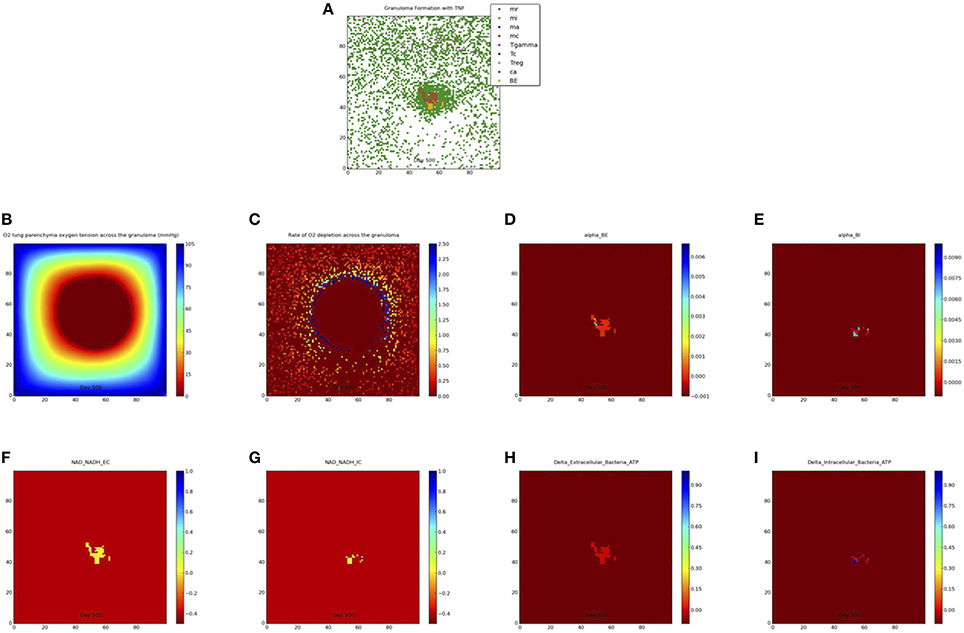
Figure 2. Containment granuloma with TNFα, contains bacteria characterizable as in a state comparable to non-replicating persistence at 500 days. (A) Partial pressure of oxygen across the granuloma (B) oxygen depletion rate (C) bacterial growth rates for extracellular (D) and intracellular (E) bacteria; scaled NAD/NADH ratio for both extracellular (F) and intracellular (G) bacteria; change in ATP concentration for extracellular (H) and intracellular (I) bacteria.
The host cellular response and corresponding physiological changes in environmental oxygenation modulates the genetic response of Mtb as exhibited in Supplementary Figure 2, which shows an example of predicted fold change based on oxygen availability and days post-infection for two of the 59 genes modeled. The fold change for dissemination and containment in the simulations mirror the Voskuil et al. profiles for aerobic and hypoxic/NRP conditions (inset upper right). The predicted change in gene expression corresponds to changes in enzyme levels and consequentially in reaction dynamics for the Mtb metabolic network. Supplementary Figure 3 shows the gene expression-driven variation in metabolite levels for extracellular bacteria over 200 days post-infection for clearance, containment, transient containment and dissemination (Supplementary Figures 3A glycine; 3B malate; 3C isocitrate; 3D glyoxylate).
Figures 2D,E show the growth rates of extracellular and intracellular bacteria respectively at 500 days post-infection, which is modulated by the systems biology model of Mtb metabolism. Extracellular growth rates are almost entirely zero and intracellular growth rates are predominately zero. Non-zero intracellular growth rates occur where residual oxygen carried in macrophages recruited from well-oxygenated areas enables growth of internal bacteria. Zero growth rate areas for extracellular bacteria correspond mainly to caseous regions (Figures 2A,D). These observations suggest that a large number of the bacteria in the granuloma in Figure 2A may be characterized as in a state of NRP based on rate of growth. Given that the systems biology model of Mtb metabolic response is the same for extracellularly and intracellularly located bacteria, the host-mediated changes in the physiological environment is the variable that drives the observed difference in metabolic output of the bacteria. Therefore, the location-specific environment of the bacteria contributes to the emergent metabolic characteristics of intracellular vs. extracellular bacteria (Figures 2D–I).
Figures 2F,G portray the relative extracellular and intracellular NAD/NADH ratios respectively, which are used as a fitness measure to modulate the death term in the Monod equation. Several NAD/NADH ratios for both extracellular and intracellular bacterial populations are close to zero with some populations, particularly intracellular Mtb populations, close to one (the maximum relative fitness value). While difficult to visualize in Figures 2F,G there are some populations of intracellular bacteria with higher NAD/NADH levels, which is supported by the slightly higher average NAD/NADH ratio observed for intracellular bacteria (compare Supplementary Figures 4E and Supplementary Figures 4F) after 100 days of simulation for the containment scenario. Negative values in these plots represent the background matrix and have no physiological interpretation. Figures 2H,I illustrate the change in ATP levels for both intracellular and extracellular bacteria. The ATP plots show more intracellular bacteria populations with high delta_ATP (change in ATP over time) than the extracellular bacteria. The intracellular regions with greater ATP dynamics correspond to intracellular regions with relatively higher growth rates (Figure 2E, alpha_BI). This observation suggests that intracellular bacteria may have relatively higher metabolic activity than extracellular bacteria for the containment scenario, as supported by the average NAD/NADH values in Supplementary Figures 4E,F. However, in the containment scenario the average ATP concentrations (Supplementary Figures 4G,H) for extracellular bacteria are slightly more than two times that of intracellular bacteria, but this does not correlate to a higher extracellular growth rate when compared to intracellular growth rates (Figures 2D,E, Supplementary Figures 4C,D). Given that ATP is a major determinant in bacterial growth and that growth rate also indirectly accounts for bacteria removed by the host, we postulate that the additional reduction in extracellular bacterial growth rate is due to host-mediated uptake and killing of extracellular Mtb. As designated for the NAD/NADH plots, background matrix assumes a negative value so that the zero levels may be distinguished from background.
Comparative Analysis of Model Outcomes
Comparison of In silico Models of Infection
Figures 3, 4 compare containment and dissemination outcomes, respective, for ABM-ST (left figures) and ABM-PHYS (right figures). These figures are generated using the same parameter sets fixed for each qualitative outcome model [Figures 3A–F; see Appendix 4 (Supplementary Table 1) in Supplementary Material, for parameters used for the two containment scenarios] and the dissemination scenario (Figures 4A,B). Using model parameters that correspond to containment outcomes, we compare simulations that result in a well formed, compact containment granuloma (Figure 3F) vs. a less tightly packed transient containment granuloma in the ABM-PHYS model (Figure 3D). The probability of macrophage recruitment from a vascular source was set at a power of ten lower in Figures 3A–D than Figures 3E,F (0.006 vs. 0.075) and the number of TNF-α molecules secreted hourly was slightly lower for Figures 3A–D than Figures 3E,F (3.15e+06 vs. 4.35E+06). All other parameters remained the same for the two containment scenarios [Appendix 4 (Supplementary Table 1) in Supplementary Material]. There were no parametric differences between ABM-PHYS and the ABM-ST model, only differences due to the modeling methodology. Specific changes in the structure of the ABM-PHYS model include: addition of the oxygen field and immune response mediated modulation of physiological oxygen, associated oxygen-driven host response, and the use of fixed growth rates for bacteria in the ABM-ST model vs. the use of bacterial growth rates modulated by Mtb metabolic adaptation in the ABM-PHYS simulation model. In comparing the two models we first qualitatively evaluate the effect of oxygen dynamics on the organization, structure, and function of the granuloma. We also quantitatively compare their performance using the metric of extracellular bacterial load as in Segovia-Juarez et al. (2004) and Ray et al. (2009).
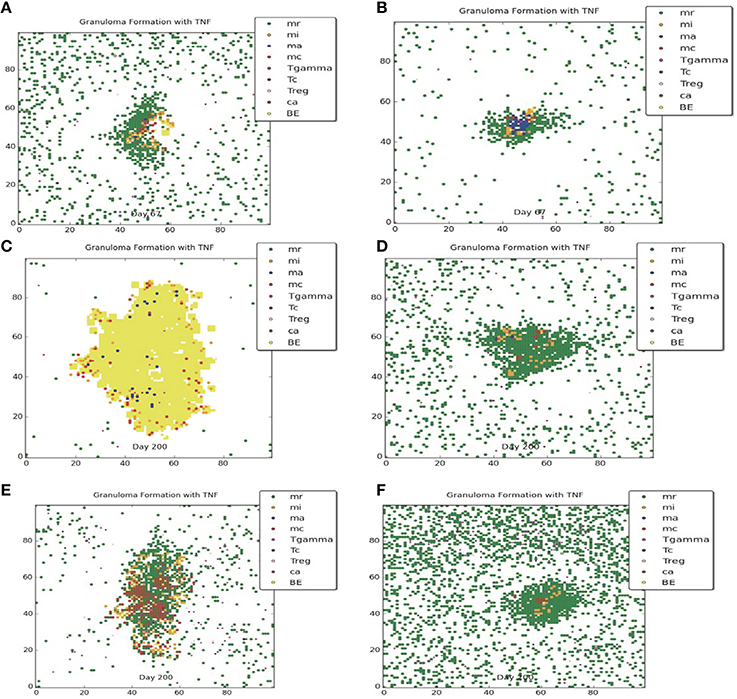
Figure 3. Comparison of transient containment outcomes at 67 days post infection (A,B) and 200 days post infection; the standard re-implemented model (ABM-ST) results in dissemination (C) and the physiologically-based model (ABM-PHYS) results in a loosely packed containment (D). True containment outcomes shown at 200 days post-infection (both ABM models result in containment E,F). Simulation models use the same parameters for ABM-ST (left) and ABM-PHYS (right). See Appendix 4 in Supplementary Material for relevant parameters.
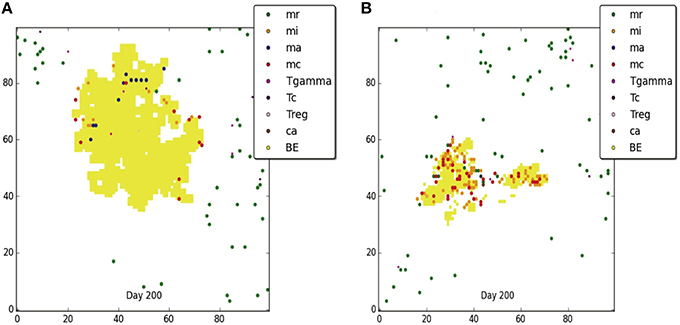
Figure 4. Comparison of dissemination outcomes in the absence of TNF-α for ABM-ST (A) and ABM-PHYS (B). See Appendix 4 in Supplementary Material for relevant parameters.
Both the ABM-ST and ABM-PHYS initially control and contain Mtb as evidenced by the day 67 results (Figures 3A,B). However, ABM-ST eventually results in dissemination whereas the ABM-PHYS model results in a containment outcome with low amounts of extracellular and intracellular bacteria at 200 days (compare Figures 3C,D). The difference in outcomes is likely due to the non-dynamic growth rate of bacteria in the ABM-ST model, which is at the maximum level and not modulated by fluctuating oxygen conditions resulting from the physiological immune response considered in the ABM-PHYS model. The static bacterial growth rate leads to ABM-ST model skewing toward dissemination with a reduced number of containment outcomes, compared to the ABM-PHYS model which results in more containment outcomes (outcome percentages shown in Figure 6C). Presented in Figure 3E (ABM-ST) and Figure 3F (ABM-PHYS) are containment scenarios with the same parameters for the two models [see Appendix 4 (Supplementary Table 1) in Supplementary Material, for associated parameters]. The ABM-ST model results in a loosely packed granuloma with extensive caseous regions. The granuloma produced by the ABM-PHYS model is tightly packed, and features hypoxic or nearly hypoxic regions (data not shown). Again in part due to the constant maximum growth rate of intracellular bacteria there is an increased likelihood of macrophage bursting, leading to more caseous regions. The ABM-PHYS model also features caseous regions, but these are smaller and more compact, which is likely due to the modulated growth rate driven by changes in physiological oxygen levels and the bacterial model.
Using the dissemination parameters listed for the dissemination model in Appendix 4 (Supplementary Table 1) in Supplementary Material, we compared dissemination outcomes for ABM-ST vs. ABM-PHYS model. Given the tendency of the ABM-PHYS model to skew toward containment (Figure 6C), we significantly reduced TNFα in the system to generate a more comparable dissemination scenario for both models. Based on qualitative observations for the dissemination model (Figures 4A,B) the ABM-ST model results in more pronounced bacterial growth and dispersion during dissemination. However, accounting for physiological factors in the ABM-PHYS model contributes to a less dispersed dissemination outcome with more caseous regions and a comparatively reduced extracellular bacterial load.
To provide a quantitative comparison between the two ABM models we compare the extracellular bacterial load of the re-implemented standard ABM and the physiological-based model for each of the three scenarios: transient containment (Figures 3A–D), containment (Figures 3E,F), and dissemination (Figures 4A,B) using six simulations in all scenarios except the transient containment scenario for the ABM-ST model, which uses five (Figures 5A–C, respective). Figure 5 shows trajectories from each of the simulation runs and the average outcomes of the runs per scenario. The average maximum values for the extracellular Mtb levels for the ABM-PHYS models (shown on the left vertical axis) range from approximately 2 × 10² CFUs for containment to 1 × 10³ CFUs for transient containment and dissemination. Comparative extracellular bacterial loads for the ABM-ST model range approximately two orders of magnitude higher than their counterpart in the ABM-PHYS (shown on the right vertical axis). The extracellular Mtb levels continually increase for the ABM-ST model, with evidence of plateauing for the transient containment and dissemination outcomes (Figures 5A,C). Conversely the ABM-PHYS model exhibits a characteristic peak in extracellular Mtb levels shortly preceding 40 days post infection, followed by decreasing bacterial levels for both the transient containment and containment outcomes or increasing levels for the dissemination outcome. The ABM-PHYS model reaches steady state levels for each of the scenarios, with only the containment scenario nearing an effectively zero extracellular bacterial load. We compared the results of both models to the published plots of extracellular Mtb from the Segovia-Juarez et al. (2004) (Figure 9 in Segovia-Juarez et al., 2004) and Ray et al., 2009 models (Figure 3A in Ray et al., 2009). The general behavior of increasing extracellular bacteria is comparable to the trajectory of dissemination reported by Segovia-Juarez et al. (2004) and containment reported by Ray et al. (2009). However, the level of extracellular bacteria in our implementation of the standard ABM (ABM-ST) using the parameters given in Supplementary Table 1 is an order of magnitude higher than the levels depicted in the Segovia-Juarez et al. (2004) study for the dissemination scenario (approximately 4 × 10⁴ vs. 4.8 × 10⁵ at 200 days post infection) and for the bacterial levels reported by Ray et al. (2009) for containment (approximately 1 × 10³ vs. 3.6 × 10⁴ at 200 days post infection in our model). In comparison to the results reported in both of these studies, the characteristic trajectories and day 200 extracellular bacteria levels are notably different for the physiologically based ABM (ABM-PHYS), which is approximately 1.4 × 10² for transient containment, 1.5 × 101 for true containment, and 7.6 × 10² for dissemination. However, the ABM-PHYS' containment trajectories have the same characteristic shape as the bacterial CFU counts presented by Lin et al., for the macaque Mtb infection model (see Lin et al., 2014, Figure 4). The physiologically-based ABM's containment clearly exhibits an initial build up of CFU in the granuloma until significant activation of the adaptive immune response and inflammatory mediators occurs, and then extracellular bacterial levels taper off over the remaining infection cycle.
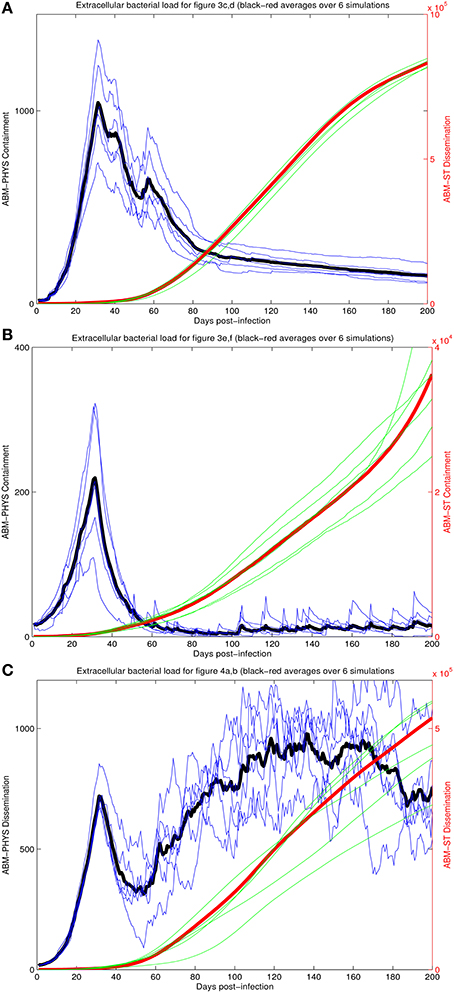
Figure 5. Comparison of extracellular bacterial load of ABM-ST vs. ABM-PHYS model for each of the three scenarios in Figure 3: transient containment (A, Figures 3A–D); containment (B, Figures 3E,F) and dissemination (C, Figures 3G,H). Results represent an average of six simulations in all scenarios except the transient containment scenario for ABM-ST, which has five simulations. Bacterial loads for containment in the integrated model mimic trajectories reported from in vivo studies (Lin et al., 2014).
Comparison of In silico and In vivo Models of Infection
In the development of our model and similar to standard practice for empirical studies, we use human data when available, followed by non-human primate data, and other animal models of disease for model construction and comparative validation. Using our simulation data set consisting of 300 individual sample runs, we compare in vivo and in silico distributions of bacterial load across the three qualitative outcomes: clearance, containment and dissemination (Figure 6). Figure 6A shows the distribution of outcomes and their characteristic bacterial loads from the ABM-PHYS model (red) compared to Mtb infected macaques from the Gideon et al. study Gideon et al. (2015) (blue). Figure 1 in Gideon et al. shows the distribution of CFUs per lesion at a median of 222 days for both active and latent diseased macaques. Based on the per lesion CFUs reported in the study we classified the necropsied granulomas and divided them based upon bacterial load into qualitative outcomes. Using the data for individual lesions from the Gideon et al. study, we compared the in vivo CFU distribution to the distribution of CFUs for individual ABM-PHYS simulation outcomes at 200 days post-infection. We found that the distribution of CFUs per granuloma for the ABM-PHYS model of infection is statistically the same as the distribution of granulomas associated with latent macaques in the Gideon et al. study (p ≈ 0.81, see Figure 6B). When we compare the outcomes from our variable parameter study, where parameters are varied across the range of values for the healthy human, our in silico outcome distribution as in the latent disease case for the macaques. Figure 6A shows the distributions grouped by qualitative outcome. The distributions are not statistically significantly different (p ≈ 0.64).
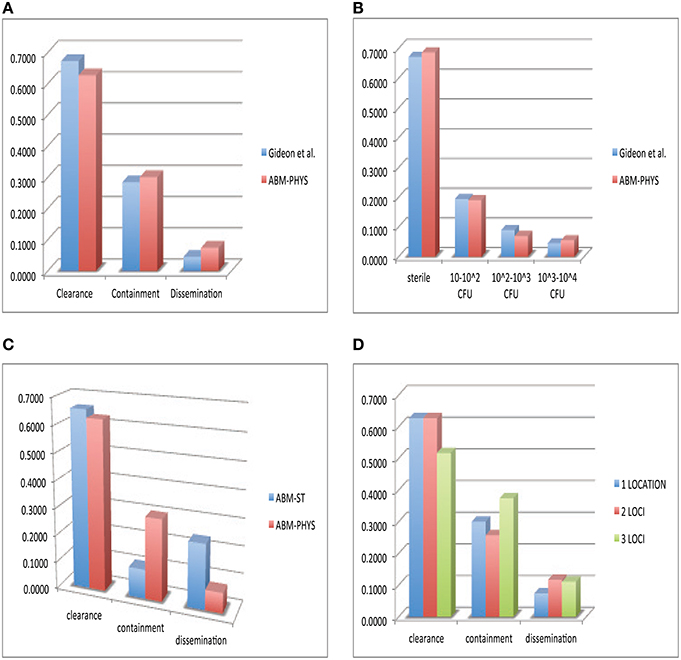
Figure 6. Comparison of in vivo and in silico phenotypic outcomes. Comparison of Gideon et al. (2015) experimental data (blue) and the ABM-PHYS model with oxygen dynamics (red): relative distribution of each qualitative outcome—clearance, containment and dissemination (A) distribution of lesions based on bacterial load (B) comparison of ABM-ST (blue) and the ABM-PHYS model (red) based on the distribution of qualitative outcomes (C) distribution across qualitative outcomes for 1,2, and 3 loci models of the ABM-PHYS model (D). In silico outcomes based on multisample averages of 300 total simulations.
Figure 6C shows the distribution of outcomes for ABM-ST (blue) and for the ABM-PHYS model (red) across the three qualitative outcomes. Though ABM-ST clears about 66.67 percent of Mtb infections, it strongly skews toward dissemination outcomes. In the ABM-PHYS model, bacterial growth rates are controlled and responsive to hypoxic conditions, so that bacterial dissemination can be modulated by host immune response and oxygen availability. An example of the impact of this phenomena is illustrated in Figures 3A,B, a transient containment scenario where ABM-ST progresses to dissemination but ABM-PHYS results in containment, at 64 days post infection. A chi-square test (p ≈ 1.5587E-115) confirms that the two in silico models produce statistically significantly different distributions, with the ABM-PHYS being closer to the actual distribution of LTBI (as determined from the Gideon et al. data). Incorporating oxygen dynamics into the system with a systems-biology model for bacterial response pushes dissemination outcomes in ABM-ST toward containment, so that the model more accurately depicts empirically observed biological mechanisms and outcomes.
Given that Mtb infection and disease can result in the formation of multiple granulomas Lin et al. (2014), we explored the distribution of qualitative outcomes given multiple loci of infection by varying the initial number of extracellular bacteria from 1 to 16. We modeled the infection for an infected 20 × 20 μm cellular grid. There are observable differences in response depending on the number of initial bacteria, as presented in Figure 6D. There is a significant difference between the two loci and the three loci distributions (p = 0.00776), in the form of much higher containment and lower clearance outcomes. The three loci distribution was also statistically significantly different (p = 0.0205) from the ABM-PHYS single locus model, while the two loci distribution did not differ significantly (p = 0.1369) from the single locus model. The number of dissemination outcomes is comparable for the two loci and three loci models.
Host-Mediated Oxygen Depletion and Mtb Adaptive Response
We investigated the ability of the ABM-PHYS model to mechanistically link the host's physiological response and modulation of oxygen to Mtb metabolic fitness (Supplementary Figures 3, 4). Supplementary Figure 4 presents averages (over 300 simulations with parametric variations) for extracellular and intracellular bacterial load. We compare the four main outcomes: clearance, containment, transient containment, and dissemination. With respect to bacterial growth rates, recruitment of macrophages and oxygen depletion rates, transient containment scenarios are characteristically closer to dissemination as opposed to a true containment scenario. This can be seen in Supplementary Figures 4, 5. Figure 5, Supplementary Figure 4B show that early transient containment behaves on average more like containment with respect to the change in extracellular bacteria over time and with respect to the recruitment of macrophages. In Supplementary Figure 4 transient containment bacterial loads (a and b) are initially comparable to the containment level but approach dissemination levels after 180–200 days. The containment scenario results in significantly lower total bacteria with near zero growth rates for extracellular bacteria when compared to the transient containment and dissemination scenarios. Growth rates are shown in (Supplementary Figures 4C,D), NAD/NADH ratio (fitness measure—Supplementary Figures 4E,F) and ATP levels (Supplementary Figures 4G,H) across the four qualitative outcomes. Supplementary Figure 4I shows the average oxygen depletion rates across the grid; it can be seen that the depletion rates in our human lung model is on average comparable to the range of oxygen depletion rates observed in the Wayne NRP model with depletion rate < 0.5, which allows adaptation of Mtb to low oxygen conditions encountered during the first (NRP1) and second (NRP2) stages of NRP.
Supplementary Figure 5 shows the average growth rates for extracellular (a) and intracellular (b) bacteria for the center grid cell in the four qualitative scenarios, with growth rate consistently highest for dissemination followed by the transient containment scenario. In Supplementary Figure 5C we show the physiological environment correlating to the growth rates in Supplementary Figures 5A,B. It can be seen that containment is on average hypoxic (<2% oxygen), while the other scenarios have notably higher levels of oxygen with clearance and dissemination having the highest levels of oxygen. These results show that, with respect to the bioavailability of oxygen, the physiological microenvironment of containment granulomas within the human lung are largely hypoxic when compared to disseminated or cleared infections (Supplementary Figure 5C).
In vitro studies of Mtb persistence suggest that depletion dynamics vs. bioavailability of oxygen is a key determinant of Mtb persistence (Wayne and Hayes, 1996). Using simulation data from our three scenarios, oxygen depletion is calculated as the change in percent of oxygen utilization over change in time and evaluated across the entire grid, Supplementary Figure 4I, and at the center of the granuloma, Supplementary Figures 5C,D. Across the grid average oxygen depletion rates are higher for the containment model, with the transient containment showing higher depletion rates than the dissemination scenario only between approximately 50 and 100 days post infection. The failure to maintain sustained oxygen depletion contributes to the deterioration of the transient containment granuloma into a dissemination outcome at time points greater than 200 days post infection. Oxygen depletion rates at the center of the granuloma range from 0 to 0.5 for most cells in the ABM-PHYS model, Supplementary Figure 5D. The range of depletion rates seen in the model falls within the range of depletion rates observed in the slow-stirred condition in the in vitro Wayne NRP model (Wayne and Hayes, 1996). The containment granuloma features enduring hypoxic regions, Supplementary Figure 5C, and eventually these regions reach and surpass reduced oxygen levels associated with NRP stage 1. Dissemination and transient containment have a greater propensity to show transient hypoxic periods, Supplementary Figure 5D. Clearance scenarios show minimal oxygen depletion, which we attribute the clearance of Mtb to a non-oxygen associated, robust immune response-mediated killing of bacteria, Supplementary Figure 5D.
Failure to maintain a sustained hypoxic environment may enable Mtb to proliferate in the extracellular and intracellular environment during dissemination, Supplementary Figures 5A,B. However, sustained oxygen depletion rates during containment result in reduced extracellular and intracellular bacterial growth rates, but the oxygen depletion rate still gives the bacteria time to metabolically adjust to changes in oxygen levels in its local environment. Similar to the Wayne NRP slow-stirred model, bacteria are not killed off as in the vigorously shaken/rapid oxygen depletion scenario, but rather they persist within the granuloma. Persistent bacteria can maintain their relative metabolic fitness. Intracellular NAD/NADH ratios of bacteria during containment start off initially lower than the dissemination outcome for simulation time < 100 days and reach levels comparable to disseminating bacteria post 100 days, Supplementary Figures 4E,F. Furthermore, the intracellular ATP levels of bacteria during containment are higher when compared to the dissemination bacteria, with the Mtb in containment outcomes having notably higher levels of ATP than Mtb in dissemination outcomes, Supplementary Figures 4G,H. While intracellular containment bacteria are potentially more metabolically fit than the intracellular disseminating bacteria, the extracellular containment bacteria exhibit a reduced fitness profile. The NAD/NADH and ATP levels are lower in containment bacteria than in disseminating bacteria post 60 and 80 days simulation time, respective. The transient containment bacteria have a markedly different metabolic response. In general extracellular and intracellular transient containment bacteria have the lowest ATP levels, however the NAD/NADH levels for both extra- and intracellular containment bacteria are distinctively higher than both containment and dissemination bacteria post 100 days. During clearance there are very few remaining bacteria on the grid, Supplementary Figures 4E,F inset, potentially resulting in an inflated average NAD/NADH ratio. However, the remaining bacteria during the clearance scenario have very low comparable levels of ATP, Supplementary Figures 4G,H, reducing their likelihood of persistence or proliferation.
Influence of Oxygen Depletion on the Course of Tuberculosis Disease
The results of our ABM-PHYS model support the hypothesis that the hypoxic environment of the human lung contributes to the shiftdown of Mtb toward persistence during the formation of a containment granuloma. Figure 7 (left) shows the average size of the hypoxic region for the containment granuloma. Simulated granulomas were separated into two groups: solid and caseous in order to compare outcomes and oxygen-related characteristics of granulomas in our in silico model to in vivo granulomas described by Via et al. (2008). If a simulated granuloma contained caseous cells, it was classified as caseous and in the absence of these, as solid. On day 56 post-infection, which correlates to when tissue samples from Mtb infected animals were collected in the in vivo Via et al. study, in the simulated ABM-PHYS model the average size of the hypoxic regions are on the order of 0.2490 and 0.2135 mm2 for caseous granulomas and solid granulomas, respectively. The size is in close agreement with the in vivo experimental study which reported a hypoxic region on the order of 0.36 mm2 in rabbit lungs. Via et al. note that all caseous granulomas were positive for pimonidazole hydrochloride (PIMO) staining, a hypoxia indicator, while only 32% of the solid granulomas were positive for PIMO activation.
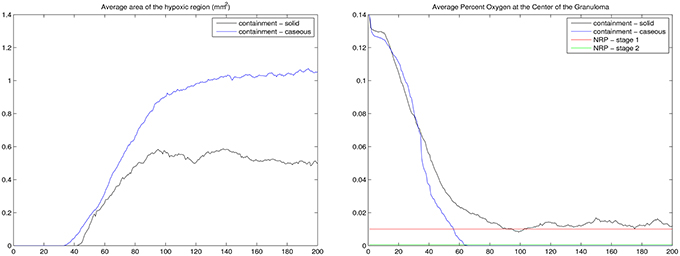
Figure 7. For the containment granuloma: average area of the hypoxic region in mm2 (Left) and the average percent of oxygen in tissue at the center of the granuloma (Right). Containment granulomas were divided into two groups: caseous and solid. NRP stages (Wayne and Hayes, 1996) are notated (right). Results based on 20 simulation runs.
The Wayne NRP studies suggest that microenvironments that gradually become hypoxic enable Mtb to transition from an NRP1 stage to an NRP2 stage, resulting in the establishment of non-replicating, persistent Mtb (Wayne and Hayes, 1996). To determine if and to what extent the physiological immune response results in a microenvironment similar to the environment observed in the Wayne in vitro studies, we analyzed the average percent oxygen in tissue for the two categories of containment granuloma (Figure 7, right). It is seen that the oxygen levels in the simulated caseous containment granulomas are on average comparable and transition similar to the Wayne model's NRP stage 1 and NRP stage 2. Solid granulomas average slightly higher than 1% oxygen. Thus Mtb transitioning into a persistent state is more likely in the case of caseous containment granulomas. In comparison we show in Figure 8 a tableaux of transient hypoxic states for a dissemination outcome over time. Severe hypoxia is seen on day 181, but resolves by day 200 with concomitant bacterial growth, demonstrating that sustained hypoxia is needed for bacterial containment.
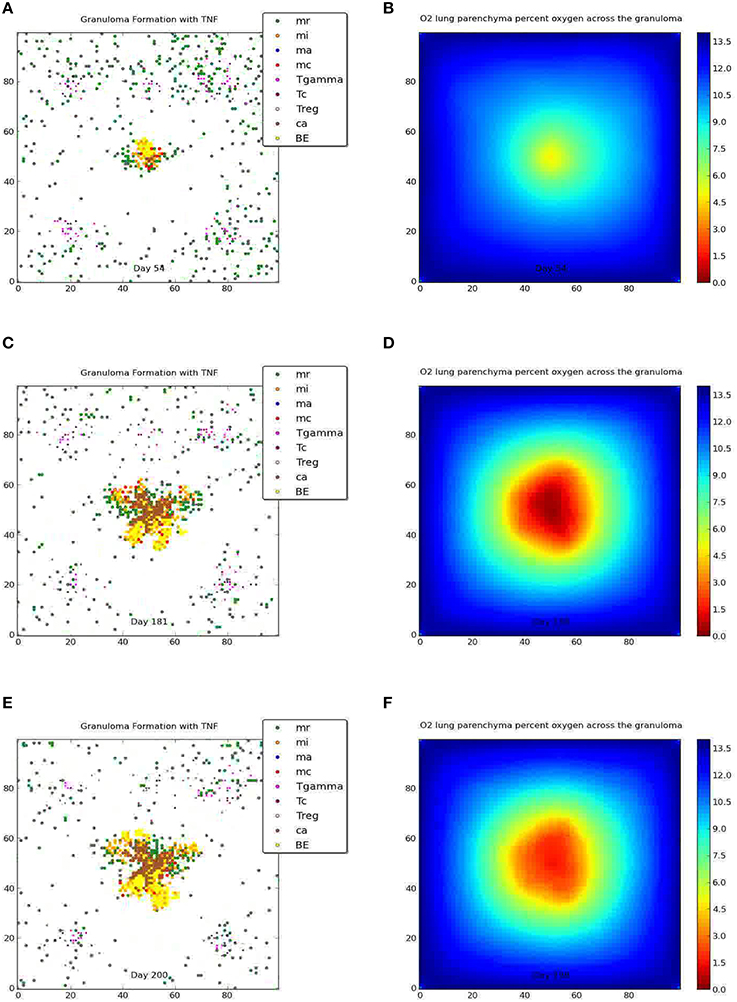
Figure 8. Dissemination and the corresponding oxygen field at 54, 181, and 200 days post-infection. Severe hypoxia is seen on day 181, which resolves by day 200.
Statistical comparison of the in silico ABM-PHYS, in silico ABM-ST, and in vivo Mtb infection models indicates that our ABM-PHYS model provides a more comparable reproduction of bacterial load over time than the ABM-ST model. Using published experimental data from the in vivo study (Via et al., 2008) of 16 NZW rabbits infected with M. bovis, we compare the number of mycobacterial CFUs observed in in vivo granulomas to the number of CFUs in our simulated granuloma. The data extracted from Via et al. show the bacterial CFU per individual 1- to 1.5-mm granuloma at 63 days post infection (5 weeks of housing and 28 subsequent days of placebo treatment) for the experimental control group, see the first bar in Figure 9. In the same figure we comparatively plot the distribution of total bacteria at day 63 for 23 simulated containment granulomas produced using the ABM-PHYS model with variable specific growth rate (μ-max = 0.006649 per hour using the default in Table 1; see bar 2 in Figure 9) and 10 simulated containment granulomas generated using the ABM-ST model (Figure 9, bar 3), with the same parameters but using fixed bacterial growth rate and no oxygen dynamics. It can be seen that the ABM-PHYS model's estimated mean CFU per granuloma and the associated variance more closely matches the in vivo data than the ABM-ST model. Using the Kolmogorov–Smirnov (K–S) test, which is a non-parametric test to determine whether two distributions are statistically significantly different, we found that the ABM-PHYS model's total bacterial distribution is not statistically significantly different from the experimental control distribution in Via et. al. (p = 0.2702). For the ABM-ST the simulated distribution is statistically significantly different from the experimental data (p = 3.8254e-06). The ABM-PHYS vs. ABM-ST results from the K–S test were also statistically significantly different (p = 0.0017) from one another. The results of the K–S test suggests that the ABM-PHYS model more accurately captures the mean and variance of the experimental control data for the containment scenario in the Via et. al. study. Though the ABM-PHYS features greater variance in total bacterial load, it produces a more physiological and immunologically accurate correlation of the impact of granuloma formation on the macroscopic host environment and on the microscopic extracellular/intracellular bacterial load. Allowing growth rates of Mtb to fluctuate in response to local environmental oxygen conditions appears to more accurately portray actual infection dynamics.
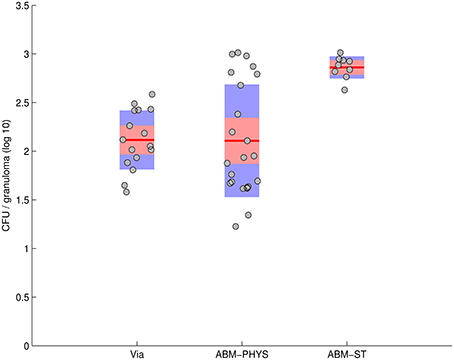
Figure 9. Total CFU for M. bovis untreated infected rabbits on day 63 (Via et al., 2008—bar 1) compared with total CFU resulting from the in silico model of Mtb infection produced by the ABM-PHYS and the ABM-ST model using the same specific growth rate of Mtb for both models. In silico results are based on 10 simulations for ABM-ST and 22 simulations for ABM-PHYS.
Uncertainty and Sensitivity Analysis—UA, SA
We used the freely available software DAKOTA (Adams et al., 2010) developed by Sandia National Laboratories to perform both uncertainty and sensitivity analysis for our ABM-PHYS model (see Table 5). In Supplementary Figure 6 we show the partial regression correlation coefficients (PRCC) over 200 days post-infection for the statistically significant multiscale model driver variables, with the measured outcome variable being the level of extracellular bacteria. An increased level of extracellular bacteria suggests a failure in immune response and results in Mtb dissemination. Therefore, extracellular bacterial load serves as a valid quantitative metric that correlates to active TB disease (see Supplementary Figures 4A,B for a comparison of total bacterial load to extracellular bacterial load). To identify statistically significant input variables for our ABM-PHYS model we performed a variable parameter study. In order to reduce aleatory uncertainty the model was run for three iterations using a different random number seeds at the beginning of each iteration and we ran the three-iteration cycle 100 times resulting in N = 300 simulation runs. Each set of three simulation outcomes were averaged and the PRCC produced (see Marino et al., 2008 for further discussion). This gave us a total of 100 sample outcomes (generated from 300 individual simulations), each an average of three simulations ran for each of the 100 input parameter sets varied over the ranges described in Table 2 (Ray et al., 2009). We used Dakota to generate the resulting PRCC. Supplementary Figure 6A shows the significant variables with clearance outcomes included (p < 0.05) using our original N = 300 simulation runs and Table 6 lists the statistically significant model parameters with all outcomes considered, together with p-values to indicate level of significance. We found that the chemokine diffusion coefficient and CCL5 threshold impacts infection dynamics very slightly (negatively and positively correlated, respective) when the clearance scenarios are included. We observed that pulmonary blood sources and residual lung volume are positively correlated with extracellular bacteria, suggesting that an increase in pulmonary blood sources in the lung may provide increased oxygen to the parenchyma, thus enabling growth and development of extracellular bacteria. Increased residual lung volume provides more oxygen to tissues resulting in a more aerobic environment, which is more amenable for extracellular bacterial growth. Macrophage and bacterial O2 consumption parameters are significant drivers in our model, both negatively correlated with extracellular bacteria. Higher oxygen consumption by macrophages and high consumption by a single bacterium leaves less O2 available for other bacteria. The faster oxygen diffuses through tissues, which is determined by the O2 diffusion parameter, the more oxygen is readily available to extracellular bacteria, hence the positive correlation with bacterial load. Since naturally occurring oxygen is comprised of three stable isotopes, O2 can persists longer than chemokines/cytokines in the system. A high probability for T cell movement into a macrophage containing compartment facilitates the activation of macrophages and enables the formation of a more tightly controlled granuloma. Therefore, a high Tmove is negatively correlated with bacterial load and leads to lower extracellular bacteria. Finally high growth rate (μ-max) of Mtb has a positive impact on extracellular bacteria levels.
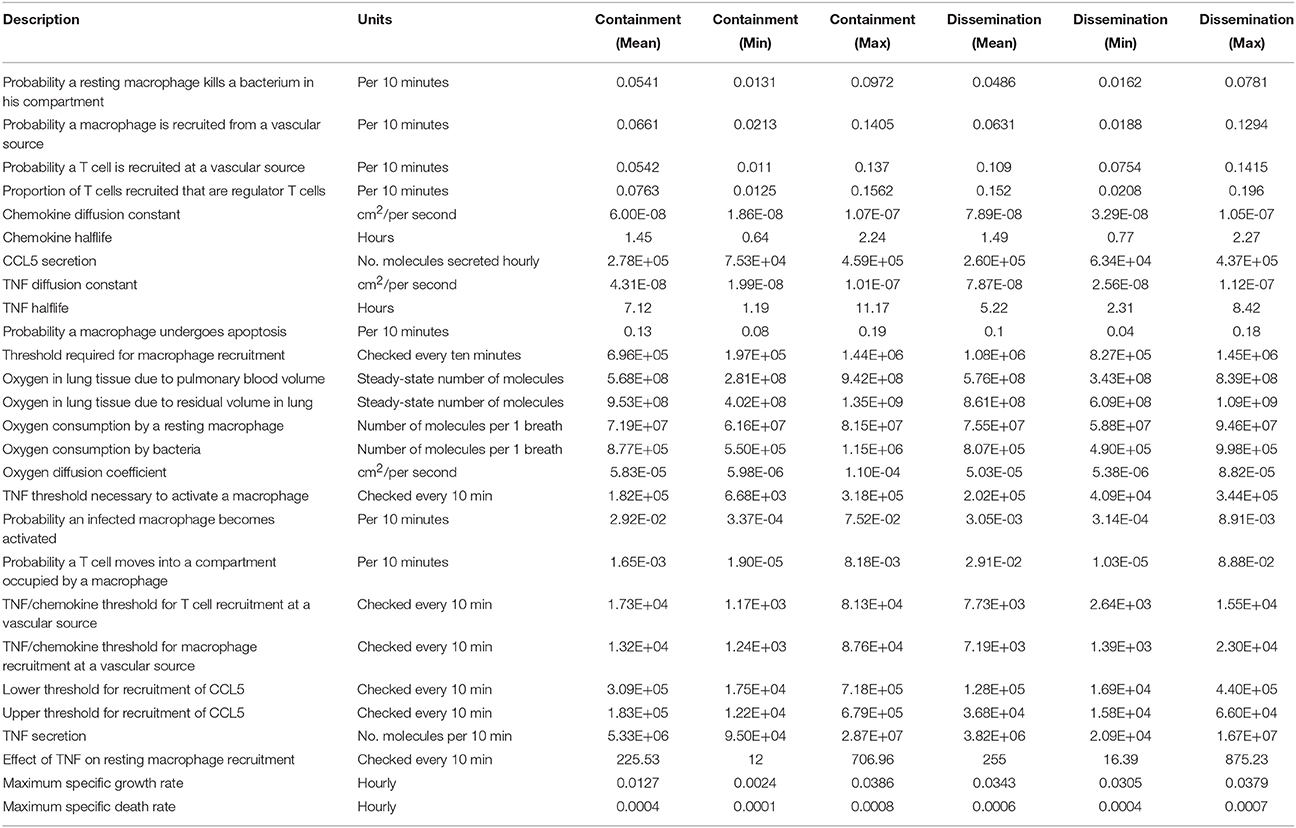
Table 5. Containment and dissemination parameters for simulation runs used in sensitivity analysis.
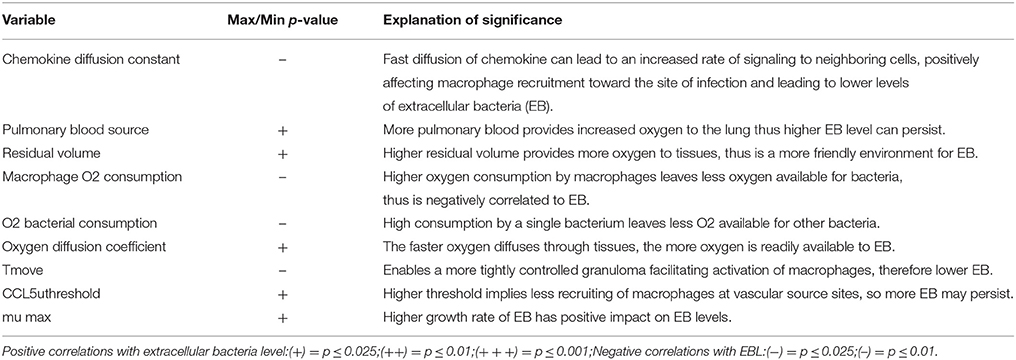
Table 6. Significant Partial Rank Correlation Coefficients for the integrated multiscale model of oxygen-modulated host response to Mtb infection.
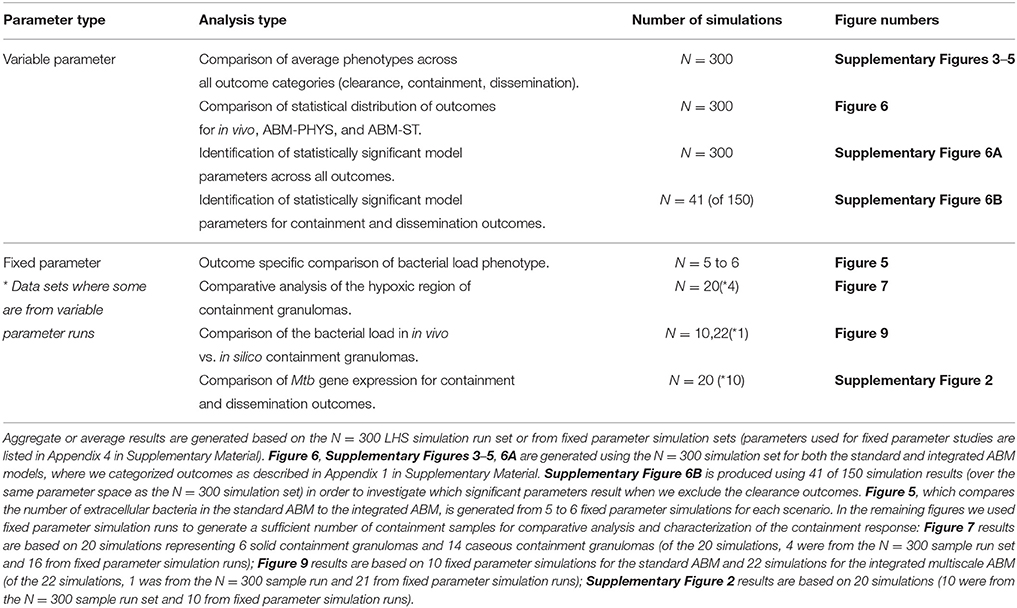
Table 7. Explanation of simulation data sets used to generate figures of aggregate results and comparative outcome for ABM-PHYS and ABM-ST.
Given the large number of clearance outcomes represented by the N = 300 (100 average outcomes) simulation run, we generated a non-averaged simulation set to determine which parameters are statistically significant if we consider only the non-clearance outcomes. To determine the PRCCs for the containment and dissemination outcomes, we ran 150 individual simulations of the model over our input parameter space using different random number seeds. The 150 runs resulted in 41 non-clearance, non-averaged outcomes, which ensured that we retained a reasonable number of degrees of freedom after removing the clearance outcomes to determine statistical significance. We used the rules in Appendix 1.1 in Supplementary Material to categorize the outcome as clearance vs. non-clearance. (See Tables 1, 2 for the ranges used in the Latin-hypercube sampling (LHS) analysis for each of the variables of interest.) We performed our PRCC analysis using the method described by Marino et al. (2008) and associated PRCC calculation tools freely available via download (Marino et al., 2008). Supplementary Figure 6B shows the significant variables without the clearance outcomes included in the analysis (p = 0.05) using N = 41 of 150 set of individual simulation runs. The significant inputs include: probability that a macrophage kills bacteria, which is negatively correlated to extracellular bacterial (ECB) load; probability of macrophage recruitment, which is positively correlated with ECB levels possibly due to crowding effects within the granuloma and the inability of T cells to migrate to the center and activate macrophages, as described well in Segovia-Juarez et al. (2004). Increased T reg cell recruitment to ECB-containing regions may result in a lower probability of cytotoxic (killer) T cell recruitment, thus the positive correlation of the T reg recruitment with ECB. TNF diffusion constant and TNF half-life are positively correlated with ECB, at later stages of the infection, which is plausible given TNF's roles in inducing apoptosis of infected macrophages (Wajant et al., 2003). Combined TNF/chemokine threshold for T cell recruitment (r.T) is negatively correlated with extracellular bacterial load as a low threshold leads to increased T cell recruitment and consequentially an increase in the number of activated macrophages able to eliminate the pathogen. The final significant parameter, TNF secretion, is negatively correlated with ECB early on in the infection, which would be expected given TNF's pro-inflammatory role (see Ray et al., 2009). However, it is slightly positively correlated with ECB around 100 days post infection, which may be attributed to chronically infected macrophages and T cell populations continual production of TNF during the dissemination scenario.
Discussion
Using our ABM-PHYS model of TB disease, we explored the correlation between host immune response, physiological response with respect to oxygen, and outcome of infection. While the model architecture determined the general interaction between model components, we used uncertainty quantification methods to explore the parameter space and discover emergent system properties that correspond to bacterial clearance, containment/latency, or dissemination.
Using outcomes from our simulation model our analysis has shown significant correlations between the oxygen input variables and the extracellular bacteria levels (ECB) when all outcomes are considered (Table 6; Supplementary Figure 6A). Notably parameters such as chemokine diffusion constant, pulmonary blood source, residual volume, macrophage O2 consumption, O2 bacterial consumption, oxygen diffusion coefficient, Tmove, CCL5uthreshold, and μmax (Table 6) were significantly correlated with the amount of extracellular bacteria, which was used to classify simulation outcomes. The majority of these parameters are related to physiology-dependent oxygen availability or immune-dependent modulation of oxygen physiology. Therefore, the model demonstrates that oxygen-related physiological characteristics (pulmonary blood source, residual volume, oxygen diffusion coefficient, baseline macrophage O2 consumption) combined with immune-related physiological characteristics that bring oxygen-consuming cells to the site of infection (chemokine diffusion constant, Tmove, CCL5 threshold) integrate to determine how quickly hypoxic regions occur and how long they are maintained. The rate of hypoxic onset and duration in turn impacts Mtb oxygen relevant characteristics (bacterial O2 consumption, bacterial growth rate/μmax, and persistence). The observed connection between physiology, immune response, oxygen gradients and infection outcome, demonstrates a structural host response mediated, oxygen-dependent immunological contribution to Mtb infection outcome. However, when we only consider the containment, transient containment and dissemination scenarios (Supplementary Figure 6B), seven significant inputs appear, none directly related to oxygen. The significant parameters for the non-clearance outcomes suggest a more macrophage/TNF centric response to infection, with reduced pro-inflammatory response when compared to clearance outcomes. The absence of O2 drivers in the non-clearance outcomes provides further evidence supporting the importance of the oxygen dependent physiological immune response in eliminating M. tuberculosis.
The Transient LTBI Response
Another unique aspect of this work is that, to our knowledge, our model represents the first integration of Mtb metabolic dynamics into the ABM modeling framework to enable the exploration of bacterial response to host dynamics and physiological oxygen dynamics concurrently. The integration and the number of bacterial cells we model necessitated the use of an integrated software platform to serially execute the cellular model, while we ran the intracellular TB model using BioXyce. The integration of the host–pathogen interaction and physiological responses enabled the exploration of both molecular and cellular mechanisms that contribute to granuloma formation in tuberculosis.
We used the derivatives of the external bacterial load and recruitment of new macrophages for our mathematical classification of the four qualitative outcomes, including transient containment (see Supplementary Figures 3–5, Appendix 1 in Supplementary Material). Previous models of TB focus on the three recognized clinical outcomes of infection: disease clearance, granuloma formation and containment, or pathogen dissemination. Our discovery of the transient containment category of outcomes is a new insight from our work that has not been addressed in prior theoretical models of TB infection and granuloma formation, and is an observation that can contribute to our understanding of Mtb reactivation. Reactivation of Mtb from a granuloma has been investigated in other models by various means such as simulating the addition of an exogenous chemical agent that interferes with immune response. However, we identified and computationally observed transient containment events as an emergent property where granulomas seem to fail without exogenously introduced factors and the presumably contained bacteria moves toward reemergence and dissemination. Our observation and characterization of this class of outcomes can point to immunological differences that contribute to chronic disease and of great importance, factors that may lead to the breakdown of granulomas and potentially disease re-activation in LTBI individuals with reduced pulmonary capacity such as those with emphysema or COPD. Also the framework can be used to investigate how modulating non-host factors such as environmental oxygen changes the outcome of infection and granuloma formation. Given that relocation of TB patients to higher altitudes was previously considered therapeutic, as an example, we lowered the atmospheric oxygen constant to represent 18% oxygen (higher altitude, Supplementary Figure 7B) instead of 21% representing normal oxygen levels at sea level (Supplementary Figure 7A). The change in environmental oxygen leads to a slightly more tightly-formed granuloma with less caseous cells under 18% oxygen than the 21% oxygen levels at 200 days post-infection.
In summary, the multiscale modeling approach enables portrayal of granuloma structure, dynamics, and demonstrates the link between granuloma physiology and immunological functionality. Incorporating oxygen dynamics into the framework of granuloma simulation and integrating a systems biology model of Mtb allows us to capture Mtb biochemical response to oxygen dynamics in the bacterias immediate microenvironment, with the pathogen showing an adaptation response similar to that observed in the Wayne model during the two stages of in vitro NRP.
While the bacterial response is similar (in terms of persistence under varying conditions) to the Wayne model, the physiological immune response that led to the various microenvironments and simulation model outcomes were not designed into the model. The changes in the microenvironment (oxygen dynamics, dynamic onset of hypoxia, etc.) are emergent properties that were observed after categorizing the simulation results into the four outcomes (containment, clearance, etc.). The observation (Figure 7) that the oxygen dynamics for the containment outcome was similar to the Wayne NRP1 and NRP2 microenvironment is again an emergent outcome and not forced by the model. As such, these results demonstrate the importance of accounting for the physiological aspects of immune response in theoretical models of Mtb infection.
Our simulation model also replicates the oxygen-dependent immunological outcomes of infection observed in vivo, with the average size of the hypoxic regions calculated for our simulated containment granuloma correlating to that found in in vivo models of Mtb infection (Via et al., 2008). As a result our integrated multiscale model is able to more accurately capture the physiological, cellular, and molecular host–pathogen mechanisms that are key to successful host clearance of Mtb, host failure and Mtb dissemination, or bacterial persistence and onset of LTBI, a current challenge in the treatment of tuberculosis.
We have demonstrated through simulation that the structural immune response coupled with the physiological impact of oxygen is a mediating influence on the outcome of Mtb infection. Specifically our results have shown that including oxygen dynamics in the model enables a closer portrayal of the progression of the infection, which more accurately parallels statistical infection outcomes observed in animal models of TB disease and in WHO human LTBI rates in the population. The methods used for incorporating oxygen into a multiscale infection model is extensible to other disease models, therefore the modeling methodology we developed is not only TB specific but broadly relevant as our methods can be applied more widely to understand other host-pathogen systems.
Author Contributions
Conceived and designed the experiments: CS, EM. Performed the experiments: CS. Analyzed the data: CS, EM. Developed modeling and analysis tools: CS, SP, EM. Wrote the manuscript: CS, SP, EEM.
Conflict of Interest Statement
The authors declare that the research was conducted in the absence of any commercial or financial relationships that could be construed as a potential conflict of interest.
Acknowledgments
The authors would like to thank Dr. Alfred O. Ongiro for providing review and commentary for this paper. We would also like to thank Jeffrey Sarlo in the High Performance Computing Center at the University of Houston for technical support. We also thank the reviewers for providing critical feedback, which helped improve our manuscript. Research supported by DTRA/Henry M. Jackson Foundation FA8650-10-2-6062 subaward 2381, NIH/NHLBI award K25HL075105, NSF award MCB-1445470, and Sandia National Laboratories LDRD program. Sandia is a multiprogram laboratory operated by Sandia Corporation, a Lockheed Martin Company for the US DoE's NNSA under contract DE-AC04-94AL85000.
Supplementary Material
The Supplementary Material for this article can be found online at: https://www.frontiersin.org/article/10.3389/fcimb.2016.00006
Supplementary Figure 1. Regression model for two genes etfA and fum: actual (blue) vs. predicted (red).
Supplementary Figure 2. Gene expression for cell at the center of the grid for the containment and dissemination outcome scenarios over 200 days post-infection. ATPH gene (Left); ACEAB gene (Right). Inset: Voskuil data for aerobic (red) and hypoxic (green) conditions. Results represent averages over 10 simulations per outcome (5 from N = 300 simulation run set and 5 from fixed parameter simulation runs).
Supplementary Figure 3. Substrates levels from the Mtb metabolic model 200 days post-infection. Glycine-a; Malate-b; Isocitrate-c; Glyoxylate-d. Results represent sample averages from 300 simulation run set (number of simulations per outcome: 13 clearance, 6 containment, 5 transient containment, and 7 dissemination).
Supplementary Figure 4. Average response of cells across the simulation grid during clearance, containment, and dissemination. (A) Average growth rate of extracellular bacteria (inset - equilibrium containment averages); (B) average growth rate of intracellular bacteria; (C) average hourly extracellular growth rate; (D) average hourly intracellular bacterial growth rate; (E) average scaled NAD/NADH ratio of extracellular bacteria; (F) average scaled NAD/NADH Ratio of intracellular bacteria; (G) average extracellular ATP; (H) average intracellular ATP; (I) average rate of oxygen depletion across the granuloma. Averages over 300 total simulations.
Supplementary Figure 5. Response of cell at the center of the grid for the clearance, containment, and dissemination outcome scenarios: (A) average growth rate of extracellular bacteria; (B) average growth rate of intracellular Bacteria; (C) average oxygen tension (mmHg); (D) average depletion rate. Averages over 300 total simulations.
Supplementary Figure 6. Significant Partial Rank Correlation Coefficients for the integrated multiscale model show the impact of oxygen dynamics and physiological host response on Mtb infection outcome. Extracellular Bacterial levels are used as the outcome measure. Analysis results are based on multi-sample averages of the 300 simulation outcomes (A) and 41 individual non-clearance outcomes (B).
Supplementary Figure 7. Containment granuloma at 21 percent oxygen (left, A) and 18 percent oxygen (right, B).
Supplementary Table 1. Parameters of the containment and dissemination run both with the ABM as standalone model and the multi scale model.
Abbreviations
Mtb, Mycobacterium tuberculosis; NRP, non-replicating persistence; TB, tuberculosis; WHO, World Health Organization; LTBI, latent tuberculosis infection; NO, nitric oxide; TNF-α, tumor necrosis factor alpha; CCL2/CCL5, chemokine (C-C motif) ligand 2/5; CXCL9/10/11, chemokine (C-X-C motif) ligand 9/10/11; ODE, ordinary differential equation; ATP, adenosine triphosphate; ABM, agent-based model; TCA, tricarboxylic acid; NAD/NADH, nicotinamide adenine dinucleotide/hydride; LHS, Latin hypercube sampling; PCC, partial correlation coefficients; PRCC, partial regression correlation coefficients; K-S test, Kolmogorov-Smirnov test; CFL, condition Courant-Friedrichs-Lewy condition; CFU, colony-forming unit; ETC, electron transport chain; IFN-γ, Interferon-γ; HIV, human immunodeficiency virus; COPD, chronic obstructive pulmonary disease; LAPACK, linear algebra package; pK, probability a macrophage kills Mtb; prob-recruit-T, probability a T cell is recruited at a vascular source; tao-TNF, macrophage TNF detection threshold; 3D, three-dimensional.
References
Adams, B. H., Bohnhoff, W. J., Dalbey, K. R., Eddy, J. P., Eldred, M. S., Gay, D. M., et al. (2010). DAKOTA, A Multilevel Parallel Object-Oriented Framework for Design Optimization, Parameter Estimation, Uncertainty Quantification, and Sensitivity Analysis: Version 5.0 User's Manual. Sandia Technical Report SAND2010-2183.
Altman, P. L., and Dittmer, D. S. (1974). Biology data book: respiration and circulation. Fed. Am. Soc. Exp. Biol. 3, 1571–1574.
Beste, D. J. V., Hooper, T., Stewart, G., Bonde, B., Avignone-Rossa, C., Bushell, M. E., et al. (2007). GSMN-TB: a web-based genome-scale network model of Mycobacterium tuberculosis metabolism. Genome Biol. 8:R89. doi: 10.1186/gb-2007-8-5-r89
Calvert, L. (2014). Numerical Methods Library for Octave, User's Guide. Available online at: http://www.ipb.pt/~balsa/teaching/MA08_09/UsersGuide.pdf (Accessed April 02, 2014).
Cilfone, N. A., Perry, C. R., Kirschner, D. E., and Linderman, J. J. (2013). Multi-scale modeling predicts a balance of tumor necrosis factor-α and interleukin-10 controls the granuloma environment during Mycobacterium tuberculosis infection. PLoS ONE 8:e68680. doi: 10.1371/journal.pone.0068680
Co, D. O., Hogan, L. H., Kim, S. I., and Sandor, M. (2004). Mycobacterial granulomas: keys to a long-lasting host–pathogen relationship. Clin. Immunol. 113, 130–136. doi: 10.1016/j.clim.2004.08.012
Conkling, P., Papermaster-Bender, G., Whitcomb, M., and Sagone, A. L. (1982). Oxygen dependence of human alveolar macrophage-mediated antibody-dependent cytotoxicity. Infect. Immun. 38, 114–121.
Datta, M., Via, L., Chen, W., Bash, J., Xu, L., Barry, C., et al. (2015). Mathematical model of oxygen transport in Tuberculosis granulomas. Ann. Biomed. Eng. doi: 10.1007/s10439-015-1415-3. [Epub ahead of print].
Deb, C., Lee, C. M., Dubey, V. S., Daniel, J., Abomoelak, B., Sirakova, T. D., et al. (2009). A novel in vitro multiple-stress dormancy model for Mycobacterium tuberculosis generates a lipid-loaded, drug-tolerant, dormant pathogen. PLoS ONE 4:e6077. doi: 10.1371/journal.pone.0006077
Dock, D. S., Kraus, W. L., McGuire, L. B., Hyland, J. W., Haynes, F. W., and Dexter, L. (1961). The pulmonary blood volume in man. J. Clin. Invest. 40, 317–328. doi: 10.1172/jci104259
Eaton, J. W., Bateman, D., Hauberg, S., and Wehbring, R. (2014). GNU Octave Version 3.8.1 Manual: a High-level Interactive Language for Numerical Computations. CreateSpace Independent Publishing Platform. Available online at: https://www.gnu.org/software/octave/doc/interpreter/Simple-Examples.html
Fallahi-Schani, M., El-Kebir, M., Marion, S., Kirschner, D. E., and Linderman, J. J. (2011). Multiscale computational modeling reveals a critical role for TNF-α receptor 1 dynamics in tuberculosis granuloma formation. J. Immunol. 15, 3472–3483. doi: 10.4049/jimmunol.1003299
Fisher, N., Warman, A. J., Ward, S. A., and Biagini, G. A. (2009). Type II NADH: quinone oxidoreductases of Plasmodium falciparum and Mycobacterium tuberculosis: kinetic and high-throughput assays. Methods Enzymol. 456, 303–320. doi: 10.1016/S0076-6879(08)04417-0
Gideon, H. P., Phuah, J. Y., Myers, A. J., Bryson, B. D., Rodgers, M. A., Coleman, M. T., et al. (2015). Variability in tuberculosis granuloma T cell responses exists, but a balance of pro- and anti-inflammatory cytokines is associated with sterilization. PLoS Pathog. 1:e1004603. doi: 10.1371/journal.ppat.1004603
Gomez, J. E., and McKinney, J. D. (2004). M. tuberculosis persistence, latency, and drug tolerance. Tuberculosis 84, 29–44. doi: 10.1016/j.tube.2003.08.003
Grieg, M. E., and Hoogerheide, J. C. (1941). The Correlation of Bacterial Growth with Oxygen Consumption. J. Bacteriol. 1, 549–556.
Hou, C., Gheorghiu, S., Huxley, V. H., and Pfeifer, P. (2010). Reverse engineering of oxygen transport in the lung: adaptation to changing demands and resources through space-filling networks. PLoS Comput. Biol. 6:e1000902. doi: 10.1371/journal.pcbi.1000902
Iovanic, Z. (2009). Physiological, ex vivo cell oxygenation is necessary for a true insight into cytokine biology. Eur. Cytokine Netw. 20, 7–9. doi: 10.1684/ecn.2009.0144
Leeper-Woodford, S. K., and Mills, J. W. (1992). Phagocytosis and ATP levels in Alveolar macrophages during Acute Hypoxia. Am. J. Respir. Cell Mol. Biol. 6, 326–334. doi: 10.1165/ajrcmb/6.3.326
Lewis, J. S., Lee, J. A., Underwood, J. C. E., Harris, A. L., and Lewis, C. E. (1999). Macrophage responses to hypoxia: relevance to disease mechanisms. J. Leukoc. Biol. 66, 889–900.
Lin, P. L., Ford, C. B., Coleman, M. T., Myers, A. J., Gawande, R., Ioerger, T., et al. (2014). Sterilization of granulomas is common in active and latent tuberculosis despite within-host variability in bacterial killing. Nat. Med. 20, 75–79. doi: 10.1038/nm.3412
Loose, L. (1984). Characterization of macrophage dysfunction in rodent malaria. J. Leukoc. Biol. 6, 703–718.
MacDougall, J. D. B., and McCabe, M. (1967). Diffusion coefficient of oxygen through tissues. Nature 215, 1173–1174. doi: 10.1038/2151173a0
Marino, S., El-Kebir, M., and Kirschner, D. (2011). A hybrid multi-compartment model of granuloma formation and T cell priming in tuberculosis. J. Theor. Biol. 280, 50–62. doi: 10.1016/j.jtbi.2011.03.022
Marino, S., Hogue, I. B., Ray, C. J., and Kirschner, D. E. (2008). A methodology for performing global uncertainty and sensitivity analysis in systems biology. J. Theor. Biol. 254, 178–196. doi: 10.1016/j.jtbi.2008.04.011
Marion, S., Sud, D., Plessner, H., Lin, P., Chan, J., Flynn, J., et al. (2007). Differences in reactiviation of tuberculosis induced form Anti-TNF treatments are based on bioavailability in granulomatous tissue. PLoS Comput. Biol. 3:e194. doi: 10.1371/journal.pcbi.0030194
May, E. E., Leitao, A., Tropsha, A., and Oprea, T. I. (2013). A systems chemical biology study of malate synthase and isocitrate lyase inhibition in Mycobacterium tuberculosis during active and NRP growth. Comput. Biol. Chem. 47C, 167–180. doi: 10.1016/j.compbiolchem.2013.07.002
May, E. E., and Schiek, R. (2009). BioXyce: an engineering platform for the study of cellular systems. IET Syst. Biol. 3, 77–86. doi: 10.1049/iet-syb.2007.0086
May, E. E. (2011). Circuit-Based Models of Biomolecular System Dynamics. Springer. doi: 10.1007/978-94-007-0149-6_7
Nelson, D. L., and Cox, M. M. (2005). Lehninger Principles of Biochemistry, 4th Edn. New York, NY: W. H. Freeman and Company.
Ray, J., Flynn, J., and Kirschner, D. (2009). Synergy between individual TNF-dependent function determines granuloma performance for controlling Mycobacterium tuberculosis infection. J. Immunol. 182, 3706–3717. doi: 10.4049/jimmunol.0802297
Roiniotis, J., Dinh, H., Masendycz, P., Turner, A., Elsegood, C. L., Scholz, G. M., et al. (2009). Hypoxia prolongs monocyte/macrophage survival and enhanced glycolysis is associated with their maturation under aerobic conditions. J. Immunol. 182, 7974–7981. doi: 10.4049/jimmunol.0804216
Scheer, M., Grote, A., Chang, A., Schomberg, I., Munaretto, C., Rother, M., et al. (2011). BRENDA, the enzyme information system in 2011. Nucleic Acids Res. 39, 670–676. doi: 10.1093/nar/gkq1089
Shiloh, M. U., Manzanillo, P., and Cox, J. S. (2008). Mycobacterium tuberculosis senses host-derived carbon monoxide during macrophage infection. Cell Host Microbe 3, 323–330. doi: 10.1016/j.chom.2008.03.007
Segovia-Juarez, J. L., Ganguli, S., and Kirschner, D. E. (2004). Identifying control mechanisms of granuloma formation during M. tuberculosis infection using an agent-based model. J. Theor. Biol. 231, 357–376. doi: 10.1016/j.jtbi.2004.06.031
Sershen, C. L., Plimpton, S. J., and May, E. E. (2014). A method for modeling oxygen diffusion in an agent-based model with application to host-pathogen infection. Conf. Proc.IEEE Eng. Med. Biol. Soc. 2014, 306–309. doi: 10.1109/EMBC.2014.6943590
Simon, L. M., Robin, E. D., Phillis, J. R., Acevedo, J., Axline, S. G., and Theodore, J. (1977). Enzymatic basis for bioenergetic differences of alveolar macrophages and enzyme regulation by molecular O2. J. Clin. Invest. 59, 443–448.
Singh, A., Crossman, D. K., Mai, D., Guidry, L., Voskuil, M. I., Renfrow, M. B., et al. (2009). Mycobacterium tuberculosis WhiB3 maintains redox homeostasis by regulating virulence lipid anabolism to modulate macrophage response. PLoS Pathog. 5:e1000545. doi: 10.1371/journal.ppat.1000545
Singh, S. V., and Ghosh, I. (2006). Kinetic modeling of tricarboxylic acid cycle and glyoxylate bypass in Mycobacterium tuberculosis, and its application to assessment of drug targets. Theory Biol. Med. Model 3:27. doi: 10.1186/1742-4682-3-27
Smith, C. V., Huang, C. C., Miczak, A., Russell, D. G., Sacchettini, J. C., and Bentrup, K. H. (2003). Biochemical and structural studies of malate synthase from Mycobacterium tuberculosis. J. Biol. Chem. 278, 1735–1743. doi: 10.1074/jbc.M209248200
Via, L. E., Lin, P. L., Ray, S. M., Carrillo, J., Allen, S. S., Eum, S. Y., et al. (2008). Tuberculosis granulomas are hypoxic in guinea pigs, rabbits, and nonhuman primates. Infect. Immun. 76, 2333–2340. doi: 10.1128/IAI.01515-07
Voskuil, M. I., Visconti, K. C., and Schoolnik, G. K. (2004). Mycobacterium tuberculosis gene expression during adaptation to stationary phase and low-oxygen dormancy. Tuberculosis (Edinb.) 84, 218–227. doi: 10.1016/j.tube.2004.02.003
Wajant, H., Pfizenmaier, K., and Scheurich, P. (2003). Tumor necrosis factor signaling. Cell Death Diff. 10, 45–65. doi: 10.1038/sj.cdd.4401189
Warrender, C., and Forrest, S. Koster, F. (2006). Modeling intercellular interactions in early mycobacterium infection. Bull. Math. Biol. 68, 2233–2261. doi: 10.1007/s11538-006-9103-y
Wayne, L. G., and Hayes, L. G. (1996). An in vitro model for sequential study of shiftdown of Mycobacterium tuberculosis through two stages of nonreplicating persistence. Infect Immun. 64, 2062–2069.
Weibel, E. R. (1999). Understanding the limitation of O2 supply through comparative physiology. Respir. Physiol. 118, 85–93. doi: 10.1016/S0034-5687(99)00084-5
World Health Organization (2013). Global Tuberculosis Report. Available online at: http://www.who.int/tb/publications/global_report/en/
Keywords: Mycobacterium tuberculosis, agent based model, systems biology, granuloma, multiscale modeling, host-pathogen interactions, dormancy, lung diseases
Citation: Sershen CL, Plimpton SJ and May EE (2016) Oxygen Modulates the Effectiveness of Granuloma Mediated Host Response to Mycobacterium tuberculosis: A Multiscale Computational Biology Approach. Front. Cell. Infect. Microbiol. 6:6. doi: 10.3389/fcimb.2016.00006
Received: 24 April 2015; Accepted: 13 January 2016;
Published: 15 February 2016.
Edited by:
Adel M. Talaat, University of Wisconsin Madison, USAReviewed by:
Martin I. Voskuil, University of Colorado Denver, USADavid John Klinke, West Virginia University, USA
Denise Kirschner, University of Michigan Medical School, USA
Copyright © 2016 Sershen, Plimpton and May. This is an open-access article distributed under the terms of the Creative Commons Attribution License (CC BY). The use, distribution or reproduction in other forums is permitted, provided the original author(s) or licensor are credited and that the original publication in this journal is cited, in accordance with accepted academic practice. No use, distribution or reproduction is permitted which does not comply with these terms.
*Correspondence: Elebeoba E. May, eemay@central.uh.edu