Blood Cells and Venous Thromboembolism Risk: A Two-Sample Mendelian Randomization Study
 Jiahao He
 Qian Jiang
  Yiting Yao
- State Key Laboratory of Respiratory Disease, National Center for Respiratory Medicine, National Clinical Research Center for Respiratory Disease, Guangzhou Institute of Respiratory Health, The First Affiliated Hospital of Guangzhou Medical University, Guangzhou, China
Background: Previous studies have shown that various cell indices are associated with a higher risk of venous thromboembolism (VTE), however, whether these findings reflect a causal relationship remains unclear. Therefore, we performed a two-sample Mendelian randomization (MR) analysis to assess the causal association of various blood cells with VTE risk.
Study Design and Methods: Summary statistics of genetic instruments representing cell indices for erythrocytes, leukocytes, and platelets were extracted from genome-wide association studies of European ancestry, by Two-Sample Mendelian Randomization. Inverse variance weighting (IVW) was used as the primary analytical method for MR. Sensitivity analyses were performed to detect horizontal pleiotropy and heterogeneity.
Results: Genetically predicted red blood cell distribution width, mean reticulocyte volume, and mean red blood cell volume were positively associated with VTE, with odds ratio (OR) of 1.002 [CI 1.000–1.003, P = 0.022), 1.003 (CI 1.001–1.004, P = 0.001, respectively)] and 1.001 (CI 1.000–1.002, P = 0.005). Genetically predicted monocyte count was negatively correlated with VTE, with OR = 0.998 (CI 0.996–0.999, P = 0.041).
Conclusion: Genetically liability to high- red blood cell distribution width, mean reticulocyte volume, mean red blood cell volume, and low monocyte count are associated with the higher risk of VTE. Targeting these factors might be a potential strategy to prevent VTE.
Introduction
Venous thromboembolism including deep vein thrombosis and pulmonary embolism, the third most common vascular disease, is currently one of the leading causes of unanticipated and perioperative deaths in hospitals, affecting nearly 1 million people worldwide each year (1, 2). VTE is affected by a variety of environmental and genetic factors (3). Studies have shown that blood cells such as red blood cells, white blood cells and platelets are associated with the risk of VTE (4–9). In addition, pathology suggests that the embolic components of VTE patients include red blood cells, platelets and white blood cells (10, 11). However, the causal relationship between blood cells and the risk of VTE remains unclear. The occurrence of VTE and changes in cell indices are affected by a variety of factors, such as immobilization, infection, surgery and disease; in addition, if cell indices changes are secondary to the occurrence of VTE or a prothrombotic state, there may also be reverse causality. Evidence from previous observational studies may be influenced by confounding factors or reverse causality.
Mendelian randomization (MR) is an epidemiological method that uses genetic variation as an instrumental variable for exposure to estimate the causal effect of exposure on outcomes and strengthens causal inference, overcoming the limitations of traditional observational study designs by using Mendelian laws, exploits the random assignment to genotypes at conception, making genotypes independent of potential confounders and also avoiding reverse causality (12). Two-sample MR analysis is an extension of the MR approach that allows summary statistics from genome-wide association studies (GWAS) to be used in MR studies without direct analysis of individual-level data (13). In recent years, two-sample MR studies have gradually been recognized by researchers, allowing data between genetic instrument variables and phenotypes, phenotypes and diseases to come from two different independent populations, improving the efficiency and statistical power of the study (14–16). Through the statistical method of two-sample MR, this study used the genome-wide association analysis (GWAS) database to select single nucleotide polymorphism (SNP) loci as instrumental variables to explore the relationship between blood cells (erythrocytes, leukocytes, and platelets) indices and VTE.
Materials and Methods
Study Design
A schematic diagram of the study design and the three hypotheses of MR are presented in Figure 1. Genetic variants associated with cell indices are used as instrumental variables (IVs) to assess causal associations with VTE risk. There are three main assumptions that need to be met to perform an MR analysis: First, there is a robust correlation between these instrumental variables and exposure factors (association hypothesis); second, the instrumental variables are independent of the confounding factors that affect the “exposure-outcome” relationship (independence assumption). Finally, genetic variation affects outcomes only through exposure, not through other pathways (exclusivity hypothesis). Genetic associations between instrumental variables and traits were adjusted for age, sex, and study-specific covariates included in the GWAS. We performed a secondary analysis of publicly available pooled data. This manuscript did not produce any raw data. Ethical approval for each study used and informed consent from subjects were provided in the original publication. Secondary analyses of aggregated data do not require an Institutional Review Board. This study followed the ethical guidelines of the 1975 Declaration of Helsinki.
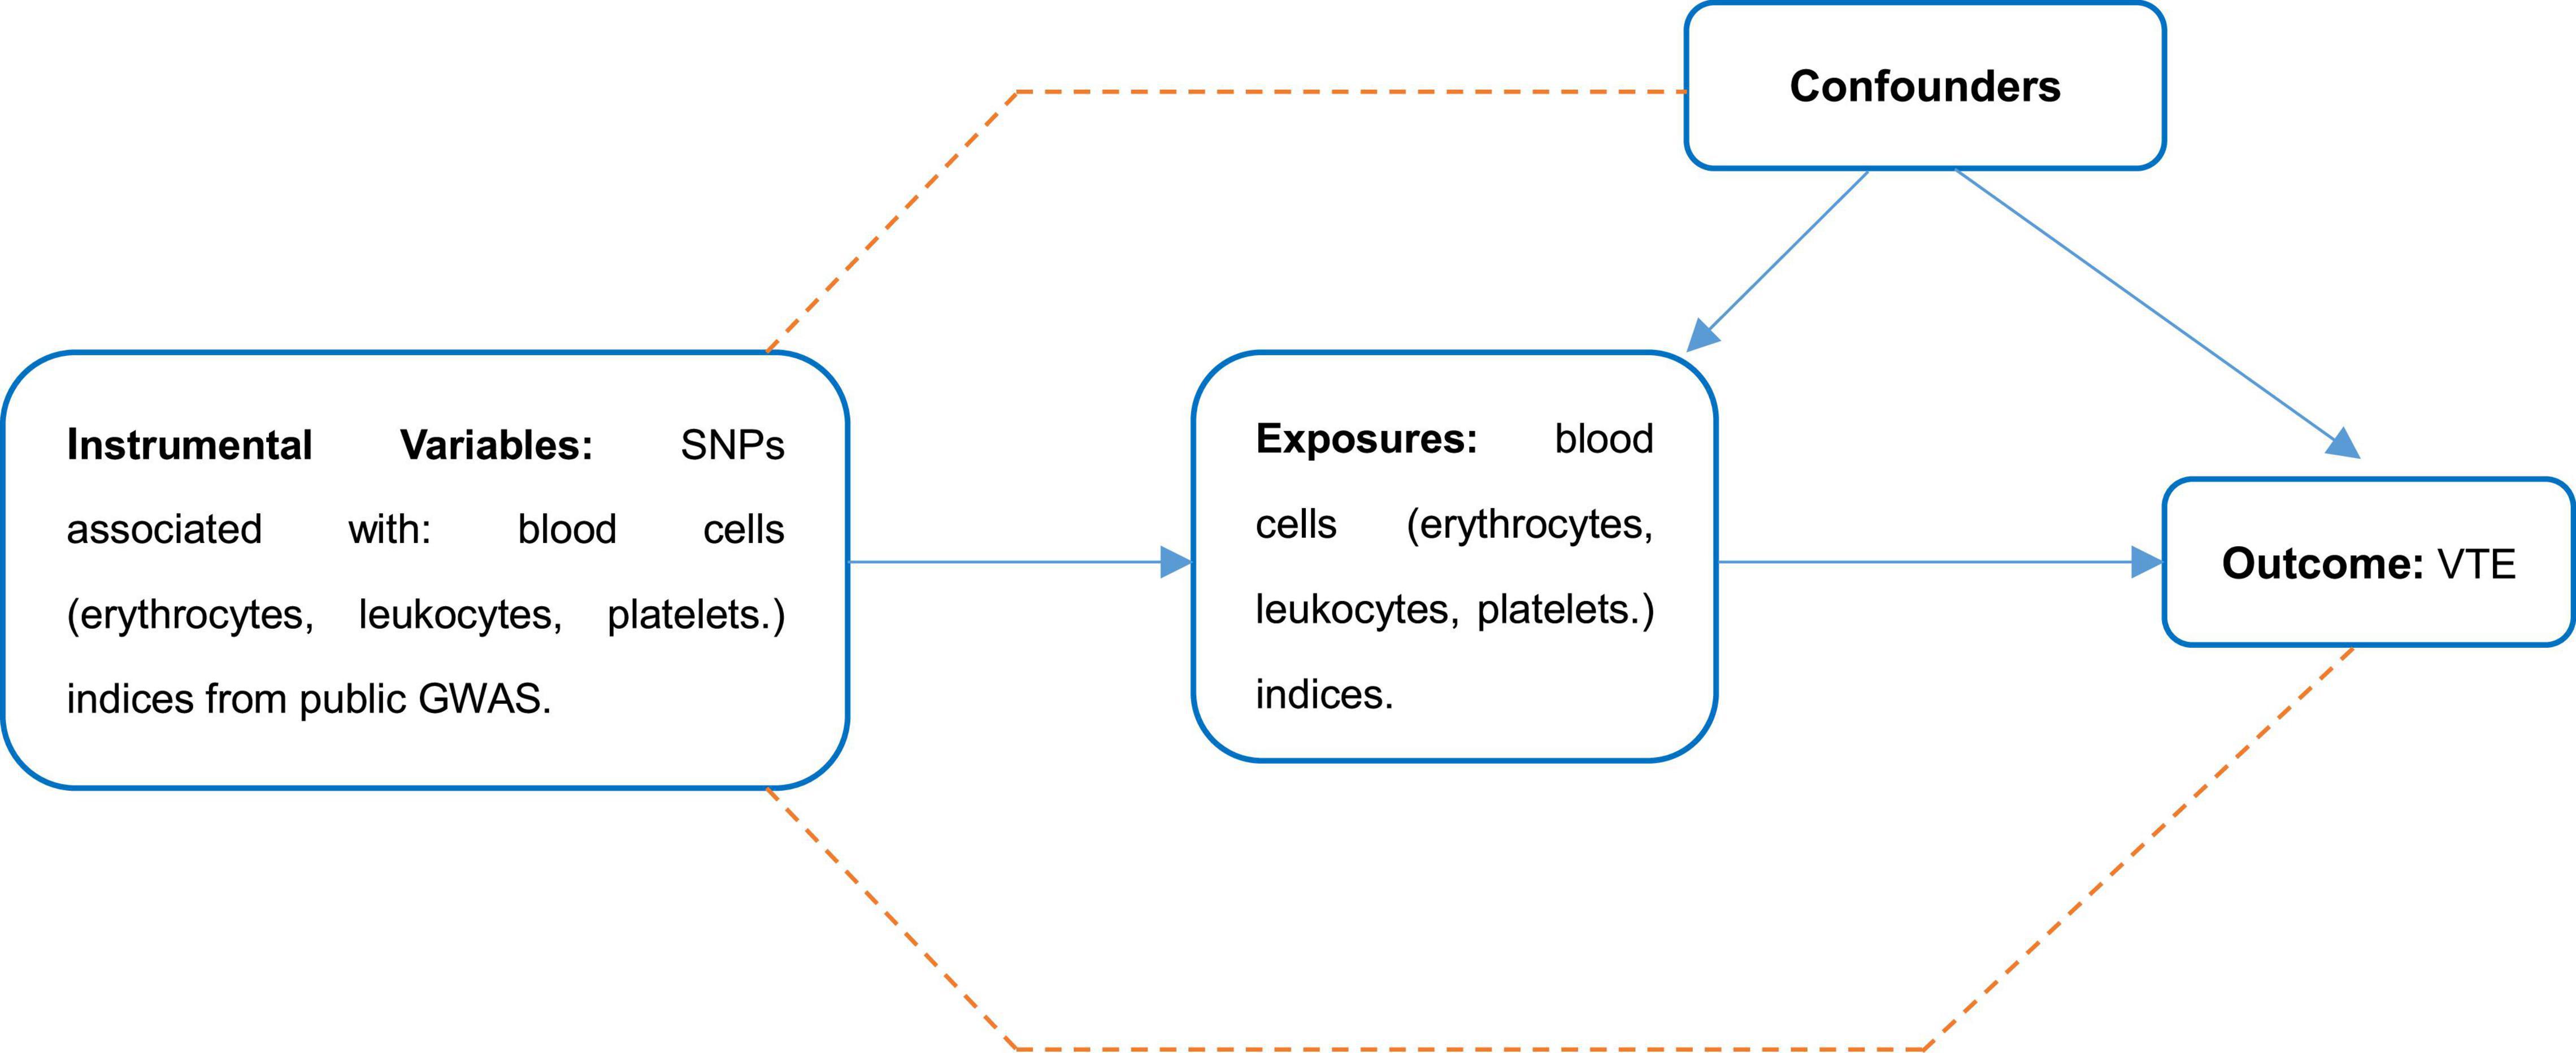
Figure 1. The scheme of study design.
Data Source and Single Nucleotide Polymorphism Selection
Summary level data of the cell indices which related to red blood cells, white blood cells and platelets from the Neale lab analysis of UK Biobank phenotypes, round 21, 4,620 patients and 356,574 controls with European-ancestry were included, of whom 53.76% were female and 46.24% were male. Summary level data of the cell indices which related to neutrophils, eosinophils, and basophils from the datasets that satisfy minimum requirements imported from the EBI database of complete GWAS summary data2. Summary level data of the cell indices which related to neutrophils, eosinophils, and basophils from the datasets that satisfy minimum requirements imported from the EBI database of complete GWAS summary data (see text footnote 2) which involved 173,480 European-ancestry participants. Detailed information of data source for the instrumental variables associated with exposures are shown in Supplementary Tables 1, 2. Single-nucleotide polymorphisms (SNPs) were identified as associated with the exposures with p-values at the genome-wide significance level (p < 5 × 10⁻⁸). SNPs with R2 > 0.01 and within 5,000 kb distance were identified as in linkage disequilibrium and were excluded from the study. Associations of these SNPs with VTE were studied in summary level results including 4,620 patients and 356,574 controls from Neale lab analysis of UK Biobank phenotypes, round 2 (see text footnote 1), 53.76% are female and 46.24% are male. The study design like the collection of samples, quality control procedures and imputation methods have been described in the original publication. Genotype imputation and associated quality control procedures have been previously described (17, 18).
Statistical Methods
The multiplicative random-effects (RE) and fixed-effects (FE), inverse-variance weighted (IVW) were used to assess the causal associations between the exposures and VTE. The effect measures were the odds ratio (OR) of the risk of VTE, which was normalized to one SD increment in each exposure factor. In addition, we conducted weighted median (WM)-based method and MR-Egger statistical sensitivity analyses to ensure the robustness of pleiotropic IVs (19). MR-Egger method can identify potential pleiotropy (p for intercept <0.05) and give corrected estimates (20). Heterogeneity was assessed with the I2 index (21) and the funnel plot (22). We used leave-one-out analysis to evaluate the stability of these genetic variants by excluding one individual SNP each time. All statistical results are two-sided, and a p < 0.05 was considered statistically significant. The statistical analyses were performed with R (version 4.0.4), TwoSampleMR (0.5.5), and MR (0.5.0) (23).
Results
Mendelian randomization analysis showed that red blood cell distribution width (RDW), mean corpuscular volume of reticulocyte (MCVr), mean corpuscular volume (MCV), and monocyte count (MONO) had a significant causal relationship to VTE (Table 1). All MR results are shown in Supplementary Table 2. The results showed that genetically predicted RDW, MCVr, and MCV were positively correlated with VTE but monocyte count was negatively correlated with VTE. RDW, MCVr, and MONO used the multiplicative random-effects model IVW because of large heterogeneity, while MCV used fixed-effects model IVW (Figure 2 and Table 1). Heterogeneity test results are the same as funnel plot results (Supplementary Figures 1–23). The MR-Egger method did not find horizontal pleiotropy (RDW: P = 0.279, MCVr: P = 0.0701, MCV: P = 0.400, MONO: P = 0.246), and the Leave-one-out sensitivity test showed all independent SNP could drive a significant effect of RDW on VTE. The significant associations of RDW and VTE did not remain after removing move one of them, but in MCVr, MCV, and MONO, we did not find any independent SNP could drive a significant effect on VTE (Supplementary Figures 24–46). We found no causal relationship between other cell indices and VTE (Supplementary Figures 47–69). Scatter plot showing the relationship between 23 exposure factors and VTE (Supplementary Figures 70–92).
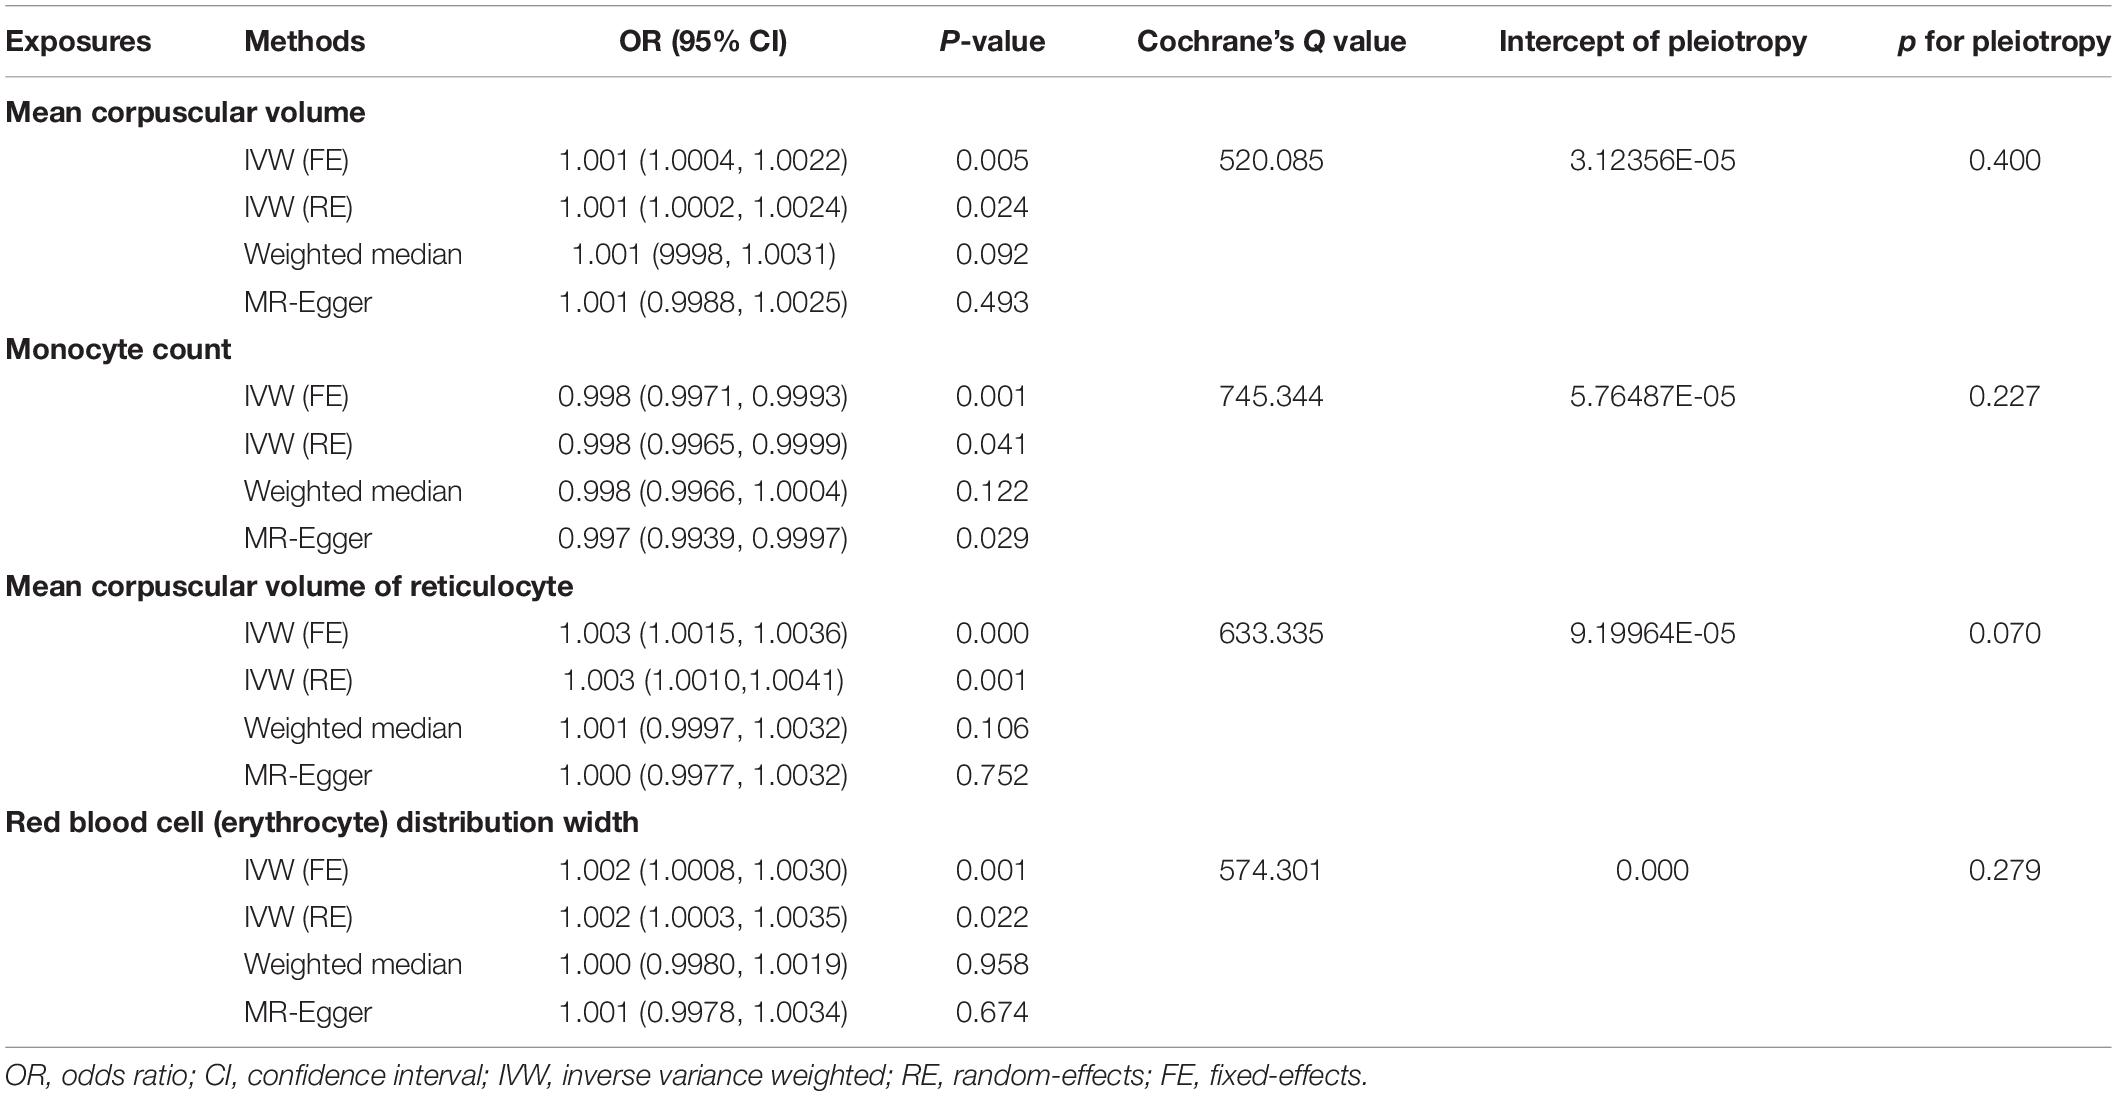
Table 1. Mendelian randomization estimates for the causal effect of cell indices on VTE.
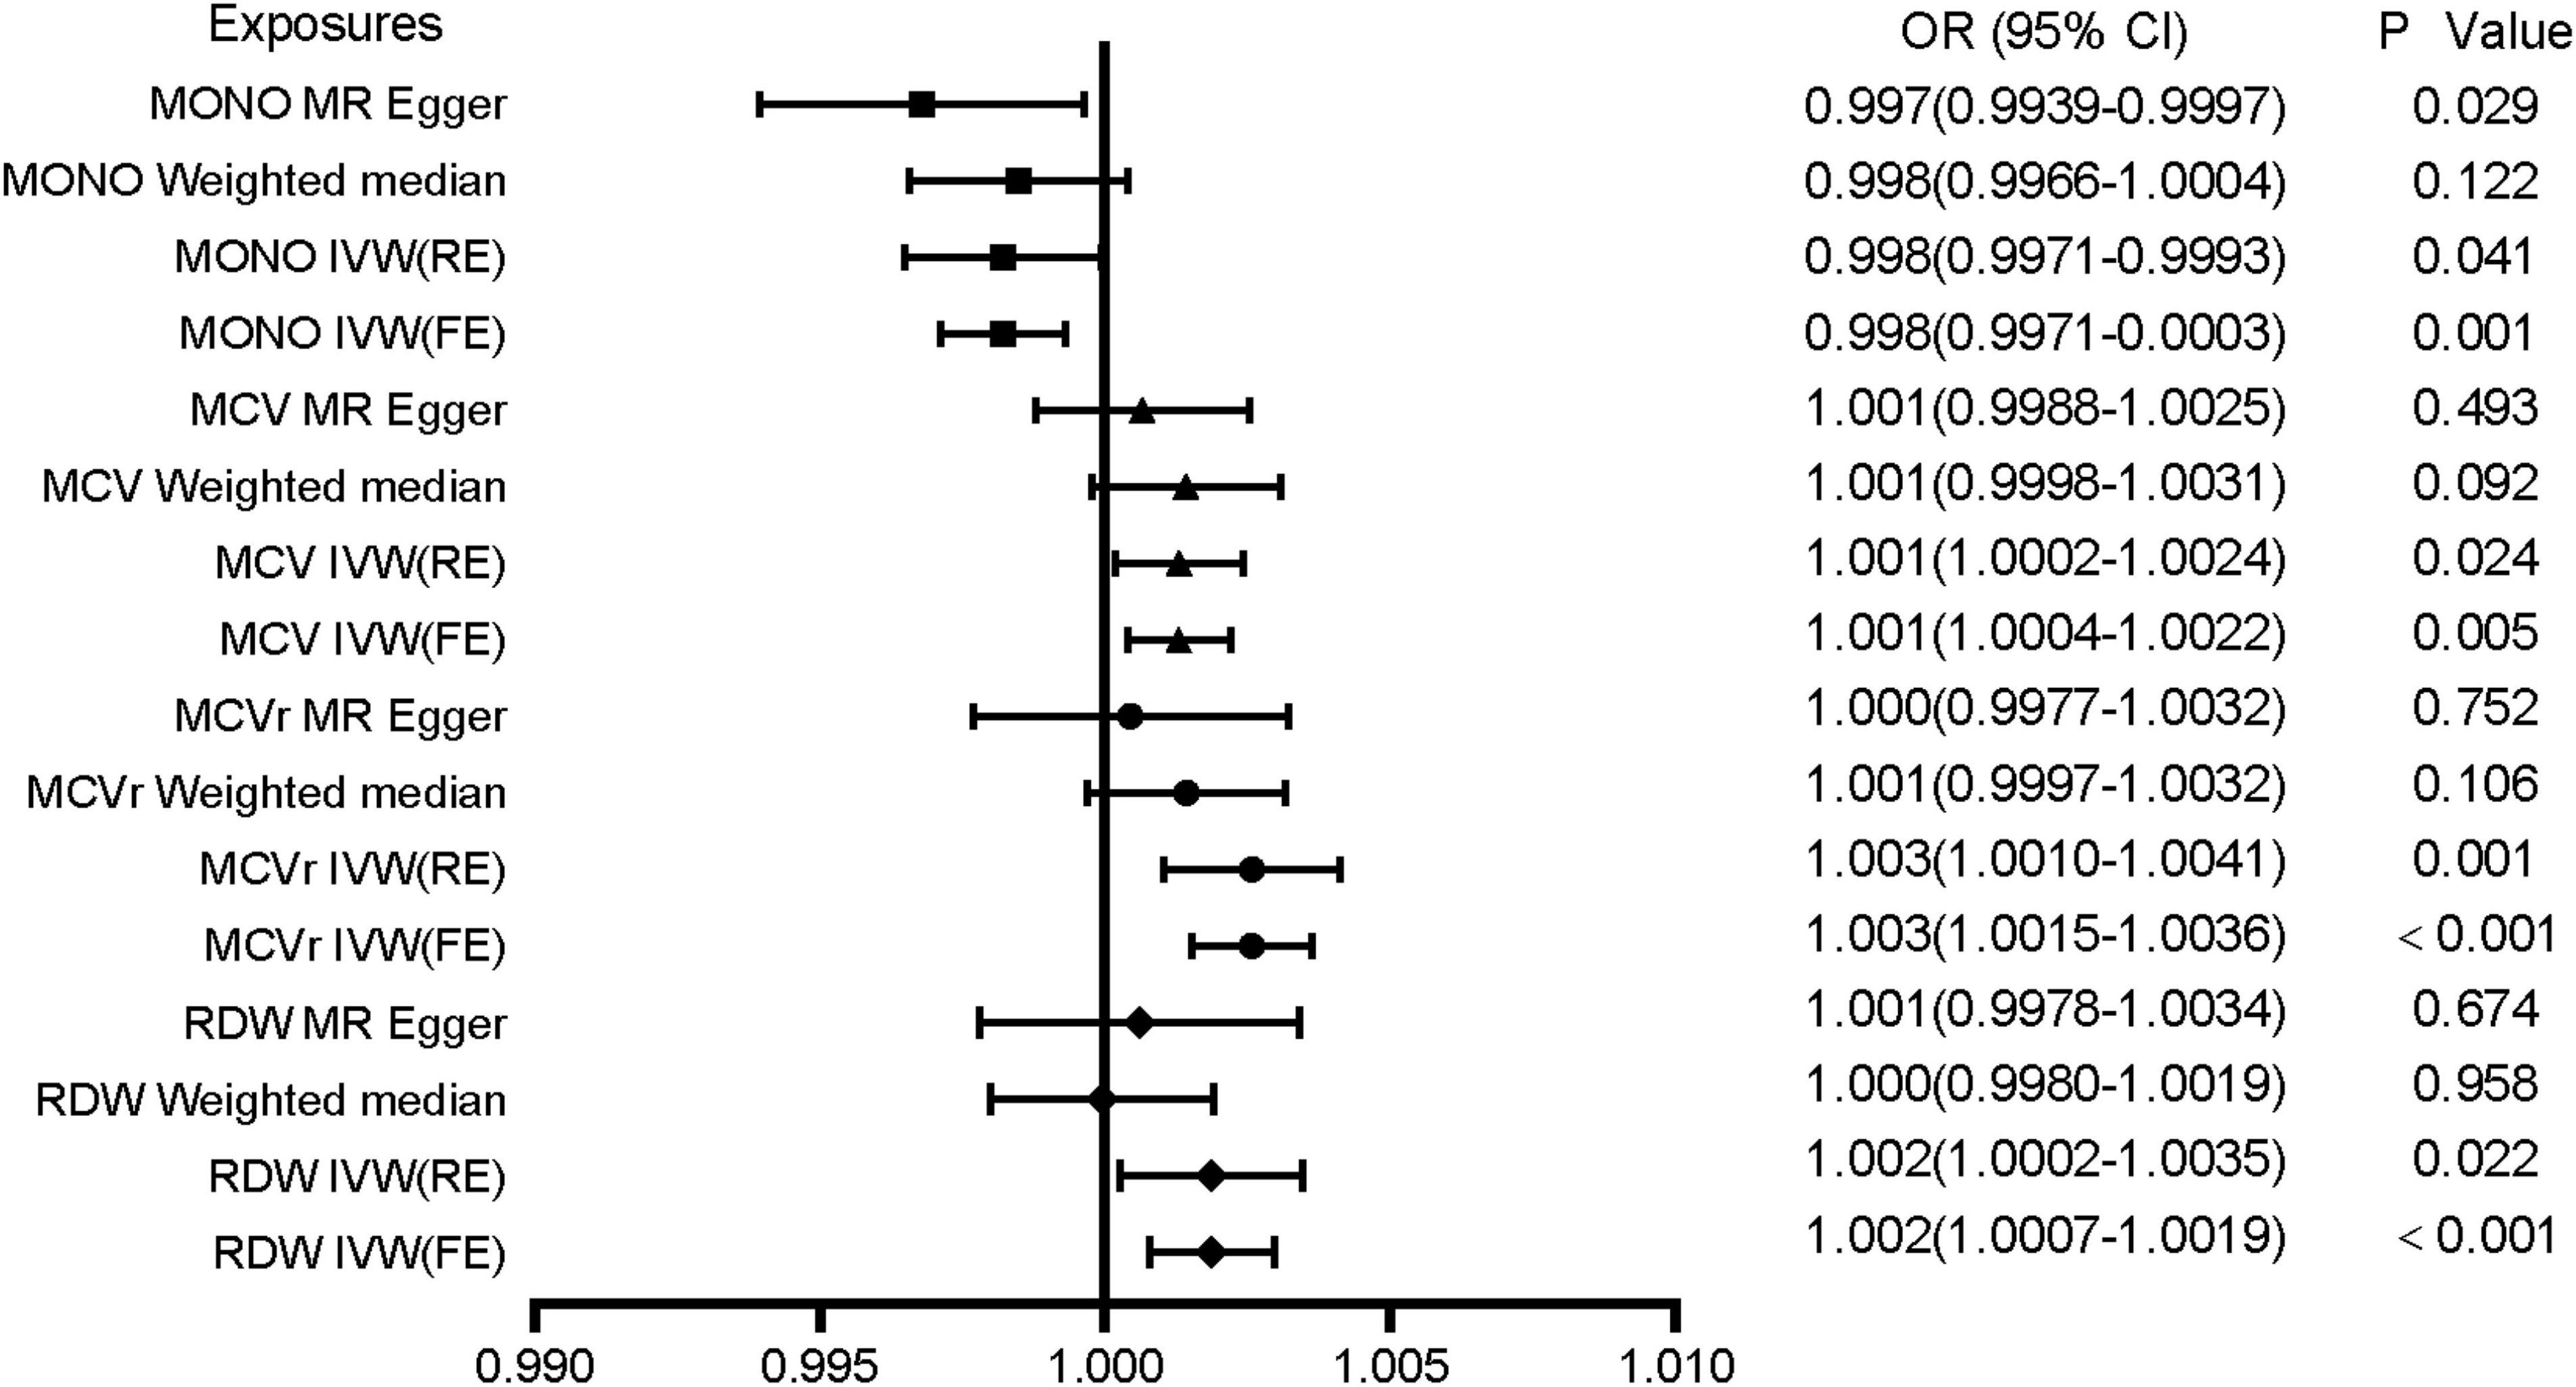
Figure 2. Associations of genetically predicted MONO, MCV, MCVr, and RDW with VTE. MONO, monocyte count; MCV, mean corpuscular volume; MCVr, mean corpuscular volume of reticulocyte; RDW, red blood cell distribution width; OR, odds ratio; CI, confidence interval.
Discussion
In this two-sample Mendelian randomization analysis, we investigated the association of blood cell indices with VTE risk. Our results show that genetically proxied red blood cell distribution width (RDW), mean corpuscular volume of reticulocyte (MCVr), and mean red blood cell volume (MCV) are positively correlated with VTE, and monocyte levels are negatively correlated with VTE. There was no evidence that other blood cell-level characteristics were causally related to VTE risk.
Previous cohort studies have shown that high RDW levels are a risk factor for VTE events, and RDW is a predictor of all-cause mortality in VTE patients (24, 25). High levels of RDW are associated with both premature release of immature red blood cells into the blood (25) and disease-related biological and metabolic imbalances (26, 27). Furthermore, RDW is negatively correlated with erythrocyte deformability, and high RDW levels may lead to cell aggregation and increased blood viscosity (4, 28), which in turn promotes thrombosis. We demonstrated a causal relationship between RDW and VTE by MR analysis based on GWAS, a relatively large population. Therefore, although the mechanism of the association between RDW and VTE remains unclear, it seems to be explained by the intermediate development of other diseases and the effect of RDW on hemodynamics, and future studies are necessary to explore the specific mechanism. The reason why the MR results of RDW are not robust may be related to the constant changes in red blood cell volume and traits. Hematocrit, hemoglobin concentration, and red blood cell count were not associated with an increased risk of VTE in a prospective cohort study (29). However, another prospective study involving 26,108 subjects with a median follow-up of 12.5 years found that hematocrit, hemoglobin concentration, red blood cell count, except MCV were risk factors for VTE in the general population (30). They believe that the effect of blood cells on VTE is mainly achieved by changing the blood viscosity by affecting the hematocrit, which were confirmed by other studies (31, 32). It is worth noting that a prospective cohort study of 108,521 subjects found no association between high hematocrit and VTE risk (33). Conflicting results may be biased by uncharacterized confounding factors in observational studies, as characteristics such as blood cell levels and size are influenced by numerous factors, including disease, external and internal environments. In addition, our MR analysis showed a causal relationship between VTE and erythrocyte volume-related cell indices such as MCVr and MCV. The possible reason for this result is that although red blood cells are an important component of blood clots, they are more likely to be captured by fibrin due to their larger volume in the flow of white blood clots, it is not the function of red blood cells that plays a major role in the thrombosis process. A retrospective study of 5408 subjects found a strong dose-response relationship (OR 2.8, 95% CI 1.3–5.8) between MONO and VTE (24), and it is now believed that monocytes was involved in thrombosis (34) and thrombolysis (35) through tissue factor expression, which is consistent with the results of our MR analysis, that the absolute level of monocytes was causally related to VTE, while the percentage of monocytes is not.
A prospective cohort study of 2,430 subjects found no association between WBC counts and VTE (OR 0.94, 95% CI 0.65–1.36) (36), whereas another prospective cohort study of 19,237 subjects with a median follow-up of 7.8 years concluded the opposite (37). Our MR analysis showed no evidence of a causal relationship between indices of other leukocyte lineages and VTE other than monocyte counts. However, some studies have also thought that neutrophils, lymphocytes, eosinophils and VTE are related (38–42), which studies focus on hospitalized patients and are subject to bias due to confounding factors such as immobilization, medication use, surgical intervention, and the disease itself. We speculate that the neutrophil-VTE connection is primarily through neutrophil extracellular traps rather than neutrophil counts, and that NETs are able to directly activate coagulation, bridging the immune and coagulation systems through immunothrombosis. For this reason, dipyridamole is clinically used to inhibit NETosis in order to prevent thrombosis. The most well-defined roles for monocytes in coagulation are to initiate coagulation through presentation of TF and to potentiate thrombo-inflammation through inflammasome activation, which is largely related to the number of monocytes. We believe that the function of neutrophils is closely related to VTE and the number of monocytes is related to VTE. For the above reasons, more research is necessary.
Platelets are the predominant cell type for thrombosis, and high platelet counts may be associated with susceptibility to thrombosis, but our MR showed that genetically proxied platelet counts are not associated with VTE, which is consistent with the results of a prospective cohort study of 108,521 subjects with a median follow-up of 8 years in Hagen (33) and a prospective study with a median follow-up of 12.5 years (29). High platelet count levels in healthy individuals are not a susceptibility factor for VTE, platelet count changes may be secondary to other high-risk factors for VTE, and genetically proxied platelet counts are not associated with VTE risk. For platelets, many studies have demonstrated that mean platelet volume (MPV), a measure of platelet activity, is associated with VTE (43–48), but our results were negative. The lifespan of platelets is about 1 week, so PLT, MPV, and PDW are prone to major changes due to platelet turnover. The variable shape and volume of platelets means that platelet parameters should not be used alone as indicators of platelet activation even in normal populations, maybe association of platelets with VTE may be caused by other confounding factors.
This study has several limitations. First, we assumed that the association of different exposures with VTE was linear in the MR analysis, but that Developmental adaptation could alter the effect of the genetic instruments on the outcome (49). Second, we were unable to stratify populations so that conclusions might be compromised if allele frequencies differ across populations. Third, the results are based on European ancestry, and future studies in mixed or other populations are warranted to extend our conclusions. The OR is not very significant, which suggests that genetically predicted cell indices are not the main factor affecting the occurrence of VTE, but our results provide a certain reference for further research. Finally, our method could not demonstrate confounding factors in the MR analysis of the relationship between various cellular components and VTE, nor could it demonstrate the interaction relationship between blood cell components and VTE.
It’s worth noting that our results are less susceptible to biases including confounding factors and reverse causality, which is particularly important in disease conditions square up the large variability in circulating metabolites and blood cells within the human microenvironment.
Conclusion
Our MR study demonstrated the causal effects of genetically proxied RDW, MCVr, MCV, and MONO on the risk of VTE. Blood cells affect the occurrence of VTE to a certain extent. Targeting these factors might be a potential strategy to prevent VTE, Future studies are needed to explore the exact mechanism and confirm the potential clinical value of such a prevention and treatment strategy.
Data Availability Statement
The original contributions presented in this study are included in the article/Supplementary Material, further inquiries can be directed to the corresponding author/s.
Author Contributions
JH had full access to all of the data in the study and took responsibility for the integrity of the data and accuracy of the data analysis, including and especially any adverse effects. QJ, YY, JL, YS, JY, RM, NZ, and CL contributed substantially to the study design, data analysis, and interpretation, and writing of the manuscript. All authors made substantial contributions to the conception and design, acquisition of data, and analysis and interpretation of data.
Conflict of Interest
The authors declare that the research was conducted in the absence of any commercial or financial relationships that could be construed as a potential conflict of interest.
Publisher’s Note
All claims expressed in this article are solely those of the authors and do not necessarily represent those of their affiliated organizations, or those of the publisher, the editors and the reviewers. Any product that may be evaluated in this article, or claim that may be made by its manufacturer, is not guaranteed or endorsed by the publisher.
Acknowledgments
We thank all participants and investigators for the contributions of UK Biobank, and other GWAS data.
Supplementary Material
The Supplementary Material for this article can be found online at: https://www.frontiersin.org/articles/10.3389/fcvm.2022.919640/full#supplementary-material
Supplementary Figures 1–23 | Funnel plot showing results of heterogeneity test.
Supplementary Figures 24–46 | Leave-one-out analysis of cell indices.
Supplementary Figures 47–69 | Associations of 23 exposures with venous thromboembolism (VTE) in Mendelian randomization analyses.
Supplementary Figures 70–92 | Scatter plot shows individual causal estimates from each genetic variant associated with each exposure on the x-axis and VTE on the y-axis.
Supplementary Table 1 | Single-nucleotide polymorphisms used for each exposure.
Supplementary Table 2 | Results of MR analysis.
Footnotes
References
1. Khan F, Tritschler T, Kahn SR, Rodger MA. Venous thromboembolism. Lancet. (2021) 398:64–77. doi: 10.1016/S0140-6736(20)32658-1
2. Anderson DR, Morgano GP, Bennett C, Dentali F, Francis CW, Garcia DA, et al. American society of hematology 2019 guidelines for management of venous thromboembolism: prevention of venous thromboembolism in surgical hospitalized patients. Blood Adv. (2019) 3:3898–944. doi: 10.1182/bloodadvances.2019000975
3. Crous-Bou M, Harrington LB, Kabrhel C. Environmental and genetic risk factors associated with venous thromboembolism. Semin Thromb Hemost. (2016) 42:808–20. doi: 10.1055/s-0036-1592333
4. Faes C, Ilich A, Sotiaux A, Sparkenbaugh EM, Henderson MW, Buczek L, et al. Red blood cells modulate structure and dynamics of venous clot formation in sickle cell disease. Blood. (2019) 133:2529–41. doi: 10.1182/blood.2019000424
5. Reitsma PH, Versteeg HH, Middeldorp S. Mechanistic view of risk factors for venous thromboembolism. Arterioscler Thromb Vasc Biol. (2012) 32:563–8. doi: 10.1161/ATVBAHA.111.242818
6. Hammons L, Filopei J, Steiger D, Bondarsky E. A narrative review of red blood cell distribution width as a marker for pulmonary embolism. J Thromb Thrombolysis. (2019) 48:638–47. doi: 10.1007/s11239-019-01906-w
7. Petito E, Falcinelli E, Paliani U, Cesari E, Vaudo G, Sebastiano M, et al. Association of neutrophil activation, more than platelet activation, with thrombotic complications in coronavirus disease 2019. J Infect Dis. (2021) 223:933–44. doi: 10.1093/infdis/jiaa756
8. Hisada Y, Mackman N. Cancer-associated pathways and biomarkers of venous thrombosis. Blood. (2017) 130:1499–506. doi: 10.1182/blood-2017-03-743211
9. Colling ME, Tourdot BE, Kanthi Y. Inflammation, infection and venous thromboembolism. Circ Res. (2021) 128:2017–36. doi: 10.1161/CIRCRESAHA.121.318225
10. Chernysh IN, Nagaswami C, Kosolapova S, Peshkova AD, Cuker A, Cines DB, et al. The distinctive structure and composition of arterial and venous thrombi and pulmonary emboli. Sci Rep. (2020) 10:5112. doi: 10.1038/s41598-020-59526-x
11. Alkarithi G, Duval C, Shi Y, Macrae FL, Ariëns RAS. Thrombus structural composition in cardiovascular disease. Arterioscler Thromb Vasc Biol. (2021) 41:2370–83. doi: 10.1161/ATVBAHA.120.315754
12. Smith GD, Lawlor DA, Harbord R, Timpson N, Day I, Ebrahim S. Clustered environments and randomized genes: a fundamental distinction between conventional and genetic epidemiology. PLoS Med. (2007) 4:e352. doi: 10.1371/journal.pmed.0040352
13. Davey Smith G, Hemani G. Mendelian randomization: genetic anchors for causal inference in epidemiological studies. Hum Mol Genet. (2014) 23:R89–98. doi: 10.1093/hmg/ddu328
14. Gupta V, Walia GK, Sachdeva MP. ‘Mendelian randomization’: an approach for exploring causal relations in epidemiology. Public Health. (2017) 145:113–9. doi: 10.1016/j.puhe.2016.12.033
15. Burgess S, Davies NM, Thompson SG. Bias due to participant overlap in two-sample Mendelian randomization. Genet Epidemiol. (2016) 40:597–608. doi: 10.1002/gepi.21998
16. Davies NM, Holmes MV, Davey Smith G. Reading Mendelian randomisation studies: a guide, glossary, and checklist for clinicians. BMJ. (2018) 362:k601. doi: 10.1136/bmj.k601
17. Bycroft C, Freeman C, Petkova D, Band G, Elliott LT, Sharp K, et al. The UK Biobank resource with deep phenotyping and genomic data. Nature. (2018) 562:203–9. doi: 10.1038/s41586-018-0579-z
18. Astle WJ, Elding H, Jiang T, Allen D, Ruklisa D, Mann AL, et al. The allelic landscape of human blood cell trait variation and links to common complex disease. Cell. (2016) 167:1415–29.e19. doi: 10.1016/j.cell.2016.10.042
19. Hemani G, Bowden J, Davey Smith G. Evaluating the potential role of pleiotropy in Mendelian randomization studies. Hum Mol Genet. (2018) 27:R195–208. doi: 10.1093/hmg/ddy163
20. Burgess S, Thompson SG. Erratum to: interpreting findings from Mendelian randomization using the MR-Egger method. Eur J Epidemiol. 2017 May;32(5):391-392. Erratum Eur J Epidemiol. (2017) 32:377–89. doi: 10.1007/s10654-017-0276-5
21. Higgins JP, Thompson SG, Deeks JJ, Altman DG. Measuring inconsistency in meta-analyses. BMJ. (2003) 327:557–60. doi: 10.1136/bmj.327.7414.557
22. Sterne JA, Sutton AJ, Ioannidis JP, Terrin N, Jones DR, Lau J, et al. Recommendations for examining and interpreting funnel plot asymmetry in meta-analyses of randomised controlled trials. BMJ. (2011) 343:d4002. doi: 10.1136/bmj.d4002
23. Verbanck M, Chen CY, Neale B, Do R. Publisher correction: detection of widespread horizontal pleiotropy in causal relationships inferred from Mendelian randomization between complex traits and diseases. Nat Genet. (2018) 50:1196. doi: 10.1038/s41588-018-0164-2
24. Rezende SM, Lijfering WM, Rosendaal FR, Cannegieter SC. Hematologic variables and venous thrombosis: red cell distribution width and blood monocyte count are associated with an increased risk. Haematologica. (2014) 99:194–200. doi: 10.3324/haematol.2013.083840
25. Zöller B, Melander O, Svensson P, Engström G. Red cell distribution width and risk for venous thromboembolism: a population-based cohort study. Thromb Res. (2014) 133:334–9. doi: 10.1016/j.thromres.2013.12.013
26. Salvagno GL, Sanchis-Gomar F, Picanza A, Lippi G. Red blood cell distribution width: a simple parameter with multiple clinical applications. Crit Rev Clin Lab Sci. (2015) 52:86–105. doi: 10.3109/10408363.2014.992064
27. Weiss G, Goodnough LT. Anemia of chronic disease. N Engl J Med. (2005) 352:1011–23. doi: 10.1056/NEJMra041809
28. Vayá A, Suescun M. Hemorheological parameters as independent predictors of venous thromboembolism. Clin Hemorheol Microcirc. (2013) 53:131–41. doi: 10.3233/CH-2012-1581
29. Tsai AW, Cushman M, Rosamond WD, Heckbert SR, Polak JF, Folsom AR. Cardiovascular risk factors and venous thromboembolism incidence: the longitudinal investigation of thromboembolism etiology. Arch Intern Med. (2002) 162:1182–9. doi: 10.1001/archinte.162.10.1182
30. Braekkan SK, Mathiesen EB, Njølstad I, Wilsgaard T, Hansen JB. Hematocrit and risk of venous thromboembolism in a general population. The Tromso study. Haematologica. (2010) 95:270–5. doi: 10.3324/haematol.2009.008417
31. Pearson TC, Wetherley-Mein G. Vascular occlusive episodes and venous haematocrit in primary proliferative polycythaemia. Lancet. (1978) 2:1219–22. doi: 10.1016/s0140-6736(78)92098-6
32. Walker RF, Zakai NA, MacLehose RF, Cowan LT, Adam TJ, Alonso A, et al.. Association of testosterone therapy with risk of venous thromboembolism among men with and without hypogonadism. JAMA Intern Med. (2020) 180:190–7. doi: 10.1001/jamainternmed.2019.5135
33. Warny M, Helby J, Birgens HS, Bojesen SE, Nordestgaard BG. Arterial and venous thrombosis by high platelet count and high hematocrit: 108 521 individuals from the Copenhagen general population study. J Thromb Haemost. (2019) 17:1898–911. doi: 10.1111/jth.14574
34. von Brühl ML, Stark K, Steinhart A, Chandraratne S, Konrad I, Lorenz M, et al. Monocytes, neutrophils, and platelets cooperate to initiate and propagate venous thrombosis in mice in vivo. J Exp Med. (2012) 209:819–35. doi: 10.1084/jem.20112322
35. Ali T, Humphries J, Burnand K, Sawyer B, Bursill C, Channon K, et al. Monocyte recruitment in venous thrombus resolution. J Vasc Surg. (2006) 43:601–8. doi: 10.1016/j.jvs.2005.10.073
36. Blix K, Jensvoll H, Brækkan SK, Hansen JB. White blood cell count measured prior to cancer development is associated with future risk of venous thromboembolism–the Tromsø study. PLoS One. (2013) 8:e73447. doi: 10.1371/journal.pone.0073447
37. Tsai AW, Cushman M, Rosamond WD, Heckbert SR, Tracy RP, Aleksic N, et al. Coagulation factors, inflammation markers, and venous thromboembolism: the longitudinal investigation of thromboembolism etiology (LITE). Am J Med. (2002) 113:636–42. doi: 10.1016/s0002-9343(02)01345-1
38. Bakirci EM, Topcu S, Kalkan K, Tanboga IH, Borekci A, Sevimli S, et al. The role of the nonspecific inflammatory markers in determining the anatomic extent of venous thromboembolism. Clin Appl Thromb Hemost. (2015) 21:181–5. doi: 10.1177/1076029613494469
39. Farah R, Nseir W, Kagansky D, Khamisy-Farah R. The role of neutrophil-lymphocyte ratio, and mean platelet volume in detecting patients with acute venous thromboembolism. J Clin Lab Anal. (2020) 34:e23010. doi: 10.1002/jcla.23010
40. Ming L, Jiang Z, Ma J, Wang Q, Wu F, Ping J. Platelet-to-lymphocyte ratio, neutrophil-to-lymphocyte ratio, and platelet indices in patients with acute deep vein thrombosis. Vasa. (2018) 47:143–7. doi: 10.1024/0301-1526/a000683
41. Xue J, Ma D, Jiang J, Liu Y. Diagnostic and prognostic value of immune/inflammation biomarkers for venous thromboembolism: is it reliable for clinical practice? J Inflamm Res. (2021) 14:5059–77. doi: 10.2147/JIR.S327014
42. Liu Y, Meng X, Feng J, Zhou X, Zhu H. Hypereosinophilia with Concurrent venous thromboembolism: clinical features, potential risk factors, and short-term outcomes in a Chinese Cohort. Sci Rep. (2020) 10:8359. doi: 10.1038/s41598-020-65128-4
43. Cay N, Ipek A, Gumus M, Birkan Z, Ozmen E. Platelet activity indices in patients with deep vein thrombosis. Clin Appl Thromb Hemost. (2012) 18:206–10. doi: 10.1177/1076029611419841
44. Icli A, Aksoy F, Turker Y, Uysal BA, Alpay MF, Dogan A, et al. Relationship between mean platelet volume and pulmonary embolism in patients with deep vein thrombosis. Heart Lung Circ. (2015) 24:1081–6. doi: 10.1016/j.hlc.2015.04.170
45. Cil H, Yavuz C, Islamoglu Y, Tekbas EÖ, Demirtas S, Atilgan ZA, et al. Platelet count and mean platelet volume in patients with in-hospital deep venous thrombosis. Clin Appl Thromb Hemost. (2012) 18:650–3. doi: 10.1177/1076029611435838
46. Sincer I, Gunes Y, Mansiroglu AK, Cosgun M, Aktas G. Association of mean platelet volume and red blood cell distribution width with coronary collateral development in stable coronary artery disease. Postepy Kardiol Interwencyjnej. (2018) 14:263–9. doi: 10.5114/aic.2018.78329
47. Artunc Ulkumen B, Pala HG, Calik E, Oruc Koltan S. Platelet distribution width (PDW): a putative marker for threatened preterm labour. Pak J Med Sci. (2014) 30:745–8. doi: 10.12669/pjms.304.4991
48. Edvardsen MS, Hansen ES, Hindberg K, Morelli VM, Ueland T, Aukrust P, et al. Combined effects of plasma von Willebrand factor and platelet measures on the risk of incident venous thromboembolism. Blood. (2021) 138:2269–77. doi: 10.1182/blood.2021011494
Keywords: Mendelian randomization analysis, venous thromboembolism, blood cells, mean red blood cell volume, red blood cell distribution width, mean reticulocyte volume, monocyte count
Citation: He J, Jiang Q, Yao Y, Shen Y, Li J, Yang J, Ma R, Zhang N and Liu C (2022) Blood Cells and Venous Thromboembolism Risk: A Two-Sample Mendelian Randomization Study. Front. Cardiovasc. Med. 9:919640. doi: 10.3389/fcvm.2022.919640
Received: 13 April 2022; Accepted: 21 June 2022;
Published: 08 July 2022.
Edited by:
Steven Philip Grover, University of North Carolina at Chapel Hill, United StatesReviewed by:
Héléne Toinét Cronjé, University of Copenhagen, DenmarkCornelie Nienaber-Rousseau, North-West University, South Africa
Copyright © 2022 He, Jiang, Yao, Shen, Li, Yang, Ma, Zhang and Liu. This is an open-access article distributed under the terms of the Creative Commons Attribution License (CC BY). The use, distribution or reproduction in other forums is permitted, provided the original author(s) and the copyright owner(s) are credited and that the original publication in this journal is cited, in accordance with accepted academic practice. No use, distribution or reproduction is permitted which does not comply with these terms.
*Correspondence: Chunli Liu, chunli@gird.cn