 Hyo Jeong Yong
 Gengqiang Xie1
 Ali Naji
 Yue J. Wang
- 1Department of Biomedical Sciences, College of Medicine, Florida State University, Tallahassee, FL, United States
- 2Department of Surgery, Hospital of the University of Pennsylvania, Philadelphia, PA, United States
NEUROGENIN3+ (NEUROG3+) cells are considered to be pancreatic endocrine progenitors. Our current knowledge on the molecular program of NEUROG3+ cells in humans is largely extrapolated from studies in mice. We hypothesized that single-cell RNA-seq enables in-depth exploration of the rare NEUROG3+ cells directly in humans. We aligned four large single-cell RNA-seq datasets from postnatal human pancreas. Our integrated analysis revealed 10 NEUROG3+ epithelial cells from a total of 11,174 pancreatic cells. Noticeably, human NEUROG3+ cells clustered with mature pancreatic cells and epsilon cells displayed the highest frequency of NEUROG3 positivity. We confirmed the co-expression of NEUROG3 with endocrine markers and the high percentage of NEUROG3+ cells among epsilon cells at the protein level based on immunostaining on pancreatic tissue sections. We further identified unique genetic signatures of the NEUROG3+ cells. Regulatory network inference revealed novel transcription factors including Prospero homeobox protein 1 (PROX1) may act jointly with NEUROG3. As NEUROG3 plays a central role in endocrine differentiation, knowledge gained from our study will accelerate the development of beta cell regeneration therapies to treat diabetes.
Introduction
Neurogenin 3 (Neurog3) encodes a basic helix-loop-helix transcription factor considered to be the master regulator of pancreatic endocrine differentiation. The crucial role of Neurog3 has been established in mice. Neurog3 deficient mice do not have any pancreatic endocrine cells, develop diabetes, and die shortly after birth (1). Conversely, overexpression of Neurog3 in the non-endocrine epithelium converts these cells to endocrine cell fates (1–4). In the developing pancreas, NEUROG3 expression is biphasic (5). It is first detected at embryonic day (E) 8.5 during the primary transition and the expression declines to near zero at E11.5. NEUROG3 expression becomes detectable again during the secondary transition and peaks at E15.5 (5). NEUROG3+ cells are considered multipotent endocrine progenitor cells: They never co-express mature hormone markers; instead, they have the potential to differentiate into different endocrine lineages in vivo and in vitro (6). In the adult mouse pancreas, under normal homeostasis, a small number of NEUROG3+ cells can be detected. Lineage tracing experiments indicate that these NEUROG3+ cells are residual islet progenitors (6). Upon pancreatic tissue injury, several studies suggest that NEUROG3 is upregulated and NEUROG3+ cells contribute to beta cell regeneration in adults (7–9). Recent studies indicate that lineage bias among the NEUROG3+ population exists and single NEUROG3+ cells are predetermined to differentiate into one specific endocrine cell type through epigenetic regulation (10, 11).
In humans, the significant role of NEUROG3 in pancreatic endocrine differentiation has been revealed in genetics studies, as patients carrying NEUROG3 mutations often develop neonatal diabetes (12–15). The importance of NEUROG3 has been further confirmed in vitro where it is absolutely required for the derivation of mature human beta cells from pluripotent stem cells (16). In fact, the NEUROG3+ stage is an essential stage in all the in vitro differentiation protocols (17–19). Contrary to mice where two waves of Neurog3 expression are observed, human NEUROG3 is expressed in a single wave during embryonic development (20, 21). The expression of NEUROG3 gradually reduces in abundance as the development progresses (20–22). It remains controversial as to whether NEUROG3 is expressed in the post-development human pancreas (20, 23–25), possibly reflecting the detection limit of immunolabeling approaches and the sensitivities as well as specificities of antibodies utilized in some of the studies (26).
Because of the central role of NEUROG3 in endocrine differentiation, understanding the regulatory network of NEUROG3, as well as the molecular characteristics of NEUROG3+ cells in humans, has large implications for diabetes treatment. For instance, the features of endogenous NEUROG3+ cells can serve as a benchmark against which the authenticity of NEUROG3+ cells derived in vitro can be compared. Knowledge gained from such comparison can help to further optimize the stepwise differentiation protocol to generate functional beta cells from pluripotent stem cells. Furthermore, the existence of NEUROG3+ cells in the postnatal pancreata would raise the possibility of in vivo modulating these cells for beta cell regenerative therapy.
The ultra-low abundance of NEURGO3+ cells in the postnatal human pancreas renders it challenging to capture, let alone to investigate these cells in detail. The development and maturation of single-cell RNA-seq technology largely overcomes the limitation in the resolution of bulk assays and significantly increases the sensitivity to profile rare cell types. In this study, we integrated four single-cell RNA-seq datasets of human pancreatic endocrine cells and retrieved NEUROG3+ cells post hoc in a label-free manner (27–31). This strategy guarantees the utmost purity and authenticity of NEUROG3+ cells. Here, we report the unambiguous identification of NEUROG3+ cells in postnatal human pancreata. We describe the transcriptomic programs of these NEUROG3+ cells. We present novel putative transcription factors that are likely to cooperate with NEUROG3. We also outline the similarities of these postnatal NEUROG3+ cells with NEUROG3+ cells in the fetal pancreas.
Our work, to our knowledge, is the first to delineate the transcriptomic landscape of the naturally occurring NEUROG3+ cells in humans. Our study unveils the regulatory principles of these cells and provides a resource for the research community to further explore in order to identify, isolate, and program NEUROG3+ cells in humans. The insight will help to promote the development of beta cell regenerative medicine for treating diabetes.
Materials and Methods
Single-Cell RNA-Seq Datasets
Raw FASTQ files of the single-cell RNA-seq studies were downloaded from publicly available data depositories as following: Enge (GSE81547), Segerstolpe (E-MTAB-5061), Wang_C1 (GSE83139 and GSE154126), and Wang_C1HT (https://hpap.pmacs.upenn.edu/). Raw reads were aligned to the GRCh38 genome assembly with STAR (version 020201) using default parameters (32). Aligned reads were visualized with the Integrative Genomics Viewer (IGV 2.8.0) (33).
Single-nucleus RNA-seq dataset was downloaded as a Seurat object from http://singlecell.charite.de/pancreas/.
Data Integration and the Identification of NEUROG3+ Cells
Single cells from different datasets were integrated with the SCTransform integration pipeline with Seurat V3.2.0 (34). A resolution of 0.4 was used for cell clustering based on the stability of the resulting clusters analyzed with clustree (35). Uniform Manifold Approximation and Projection (UMAP) (36) was used to reduce the data dimensions and visualize the cells.
The gene expression values stored in the “RNA” assay in the integrated Seurat object were used to visualize marker gene expression as well as to select NEUROG3+ cells. Cell type classification was performed based on the high expression of marker genes in different clusters. Specifically, Insulin (INS) for beta cells, Glucagon (GCG) for alpha cells, Somatostatin (SST) for delta cells, Ghrelin (GHRL) for epsilon cells, Pancreatic polypeptide (PPY) for pancreatic polypeptide cells, Keratin18 (KRT18) for ductal cells, Serine protease 1 (PRSS1) for acinar cells, Secreted protein acidic and cysteine rich (SPARC) for fibroblasts, Von willebrand factor (VWF) for endothelial cells, and Lysosomal protein transmembrane 5 for immune cells. One cluster with high expression of multiple endocrine markers was denoted as doublets.
Twelve NEUROG3+ cells were identified as cells with >0 normalized read counts aligned to the NEUROG3 transcript. Only the 10 epithelial NEUROG3+ cells were used for downstream studies.
Differential Expression and Pathway Analysis
Limma trend (37) was used for differential expression analysis of the NEUROG3+ cells compared with other pancreatic epithelial cells excluding cells from endothelial, fibroblast, or immune lineages. To control for the batch effects and the impact of cell type heterogeneity, differential expression was performed with the following design matrix: NormalizedCounts ~ Label + Tech + CellType, where NormalizedCounts is the matrix containing logCPM of gene expression data, Tech indicates the dataset origins and CellType points to different cell type identities. Differentially expressed genes were selected with a false discovery rate of less than 5%.
Transcriptional Network Analysis
Raw reads aligned to transcription factors were converted to log2TPM with 1 pseudocount. The top 50 transcription factors with the highest expression in the NEUROG3+ cells were selected. Hierarchical clustering was performed with Ward’s method and Pearson correlation of the average gene expressions as the distance measurement. Their interaction networks were annotated with STRING V11.0 (38) with default settings.
Comparisons of Postnatal NEUROG3+ Cells With NEUROG3+ Cells in the Human Fetal Pancreata
For comparison with endocrine progenitors from human fetal pancreata, single-cell qPCR results were extracted from Table S3 in Ramond et al. (39). To convert normalized read counts from single-cell RNA-seq data to the same scale as the qPCR data, log2CPM values with pseudocount of 2 were calculated for each gene in each of the 10 NEUROG3+ cells. In the combined dataset, hierarchical clustering was performed with Ward’s method and Pearson correlation of the average gene expressions as the distance matrix. The original cell labels from Ramond et al. were transferred.
Comparisons of Postnatal NEUROG3+ Cells With NEUROG3+ Cells Emerged During In Vitro Differentiation From Embryonic Stem Cells
For comparison with NEUROG3+ cells derived in vitro, the normalized count matrix containing NEUROG3+ cells collected from stage 6 day 1 differentiation stage was obtained from GSM3402517 (40). Data integration was performed with Seurat SCTransform integration pipeline similarly to that described under “Data integration and the identification of NEUROG3+ cells”.
Immunofluorescent Staining
Formalin-fixed, paraffin-embedded (FFPE) tissue sections as well as frozen tissue sections were obtained from the biobanks of the University of Pennsylvania and Network for Pancreatic Organ Donors with Diabetes (nPOD). Tissues from the following donors were used in the study: ICRH85 (18 day-old hispanic female), nPOD6407 (5 year-old Caucasian female), HPAP012 (18 year-old Caucasian female). The pancreatic tissue was harvested from deidentified cadaver donors and is not considered to be human subjects. The research is reviewed and exempted by the FSU IRB committee. FFPE sections were de-paraffinized with xylene and carried through sequential rehydration from 100% Ethanol to 70% Ethanol before being transferred to water. Heat-induced antigen retrieval was performed in a pressure cooker at 120°C for 20 min in the Tris-EDTA buffer (10mM Tris, 1mM EDTA, pH 9.0). Frozen sections were fixed with 4% PFA for 10 minutes at room temperature. The following primary antibodies were used: GHRL (Santa Cruz Biotechnology, sc-293422, clone 2F4, 1:500), NEUROG3 (R&D systems, AF3444, 1:300), Ki67 (Invitrogen, MA5-14520, clone SP6, 1: 250), Glucagon (Santa Cruz Biotechnology, sc-13091, 1:300), Somatostatin (Santa Cruz Biotechnology, sc-13099, 1:300), Insulin (Invitrogen, 701265, clone 19H4L12, 1:300). The following secondary antibodies were uses: Cy2-anti-mouse (Jackson ImmunoResearch, 715-225-150), Cy3-anti-rabbit (Jackson ImmunoResearch, 711-165-152), Cy5-anti-sheep (Jackson ImmunoResearch, 713-175-147). All secondary antibodies were applied at 1:300 dilution. Slide scanning images were taken with an Olympus microscope at 20x/0.75NA. Confocal images were captured with Leica SP7 at 63x/1.4NA.
Image Analysis
To quantify the percentage of NEUROG3+ cells, an automated image analysis pipeline was applied on slide scans similar as described before (41). Briefly, DNA was used to identify nuclei (primary objects). The primary objects were expanded 10 pixels to demarcate cell boundaries. The intensities of GHRL or INS+GCG+SST channels were scaled to the range between 0-1. The intensities of these hormone channels were then measured in each cell. Endocrine cells were identified based on standard deviation of the staining intensities above a minimum value of 0.05. Outlines from endocrine cells identified using this pipeline were projected back onto the original endocrine staining images for visual inspection to confirm the appropriate cell type calling threshold. The pipeline was implemented in CellProfiler (3.1.8) (42). The NEUROG3+ cells among different populations were manually counted by two different investigators. The counting results from these two investigators showed good agreement.
Results
The Identification of NEUROG3+ Cells From Four Single-Cell RNA-Seq Datasets of Postnatal Human Islet Cells
Expecting NEUROG3+ cells to be rare, we examined four large single-cell RNA-seq datasets, including two from our own research, designed to study postnatal human islet cells (27–31). Due to batch effects, single cells clustered by their sources rather than cell types, although donor mixing within each source appeared to be homogenous (Supplementary Figure S1A). Therefore, we harmonized the four datasets with the Seurat SCTransform pipeline (34). This strategy effectively controlled batch effects (Figure 1A). In the integrated data, cells clustered based on cell types, as illustrated by the expression patterns of marker genes (Figure 1B). We identified a total of ten cell clusters including all the major pancreatic cell types, together with one cluster of potential doublets displaying a mixture of endocrine markers (Figure 1A and Table S1). 11,174 cells passed quality control from the four datasets combined. Among them, 5,264 cells contained cell type labels from the original publications. Ninety-seven percent of our de novo cell-type annotation was in agreement with the original cell type labels, confirming the accuracy of our pipeline.
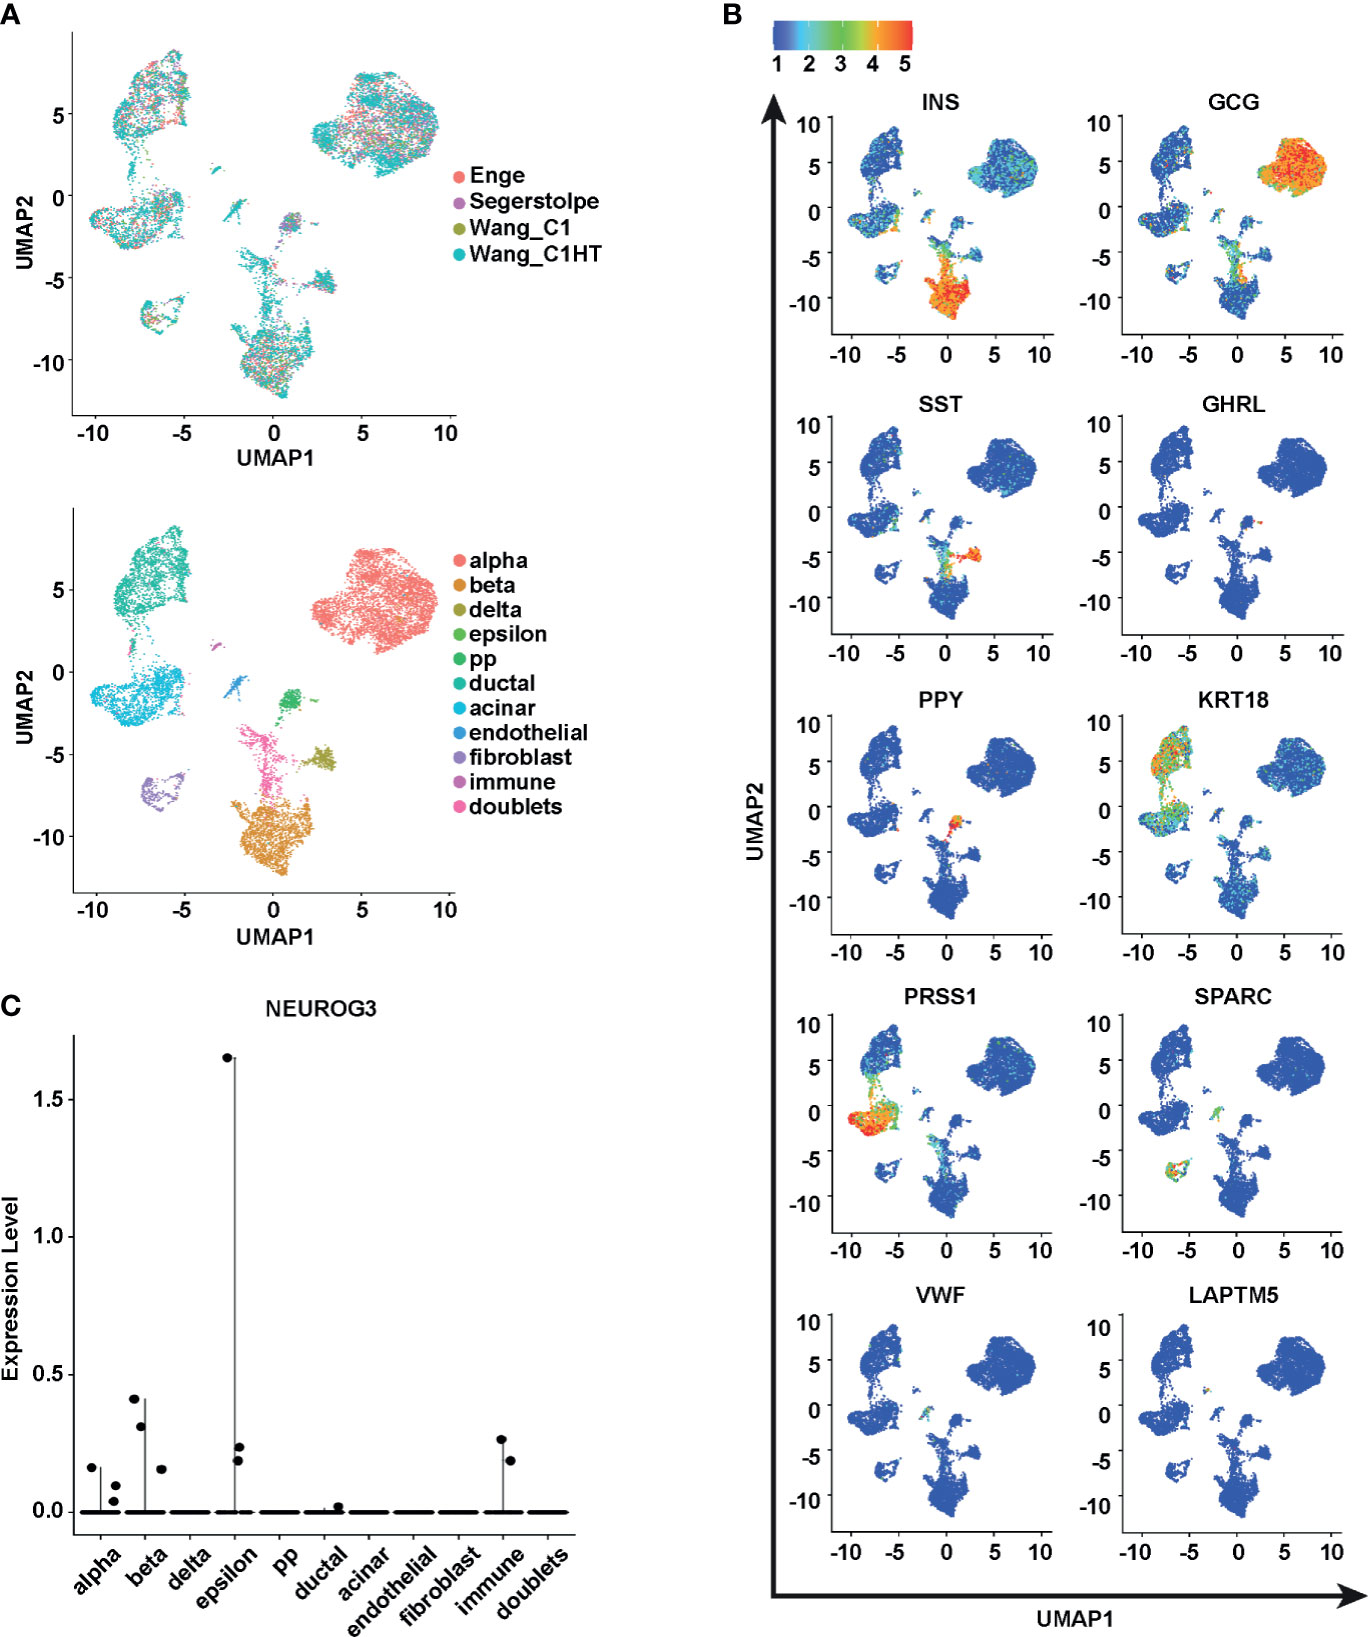
Figure 1 The identification of NEUROG3+ cells from 11,174 postnatal human pancreatic cells. (A) Uniform Manifold Approximation and Projections (UMAPs) are used to visualize the single-cell RNA-seq data post alignment. Top panel, cells are colored according to their study sources. Bottom panel, cells are colored according to cell types. (B) Relative expression of known pancreatic cell-type markers. The color scale is based on normalized expression values of transcripts in each UMAP panel. (C) Scatter plot exhibits the expression levels of NEUROG3 in different populations.
We examined the expression of NEUROG3 in the integrated data. We observed 12 cells with detectable NEUROG3 expression (Figure 1C and Table S2). To confirm the authenticity of these NEUROG3 transcripts, we directly visualized the aligned reads in the NEUROG3 genomic region. In all the 12 cells, we observed clear indications of fragments aligned to NEUROG3 exons (Supplementary Figure S2). This result confirmed that these 12 cells had bona fide transcription from NEUROG3.
Assuming no bias in single-cell RNA-seq sample selection, the overall detection rate of NEUROG3+ cells was less than 0.1%. The 12 NEUROG3+ cells originated from multiple donors with various conditions (six control donors, one donor with type 1 diabetes, and three donors with type 2 diabetes), and of different ages (18 days to 57 years old), confirming that NEUROG3+ cells exist in postnatal human pancreata regardless of health status and age (Table S2). The identification of these cells in donors with diabetes is significant since it points to the possibility of utilizing these cells for diabetes treatment in an autologous manner.
These 12 cells were assigned as different cell types (three as alpha cells, three as beta cells, three as epsilon cells, one as a ductal cell, and two as immune cells). None of the NEUROG3+ cells had delta, pancreatic polypeptide, or acinar cell labels, probably due to the relatively low cell number in the single-cell RNA-seq data corresponding to each of these populations. In contrast, three NEUROG3+ cells were annotated as the epsilon cell type where a total of 35 epsilon cells were detected, given a percentage of 8.6%. The disproportionally high percentage of NEUROG3+ cells clustered together with epsilon cells implies a close transcriptional relationship between these two cell types. The expression of NEUROG3 in immune cells is curious since this has never been reported. Nonetheless, RNA-seq data from human tissues from the GTEx Portal (dbGaP accession number phs000424.vN.pN.) and cell lines from the Human Protein Atlas (43) both corroborated the finding and indicated the presence of NEUROG3 in immune cells (Supplementary Figures S1B, C). Due to limited knowledge, we did not include the two NEUROG3+ cells labeled as immune cells in our further analyses.
The rare but non-zero recoveries of NEUROG3+ cells in postnatal pancreata confirms their existence in the mature human pancreas. Moreover, the identification of these cells showcases the superior resolution and power of single-cell RNA-seq technology.
Signatures of the NEUROG3+ Cells
We sought to identify genes differentially expressed in the NEUROG3+ cells. To mitigate the batch effects due to different data sources, cell origins as well as cell type labels were included as covariates in the linear model when we compared the gene expression profiles of the 10 NEUROG3+ cells with other pancreatic epithelial cells using limma (37). At a false discovery rate of 5%, we identified a total of 249 genes differentially expressed in the NEUROG3+ cells. Among these 249 genes, 247 were upregulated and 2 were downregulated in the NEUROG3+ cells compared with other cell types (Table S3).
As expected, after ranking these differentially expressed genes by fold change, the most highly enriched mRNA in the NEUROG3+ cells was NEUROG3 (Figure 2A). Following NEUROG3, top enriched transcripts in the NEUROG3+ cells included (Figure 2A): Prospero Homeobox 1 (PROX1); Peptidylprolyl Isomerase H (PPIH); Transmembrane And Coiled-Coil Domain Family 2 (TMCC2); Glycerate Kinase (GLYCTK); Ghrelin (GHRL); Alpha-2-Glycoprotein 1, Zinc-Binding (AZGP1); Transmembrane 4 L Six Family Member 5 (TM4SF5); ATPase Secretory Pathway Ca2+ Transporting 2 (ATP2C2); and Radial Spoke Head Component 9 (RSPH9).
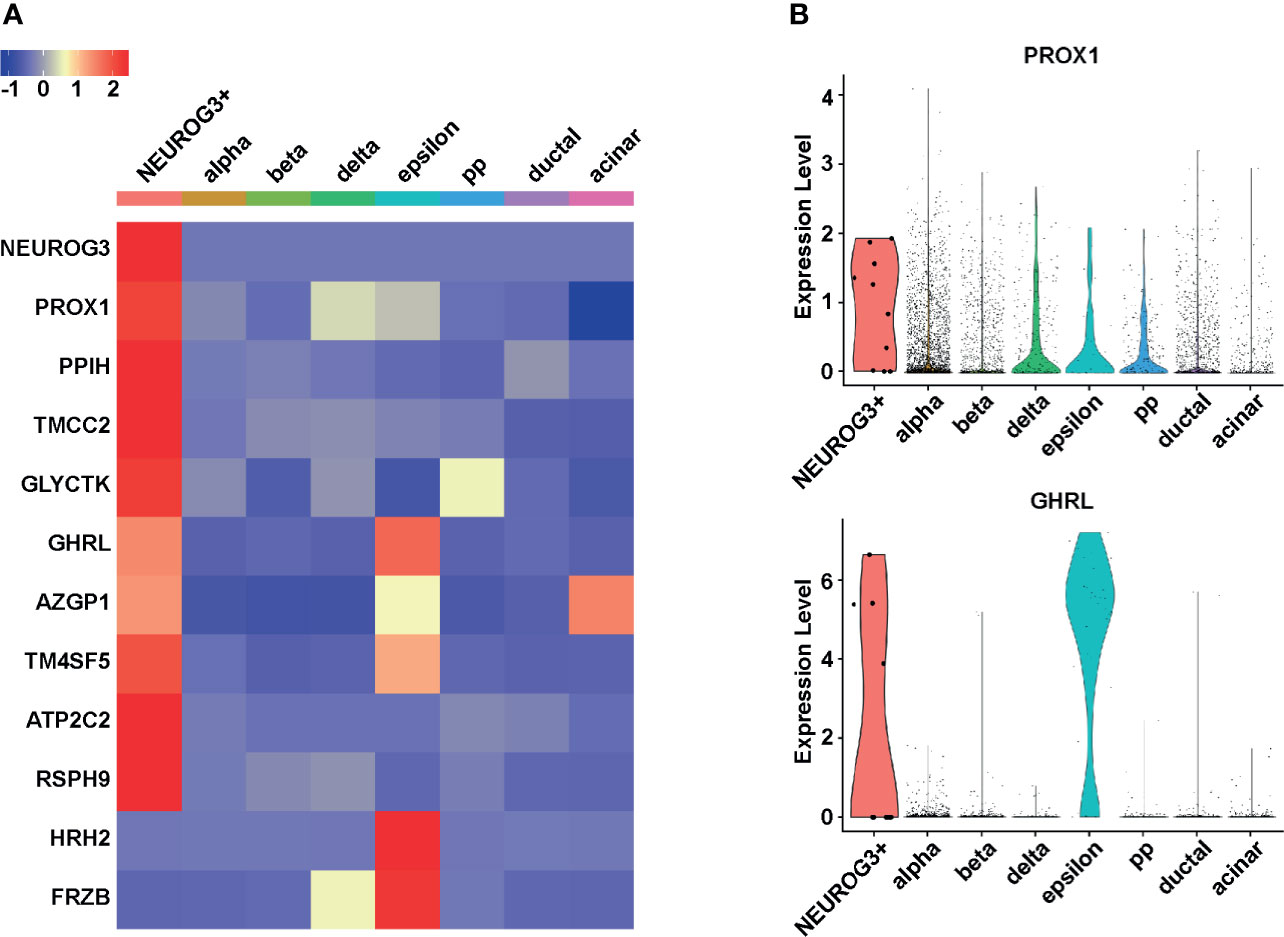
Figure 2 NEUROG3+ cells have unique gene expression signatures. (A) Heatmap demonstrates the average expression of the 10 most upregulated and two most downregulated transcripts in NEUROG3+ cells compared to other pancreatic epithelial cell types. The color scale is based on the normalized Z-score of each transcript. (B) Violin plots display the expression levels of PROX1 and GHRL in different cell populations. Each dot represents one cell.
Among the genes that were upregulated in the NEUROG3+ cells, PROX1 (Figure 2B, upper panel) and GHRL (Figure 2B, lower panel) have known functions in the pancreas. PROX1 encodes a homeobox protein; it is involved in pancreas organogenesis, endocrine fate specification, and beta cell maturation (44, 45). GHRL is considered an epsilon cell marker as it encodes a hormone that is uniquely secreted by endocrine epsilon cells.
Other upregulated genes are not well studied in the context of pancreatic endocrine development. PPIH is a component of the pre-mRNA processing complex and mediates pre-mRNA splicing (46). TMCC2 interacts with amyloid precursor protein and may play a role in neurodegeneration (47). GLYCTK is involved in serine and fructose metabolism (48). AZGP1 stimulates lipolysis and is involved in the maintenance of epithelial identity (49, 50). TM4SF5 is a member of the tetraspanin family and functions in cell cycle progression, cell migration, and epithelial-mesenchymal transition (51). ATP2C2 is involved in ATP-dependent calcium transport (52). RSPH9 is a component of the radial spokes within cilia, sperm, and flagella (53). Four out of the 10 most upregulated transcripts, including TMCC2, AZGP1, TM4SF5, and ATP2C2, encode putative transmembrane proteins. These proteins can be potentially exploited for cell surface labeling followed by flow cytometry-based enrichment of live NEUROG3+ cells.
The two transcripts that were significantly downregulated in the NEUROG3+ cells were Histamine Receptor H2 (HRH2) and Secreted Frizzled Related Protein (FRZB) (Figure 2A). HRH2 mediates histamine signaling and regulates cell proliferation (54). FRZB inhibits Wnt signaling (55). Several studies have shown that FRZB is downregulated in pancreatic cancer, suggesting that this protein may play a role in pancreatic cell fate maintenance (56).
The upregulation of GHRL in the NEUROG3+ cells was consistent with our observation that there was an enrichment of NEUROG3+ cells in the epsilon population. To confirm the results from single-cell RNA-seq, we co-stained GHRL and NEUROG3 proteins alongside other hormone makers in postnatal human pancreatic tissue sections (Figure 3A). The immunostaining pattern corroborated with single-cell RNA-seq findings: we noted instances of NEUROG3 antibody positive labeling in all tissue sections examined. Nuclear NEUROG3 staining could be located in multiple cell types including epsilon cells, non-epsilon endocrine cells, as well as pancreatic exocrine cells (Figure 3A). The percentage of NEUROG3+ cells varied among different donors, but were consistently higher in the epsilon population (0.67-3.42%) compared with the frequencies of NEUROG3+ cells in other endocrine (0.01%) and exocrine cells (0.05-0.22%) (Figure 3B and Table S4). To be noted, one of the pancreatic tissues was from an 18 year-old young adult. The identification of NEUROG3+ cells at the protein level in this donor provided further evidence of the existence of the NEUROG3+ cells in mature pancreata. To further examine the regenerative potential of the NEUROG3+ cells in vivo, we co-labelled the pancreatic tissue with NEUROG3 and the proliferation marker Ki67. The majority of NEUROG+ cells were post-mitotic (Figure 3C). However, in rare cases, we observed co-expression of NEUROG3 and Ki67 (Figure 3D). This result indicates that at least a fraction of human postnatal NEUROG3+ cells could proliferate.
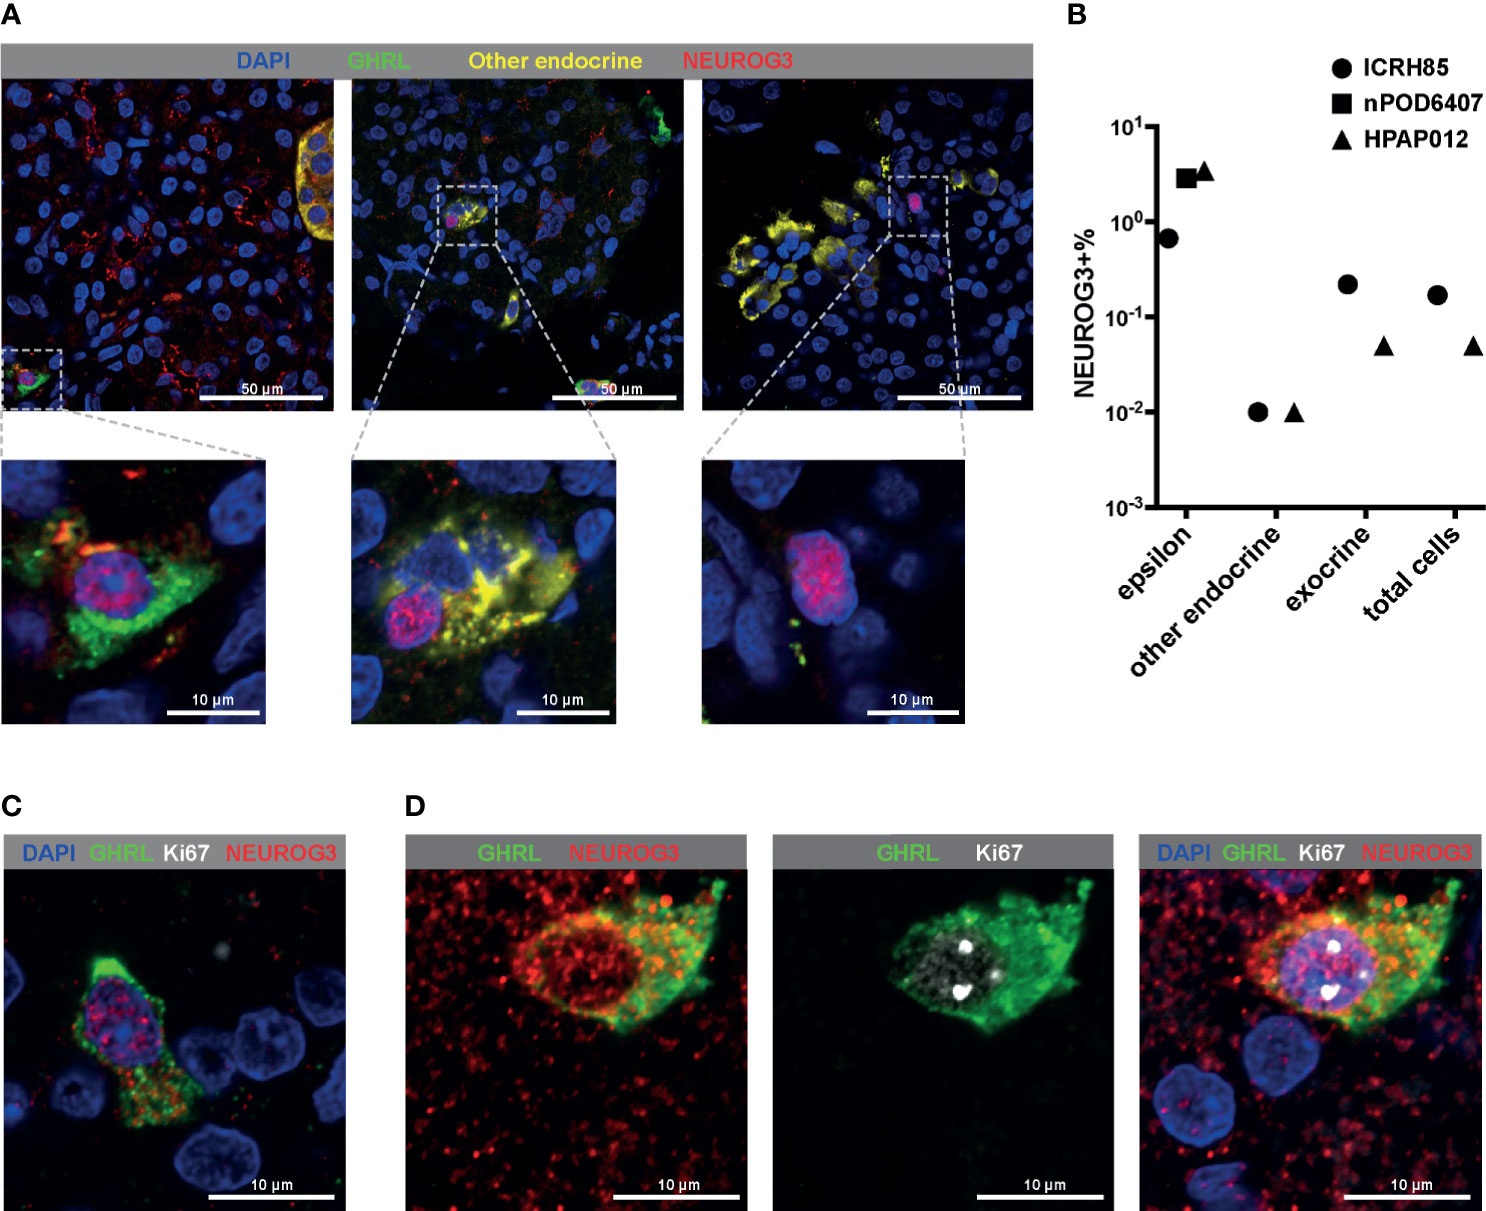
Figure 3 Immunofluorescent staining confirms the high frequency of NEUROG3 expression within epsilon cells. (A, C, D) All images shown are a single confocal Z-section. (A) Representative images showing the positive nuclear labeling of NEUROG3 in epsilon cells (left panel), other endocrine cells (middle panel) and exocrine cells (right panel) in postnatal human pancreatic tissue sections. Zoomed-in views of boxed regions are shown at the bottom of each panel. Color channels are: DAPI, blue; GHRL, green; INS+GCG+SST (a combination of three antibodies against individual proteins), yellow; NEUROG3, red. (B) Quantifications of NEUROG3+ cells in different populations. All cells from each section of the donor tissues were counted. Each data point represents aggregated results from one donor. “Other endocrine” corresponds to beta (INS+) or alpha (GCG+) or delta (SST+) cells. (C, D) Co-labeling of GHRL, NEUROG3 and Ki67. (C) The majority of NEUROG3+ cells are not proliferating. (D) in rare instances, coexpression of Ki67 and NEUROG3 can be observed. Color channels are: DAPI, blue; GHRL, green; Ki67, white; NEUROG3, red.
The Gene Regulatory Network of NEUROG3
To investigate the regulatory framework of NEUROG3, we next focused on transcription factors (TFs). We ranked all the TFs based on their average expressions in the NEUROG3+ cells and focused on the top 50 most highly expressed. We examined the levels of the 50 TFs in the NEUROG3+ cells relative to other pancreatic cell types. Hierarchical clustering based on Pearson correlation revealed that the 50 TFs fell into two major groups, with genes in Group 2 generally displaying higher expression in the NEUROG3+ cells compared to other cells (Figure 4A). We proceeded to perform network analysis with STRING using all the TFs in Group 2 (38). We found that the Group 2 TFs can be further separated into two clusters: one cluster of TFs highly connected to each other and to NEUROG3 (NEUROG3 hub) and the other cluster of TFs loosely connected to each other and to the NEUROG3 hub (Figure 4B).
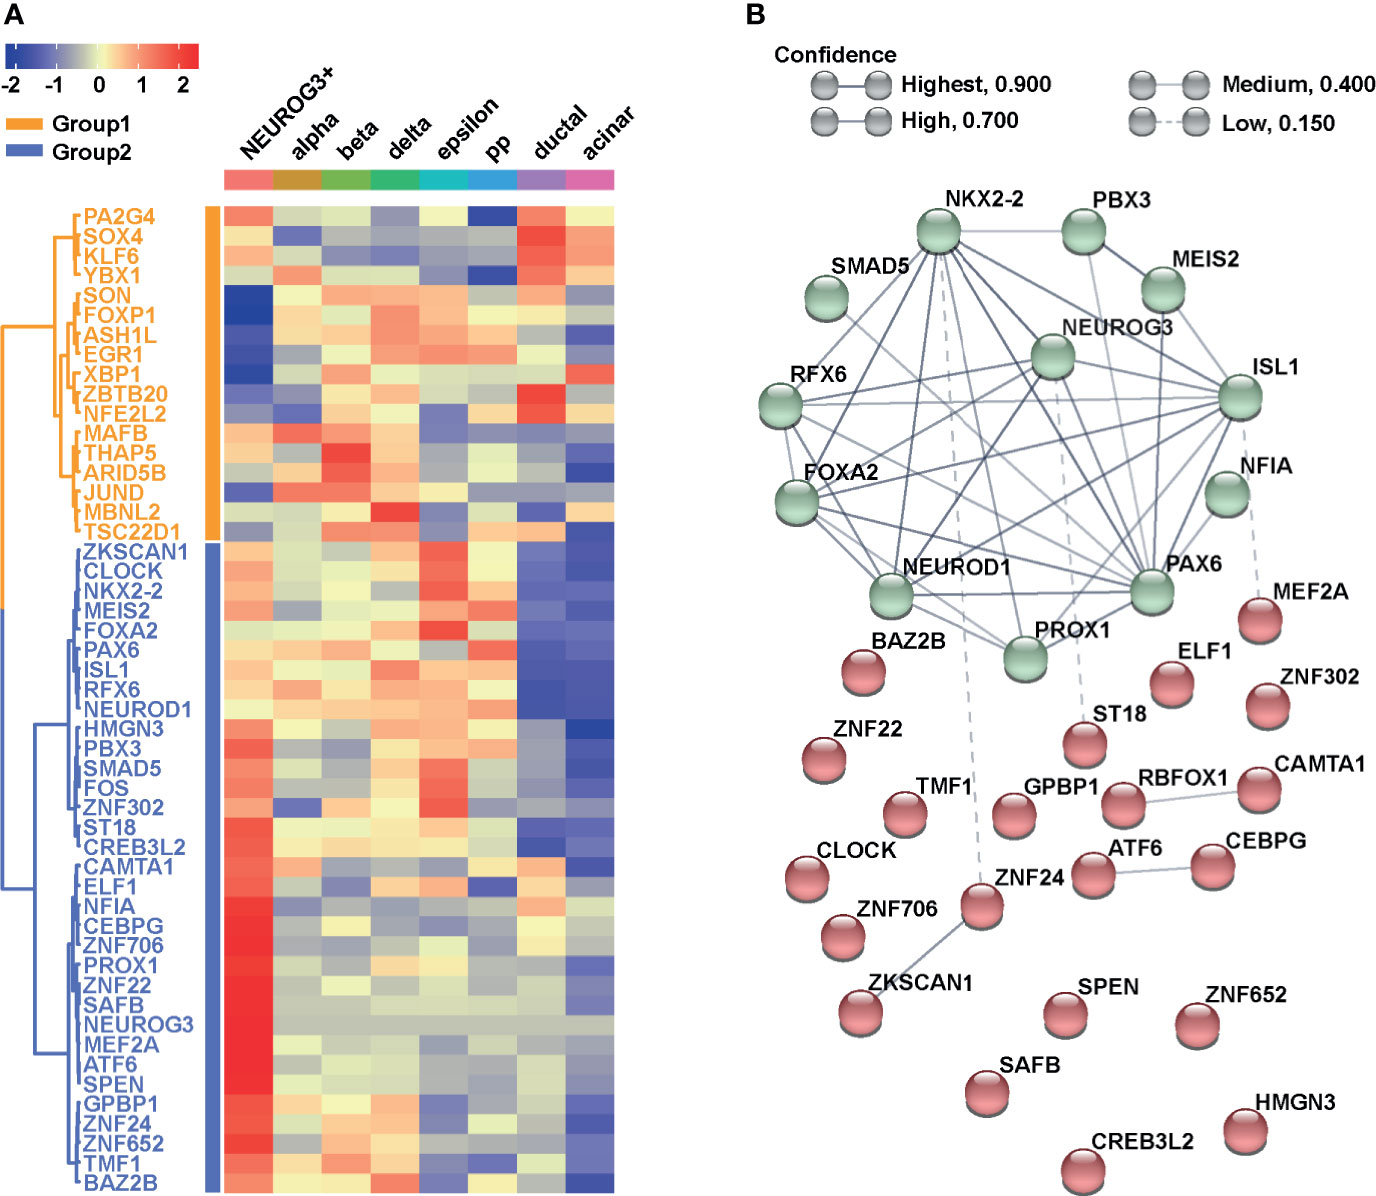
Figure 4 NEUROG3+ cells contain an organized transcriptional network. (A) Heatmap presents the average expressions of the top 50 transcription factors (TFs) expressed in NEUROG3+ cells compared with other cell types, along with hierarchical clustering. (B) STRING analysis displays connectivity of Group 2 TFs. Nodes are colored based on their k-mean cluster memberships. The thickness of connection lines is reflective of the strength of data supporting the interactions.
Within the NEUROG3 hub, some TFs have been reported in mice to function in endocrine fate specification (Figure 4B). Their functions are likely to be conserved here. For example, we recognized TFs that are considered to be the direct targets of NEUROG3. These include ISL LIM Homeobox 1 (ISL1) (1) Neuronal Differentiation 1 (NEUROD1) (57), NK2 Homeobox 2 (NKX2-2) (58), Paired Box 6 (PAX6) (59), and Regulatory Factor X6 (RFX6) (60). We also identified an upstream regulator of NEUROG3: Forkhead Box A2 (FOXA2) (61). It was reported that NEUROG3 and FOXA2 are co-expressed and functionally synergize during endocrine differentiation (61).
Within the NEUROG3 hub, other TFs were previously uncharacterized regarding their functional interactions with NEUROG3 (Figure 4B). These included Meis Homeobox 2 (MEIS2), PBX Homeobox 3 (PBX3), PROX1, Nuclear Factor IA (NFIA), and SMAD Family Member 5 (SMAD5). MEIS2 and PBX3 are homeobox proteins. They were shown to form a complex that targets PAX6 during pancreatic development and endocrine specification (62). Further, MEIS2 interacts with PBX1b (a paralog of PBX3) and PDX1 and activates pancreatic acinar cell programs (63). As described above, PROX1 plays a role in pancreatic development and endocrine differentiation. NFIA plays a role in stem cell maintenance and cellular differentiation (64). NFIA promotes pancreatic endocrine differentiation through Notch signaling regulation (65). Finally, SMAD5 is a component of the TGFβ signaling pathway. To begin to understand the pancreatic-specific molecular program involving these TFs, we accessed the Islet Regulome Browser to visualize the local genomic profiles surrounding each TF (66). Intriguingly, promoter and enhancer regions of all these five TFs are bound by essential factors involved in pancreatic organogenesis in the pancreatic progenitor cells (Supplementary Figure S3). This result indicates that these TFs may cooperate with NEUROG3 and play a role in the endocrine differentiation process in humans.
Comparison of Postnatal NEUROG3+ Cells With NEUROG3+ Cells in Human Fetal Pancreata
We examined whether NEUROG3+ cells in the postnatal human pancreas shared characteristics with NEUROG3+ cells during development. Available data are in the form of single-cell qPCRs consisting of 683 single cells isolated from human fetal pancreata at 9 weeks of development (39). We extracted the gene expression values of the 10 NEUROG3+ cells and combined them with the qPCR data from human fetal pancreatic cells. We applied hierarchical clustering based on the Pearson correlation distance between different cells with Ward’s linkage. This algorithm placed 9 out of the 10 NEUROG3+ cells together with the endocrine progenitor population in the human fetal dataset [Endocrine progenitors labeled as Population C in the original publication (39); Figure 5]. The resemblance in gene expression of NEUROG3+ cells from the postnatal human pancreas with NEUROG3+ cells during development suggests that these postnatal NEUROG3+ cells are likely resident endocrine progenitors.
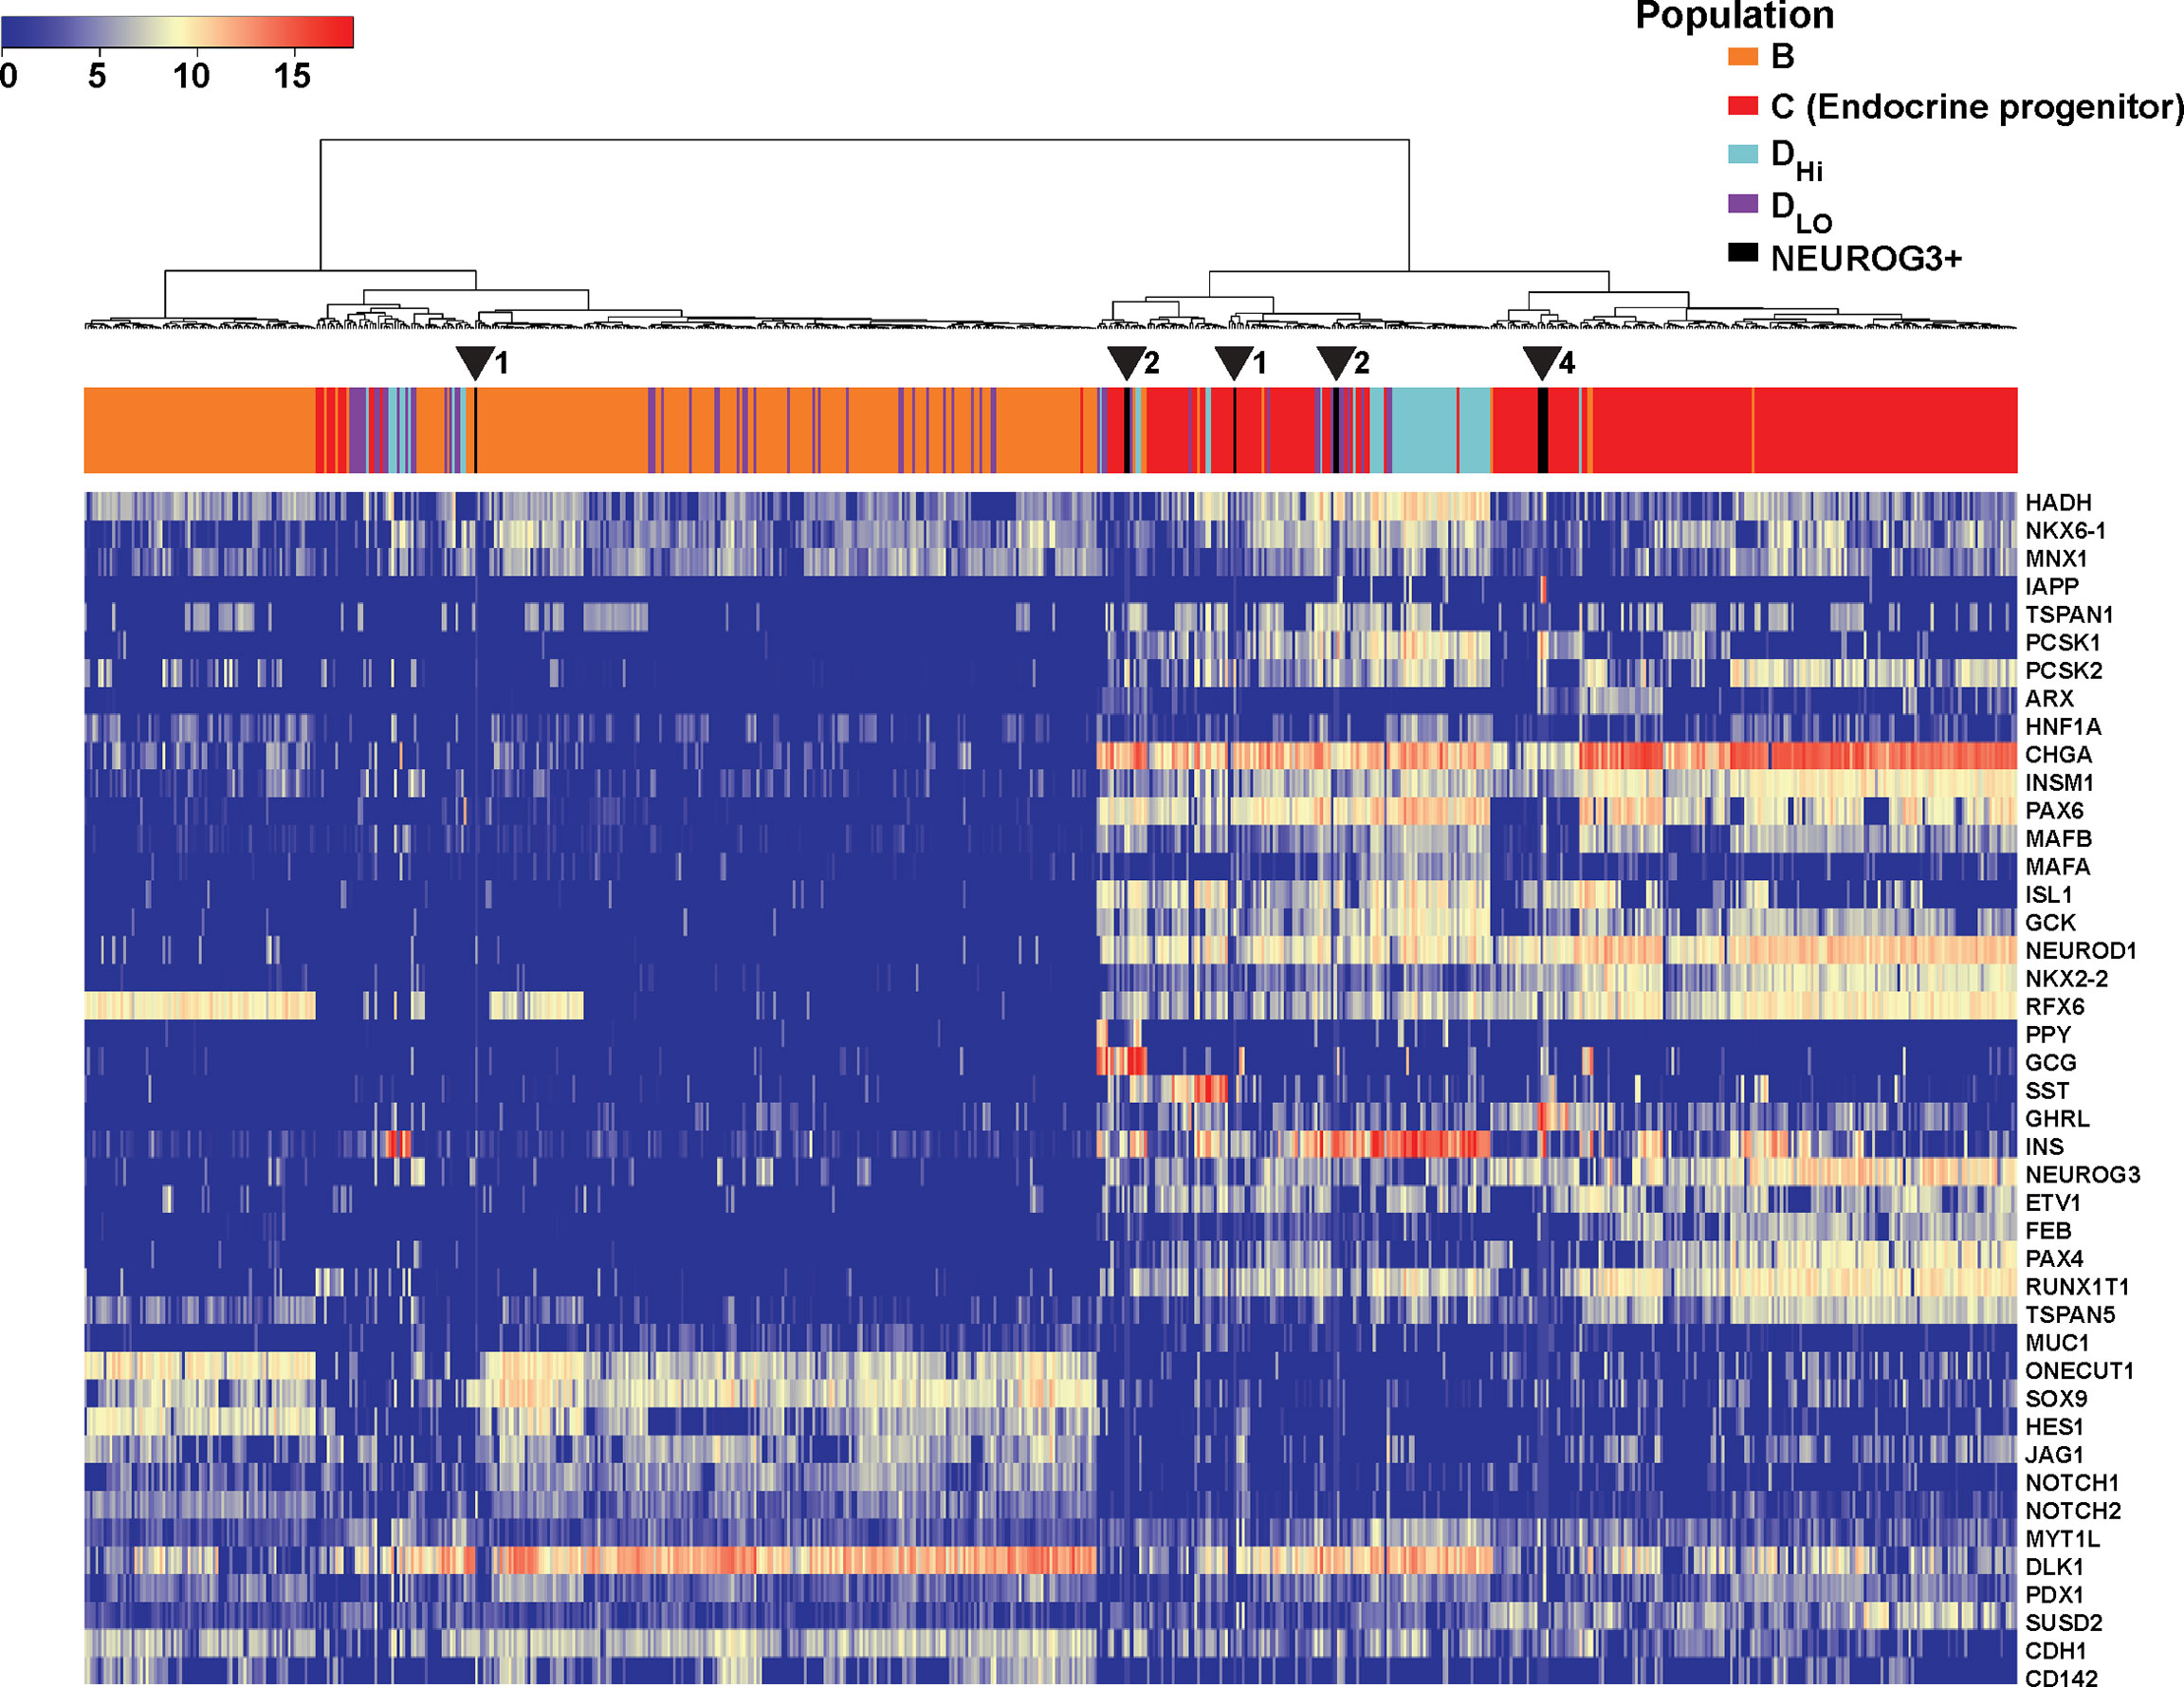
Figure 5 NEUROG3+ cells in the postnatal human pancreas cluster with NEUROG3+ cells from the fetal pancreas. Heatmap displays the relative gene expression of postnatal NEUROG3+ cells and single cells isolated from the human fetal pancreas, along with hierarchical clustering. Dendrograph displays color-coded populations: B (orange), C (red), DHi (light blue), Dlo (violet) and NEUROG3+ cells (black). Population labels are consistent with the original publication (39). Population C is the endocrine progenitor population (EP). Nine out of 10 NEUROG3+ cells cluster with EP. The location of NEUROG3+ cells are indicated by arrowheads, with the number of NEUROG3+ cells in each location denoted next to each arrowhead.
Comparison of Postnatal NEUROG3+ Cells With NEUROG3+ Cells Derived In Vitro
The 10 NEUROG3+ cells identified in our study did not form a unique cluster when visualized with UMAP. We reasoned that by increasing the NEUROG3+ cell numbers, clusters and even substructures of NEUROG3+ cells might emerge. Towards this goal, we explored seven additional single-cell RNA-seq datasets on human pancreatic cells with more than 36,000 aggregated single cells (67–73). Surprisingly, no more NEUROG3+ cells were identified from the seven datasets. To be noted, the four datasets containing NEUROG3+ cells in our study all utilized platforms/chemistries that have the highest sensitivities and lowest transcripts dropouts (Smart-seq2 method and Fluidigm C1 platforms) (30). This suggests that the lack of NEUROG3+ cells in the other studies may be due to the detection limit of single-cell RNA-seq chemistry.
Contrary to the limited data on NEUROG3+ cells from human pancreata, several large single-cell RNA-seq datasets containing NEUROG3+ cells derived in vitro were recently published. We selected one dataset where NEUROG3+ cells were isolated from early stage 6 of differentiation from human embryonic stem cells to beta cells (40). We aligned the in vitro dataset with our integrated single-cell RNA-seq dataset (Supplementary Figures S4A, B). The endocrine and ductal cells derived in vitro were mapped onto various mature endocrine or ductal cell regions, consistent with what was described by Krentz et al. (Supplementary Figure S4C; see also Figure 6A from Krentz et al.) (40). Under this alignment, the NEUROG3+ cells derived in vitro and the 10 NEUROG3+ cells we have identified diffused into multiple regions of the mature pancreatic cell types rather than cluster together (Supplementary Figure S4D). This observation suggests that there might be transcriptional differences between endogenous NEUROG3+ cells and NEUROG3+ derived in vitro. Nevertheless, we could conclude that, similar to the 10 naturally occurring NEUROG3+ cells we have analyzed, the NEUROG3+ derived in vitro were highly heterogeneous. We could further infer that different cell fates might have been established before or with the onset of NEUROG3 expression. Recent study indicated that cell fates were regulated via DNA methylation shifts parallel to the initiation of NEUROG3 expression (11).
Validation of Single-Cell RNA-Seq Results With an Independent Single-Nucleus RNA-Seq Dataset From Neonatal Human Pancreas
During the preparation of the manuscript, a human pancreas atlas containing single-nucleus RNA-seq data from neonatal human pancreas became available (74). Because of the differences of this atlas dataset compared to the single-cell RNA-seq datasets we explored with respect to starting materials (snap frozen pancreata versus isolated human islets), sample types (single-nucleus versus single-cell), and sequencing depth (median reads 775 reads/nucleus versus >300,000 reads/cell), we did not opt to integrate this atlas dataset into our analysis. Rather, we considered this dataset as an independent validation. In this atlas dataset, 55 NEUROG3+ cells were observed. Similar to the single-cell RNA-seq datasets, the NEUROG3+ cells from the atlas dataset were distributed among multiple pancreatic cell types (Supplementary Figure S5A and Table S5). The frequency of NEUROG3+ cells was again highest in the epsilon cell population (7%). Furthermore, among the top 50 most highly expressed transcription factors in both of the single-cell and single-nucleus datasets, 16 of them were shared between the two datasets (Supplementary Figure S5B). Due to the technical difference in mRNA populations captured from the single-nucleus RNA-seq data compared with single-cell RNA-seq data, a direct comparison of differentially expressed genes in the NEUROG3+ cells could not be performed. However, the significant overlap of transcription factor expressions as well as the enriched epsilon cell type in the NEUROG3+ population confirmed our single-cell analysis and indicated that human NEUROG3+ harbors a stable set of molecular signatures. Further, since the single-nucleus RNA-seq data were enriched with nascent transcripts, the shared transcriptional signatures between the NEUROG3+ nuclei and the NEUROG3+ cells indicate that the 10 NEUROG3+ cells we identified were likely to have active NEUROG3 transcription.
Discussion
Utilizing existing single-cell RNA-seq datasets, we performed the first systematic characterization of the transcriptomics of NEUROG3+ cells from humans. Our study confirmed the presence of NEUROG3+ in the postnatal human pancreas. We provided a unique set of markers that are enriched in these NEUROG3+ cells. We described a transcriptional network involving NEUROG3. This network contained known as well as previously uncharacterized regulators for endocrine differentiation. We validated the RNA-seq result and demonstrated the co-expression of NEUROG3 with mature hormone markers at the protein level. We further confirmed the high percentage of NEUROG3+ cells in the epsilon population. Comparisons of postnatal human NEUROG3+ cells with NEUROG3+ cells during development revealed conserved molecular programs. Despite the small number of NEUROG3+ cells detected and analyzed in our integrated single-cell RNA-seq dataset, our results were meaningful and could be reproduced with an independent single-nucleus RNA-seq dataset. We conclude that postnatal NEUROG3+ cells are likely resident endocrine progenitors that can be further functionally and bioinformatics explored to gain insights on diabetes therapies.
We characterized a transcriptional network in the human NEUROG3+ cells and identified known as well as novel candidates that functionally interact with NEUROG3. Several transcription factors, including FOXA2, ISL1, NEUROD1, NKX2-2, PAX6, and RFX6 are recognized as canonical targets of NEUROG3. In contrast, other transcription factors, including MEIS2, NFIA, PBX3, PROX1, and SMAD5, are not well characterized in the context of NEUROG3. Their high expression in the NEUROG3+ cells, their high connectivity with the NEUROG3 hub, and the co-occupancy of pancreatic master regulators in the enhancers of these genes indicate that these genes may play a role in the specification of pancreatic endocrine cell fate.
One unique feature of human NEUROG3+ cells is the predominant classification of NEUROG3+ cells as epsilon cells – an endocrine population generally considered to be terminally differentiated. This finding is supported by the co-expressing of NEUROG3 with epsilon cell marker GHRL at both the RNA and the protein level. The upregulation of GHRL in the postnatal NEUROG3+ cells coincides with a recent report showing the overlapping expression of GHRL and NEUROG3 in the human fetal pancreas (39). This result indicates that GHRL is a potential marker for NEUROG3+ endocrine progenitor cells. Our finding possibly posits epsilon cells earlier in the pancreatic endocrine differentiation cascade and implies a progenitor-like state of epsilon cells. This postulation is in line with a previous lineage tracing study demonstrating that at least a proportion of epsilon cells were multipotent and could give rise to other endocrine cell types (75). As an additional piece of evidence supporting the similarity of NEUROG3+ cells and epsilon cells, trajectory reconstruction of pancreatic endocrine differentiation with single-cell RNA-seq data of mouse embryonic pancreas placed epsilon cells interspersed with endocrine progenitors (76). In the process of quantifying the immunostaining of the pancreatic tissue sections for this paper, we occasionally noticed Ki67 positive signals in epsilon cell clusters. This observation strongly suggests that human epsilon cells can self-renew. Whether epsilon cells in humans display multipotent differentiation potential awaits further studies that creatively employ labeling and lineage tracing strategy.
Both the NEUROG3+ cells from postnatal human pancreata and the NEUROG3+ derived in vitro scattered into multiple regions of mature pancreatic cell types. These results suggest that human NEUROG3+ cells are heterogeneous and have been lineage primed to specific cell fates. In the mice, it is shown that NEUROG3+ cells consist of two populations with either low or high NEUROG3 expression. These two populations have distinct cell-cycle and differentiation properties, with NEUROG3-low cells more proliferative and multipotent, while NEUROG3-high cells less proliferative and unipotent (77–79). Due to the limited number of human NEUROG3+ cells identified, we could not categorize the NEUROG3 expression levels and further resolve the temporal orders of these NEUROG3+ cells to infer the differentiation trajectory. It is thus unclear whether the mouse equivalent NEUROG3 subpopulations exist in humans. From immunostaining, we did observe instances where NEUROG3+ cells were co-labelled with the proliferation marker Ki67, suggesting that at least a fraction of human postnatal NEUROG3+ cells could proliferate.
In summary, our study is the first systematic characterization of the gene expression landscape of NEUROG3+ cells from the postnatal human pancreas. This work provides a resource for the biomedical research community to further explore in order to gain more insights on NEUROG3+ cells in humans. Because diabetes is mostly diagnosed in adults, understanding the signatures of NEUROG3+ cells in the post-developmental human pancreas is important from the point of diabetes treatment. However, critical gaps still exist before we can establish the therapeutic values of the NEUROG3+ cells. For example, it is unclear whether the NEUROG3+ cells play a significant role in the pancreatic cell turnover during normal homeostasis and in pathological conditions. Neither do we know the differentiation cascade from NEUROG3+ cells to mature endocrine cells. With the advance of massively parallel deep profiling single-cell RNA-seq technology and continued improvement in algorithms for data harmonization, further studies can help to fine map the NEUROG3+ cells. Moreover, experimental perturbation is required to enhance and complement the in silico findings to delineate the regulatory process of NEUROG3.
Data Availability Statement
The datasets presented in this study can be found in online repositories. The names of the repository/repositories and accession number(s) can be found below:
https://www.ncbi.nlm.nih.gov/geo/, GSE81547, GSE83139, GSE154126
https://www.ebi.ac.uk/arrayexpress/, E-MTAB-5061
https://hpap.pmacs.upenn.edu, NA
https://ega-archive.org/studies/EGAS00001004653, EGAS00001004653.
Author Contributions
HY made substantial contributions to the design, analysis, and interpretation of data. GX, CL, WW, AN, and JI made substantial contributions to the acquisition of data. YW made substantial contributions to conception and design, acquisition of data, analysis, and interpretation of data. YW is the guarantor of this work and, as such, has full access to all the data in the study and takes responsibility for the integrity of the data and the accuracy of the data analysis. All authors contributed to the article and approved the submitted version.
Funding
Supports for this work are provided by the Integrated Islet Distribution – Islet Award Initiative (IIDP-IAI; (IIDP-IAI; https://iidp.coh.org/Investigators/Islet-Award-Initiative) and the Helmsley Charitable Trust George S. Eisenbarth nPOD Award for Team Science. This work is also supported by Florida State University start-up fund.
Conflict of Interest
The authors declare that the research was conducted in the absence of any commercial or financial relationships that could be construed as a potential conflict of interest.
Publisher’s Note
All claims expressed in this article are solely those of the authors and do not necessarily represent those of their affiliated organizations, or those of the publisher, the editors and the reviewers. Any product that may be evaluated in this article, or claim that may be made by its manufacturer, is not guaranteed or endorsed by the publisher.
Acknowledgments
We thank all organ donors and their families for their generosity that enabled this work. We thank the authors of previous single-cell RNA-seq studies for their data.
Supplementary Material
The Supplementary Material for this article can be found online at: https://www.frontiersin.org/articles/10.3389/fendo.2021.736286/full#supplementary-material
Supplementary Figure 1 | The identification and characterization of NEUROG3+ cells from single-cell RNA-seq datasets. (A) UMAPs are used to visualize the single-cell RNA-seq data prior to alignment. Left panel, cells are colored according to their study sources. Right panel, cells are colored according to donor origins. Different datasets display large batch effects; while within each dataset, cells from different donors appear to be well mixed. (B) Relative NEUROG3 expressions in different human tissues. There are high levels of NEUROG3 in EBV-transformed lymphocytes (highlighted). NEUROG3 expression was accessed through the GTEx Portal on 08/04/2020 and dbGaP accession number phs000424.vN.pN. (C) Relative NEUROG3 expressions in different human cell lines. There are high levels of NEUROG3 in THP-1 and HMC-1 cell lines, both of myeloid origin. NEUROG3 expression was accessed through Human Protein Atlas V 19.3 on 08/04/2020.
Supplementary Figure 2 | Genome browser view of the aligned reads in the 12 NEUROG3+ cells at the NEUROG3 genomic region. (A) In each of the 12 NEUROG3+ cells, there are fragments mapped to the exons of NEUROG3. (B) The boxed region in A is zoomed to single nucleotide resolution. Red dash line indicates the starting site of an adjacent transcript. The aligned fragments all have nucleotides mapped beyond the starting site of the adjacent transcript, confirming that these reads originate from NERUGO3 mRNA.
Supplementary Figure 3 | Islet regulome snapshots show transcription factor binding sites in the promoter/enhancer regions of 5 novel regulators including (A) MEIS2, (B) NFIA, (C) PBX3, (D) PROX1, and (E) SMAD5.
Supplementary Figure 4 | NEUROG3+ cells in the postnatal human pancreas do not cluster together with NEUROG3+ cells derived in vitro. (A) UMAP displays the effect of data alignment. Cells are colored according to their study sources. Krentz dataset contains NEUROG3+ cells derived from stage 6 day 1 of in vitro differentiation from human embryonic stem cells to beta cells. (B) UMAPs display relative marker gene expressions. Color scale is based on normalized expression values. (C) UMAP demonstrates the partial alignment of the Endo1, Endo2, Endo3, and Ductal cells from the Krentz data with mature beta, alpha, delta, and ductal cells correspondingly. (D) NEUROG3+ cells scatter into multiple regions of the UMAP rather than form a unique cluster. Left panel, the 10 NEUROG3+ cells in the current study are shown in red and the NEUROG3+ from the Krentz dataset are shown in yellow. Other cells are colored grey. EP, annotated NEUROG3+ endocrine progenitors. Right panel, the level of the NEUROG3 expression is shown.
Supplementary Figure 5 | Validation of the integrated single-cell RNA-seq dataset with a single-nucleus RNA-seq dataset. (A) Scatter plot exhibits the expression levels of NEUROG3 in different populations. (B) Venn diagram demonstrates the overlap of the top 50 most highly expressed transcription factors in the datasets. The significance of the overlap is calculated based on hypergeometric distribution.
References
1. Gradwohl G, Dierich A, LeMeur M, Guillemot F. Neurogenin3 is Required for the Development of the Four Endocrine Cell Lineages of the Pancreas. Proc Natl Acad Sci USA (2000) 97:1607–11. doi: 10.1073/pnas.0308647100
2. Apelqvist A, Li H, Sommer L, Beatus P, Anderson DJ, Honjo T, et al. Notch Signalling Controls Pancreatic Cell Differentiation. Nature (1999) 400:877–81. doi: 10.1038/23716
3. Schwitzgebel VM, Scheel DW, Conners JR, Kalamaras J, Lee JE, Anderson DJ, et al. Expression of Neurogenin3 Reveals an Islet Cell Precursor Population in the Pancreas. Development (2000) 127:3533–42. doi: 10.1242/dev.127.16.3533
4. Zhou Q, Brown J, Kanarek A, Rajagopal J, Melton DA. In Vivo Reprogramming of Adult Pancreatic Exocrine Cells to Beta-Cells. Nature (2008) 455:627–32. doi: 10.1038/nature07314
5. Villasenor A, Chong DC, Cleaver O. Biphasic Ngn3 Expression in the Developing Pancreas. Dev Dyn (2008) 237:3270–9. doi: 10.1002/dvdy.21740
6. Gu G, Dubauskaite J, Melton DA. Direct Evidence for the Pancreatic Lineage: NGN3+ Cells Are Islet Progenitors and Are Distinct From Duct Progenitors. Development (2002) 129:2447–57. doi: 10.1242/dev.129.10.2447
7. Xu X, D’Hoker J, Stangé G, Bonné S, De Leu N, Xiao X, et al. Beta Cells can be Generated From Endogenous Progenitors in Injured Adult Mouse Pancreas. Cell (2008) 132:197–207. doi: 10.1016/j.cell.2007.12.015
8. Pan FC, Bankaitis ED, Boyer D, Xu X, Van de Casteele M, Magnuson MA, et al. Spatiotemporal Patterns of Multipotentiality in Ptf1a-Expressing Cells During Pancreas Organogenesis and Injury-Induced Facultative Restoration. Development (2013) 140:751–64. doi: 10.1242/dev.090159
9. de Casteele MV, Van de Casteele M, Leuckx G, Baeyens L, Cai Y, Yuchi Y, et al. Neurogenin 3 Cells Contribute to β-Cell Neogenesis and Proliferation in Injured Adult Mouse Pancreas. Cell Death Dis (2013) 4:e523–3. doi: 10.1038/cddis.2013.52
10. Desgraz R, Herrera PL. Pancreatic Neurogenin 3-Expressing Cells Are Unipotent Islet Precursors. Development (2009) 136:3567–74. doi: 10.1242/dev.039214
11. Liu J, Banerjee A, Herring CA, Attalla J, Hu R, Xu Y, et al. Neurog3-Independent Methylation Is the Earliest Detectable Mark Distinguishing Pancreatic Progenitor Identity. Dev Cell (2019) 48:49–63.e7. doi: 10.1016/j.devcel.2018.11.048
12. Wang J, Cortina G, Wu SV, Tran R, Cho J-H, Tsai M-J, et al. Mutant Neurogenin-3 in Congenital Malabsorptive Diarrhea. N Engl J Med (2006) 355:270–80. doi: 10.1056/NEJMoa054288
13. Rubio-Cabezas O, Jensen JN, Hodgson MI, Codner E, Ellard S, Serup P, et al. Permanent Neonatal Diabetes and Enteric Anendocrinosis Associated With Biallelic Mutations in NEUROG3. Diabetes (2011) 60:1349–53. doi: 10.2337/db10-1008
14. Pinney SE, Oliver-Krasinski J, Ernst L, Hughes N, Patel P, Stoffers DA, et al. Neonatal Diabetes and Congenital Malabsorptive Diarrhea Attributable to a Novel Mutation in the Human Neurogenin-3 Gene Coding Sequence. J Clin Endocrinol Metab (2011) 96:1960–5. doi: 10.1210/jc.2011-0029
15. Hancili S, Bonnefond A, Philippe J, Vaillant E, De Graeve F, Sand O, et al. A Novel NEUROG3 Mutation in Neonatal Diabetes Associated With a Neuro-Intestinal Syndrome. Pediatr Diabetes (2018) 19:381–7. doi: 10.1111/pedi.12576
16. McGrath PS, Watson CL, Ingram C, Helmrath MA, Wells JM. The Basic Helix-Loop-Helix Transcription Factor NEUROG3 Is Required for Development of the Human Endocrine Pancreas. Diabetes (2015) 64:2497–505. doi: 10.2337/db14-1412
17. D’Amour KA, Bang AG, Eliazer S, Kelly OG, Agulnick AD, Smart NG, et al. Production of Pancreatic Hormone–Expressing Endocrine Cells From Human Embryonic Stem Cells. Nat Biotechnol (2006) 24:1392–401. doi: 10.1038/nbt1259
18. Rezania A, Bruin JE, Arora P, Rubin A, Batushansky I, Asadi A, et al. Reversal of Diabetes With Insulin-Producing Cells Derived In Vitro From Human Pluripotent Stem Cells. Nat Biotechnol (2014) 32:1121–33. doi: 10.1038/nbt.3033
19. Pagliuca FW, Millman JR, Gürtler M, Segel M, Van Dervort A, Ryu JH, et al. Generation of Functional Human Pancreatic β Cells In Vitro. Cell (2014) 159:428–39. doi: 10.1016/j.cell.2014.09.040
20. Sarkar SA, Kobberup S, Wong R, Lopez AD, Quayum N, Still T, et al. Global Gene Expression Profiling and Histochemical Analysis of the Developing Human Fetal Pancreas. Diabetologia (2008) 51:285–97. doi: 10.1007/s00125-007-0880-0
21. Lyttle BM, Li J, Krishnamurthy M, Fellows F, Wheeler MB, Goodyer CG, et al. Transcription Factor Expression in the Developing Human Fetal Endocrine Pancreas. Diabetologia (2008) 51:1169–80. doi: 10.1007/s00125-008-1006-z
22. Jennings RE, Berry AA, Kirkwood-Wilson R, Roberts NA, Hearn T, Salisbury RJ, et al. Development of the Human Pancreas From Foregut to Endocrine Commitment. Diabetes (2013) 62:3514–22. doi: 10.2337/db12-1479
23. Gomez DL, O’Driscoll M, Sheets TP, Hruban RH, Oberholzer J, McGarrigle JJ, et al. Neurogenin 3 Expressing Cells in the Human Exocrine Pancreas Have the Capacity for Endocrine Cell Fate. PloS One (2015) 10:e0133862. doi: 10.1371/journal.pone.0133862
24. Carpino G, Renzi A, Cardinale V, Franchitto A, Onori P, Overi D, et al. Progenitor Cell Niches in the Human Pancreatic Duct System and Associated Pancreatic Duct Glands: An Anatomical and Immunophenotyping Study. J Anat (2016) 228:474–86. doi: 10.1111/joa.12418
25. Qadir MMF, Álvarez-Cubela S, Klein D, Lanzoni G, García-Santana C, Montalvo A, et al. P2RY1/ALK3-Expressing Cells Within the Adult Human Exocrine Pancreas Are BMP-7 Expandable and Exhibit Progenitor-Like Characteristics. Cell Rep (2018) 22:2408–20. doi: 10.1016/j.celrep.2018.02.006
26. Honoré C, Rescan C, Hald J, McGrath PS, Petersen MBK, Hansson M, et al. Revisiting the Immunocytochemical Detection of Neurogenin 3 Expression in Mouse and Man. Diabetes Obes Metab (2016) 18:10–22. doi: 10.1111/dom.12718
27. Wang YJ, Schug J, Won K-J, Liu C, Naji A, Avrahami D, et al. Single-Cell Transcriptomics of the Human Endocrine Pancreas. Diabetes (2016) 65:3028–38. doi: 10.2337/db16-0405
28. Segerstolpe Å, Palasantza A, Eliasson P, Andersson E-M, Andréasson A-C, Sun X, et al. Single-Cell Transcriptome Profiling of Human Pancreatic Islets in Health and Type 2 Diabetes. Cell Metab (2016) 24:593–607. doi: 10.1016/j.cmet.2016.08.020
29. Enge M, Arda HE, Mignardi M, Beausang J, Bottino R, Kim SK, et al. Single-Cell Analysis of Human Pancreas Reveals Transcriptional Signatures of Aging and Somatic Mutation Patterns. Cell (2017) 171:321–30.e14. doi: 10.1016/j.cell.2017.09.004
30. Wang YJ, Schug J, Lin J, Wang Z, Kossenkov A, the HPAP Consortium. Comparative Analysis of Commercially Available Single-Cell RNA Sequencing Platforms for Their Performance in Complex Human Tissues. bioRxiv (2019).
31. Avrahami D, Wang YJ, Schug J, Feleke E, Gao L, Liu C, et al. Single-Cell Transcriptomics of Human Islet Ontogeny Defines the Molecular Basis of β-Cell Dedifferentiation in T2D. Mol Metab (2020) 42:101057. doi: 10.1016/j.molmet.2020.101057
32. Dobin A, Davis CA, Schlesinger F, Drenkow J, Zaleski C, Jha S, et al. STAR: Ultrafast Universal RNA-Seq Aligner. Bioinformatics (2013) 29:15–21. doi: 10.1093/bioinformatics/bts635
33. Robinson JT, Thorvaldsdóttir H, Winckler W, Guttman M, Lander ES, Getz G, et al. Integrative Genomics Viewer. Nat Biotechnol (2011) 29:24–6. doi: 10.1038/nbt.1754
34. Hafemeister C, Satija R. Normalization and Variance Stabilization of Single-Cell RNA-Seq Data Using Regularized Negative Binomial Regression. Genome Biol 20:296. doi: 10.1101/576827
35. Zappia L, Oshlack A. Clustering Trees: A Visualization for Evaluating Clusterings at Multiple Resolutions. Gigascience (2018) 7. doi: 10.1093/gigascience/giy083
36. McInnes L, Healy J, Melville J. UMAP: Uniform Manifold Approximation and Projection for Dimension Reduction. arXiv [statML] (2018).
37. Ritchie ME, Phipson B, Wu D, Hu Y, Law CW, Shi W, et al. Limma Powers Differential Expression Analyses for RNA-Sequencing and Microarray Studies. Nucleic Acids Res (2015) 43:e47. doi: 10.1093/nar/gkv007
38. Szklarczyk D, Gable AL, Lyon D, Junge A, Wyder S, Huerta-Cepas J, et al. STRING V11: Protein–Protein Association Networks With Increased Coverage, Supporting Functional Discovery in Genome-Wide Experimental Datasets. Nucleic Acids Res (2018) 47:D607–13. doi: 10.1093/nar/gky1131
39. Ramond C, Beydag-Tasöz BS, Azad A, van de Bunt M, Petersen MBK, Beer NL, et al. Understanding Human Fetal Pancreas Development Using Subpopulation Sorting, RNA Sequencing and Single-Cell Profiling. Development (2018) 145. doi: 10.1242/dev.165480
40. Krentz NAJ, Lee MYY, Xu EE, Sproul SLJ, Maslova A, Sasaki S, et al. Single-Cell Transcriptome Profiling of Mouse and hESC-Derived Pancreatic Progenitors. Stem Cell Rep (2018) 11:1551–64. doi: 10.1016/j.stemcr.2018.11.008
41. Wang YJ, Traum D, Schug J, Gao L, Liu C, Consortium HPAP, et al. Multiplexed In Situ Imaging Mass Cytometry Analysis of the Human Endocrine Pancreas and Immune System in Type 1 Diabetes. Cell Metab (2019) 29:769–783.e4. doi: 10.1016/j.cmet.2019.01.003
42. Carpenter AE, Jones TR, Lamprecht MR, Clarke C, Kang IH, Friman O, et al. CellProfiler: Image Analysis Software for Identifying and Quantifying Cell Phenotypes. Genome Biol (2006) 7:R100. doi: 10.1186/gb-2006-7-10-r100
43. Thul PJ, Åkesson L, Wiking M, Mahdessian D, Geladaki A, Ait Blal H, et al. A Subcellular Map of the Human Proteome. Science (2017) 356. doi: 10.1126/science.aal3321
44. Wang J, Kilic G, Aydin M, Burke Z, Oliver G, Sosa-Pineda B. Prox1 Activity Controls Pancreas Morphogenesis and Participates in the Production of “Secondary Transition” Pancreatic Endocrine Cells. Dev Biol (2005) 286:182–94. doi: 10.1016/j.ydbio.2005.07.021
45. Paul L, Walker EM, Drosos Y, Cyphert HA, Neale G, Stein R, et al. Lack of Prox1 Downregulation Disrupts the Expansion and Maturation of Postnatal Murine β-Cells. Diabetes (2016) 65:687–98. doi: 10.2337/db15-0713
46. Rajiv C, Davis TL. Structural and Functional Insights Into Human Nuclear Cyclophilins. Biomolecules (2018) 8. doi: 10.3390/biom8040161
47. Hopkins PCR, Sáinz-Fuertes R, Lovestone S. The Impact of a Novel Apolipoprotein E and Amyloid-β Protein Precursor-Interacting Protein on the Production of Amyloid-β. J Alzheimers Dis (2011) 26:239–53. doi: 10.3233/JAD-2011-102115
48. Van Schaftingen E. D-Glycerate Kinase Deficiency as a Cause of D-Glyceric Aciduria. FEBS Lett (1989) 243:127–31. doi: 10.1016/0014-5793(89)80113-9
49. Bing C, Bao Y, Jenkins J, Sanders P, Manieri M, Cinti S, et al. Zinc-α2-Glycoprotein, a Lipid Mobilizing Factor, is Expressed in Adipocytes and is Up-Regulated in Mice With Cancer Cachexia. Proc Natl Acad Sci USA (2004) 101:2500–5. doi: 10.1073/pnas.0308647100
50. Kong B, Michalski CW, Hong X, Valkovskaya N, Rieder S, Abiatari I, et al. AZGP1 As a Tumor Suppressor in Pancreatic Cancer Inducing Mesenchymal-to-Epithelial Transdifferentiation by Inhibiting TGF-β-Mediated ERK Signaling. Oncogene (2010) 29:5146–58. doi: 10.1038/onc.2010.258
51. Lee S-A, Lee S-Y, Cho I-H, Oh M-A, Kang E-S, Kim Y-B, et al. Tetraspanin TM4SF5 Mediates Loss of Contact Inhibition Through Epithelial-Mesenchymal Transition in Human Hepatocarcinoma. J Clin Invest (2008) 118:1354–66. doi: 10.1172/JCI33768
52. Vanoevelen J, Dode L, Van Baelen K, Fairclough RJ, Missiaen L, Raeymaekers L, et al. The Secretory Pathway Ca2/Mn2 -ATPase 2 Is a Golgi-Localized Pump With High Affinity for Ca2 Ions. J Biol Chem (2005) 280:22800–8. doi: 10.1074/jbc.m501026200
53. Castleman VH, Romio L, Chodhari R, Hirst RA, de Castro SCP, Parker KA, et al. Mutations in Radial Spoke Head Protein Genes RSPH9 and RSPH4A Cause Primary Ciliary Dyskinesia With Central-Microtubular-Pair Abnormalities. Am J Hum Genet (2009) 84:197–209. doi: 10.1016/j.ajhg.2009.01.011
54. Pagotto RM, Monzón C, Moreno MB, Pignataro OP, Mondillo C. Proliferative Effect of Histamine on MA-10 Leydig Tumor Cells Mediated Through HRH2 Activation, Transient Elevation in cAMP Production, and Increased Extracellular Signal-Regulated Kinase Phosphorylation Levels1. Biol Reprod (2012) 87:150. doi: 10.1095/biolreprod.112.102905
55. Leyns L, Bouwmeester T, Kim SH, Piccolo S, De Robertis EM. Frzb-1 is a Secreted Antagonist of Wnt Signaling Expressed in the Spemann Organizer. Cell (1997) 88:747–56. doi: 10.1016/S0092-8674(00)81921-2
56. Vincent A, Omura N, Hong S-M, Jaffe A, Eshleman J, Goggins M. Genome-Wide Analysis of Promoter Methylation Associated With Gene Expression Profile in Pancreatic Adenocarcinoma. Clin Cancer Res (2011) 17:4341–54. doi: 10.1158/1078-0432.CCR-10-3431
57. Huang H-P, Liu M, El-Hodiri HM, Chu K, Jamrich M, Tsai M-J. Regulation of the Pancreatic Islet-Specific GeneBETA2 (Neurod) by Neurogenin 3. Mol Cell Biol (2000) 20:3292–307. doi: 10.1128/MCB.20.9.3292-3307.2000
58. Watada H, Scheel DW, Leung J, German MS. Distinct Gene Expression Programs Function in Progenitor and Mature Islet Cells. J Biol Chem (2003) 278:17130–40. doi: 10.1074/jbc.M213196200
59. St-Onge L, Sosa-Pineda B, Chowdhury K, Mansouri A, Gruss P. Pax6 is Required for Differentiation of Glucagon-Producing Alpha-Cells in Mouse Pancreas. Nature (1997) 387:406–9. doi: 10.1038/387406a0
60. Soyer J, Flasse L, Raffelsberger W, Beucher A, Orvain C, Peers B, et al. Rfx6 is an Ngn3-Dependent Winged Helix Transcription Factor Required for Pancreatic Islet Cell Development. Development (2010) 137:203–12. doi: 10.1242/dev.041673
61. Ejarque M, Cervantes S, Pujadas G, Tutusaus A, Sanchez L, Gasa R. Neurogenin3 Cooperates With Foxa2 to Autoactivate its Own Expression. J Biol Chem (2013) 288:11705–17. doi: 10.1074/jbc.M112.388173
62. Zhang X, Rowan S, Yue Y, Heaney S, Pan Y, Brendolan A, et al. Pax6 is Regulated by Meis and Pbx Homeoproteins During Pancreatic Development. Dev Biol (2006) 300:748–57. doi: 10.1016/j.ydbio.2006.06.030
63. Swift GH, Liu Y, Rose SD, Bischof LJ, Steelman S, Buchberg AM, et al. An Endocrine-Exocrine Switch in the Activity of the Pancreatic Homeodomain Protein PDX1 Through Formation of a Trimeric Complex With PBX1b and MRG1 (Meis2). Mol Cell Biol (1998) 18:5109–20. doi: 10.1128/MCB.18.9.5109
64. Harris L, Genovesi LA, Gronostajski RM, Wainwright BJ, Piper M. Nuclear Factor One Transcription Factors: Divergent Functions in Developmental Versus Adult Stem Cell Populations. Dev Dyn (2015) 244:227–38. doi: 10.1002/dvdy.24182
65. Scavuzzo MA, Chmielowiec J, Yang D, Wamble K, Chaboub LS, Duraine L, et al. Pancreatic Cell Fate Determination Relies on Notch Ligand Trafficking by NFIA. Cell Rep (2018) 25:3811–3827.e7. doi: 10.1016/j.celrep.2018.11.078
66. Mularoni L, Ramos-Rodríguez M, Pasquali L. The Pancreatic Islet Regulome Browser. Front Genet (2017) 8:13. doi: 10.3389/fgene.2017.00013
67. Baron M, Veres A, Wolock SL, Faust AL, Gaujoux R, Vetere A, et al. A Single-Cell Transcriptomic Map of the Human and Mouse Pancreas Reveals Inter- and Intra-Cell Population Structure. Cell Syst (2016) 3:346–360.e4. doi: 10.1016/j.cels.2016.08.011
68. Grün D, Muraro MJ, Boisset J-C, Wiebrands K, Lyubimova A, Dharmadhikari G, et al. De Novo Prediction of Stem Cell Identity Using Single-Cell Transcriptome Data. Cell Stem Cell (2016) 19:266–77. doi: 10.1016/j.stem.2016.05.010
69. Li J, Klughammer J, Farlik M, Penz T, Spittler A, Barbieux C, et al. Single-Cell Transcriptomes Reveal Characteristic Features of Human Pancreatic Islet Cell Types. EMBO Rep (2016) 17:178–87. doi: 10.15252/embr.201540946
70. Muraro MJ, Dharmadhikari G, Grün D, Groen N, Dielen T, Jansen E, et al. A Single-Cell Transcriptome Atlas of the Human Pancreas. Cell Syst (2016) 3:385–394.e3. doi: 10.1016/j.cels.2016.09.002
71. Xin Y, Kim J, Okamoto H, Ni M, Wei Y, Adler C, et al. RNA Sequencing of Single Human Islet Cells Reveals Type 2 Diabetes Genes. Cell Metab (2016) 24:608–15. doi: 10.1016/j.cmet.2016.08.018
72. Lawlor N, George J, Bolisetty M, Kursawe R. Single-Cell Transcriptomes Identify Human Islet Cell Signatures and Reveal Cell-Type–Specific Expression Changes in Type 2 Diabetes. Genome (2017) 27:208–22. doi: 10.1101/gr.212720.116
73. Xin Y, Dominguez Gutierrez G, Okamoto H, Kim J, Lee A-H, Adler C, et al. Pseudotime Ordering of Single Human β-Cells Reveals States of Insulin Production and Unfolded Protein Response. Diabetes (2018) 67:1783–94. doi: 10.2337/db18-0365
74. Tosti L, Hang Y, Debnath O, Tiesmeyer S, Trefzer T, Steiger K, et al. Single-Nucleus and In Situ RNA–Sequencing Reveal Cell Topographies in the Human Pancreas. Gastroenterology (2021) 160:1330–44.e11. doi: 10.1053/j.gastro.2020.11.010
75. Arnes L, Hill JT, Gross S, Magnuson MA, Sussel L. Ghrelin Expression in the Mouse Pancreas Defines a Unique Multipotent Progenitor Population. PloS One (2012) 7:e52026. doi: 10.1371/journal.pone.0052026
76. Byrnes LE, Wong DM, Subramaniam M, Meyer NP, Gilchrist CL, Knox SM, et al. Lineage Dynamics of Murine Pancreatic Development at Single-Cell Resolution. Nat Commun (2018) 9:3922. doi: 10.1038/s41467-018-06176-3
77. Bechard ME, Bankaitis ED, Hipkens SB, Ustione A, Piston DW, Yang Y-P, et al. Precommitment Low-Level Neurog3 Expression Defines a Long-Lived Mitotic Endocrine-Biased Progenitor Pool That Drives Production of Endocrine-Committed Cells. Genes Dev (2016) 30:1852–65. doi: 10.1101/gad.284729.116
78. Yu X-X, Qiu W-L, Yang L, Li L-C, Zhang Y-W, Xu C-R. Dynamics of Chromatin Marks and the Role of JMJD3 During Pancreatic Endocrine Cell Fate Commitment. Development (2018) 145. doi: 10.1242/dev.163162
Keywords: NEUROG3, endocrine progenitor, epsilon cells, human pancreas, single-cell RNA-seq, data integration
Citation: Yong HJ, Xie G, Liu C, Wang W, Naji A, Irianto J and Wang YJ (2021) Gene Signatures of NEUROGENIN3+ Endocrine Progenitor Cells in the Human Pancreas. Front. Endocrinol. 12:736286. doi: 10.3389/fendo.2021.736286
Received: 05 July 2021; Accepted: 23 August 2021;
Published: 08 September 2021.
Edited by:
Antonio Brunetti, University of Catanzaro, ItalyReviewed by:
Essam M Abdelalim, Qatar Biomedical Research Institute, QatarSumeet Pal Singh, Université libre de Bruxelles, Belgium
Copyright © 2021 Yong, Xie, Liu, Wang, Naji, Irianto and Wang. This is an open-access article distributed under the terms of the Creative Commons Attribution License (CC BY). The use, distribution or reproduction in other forums is permitted, provided the original author(s) and the copyright owner(s) are credited and that the original publication in this journal is cited, in accordance with accepted academic practice. No use, distribution or reproduction is permitted which does not comply with these terms.
*Correspondence: Yue J. Wang, julia.wang@med.fsu.edu