 Yuan-Yuan Yang1,2,3,4
 Zhong-Xiuzi Gao1,2,3,4
 Zi-Hui Mao1,2,3,4
 Dong-Wei Liu1,2,3,4
 Zhang-Suo Liu1,2,3,4*
 Peng Wu1,2,3,4*
- 1Traditional Chinese Medicine Integrated Department of Nephrology, The First Affiliated Hospital of Zhengzhou University, Zhengzhou, China
- 2Institute of Nephrology, Zhengzhou University, Zhengzhou, China
- 3Henan Province Research Center for Kidney Disease, Zhengzhou, China
- 4Key Laboratory of Precision Diagnosis and Treatment for Chronic Kidney Disease in Henan Province, Zhengzhou, China
Background: Accumulating evidence indicates that mitophagy is crucial for the development of diabetic nephropathy (DN). However, little is known about the key genes involved. The present study is to identify the potential mitophagy-related genes (MRGs) in DN.
Methods: Five datasets were obtained from the Gene Expression Omnibus (GEO) database and were split into the training and validation set. Then the differentially expressed MRGs were screened and further analyzed for GO and KEGG enrichment. Next, three algorithms (SVM-RFE, LASSO and RF) were used to identify hub genes. The ROC curves were plotted based on the hub genes. We then used the CIBERSORT algorithm to assess the infiltration of 22 types of immune cells and explore the correlation between hub genes and immune cells. Finally, the Nephroseq V5 tool was used to analyze the correlation between hub genes and GFR in DN patients.
Results: Compared with the tubulointerstitium, the expression of MRGs was more noticeably varied in the glomeruli. Twelve DE-MRGs were identified in glomerular samples, of which 11 genes were down-regulated and only MFN1 was up-regulated. GO and KEGG analysis indicated that several enrichment terms were associated with changes in autophagy. Three genes (MFN1, ULK1 and PARK2) were finally determined as potential hub genes by three algorithms. In the training set, the AUROC of MFN1, ULK1 and PARK2 were 0.839, 0.906 and 0.842. However, the results of the validation set demonstrated that MFN1 and PARK2 had no significant difference in distinguishing DN samples from healthy controls, while the AUROC of ULK1 was 0.894. Immune infiltration analysis using CIBERSORT showed that ULK1 was positively related to neutrophils, whereas negatively related to M1 and M2 macrophages. Finally, ULK1 was positively correlated with GFR in Nephroseq database.
Conclusions: ULK1 is a potential biomarker for DN and may influence the development of diabetic nephropathy by regulating mitophagy.
1. Introduction
Diabetic nephropathy (DN) is one of the most common diabetic microvascular complications, contributing to considerable mortality and expense throughout the world (1, 2). DN is characterized by persistent albuminuria or proteinuria, reduced glomerular filtration rate (GFR), and a wide range of pathological changes in the kidney (3). The pathogenesis of DN is complicated and multifactorial, involving many pathways and mediators (4). Recently, selective autophagy induced by autophagy substrate as a trigger has received extensive attention. As one of the extensive-studied sorts of selective autophagy, mitophagy performs a pivotal function in retaining mitochondrial functional and genetic integrity (5), and has been viewed as a key component in the development of DN.
Mitophagy targets damaged and depolarized mitochondria and regulates mitochondrial quality control. The key pathway involved in the initiation of mitophagy is the AMPK/mTOR pathway, which is the transition from anabolism to catabolism in cells. As a conserved substrate of AMPK, ULK1 is essential for autophagy (6). In mammals, the lack of AMPK or ULK1 leads to abnormal accumulation of p62 and mitophagy defects. The PINK1-Parkin pathway is a well-studied mitophagy mechanism for the elimination of dysfunctional mitochondria (7). By phosphorylating Parkin, PINK1 facilitates Parkin’s translocation from the cytoplasm to mitochondria for mitophagy (8). Mutations in PINK1 and Parkin cause early onset forms of Parkinson’s disease (9, 10). In addition, there are several protein receptor-mediated pathways that related to mitophagy, including FUN14 domain-containing protein1 (FUNDC1), mitochondrial protein Nix (also known as BNIP3L) and BCL2 interacting protein 3 (BNIP3) (11). BNIP3/Nix is involved in mitochondrial membrane depolarization-induced hypoxia or mitochondrial autophagy (12). FUNDC1 interacts with LC3 and participates in autophagy via the conservative LC3-interacting region domain (13).
Using a transgenic mouse mito-QC for monitoring mitophagy in vivo, researchers found that the kidney is one of the most active mitophagy tissues (14). Mounting evidence revealed that mitophagy is strongly related to the progression of DN. For instance, Xiao et al. demonstrated that mitophagy is significantly reduced in diabetic db/db mice, and mitochondrial antioxidant (mitoQ) can improve mitochondrial quality control and renal tubular damage in DN by increasing PINK1-mediated mitophagy (15). Another study reported that forkhead-box class O1 (FoxO1) promotes mitophagy through a PINK1/Parkin pathway, thereby reducing podocyte damage in diabetic nephropathy (16).
Although growing studies reveal that mitochondrial autophagy is related to the pathogenesis of DN, it remains unknown which mitophagy-related genes (MRGs) are necessary for the development of DN. In this study, we performed bioinformatic analysis to identify new biomarkers for DN that may be linked to MRGs.
2. Materials and methods
2.1. Collection and preprocessing of data
The study flow diagram is presented in Figure 1. Five gene expression datasets had been acquired from the Gene Expression Omnibus (GEO) database (17): GSE104948 (18), GSE96804 (19, 20), GSE47184 (21), GSE104954 (18) and GSE30528 (22). Detailed information about the five datasets were showed in Table 1. In total, 108 glomeruli samples (57 DN, 51 living healthy donors) and 40 tubulointerstitium samples (18 DN, 22 living healthy donors) were included in our study to evaluate the expression level of MRGs. Gene symbols matched the array probes according to annotation data. A maximum expression value was used to represent the average expression level when mutiple probes corresponded to the identical gene. We used the robust multi-array average expression measure to normalize the data (23). Then we merged different datasets together. The effect of inter-sample correction was demonstrated using a two-dimensional PCA cluster plot. The ComBat function of the R package “sva” (24) was used to remove batch effects, which is the normalization of PCA cluster graph.
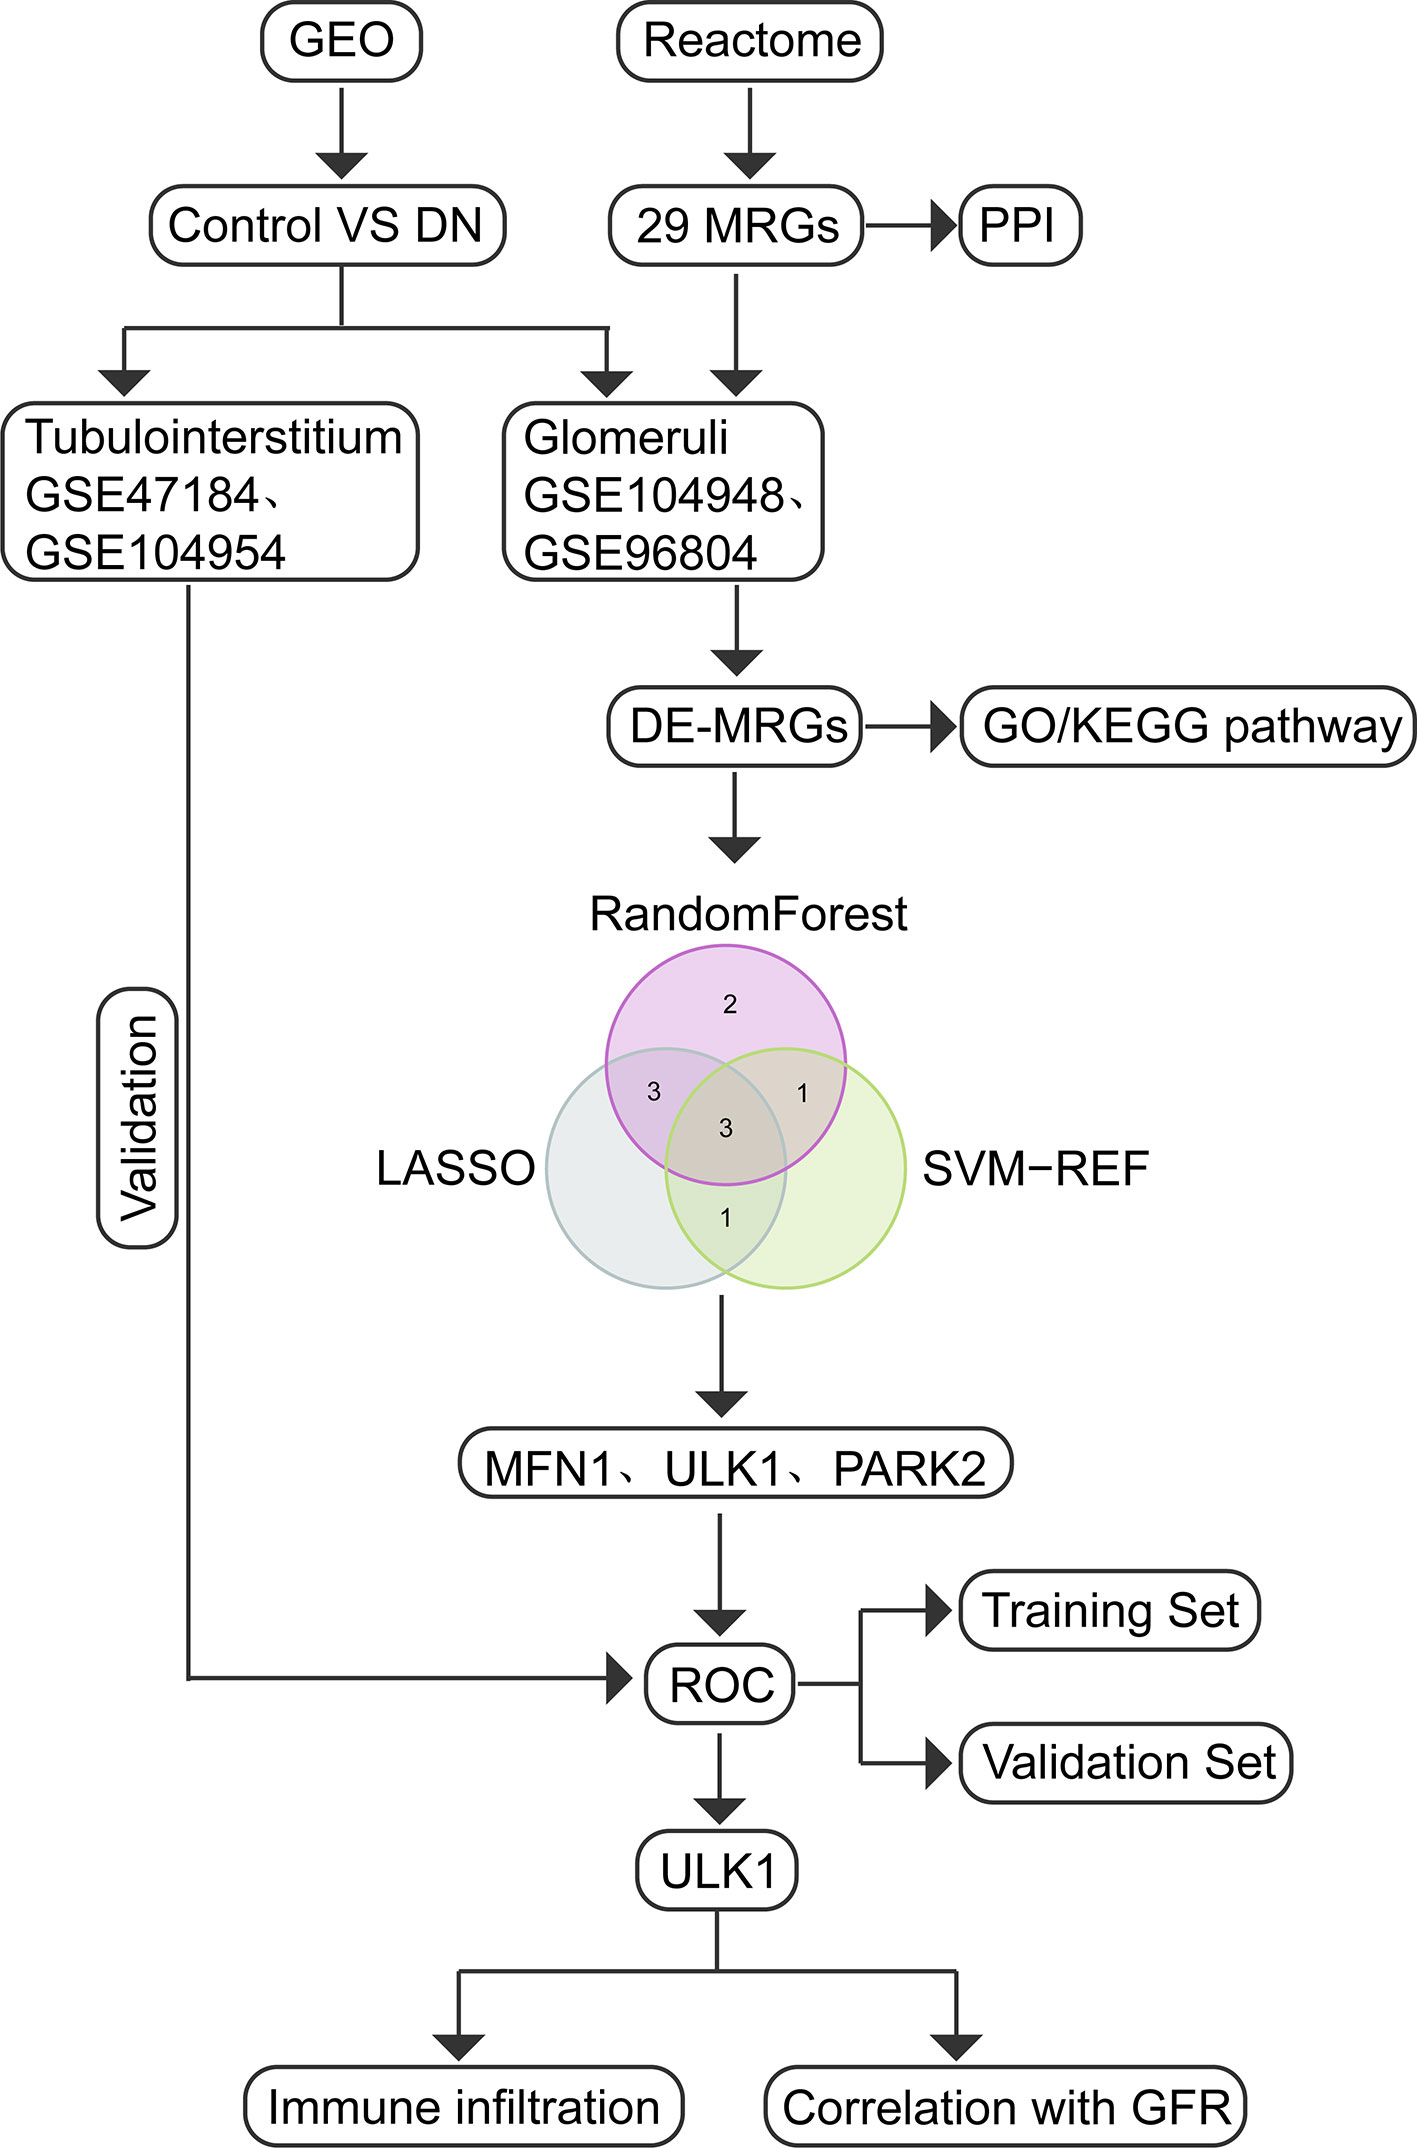
Figure 1 Study flow diagram.
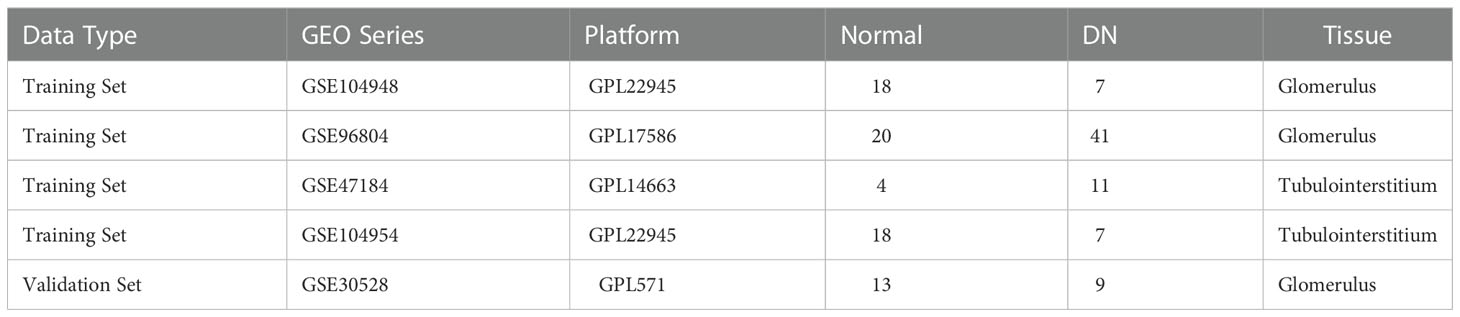
Table 1 Detailed information about the collected datasets.
2.2. Identification of differential expressed mitophagy-related genes
Twenty-nine MRGs were extracted from Reactome Pathway Database (https://reactome.org) (Table 2). We used the limma package (25) to identify the differentially expressed mitophagy-related genes (DE-MRGs) between the DN patients and controls, and the “heatmap” and “ggplot2” packages were used to draw volcano plot, heatmaps, and box plots. We adjust P values by using Benjamini-Hochberg-based False Discovery Rate method. Genes with an adjusted P-value <0.05 were considered as DE-MRGs.
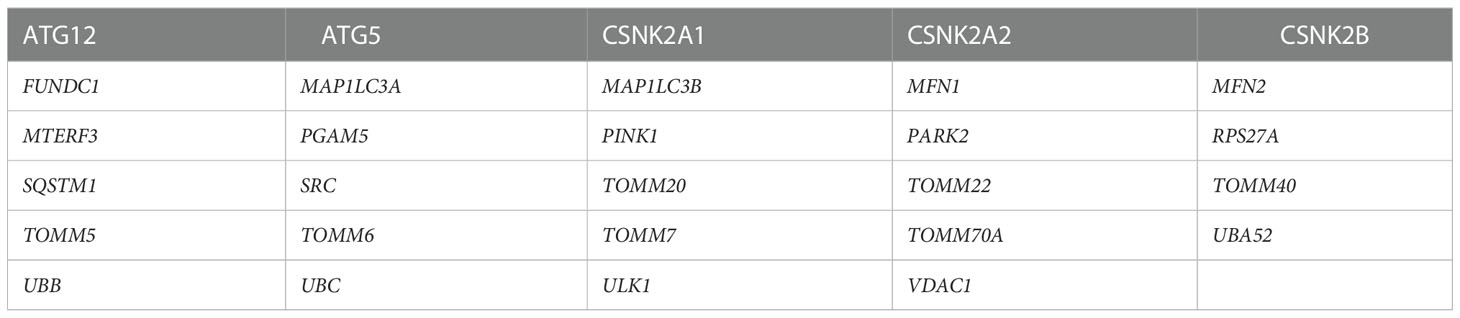
Table 2 29 mitophagy-related genes extracted from Reactome Pathway Database.
2.3. Functional enrichment analysis of DE-MRGs
Gene Ontology (GO) and Kyoto Encyclopedia of Genes and Genomes (KEGG) were used to analyze DE-MRGs using the “clusterProfiler” package (26). The GO analysis identified three categories, consisting of biological process (BP), cellular component (CC), and molecular function (MF) (27). Analysis of possible pathways was conducted using KEGG (28).
2.4. Identification of optimal hub genes for DN
A support vector machine-recursive feature elimination (SVM-RFE) model was compared by the average misjudgement rates of their 10-fold cross-validations using the “e1071” software package (29). As a novel machine learning technique, SVM-RFE can rank features based on recursion to avoid overfitting (30). As a dimension reduction approach, least absolute shrinkage and selection operator (LASSO) regression exhibits superior performance when evaluating high-dimensional data compared to regression analysis and uses regularization to improve prediction accuracy. A 10-fold cross-verification of LASSO analysis was performed using the “glmnet” package by a turning or penalty parameter (31). Random forest (RF) is a supervised machine learning algorithm built with a decision tree algorithm and is used to solve regression and classification problems. Feature importance was determined by the Mean Decrease Gini Index calculated by RF (32). Using the above algorithms, hub genes for DN were identified. We established the receiver operating characteristic (ROC) curve and the pROC package in R was used to assess the diagnostic significance of mitophagy-related hub genes (33). The area under the ROC curve (AUROC) represented the size of the diagnostic efficiency.
2.5. Evaluation of immune cell infiltration
The CIBERSORT tool was used to explore differences in the proportions of 22 types of immunocytes between DN and controls (34). The correlation heatmap was drawn by the corrplot package. Principal component analysis (PCA) clustering and violin diagram of immune cells were performed using the “ggplot2” package.
2.6. Clinical correlation between hub genes and renal function in DN patients
We used the Nephroseq V5 tool (https://nephroseq.org/) to evaluate the relationship between hub genes and renal function of DN patients. Then we drawed the scatter plots by the “ggplot2” package.
2.7. Statistical analysis
R software was used for all statistical data analysis. Data are the mean value ± standard deviation (SD). Student’s t-tests or Wilcoxon tests were used to compare two groups. Three or more groups were compared by the Kruskal-Wallis test. Correlation analysis was assessed using Pearson correlation. p-values < 0.05 had been considered statistically significant.
3. Results
3.1. Landscape of MRGs in DN
The role of twenty-nine MRGs has been currently studied extensively and their interaction was shown in Figure 2A. Next, we compared the expression of these MRGs between glomeruli and tubulointerstitium samples. The PCA cluster diagrams in Figures 2B, C showed that the clustering of the two samples groups is more obvious after normalization, indicating that the source of the samples is reliable. Figure 2D indicated that 18 MRGs were identified in the glomeruli samples and 12 genes showed marked differential expression between DN and living healthy controls (p < 0.05), including CSNK2B, MFN1, MFN2, PINK1, PAPK2, SRC, TOMM20, TOMM7 and ULK1(p < 0.0001). However, as shown in Figure 2E, only 5 of a total 18 MRGs identified in tubulointerstitium samples displayed difference in expression. In summary, the most dramatic difference was observed in glomeruli samples. Therefore, glomeruli samples were selected for further study.
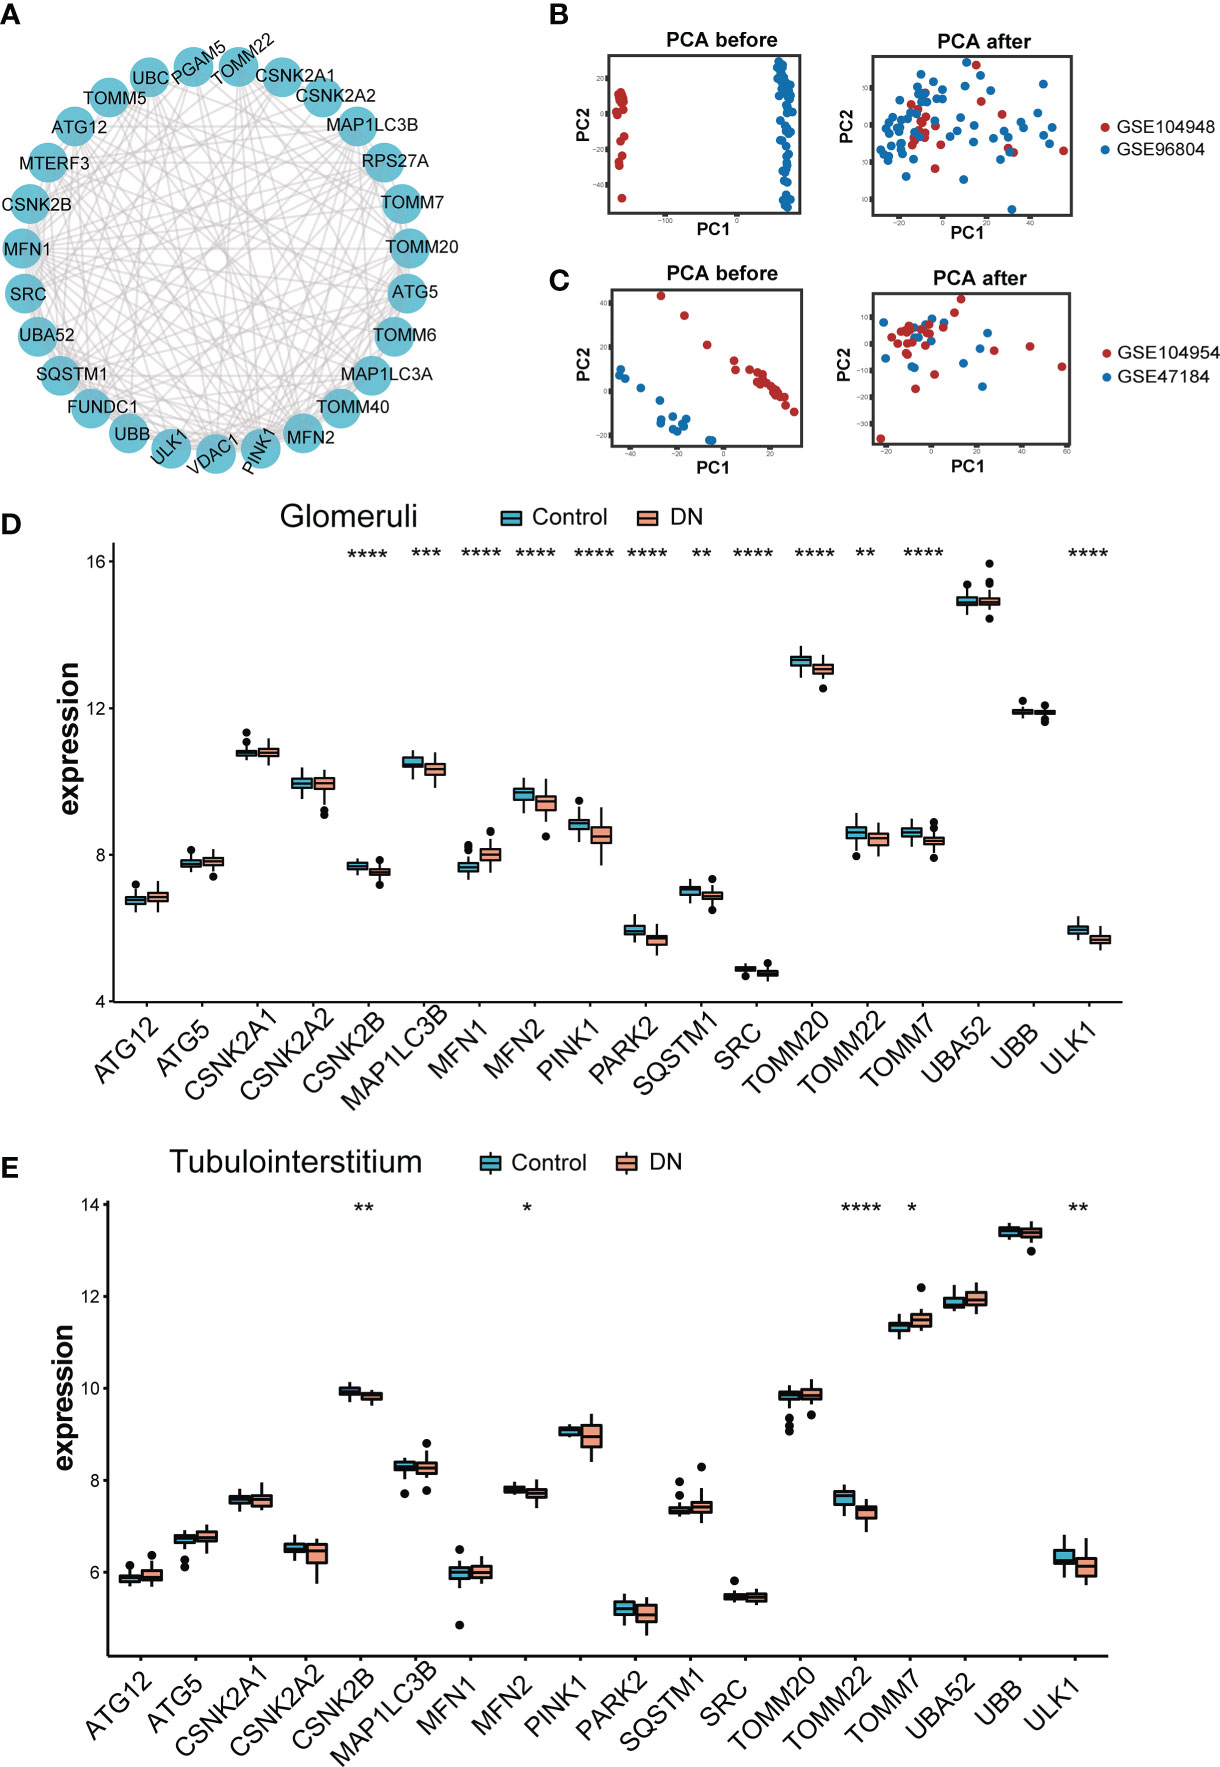
Figure 2 Landscape of mitophagy-related genes in DN. (A) Protein-protein interaction (PPI) network made up of 29 mitophagy-related genes. (B) The PCA plot of the GSE104948 and GSE96804 datasets before and after sample correction in glomeruli samples. (C) The PCA plot of the GSE104954 and GSE47184 datasets before and after sample correction in tubulointerstitium samples. (D) Box plot demonstrating the expression level of 18 mitophagy-related genes in glomeruli of living donor and DN. (E) Box plot demonstrating the expression level of 18 mitophagy-related genes in tubulointerstitium of living donor and DN. Differences between groups are indicated by “*”. *p < 0.05; **p < 0.01; ***p < 0.001;****p < 0.0001. Data were analyzed by Wilcoxon tests.
Volcano in Figure 3A showed 12 DE-MRGs, but only MFN1 was up-regulated and all other genes were downregulated in glomeruli samples. PINK1 exhibited the greatest fold-change of 0.31 among these downregulated genes, whereas the reduction of ULK1 was the most statistically significant. The heatmap in Figure 3B exhibited the expression of DE-MRGs among glomeruli samples. In correlation analysis (Figure 3C), we found that these genes are closely related, suggesting they may function together. The genes with the highest positive and negative correlation were displayed in scatterplots of Figure 3C. MFN2 and TOMM22 appeared to be the most negative correlation, whereas PINK1 were most positively correlated with ULK1. Interestingly, TOMM7 was not correlated with ULK1.
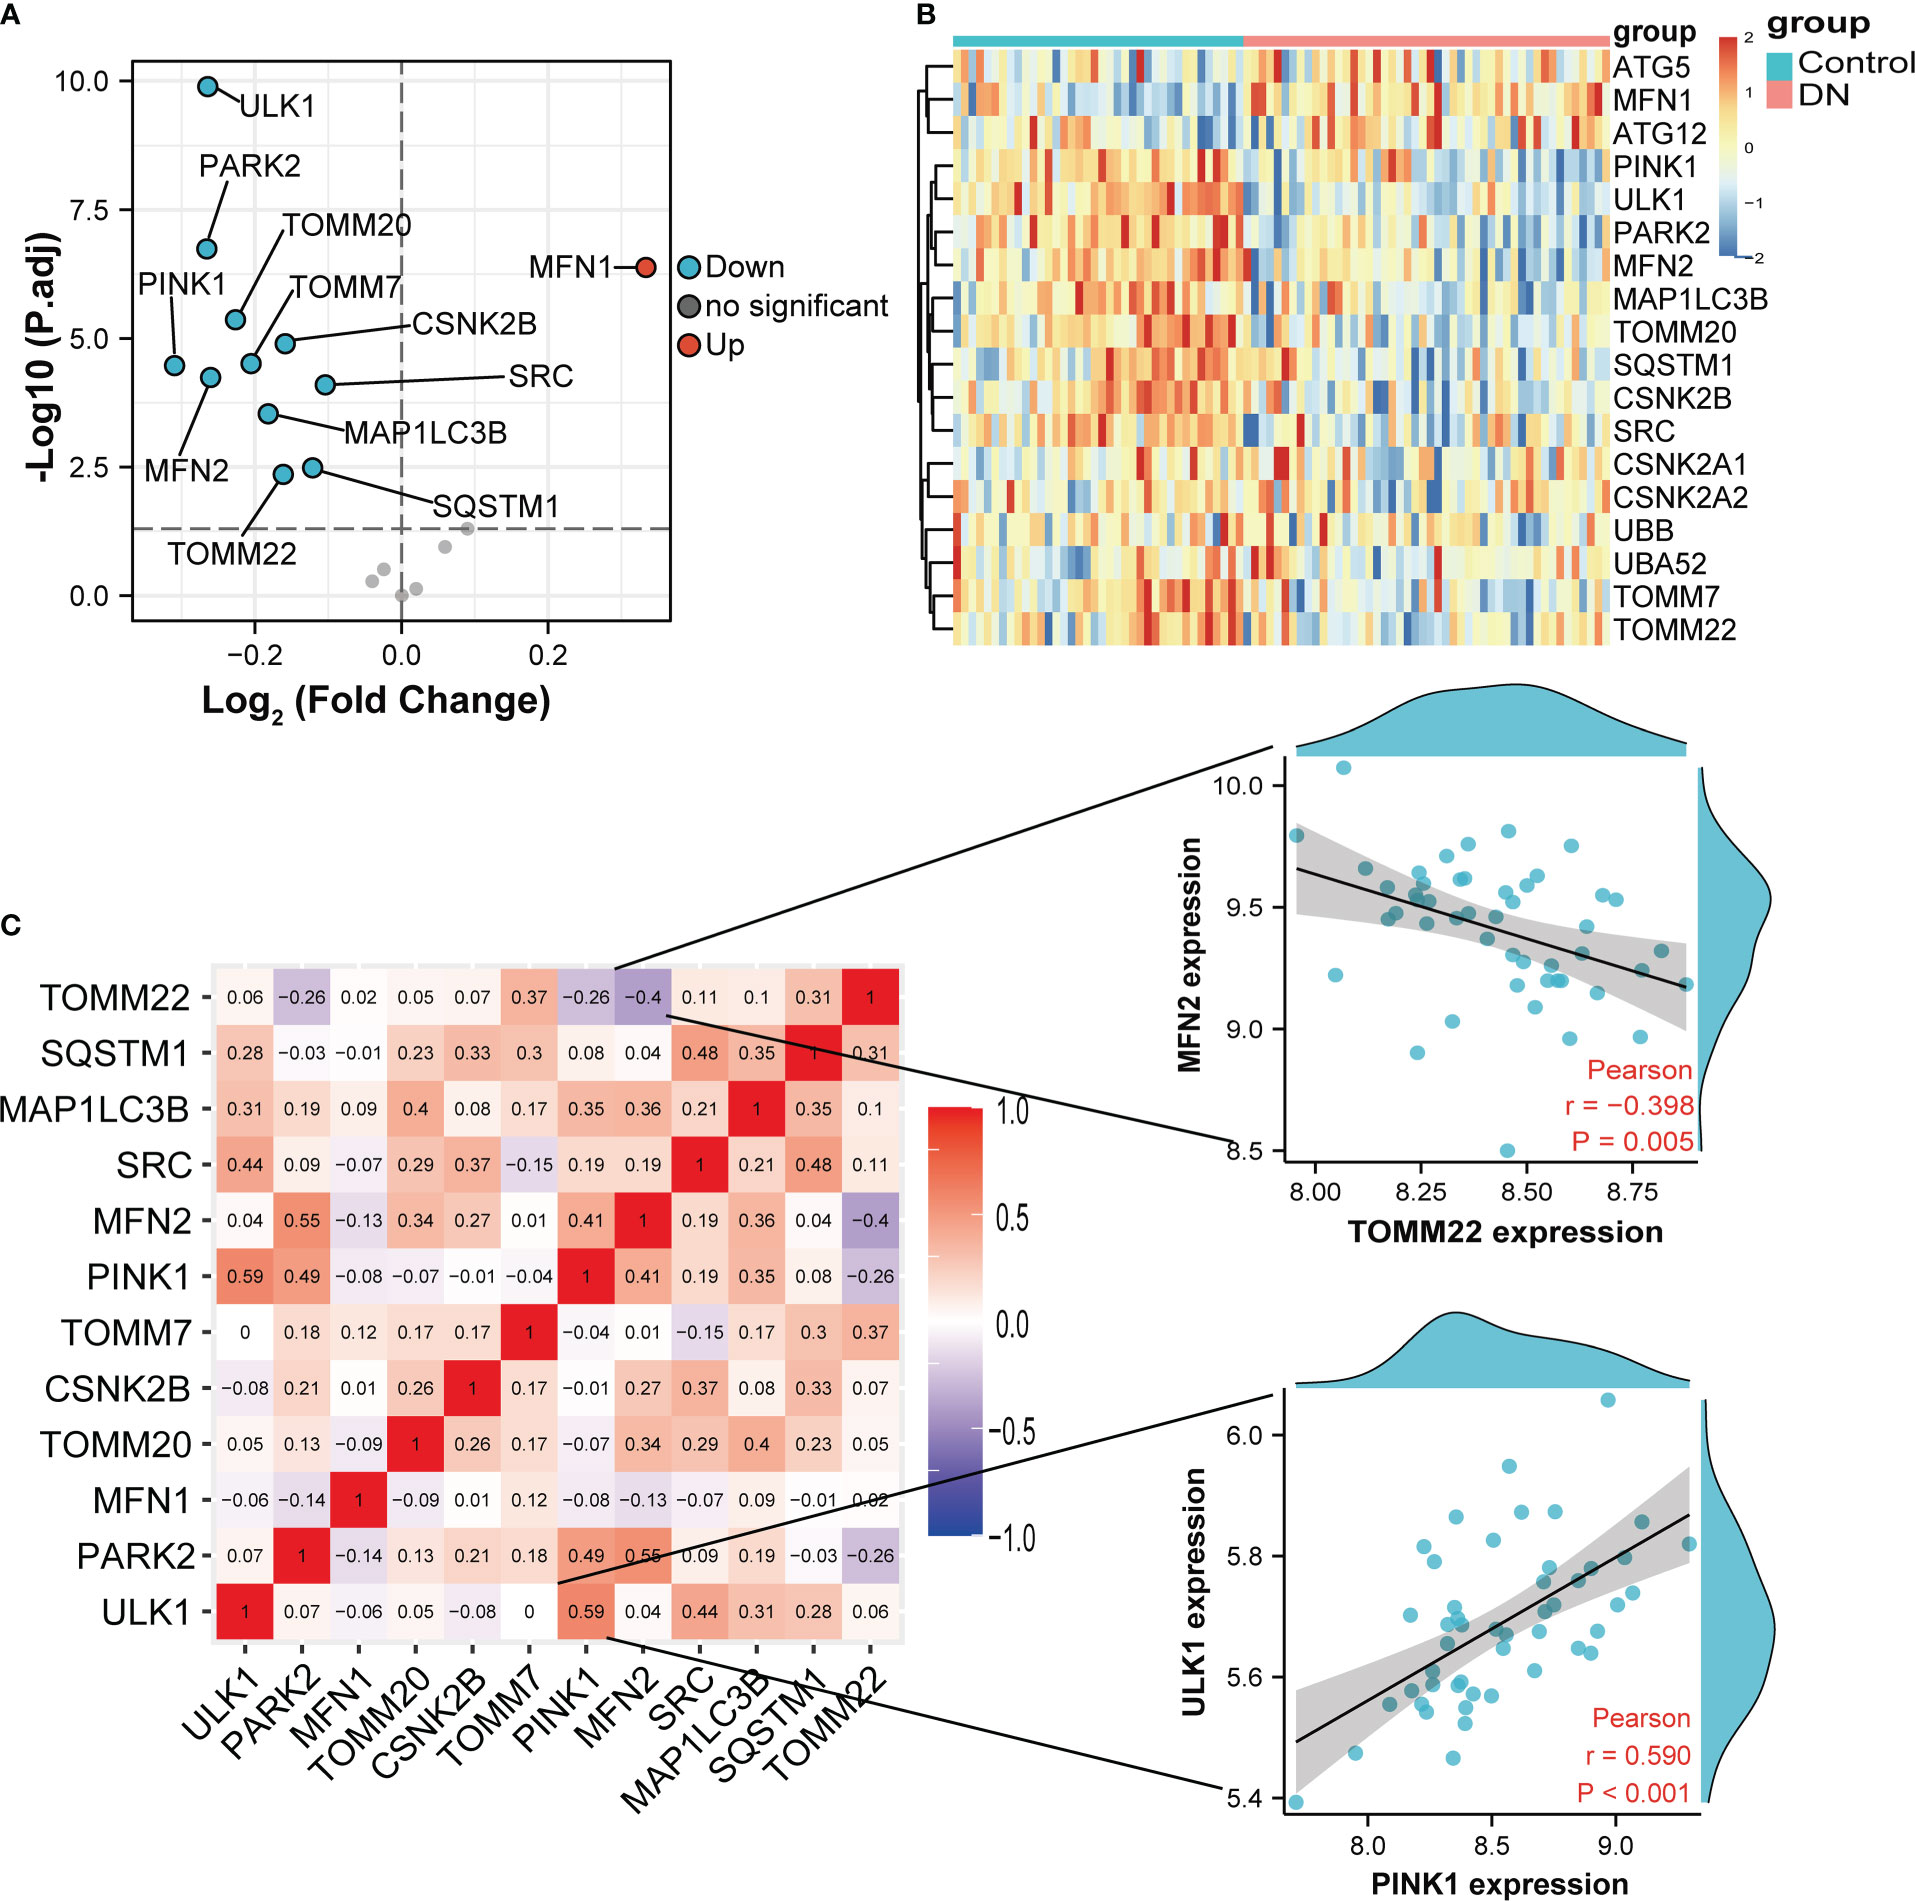
Figure 3 Variance analysis of mitophagy-related genes in DN. (A) Volcano plot showing a summary of the expression differences of 18 mitophagy-related genes between the healthy and DN patients’ glomerular samples. (B) The clustering heatmap exhibited the expression pattern of DE-MRGs among glomeruli samples. (C) Correlations between DE-MRGs in DN glomeruli samples and the respective scatterplots show the two pairs of MRGs with the highest correlation. Correlation analysis was assessed using Pearson correlation.
3.2. GO and KEGG analysis of the DE-MRGs
According to the GO and KEGG databases, we analyzed the functional enrichment of the DE-MRGs. The results of GO enrichment demonstrated that the most marked terms included macroautophagy, autophagy, process utilizing autophagic mechanism, response to mitochondrial depolarization, mitophagy (biological process); mitochondrial outer membrane (cellular component); protein transmembrane transporter activity and ubiquitin protein ligase binding (molecular function) (Figures 4A, B). In KEGG analysis, the DE-MRGs are mainly involved in the process of mitophagy-animal and pathways of neurodegeneration−multiple diseases (Figures 4C, D).
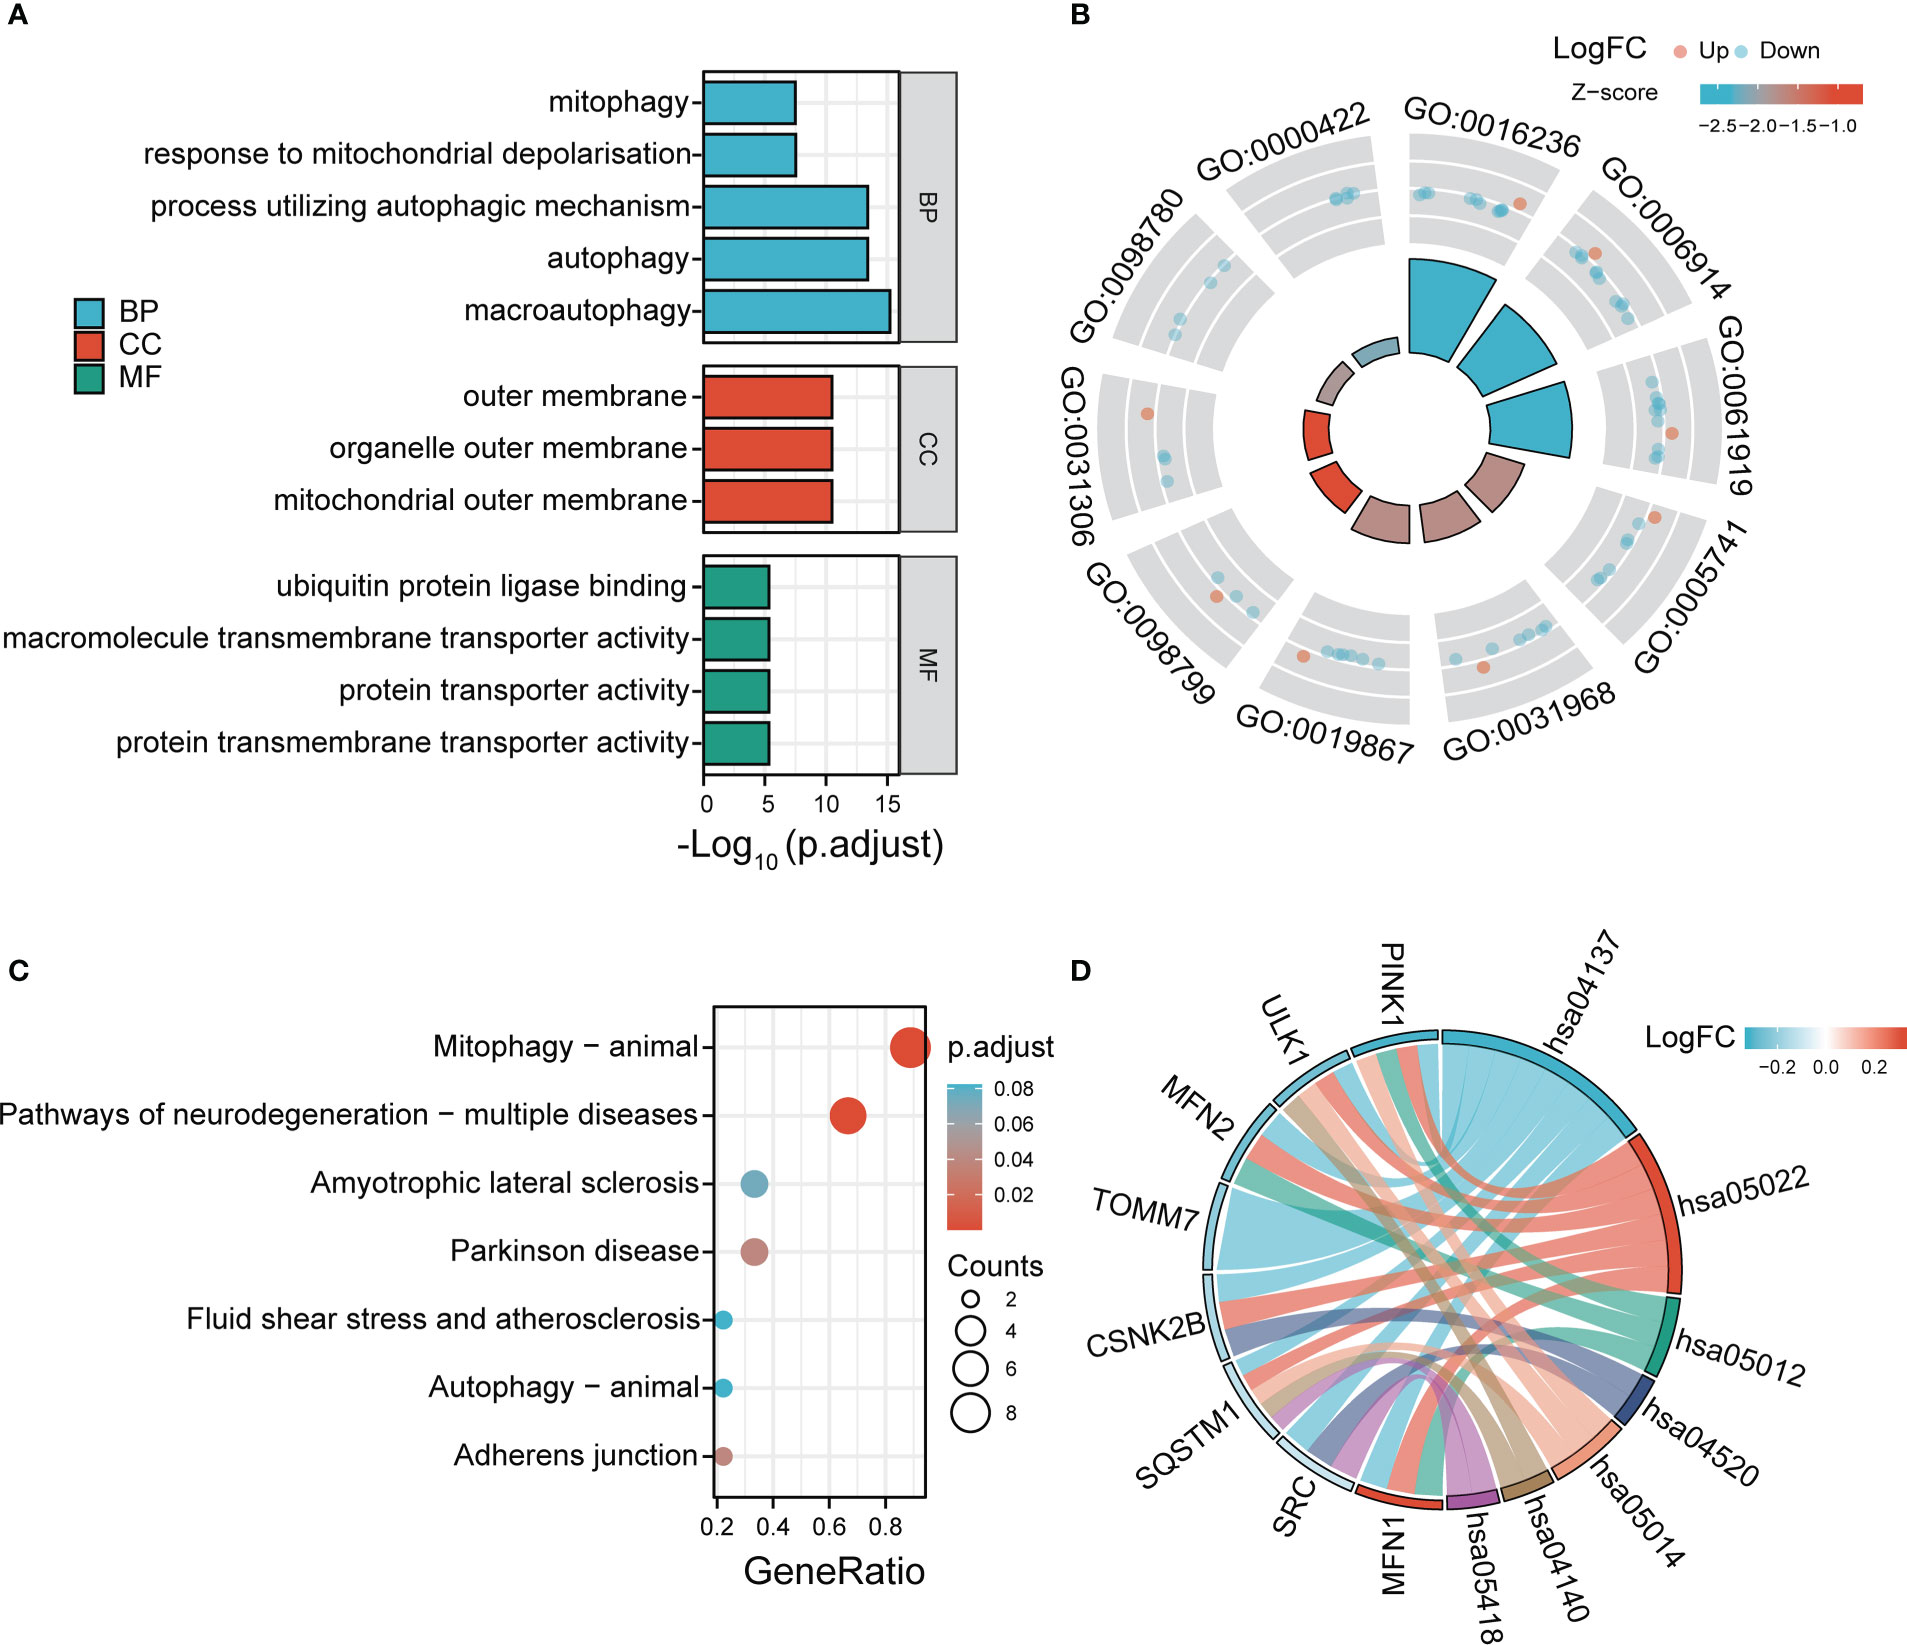
Figure 4 GO enrichment and KEGG analysis of 12 DE-MRGs. (A) Bubble plot of enriched GO terms. (B) Circos diagram of enriched GO terms. (C) Bubble plot of enriched KEGG terms. (D) Chord diagram of enriched KEGG terms. BP, biological process; CC, cellular component; MF, molecular function.
3.3. Identification of hub genes
For a better understanding of the diagnostic potential of DE-MRGs, we then constructed a prediction model for the diagnosis of DN using three different algorithms to distinguish the DN patients from healthy controls. Seven out of twelve DN-related features of non-zero coefficients were screened using the LASSO algorithm (Figures 5A, B). Next, features were selected and five genes were identified as the best candidates for DN based on SVM-RFE (Figures 5C, D). Then we identified feature importance using random forests and the top eight genes were selected as diagnostic genes (Figures 5E, F). Finally, we intersect the candidate genes acquired from the SVM-RFE, LASSO, and RF models, and 3 hub genes (ULK1, PARK2 and MFN1) were recognized for follow-up steps (Figure 5G).
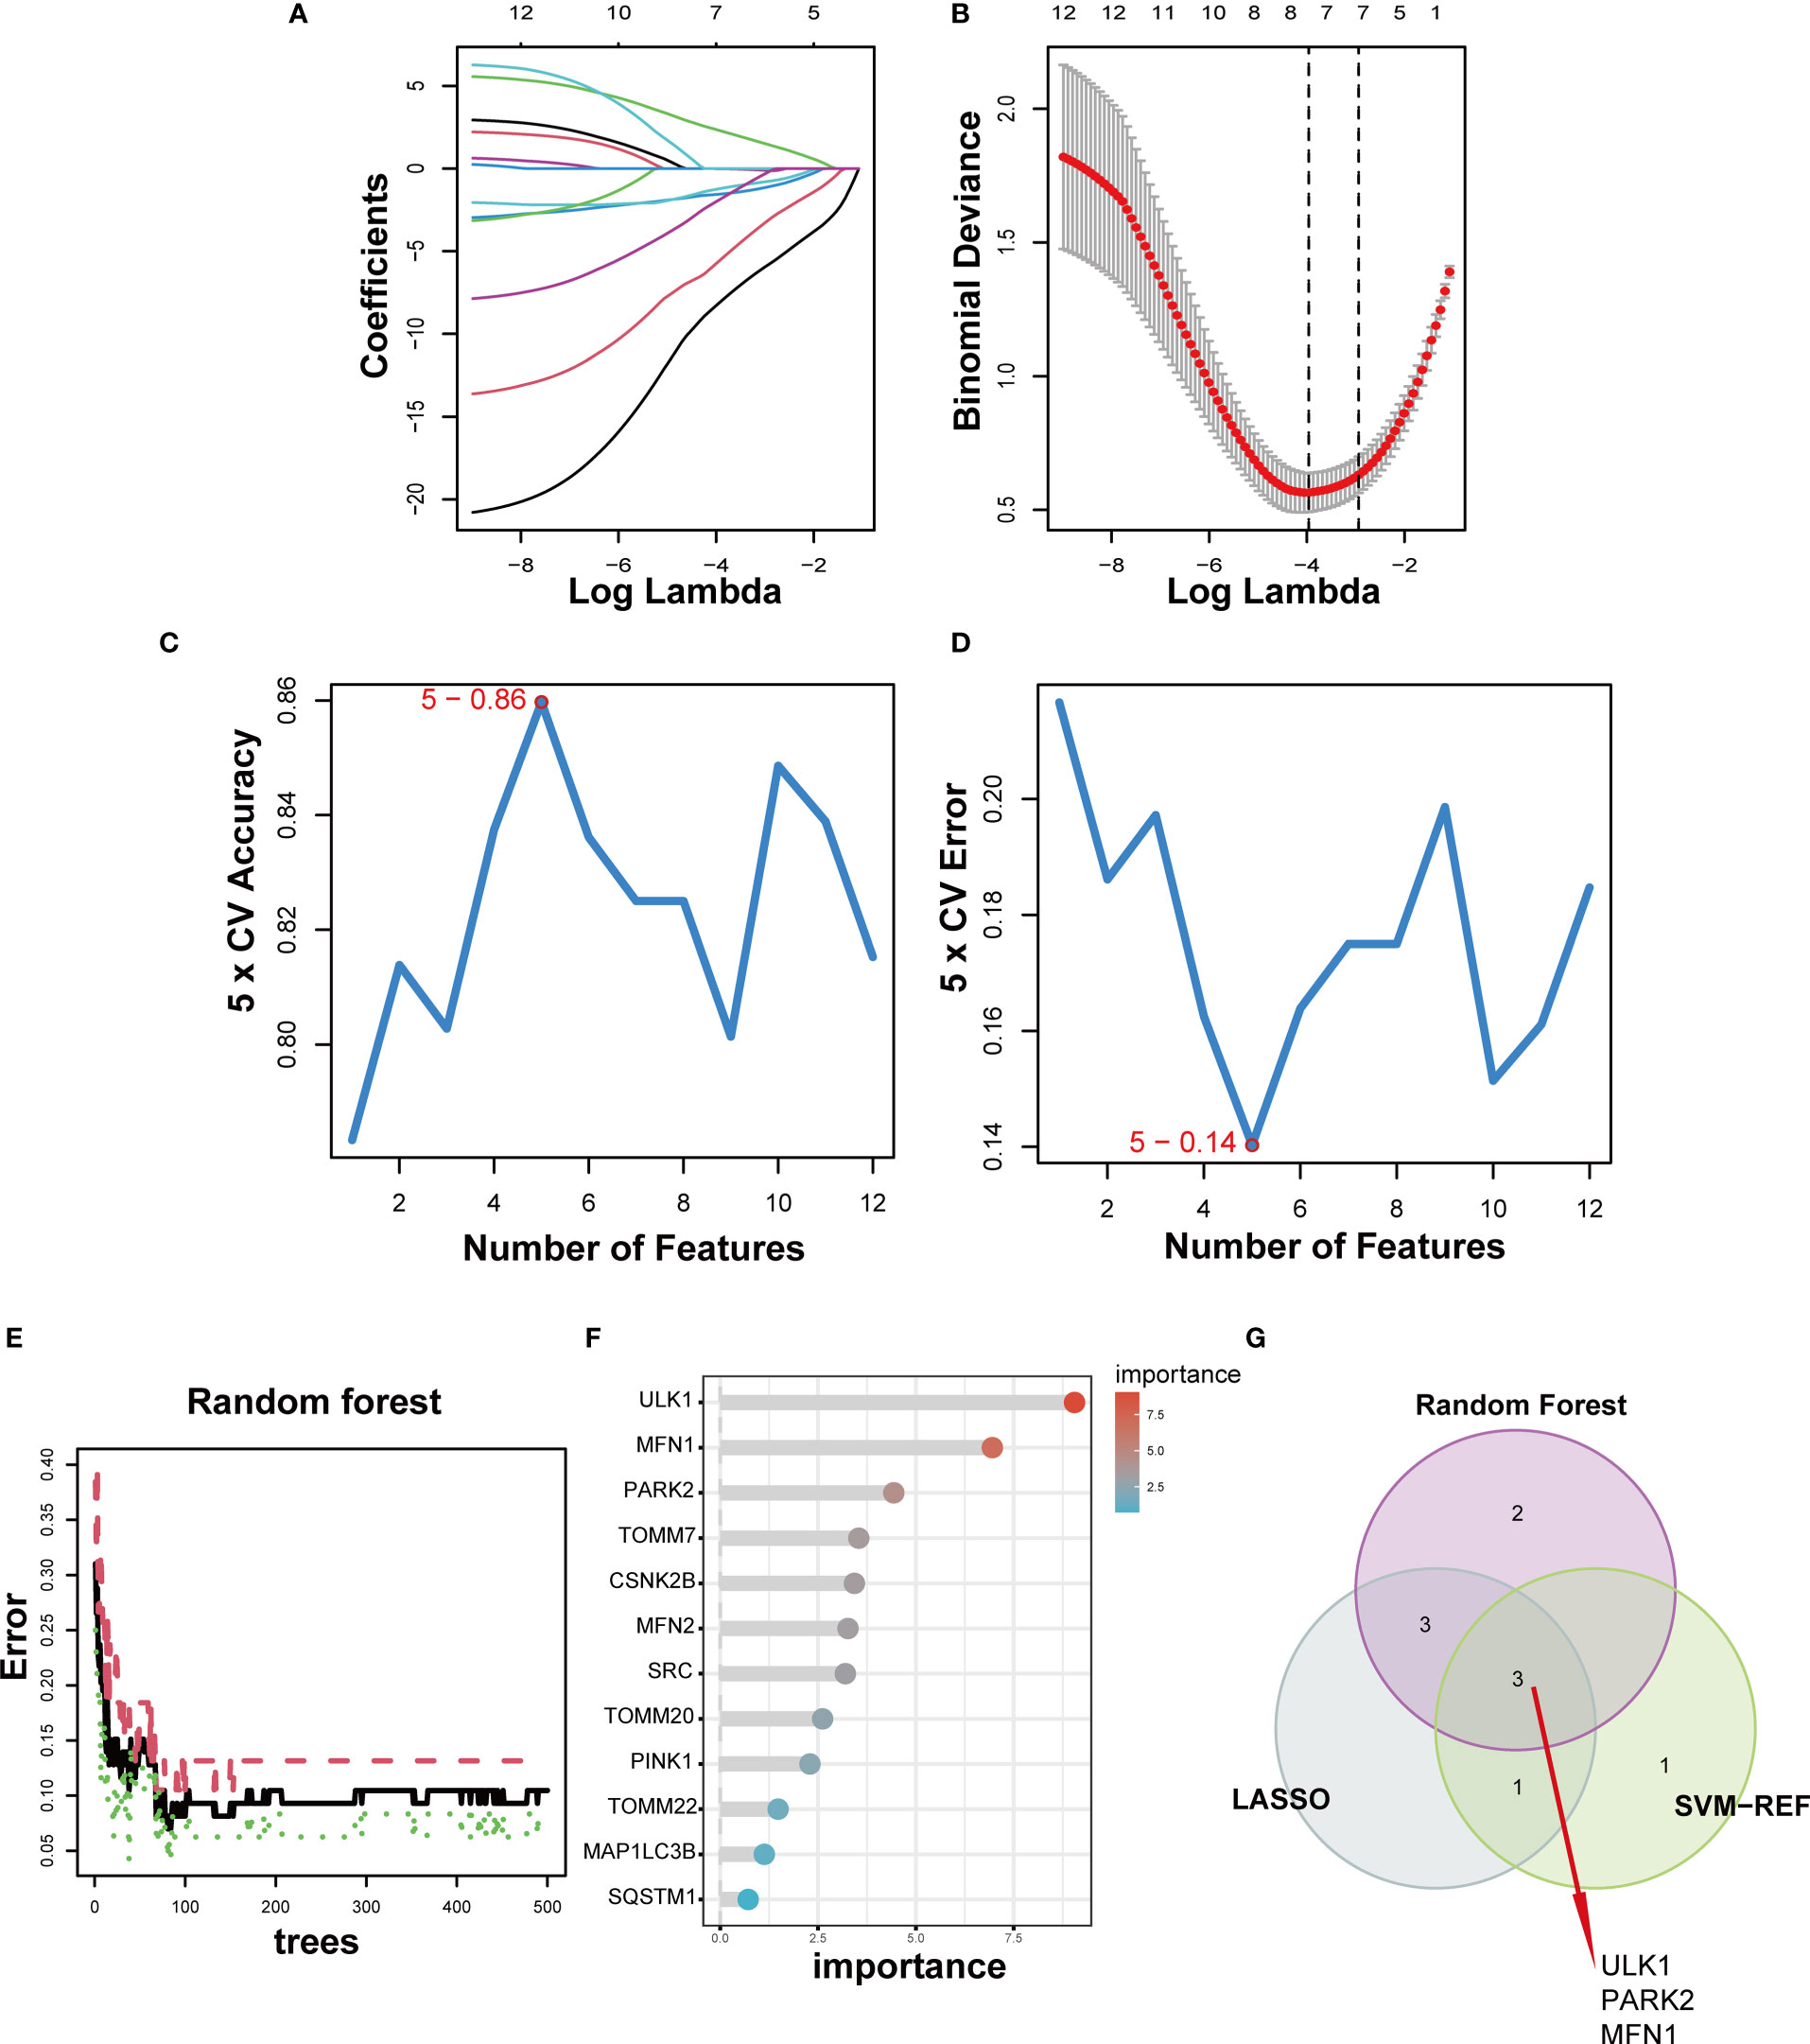
Figure 5 Three DE-MRGs were identified as diagnostic genes for DN. (A, B) Regression coefficient path diagram and cross-validation curves in LASSO logistic regression algorithm. (C, D) The curve of change in the predicted true and error value of each gene in SVM-RFE algorithm. (E, F) The identification of feature importance based on random forests. (G) Venn diagram demonstrates the intersection of diagnostic markers obtained from the three algorithms.
3.4. Performance of hub genes to diagnose diabetic nephropathy in the training set
In the training set (GSE104948 and GSE96804), MFN1 was significantly overexpressed in DN compared with the control, while the expression of ULK1 and PARK2 were reduced in the DN (all p < 0.001, Figures 6A–C). The ROC curve showed the AUROC of MFN1 was 0.839 (95% CI 0.746–0.932), with a specificity of 95.8% and a sensitivity of 71.1% (Figures 6D, G). For ULK1, the AUROC was 0.906 (95% CI 0.844–0.969), and the sensitivity and specificity were 95.8% and 73.7% (Figures 6E, G). The sensitivity, specificity, and the AUROC of PARK2 were 87.5%, 71.1%, and 0.842, respectively (Figures 6F, G).
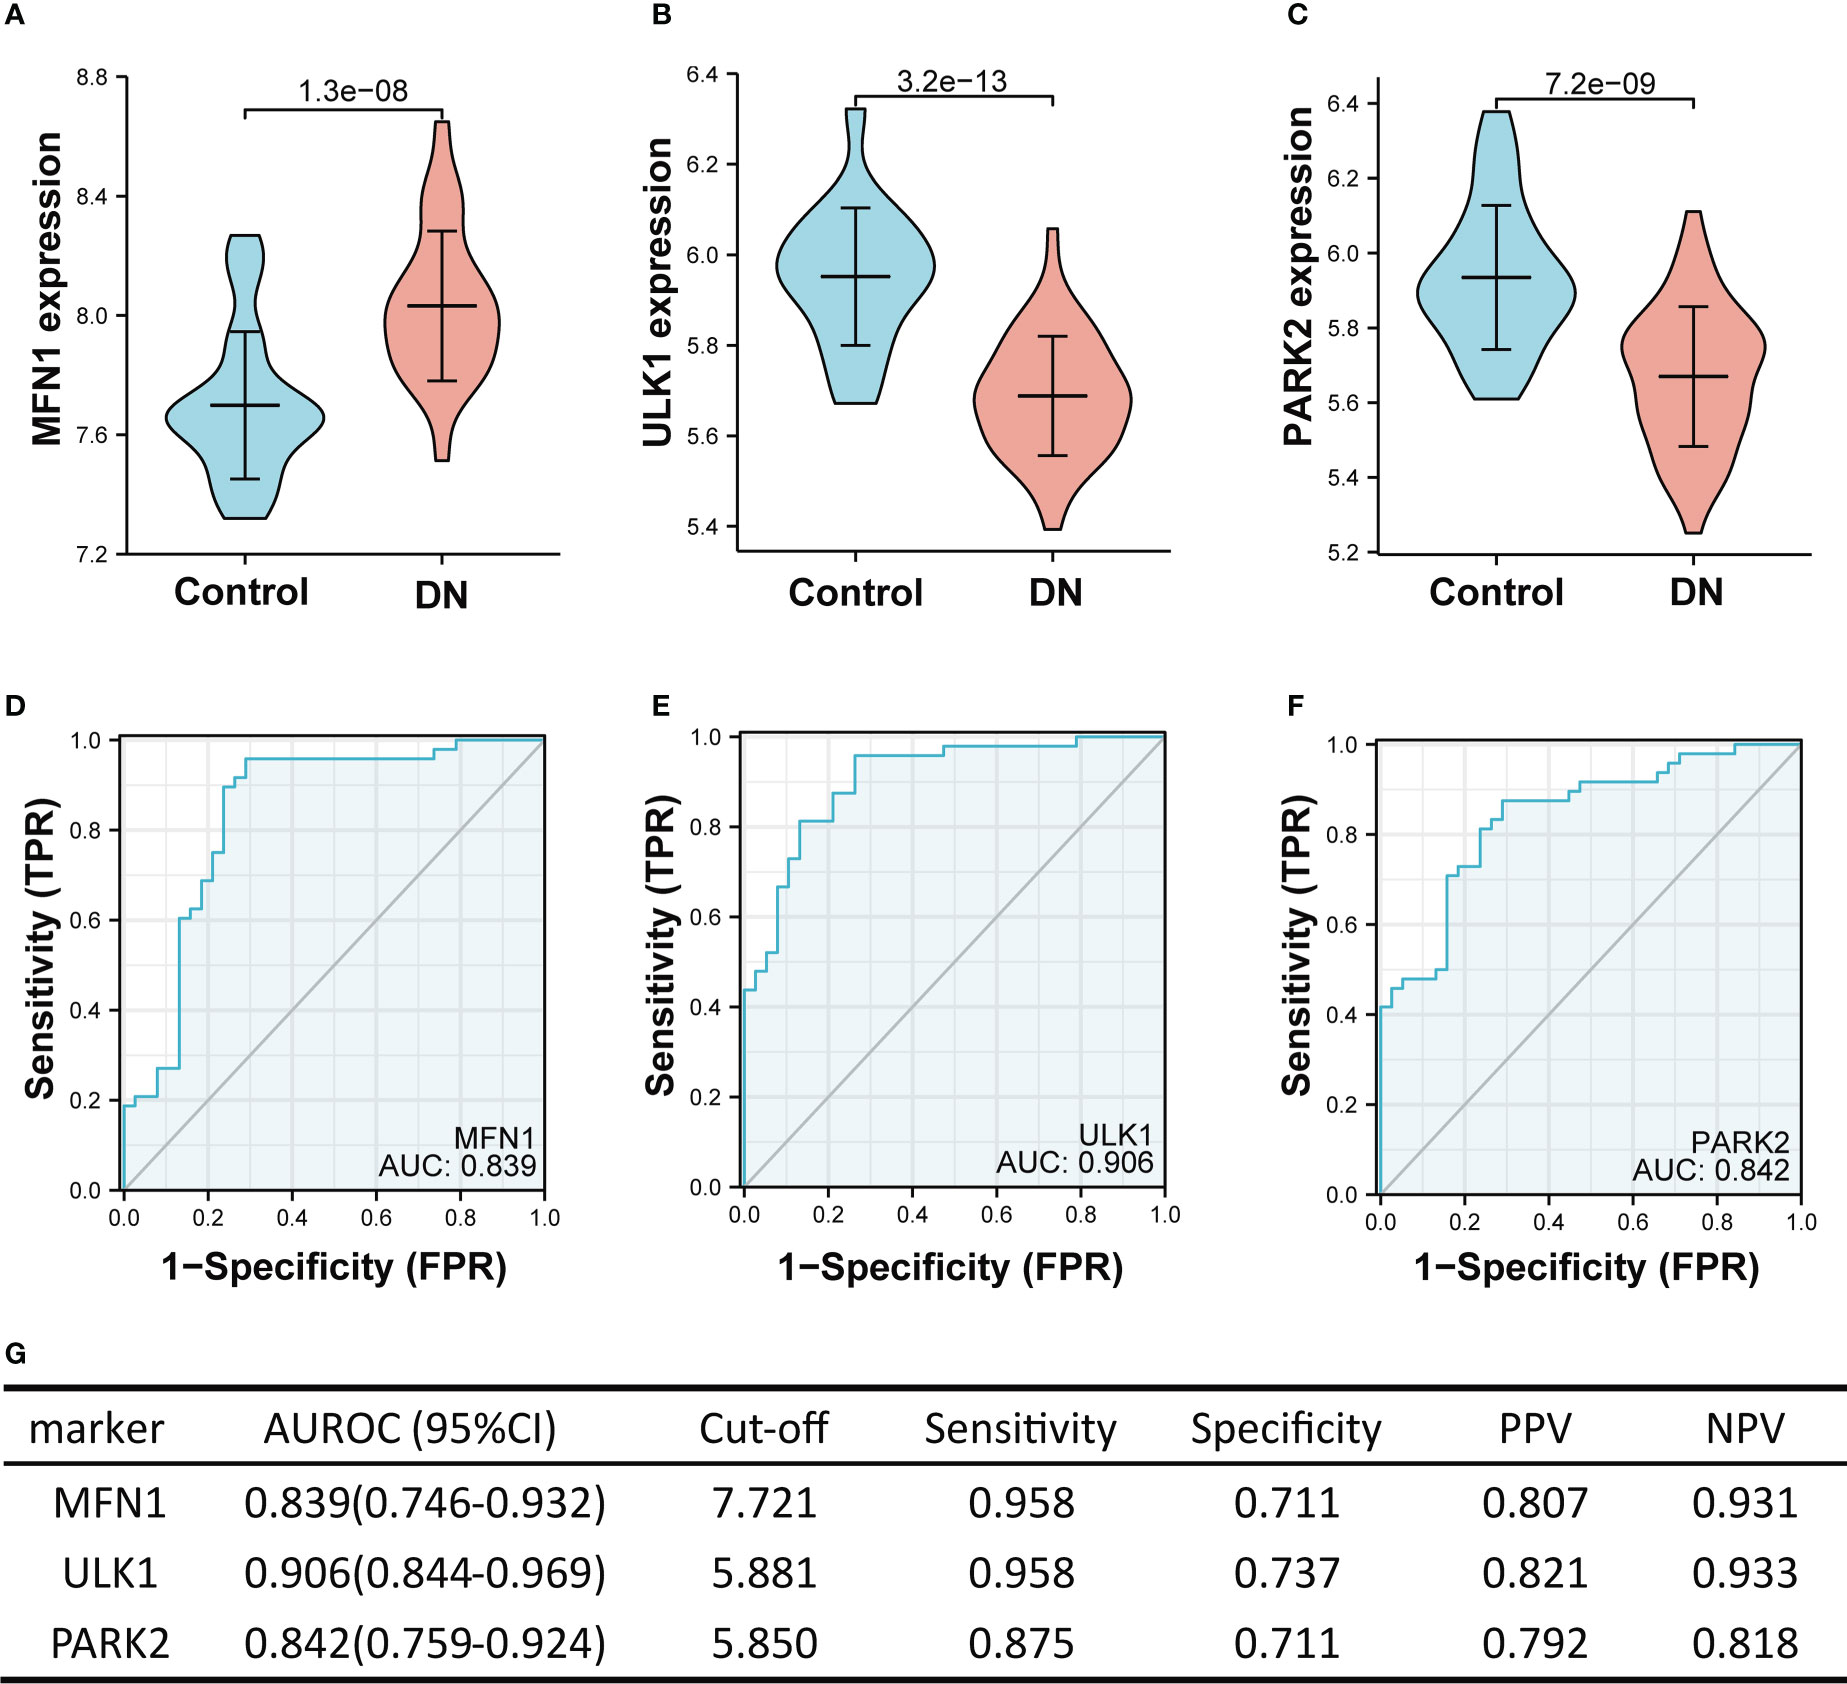
Figure 6 The performance of the three hub genes to diagnose DN in the training set. (A–C) Expression difference of the three hub genes in DN and control groups. (D–F) The ROC curve of the three hub genes in DN and control groups. (G) Diagnostic value of the three hub genes for differentiating DN from control groups. PPV, positive predictive value; NPV, negative predictive value; AUROC, area under the receiver operating characteristics curve; CI, confidence interval. Data were analyzed by Wilcoxon tests or Student’s t-tests.
3.5. Performance of hub genes to diagnose diabetic nephropathy in the validation set
Figure 7 showed the value of three mitophagy-related hub genes in the diagnosis of DN in the validation set (GSE30528). The expression of ULK1 was significantly lower in DN groups than in controls (mean 6.252 vs. 5.884, p < 0.01), whereas there was no significant difference in expression of MFN1 (p = 0.43) and PARK2 (p = 0.51) between DN and control. The ROC curve indicated that ULK1 had excellent performance in diagnosing DN, with AUROC of 0.894 (Figure 7E). Interestingly, these results are in conformity with the differential expression of tubulointerstitium samples between DN and controls, with only ULK1 displaying difference in expression (Figure 2E).
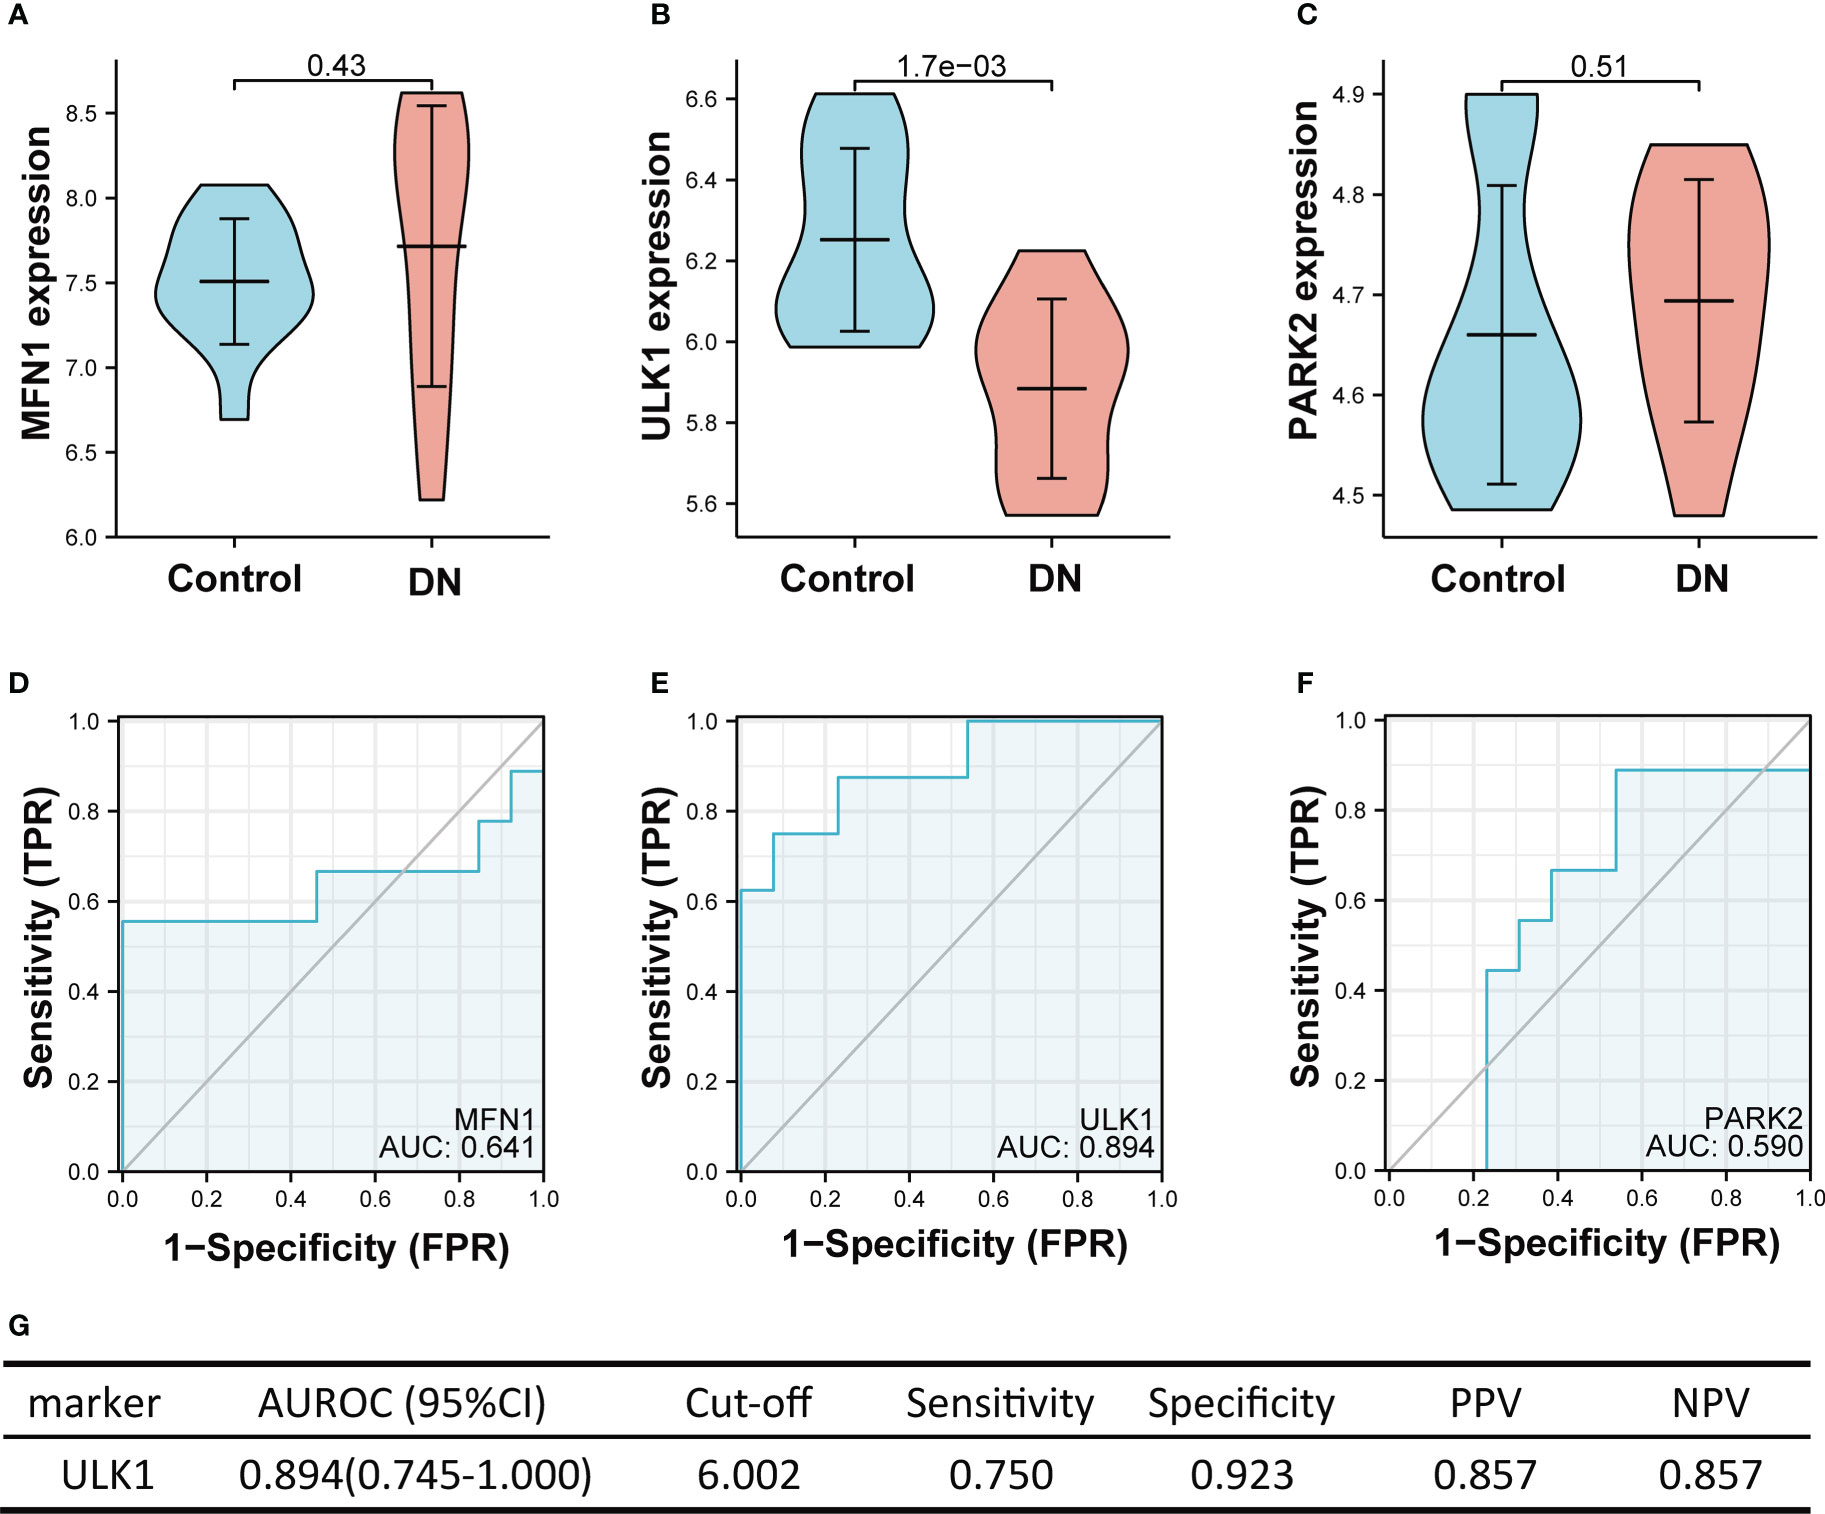
Figure 7 The performance of the three hub genes to diagnose DN in the validation set. (A-C) Expression difference of the three hub genes between DN and control groups. (D–F) The ROC curve of the three hub genes in DN and control groups. (G) Diagnostic value of ULK1 for differentiating DN from control groups. PPV, positive predictive value; NPV, negative predictive value; AUROC, area under the receiver operating characteristics curve; CI, confidence interval. Data were analyzed by Wilcoxon tests or Student’s t-tests.
3.6. Immune infiltration analysis
To explore whether the expression levels of mitophagy-related genes were related to immunity, immune infiltration of DN was assessed using the CIBERSORT algorithms. The analysis of PCA clusters showed that there was a huge distinction between the DN and control samples for immune cell infiltration (Figure 8A). Using the par function, the immune cell percentage was calculated and the stacked histogram was plotted (Figure 8B). Correlation heatmap drawn to assess the correlation among 22 immune cell infiltrations showed that activated dendritic cells, native CD4 T cells, and CD4 memory T cells had a significant positive relation. Moreover, native CD4 T cells and activated dendritic cells also had a positive relation. Resting mast cells had a significant negative correlation with activated mast cells. A negative correlation was also observed between CD8 T cells and resting CD4 memory T cells, and also between neutrophils and M2 macrophages, respectively (Figure 8C). As seen in the violin plot of the difference among 22 immune cell infiltrations (Figure 8D), gamma delta T cells, M1 macrophages, M2 macrophages and resting mast cells in DN had a high infiltration compared with control sample, while resting CD4 memory T cells, activated mast cells and neutrophils were less infiltrated.
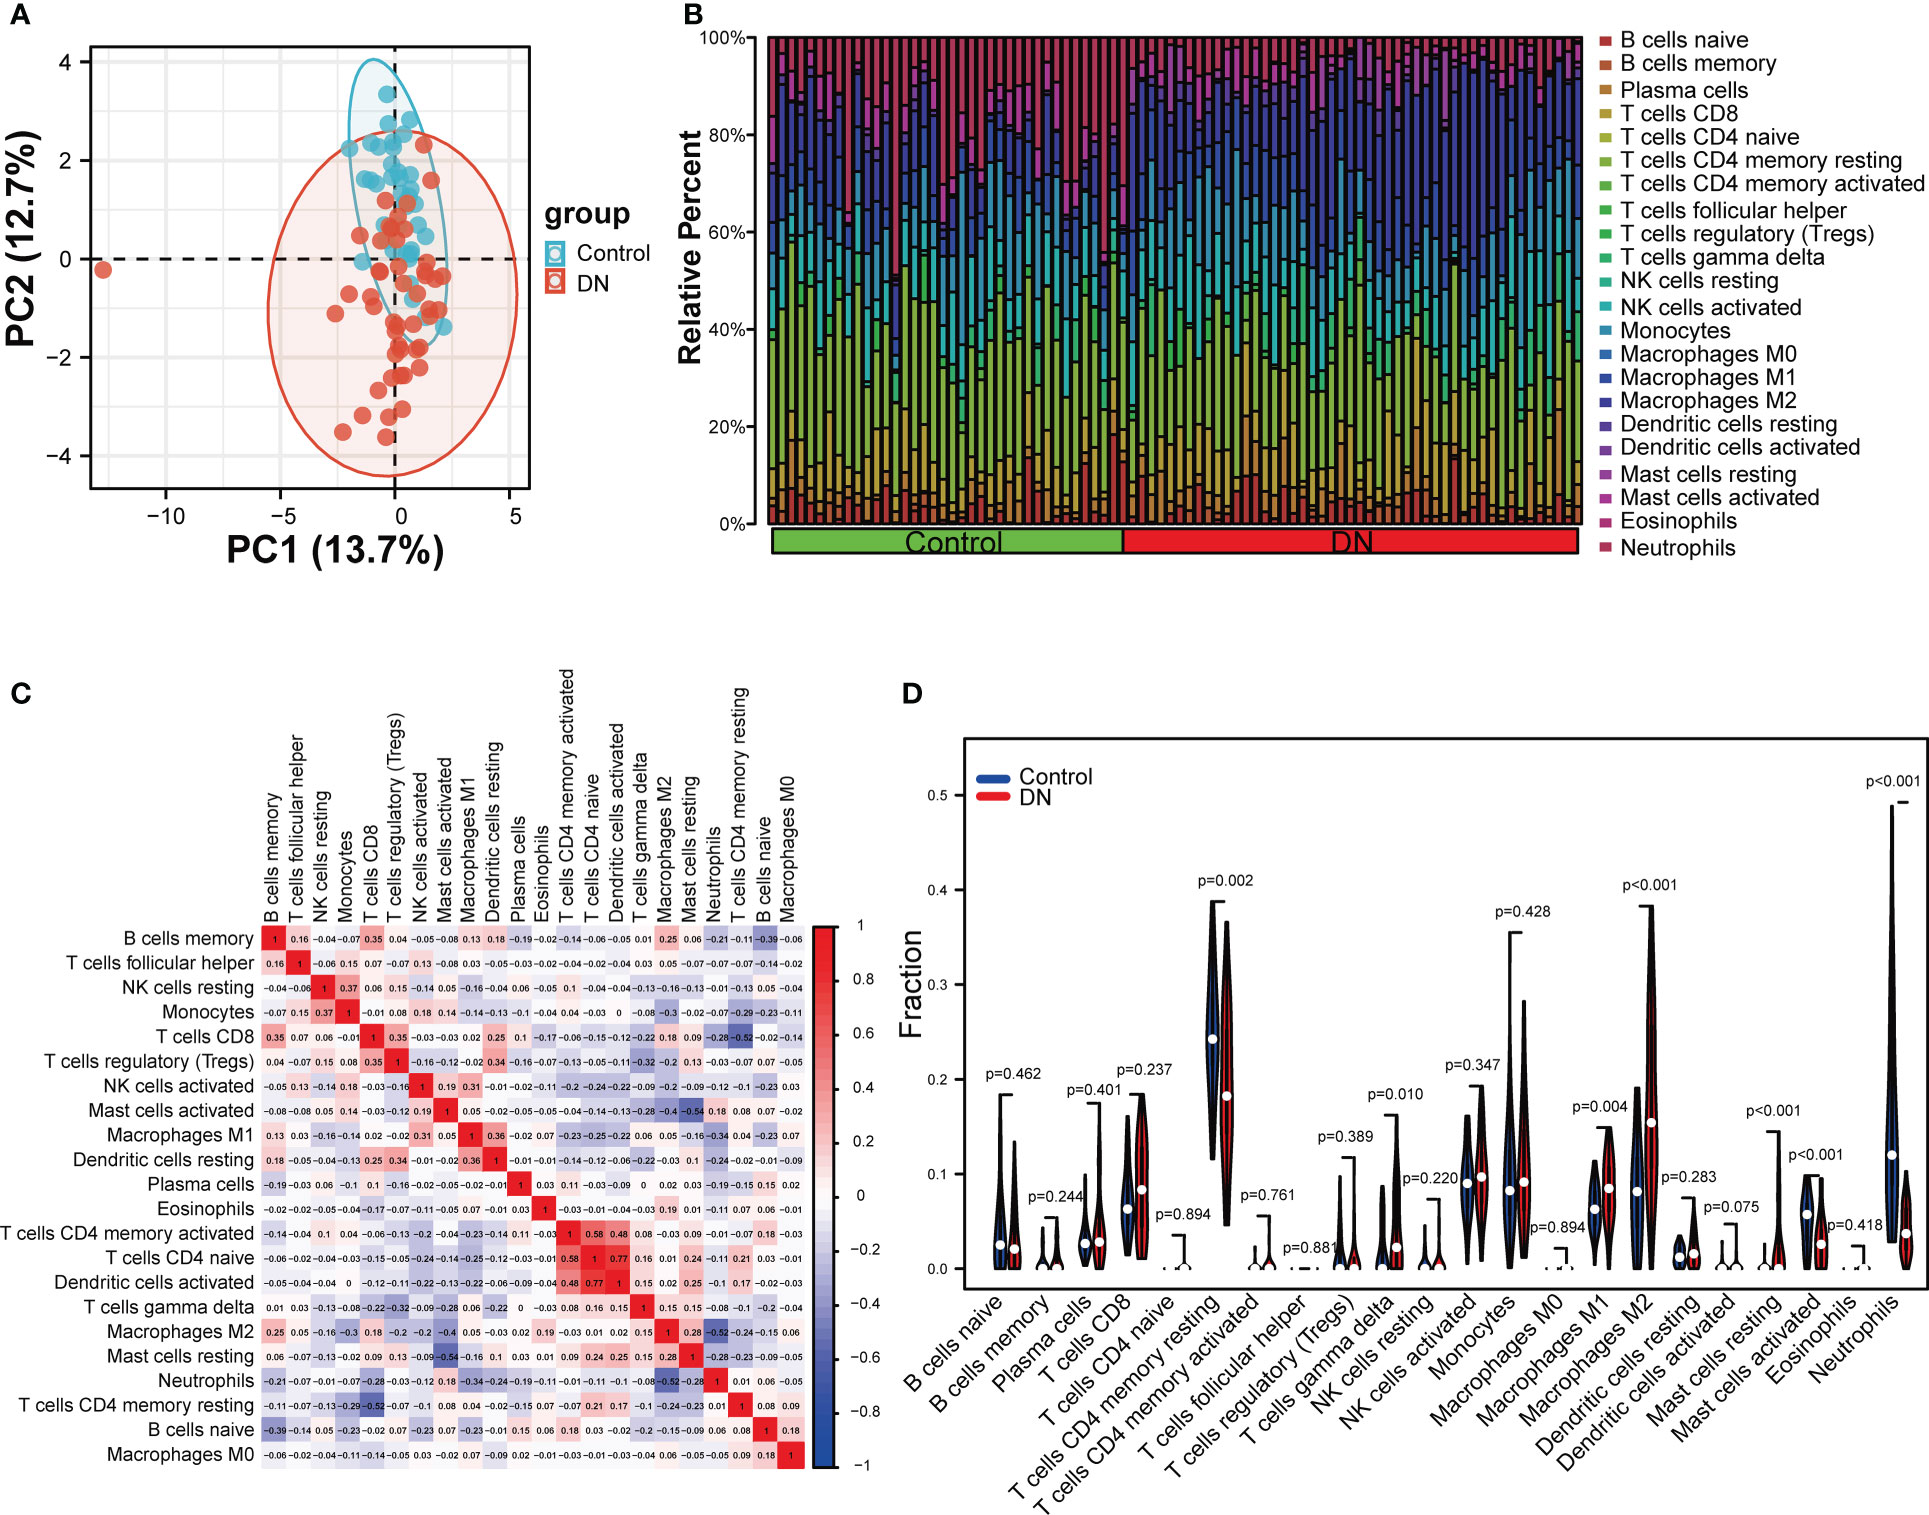
Figure 8 Evaluation and visualization of immune cell infiltration. (A) The PCA plot showing immune cell infiltration between DN and control samples. (B) Stacked histogram comparing DN and control samples for the immune cell percentage. (C) Correlation heat map of 22 types of immune cells. (D) Violin diagram showing 22 types of immune cells in proportion. Data were analyzed by Wilcoxon tests.
3.7. Correlation analysis between ULK1 and infiltrating immune cells
Based on the immune cell infiltrates, the expression of ULK1 was found to be positively related to neutrophils (r = 0.61), whereas negatively related to M1 macrophages (r = −0.225) and M2 macrophages (r = −0.52) (Figure 9).
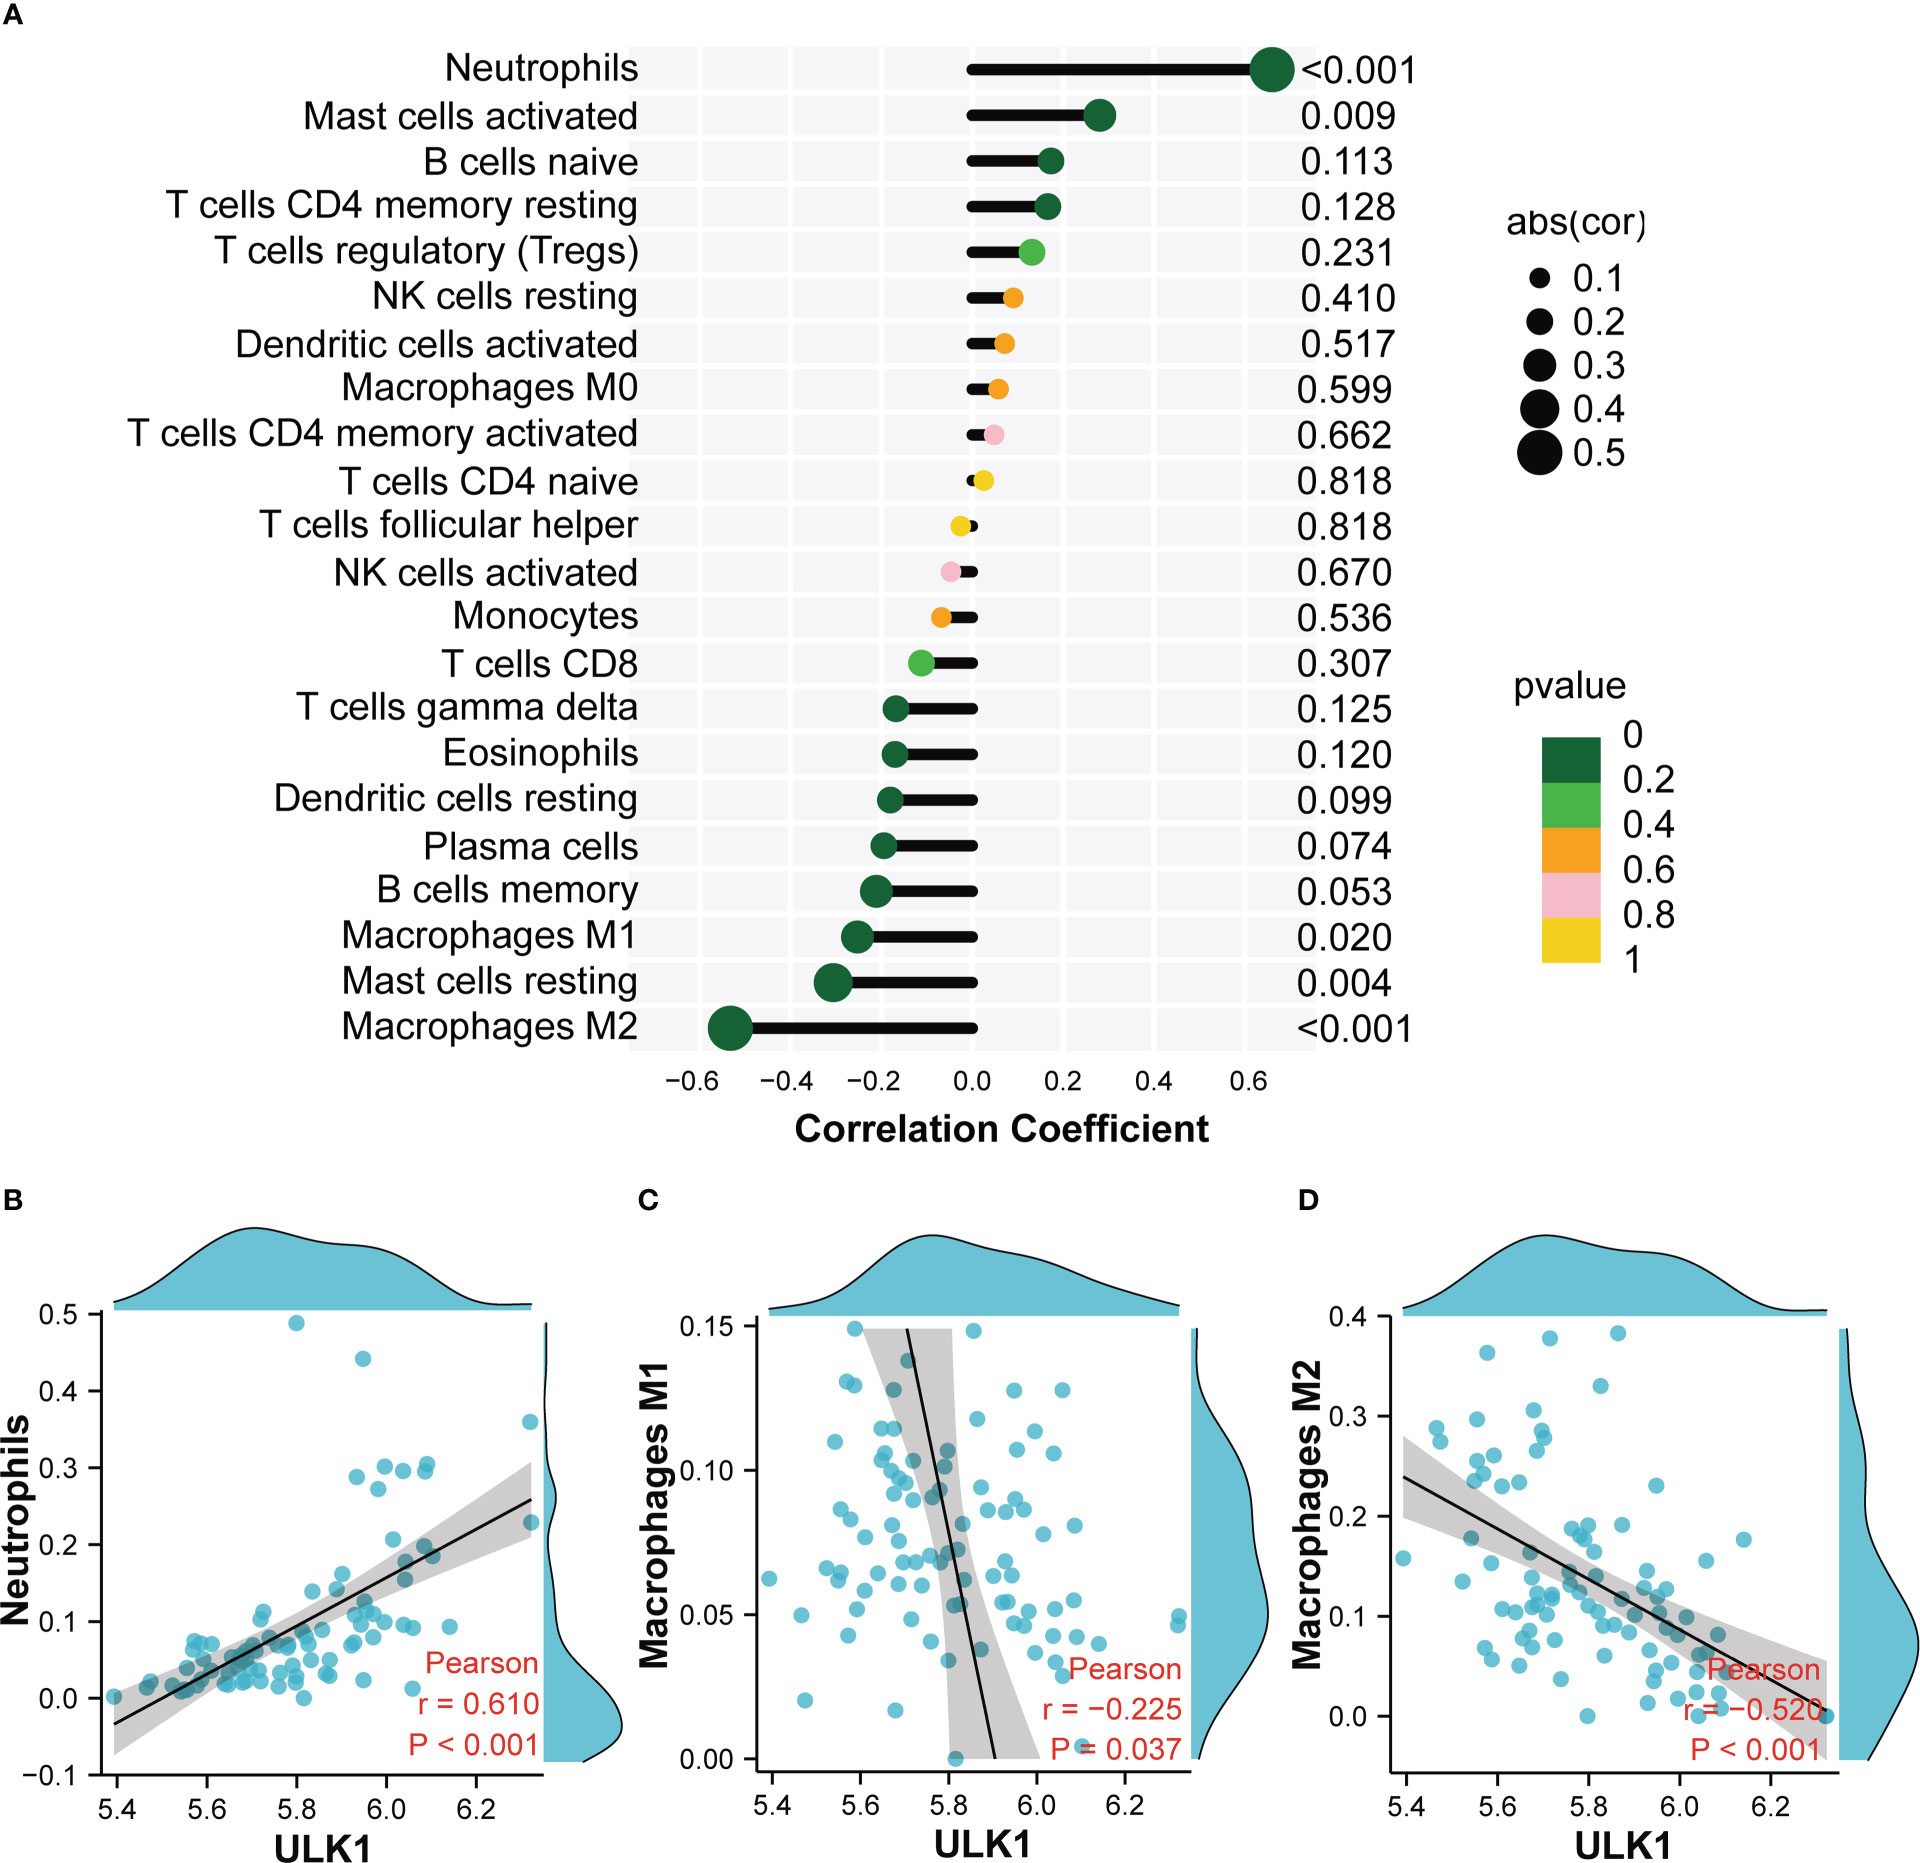
Figure 9 Correlation analysis between ULK1 and infiltrating immune cells. (A) Correlation Analysis diagram showing the correlation between ULK1 and Infiltrating Immune Cells. (B) Scatter diagram indicating the correlation between ULK1 expression and Neutrophils. (C) Scatter diagram indicating the correlation between ULK1 expression and Macrophages M1. (D) Scatter diagram indicating the correlation between ULK1 expression and Macrophages M2. Correlation analysis was assessed using Pearson correlation.
3.8. Clinical correlation of ULK1 with renal function
To further confirm the role of MRGs in DN, correlation analysis between ULK1 and GFR was performed with the Nephroseq database (Figure 10). ULK1 was positively related to GFR, revealing that ULK1 may exert a protective effect against DN.
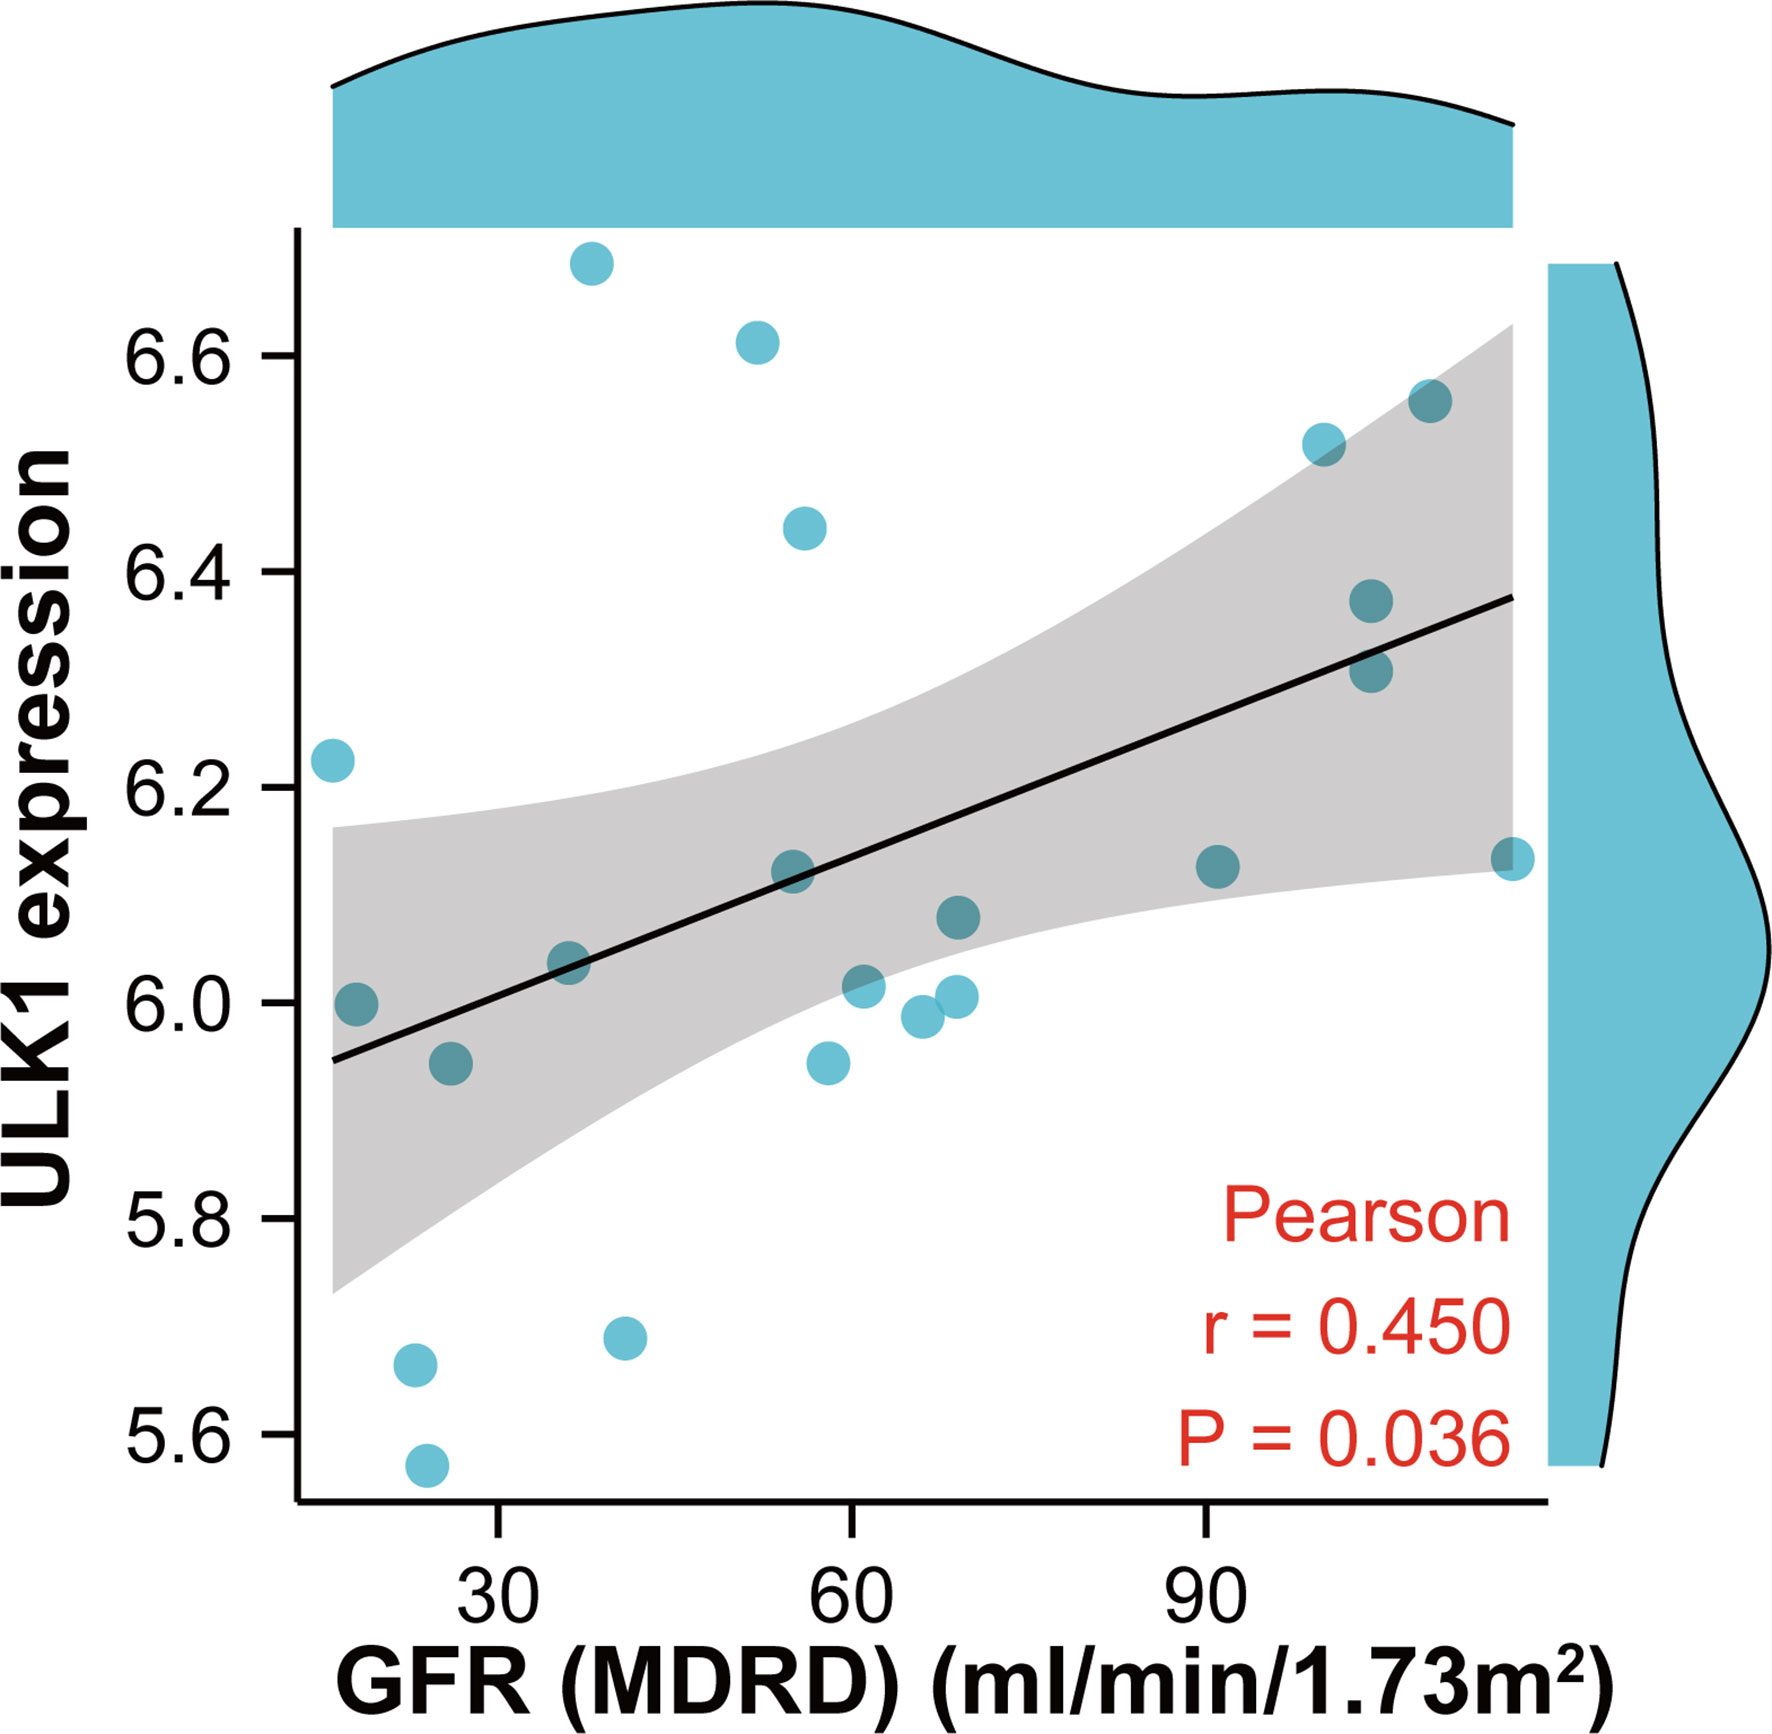
Figure 10 Scatter diagram indicating the relationship between ULK1 expression and renal function (glomerular filtration rate). Correlation analysis was assessed using Pearson correlation.
4. Discussion
Diabetic nephropathy is a severe clinical syndrome but lacks specific clinical manifestations. Current diagnostic criteria for DN includes serum creatinine levels, estimated GFR, microalbuminuria, and urinary microalbumin to creatinine ratio. Despite this, these methods are not yet capable of delivering comprehensive diagnoses. Thus, it is essential to explore potential biomarkers with high specificity and sensitivity of DN from multiple perspectives.
Numerous studies suggested that dysregulation of mitophagy promotes the progression of DN. Disorders of mitophagy affect the morphology and function of multiple cells in renal tissue, resulting in decreased glomerular filtration rate, increased proteinuria, glomerulosclerosis, and renal interstitial fibrosis (35, 36). Several cancer-related studies had been performed to explore mitophagy-related genes. For instance, Zhuo et al. constructed a signature of MRGs as a new prognostic model to predict the survival of pancreatic cancer patients (37). Another recent study analyzed the prognostic value and clinical significance of MRGs in hepatocellular carcinoma (38). However, the bioinformatic analysis of MRGs in DN, to our knowledge, has not yet been explored until now.
In this study, we firstly identified 12 MRGs in healthy samples and DN samples through GEO database analysis. GO and KEGG analysis demonstrated that there were several enrichment terms related to autophagy and mitophagy, suggesting that 12 MRGs are actively involved in the process of mitophagy and may be critical for the development of DN. To screen potential diagnostic biomarkers for DN, we performed three different algorithms (SVM-RFE, LASSO and RF) on the above 12 DEGs and identified three genes ULK1, PARK2 and MFN1 as potential candidate genes. As a key regulator of autophagy, ULK1 participated in various related metabolic activities of cells. A large body of evidence has indicated that the abnormal expression of ULK1 is involved in multiple human organ diseases, including neurological diseases, infections, cardiovascular diseases, cancer, and liver diseases (39). PARK2 encodes Parkin, which is involved in mitochondrial fusion, fission and mitophagy. Parkin is widely expressed in brain, kidney, heart, and other tissues/organs. However, the expression of Parkin is significantly decreased in multiple diabetes-related target organ damages (40). MFN1 and MFN2 are the main fusion proteins of mitochondrial outer membrane. Mutations of MFN1 and MFN2 are related to the development of neurological diseases, obesity, and vascular diseases (41). In the training sets, the expression of ULK1 and PARK2 was markedly down-regulated in DN samples compared with healthy samples, while the expression of MFN1 was markedly up-regulated. Furthermore, the ROC curves confirmed their robust ability to screen DN samples from normal samples. However, the analysis of the validation set demonstrated that only ULK1 but not PARK2 or MFN1 had a significant difference in the expression between healthy and DN samples, indicating that ULK1 may be a reliable biomarker for DN.
As the main regulator of initiating general autophagy and mitophagy, ULK1 is strictly regulated by AMPK and MTOR, which are key energy-sensing kinases. AMPK activates ULK1 by phosphorylation of Ser317 and Ser777, while MTOR prevents ULK1 activation by phosphorylating ULK1 in Ser757 (42). The AMPK/ULK1 axis plays a vital role in promoting mitophagy (43, 44). Moreover, ULK1 can directly phosphorylate mitophagy receptors such as FUNDC1, BNIP3, NIX, BCL2L13, and VCP/p97 (45–47). Previous study shows that the mitochondrial outer membrane E3 ligase MUL1 can ubiquitinate ULK1 and regulate selenite-induced mitophagy (48). As a serine/threonine kinase, ULK1 not only participates in the initiation of autophagy (49), but also regulates the maturation of autophagosomes (50) by promoting both ATG5-ATG7-dependent and -independent autophagy pathways (51). Impaired autophagy is involved in the pathophysiology of DN, which increases ROS formation, induces renal cell damage and apoptosis, and mediates inflammatory responses and fibrosis (52). In this study, we found that the expression of ULK1 in both glomeruli and tubulointerstitium tissues was significantly down-regulated, and further demonstrated that ULK1 has excellent diagnostic performances (AUC > 0.89). The expression of ULK1 has been previously reported to be significantly decreased in the kidneys of DN patients (53), and in our study, it was positively related to GFR in patients with DN. This is consistent with the view that mitophagy plays a protective role in DN kidneys (15, 54, 55).
Mitophagy restricts the secretion of inflammatory cytokines and directly regulates mitochondrial antigen presentation and immune cell homeostasis (56, 57). Furthermore, mitophagy can protect cells from inflammation by regulating the adaptive immune response of dendritic cell-T cell synapses, CD8 T cells, and memory NK cells (58, 59). The results of immune infiltration analysis indicated that the expression of ULK1 was positively related to neutrophils and activated mast cells, whereas it was negatively related to M2 macrophages, M1 macrophages and resting mast cells. It has been reported that mast cells were involved in renal interstitial fibrosis and were closely associated with serum creatinine level in DN (60). Deposition of macrophages has been found in the kidney tissue of DN, indicating decreased renal function in DN patients (61). It is generally accepted that M1 macrophages are mainly pro-inflammatory while M2 macrophages are mainly anti-inflammatory (62). In fact, a previous study showed that both M1 and M2 macrophages had higher infiltration in diabetic nephropathy subjects than healthy subjects (63), which is consistent with our results. As DN progresses, macrophages may undergo a phenotype shift with a change from a classically activated M1 to an alternatively activated M2. Furthermore, studies have also showed that mitophagy can reduce inflammation and fibrosis in DN by regulating the phenotype of M1/M2 macrophages (64). In summary, infiltrating immune cells participate in the occurrence and development of DN, and the abnormal immune status may be improved by targeting ULK1 in the future.
In our study, the MRGs were obtained from the Reactome database, which is an emerging database and has been widely used in several studies (65–69). However, it did not include some mitophagy receptors such as BNIP3, p62, OPTN and so on. Thus, merging the Reactome database and other database such as KEGG together, might be a better method to obtain more comprehensive MRGs in the future study. Additionally, the lack of experimental validation of the samples is a limitation of our study. The sample numbers from two datasets in this study is limited and it is necessary to select more datasets and confirm our results in a larger DN cohort.
5. Conclusions
Our study indicates that the mitophagy-related gene ULK1 may be a valuable biomarker in the diagnosis of DN. We also demonstrate the potential association of ULK1 and infiltrating immune cells, suggesting its important role in the development of DN, thereby providing a new insight into the prevention and treatment of DN.
Data availability statement
The original contributions presented in the study are included in the article/Supplementary Material. Further inquiries can be directed to the corresponding authors.
Ethics statement
Ethical review and approval was not required for the study involving human participants data from other published articles or databases, in accordance with the local legislation and institutional requirements.
Author contributions
PW and Z-SL concepted and designed the experiments, revised and approved the final manuscript. Y-YY performed the experiments and collected the data, analyzed and interpreted the data, and draft the manuscript. Z-XG, Z-HM and D-WL provided critical comments and revised the manuscript. All authors contributed to the article and approved the submitted version.
Funding
This work was supported by grants from the National Natural Science Foundation of China (No. 31971065、No. 81900651、No. 81970633), Natural Science Foundation of Henan Province (No. 222300420089) and Talents Project of Health Science and Technology Innovation for Young and Middle-aged Investigators in Henan Province (YXKC2020038).
Acknowledgments
The authors thank the contributors to the GEO database for sharing data.
Conflict of interest
The authors declare that the research was conducted in the absence of any commercial or financial relationships that could be construed as a potential conflict of interest.
Publisher’s note
All claims expressed in this article are solely those of the authors and do not necessarily represent those of their affiliated organizations, or those of the publisher, the editors and the reviewers. Any product that may be evaluated in this article, or claim that may be made by its manufacturer, is not guaranteed or endorsed by the publisher.
Abbreviations
AUROC, Area under the receiver operating characteristic curve; BNIP3, BCL2 interacting protein 3; BP, Biological process; CC, Cellular component; CI, Confidence interval; DE-MRGs, Differentially expressed mitophagy-related genes; DN, Diabetic nephropathy; FoxO1, Forkhead-box class O1; FUNDC1, FUN14 domain-containing protein1; GEO, Gene expression omnibus; GFR, Glomerular filtration rate; GO, Gene ontology; KEGG, Kyoto encyclopedia of genes and genomes; LASSO, Least absolute shrinkage and selection operator; MF, Molecular function; MFN1, Mitofusin 1; MFN2, Mitofusin 2; MitoQ, Mitochondrial antioxidant; MRGs, Mitophagy-related genes; NPV, Negative predictive value; PARK2, RBR E3 ubiquitin protein ligase gene; PCA, Principal component analysis; PPV, Positive predictive value; RF, Random forest; ROC, Receiver operating characteristic; SD, Standard deviation; SVM-RFE, Support vector machine-recursive feature elimination; ULK1, Unc-51 like autophagy activating kinase 1.
References
2. Zimmet P, Alberti KG, Shaw J. Global and societal implications of the diabetes epidemic. Nature (2001) 414:782–7. doi: 10.1038/414782a
3. Alicic RZ, Rooney MT, Tuttle KR. Diabetic kidney disease: Challenges, progress, and possibilities. Clin J Am Soc Nephrol (2017) 12:2032–45. doi: 10.2215/CJN.11491116
4. Perez-Morales RE, Del Pino MD, Valdivielso JM, Ortiz A, Mora-Fernandez C, Navarro-Gonzalez JF. Inflammation in diabetic kidney disease. Nephron (2019) 143:12–6. doi: 10.1159/000493278
5. Kim I, Rodriguez-Enriquez S, Lemasters JJ. Selective degradation of mitochondria by mitophagy. Arch Biochem Biophys (2007) 462:245–53. doi: 10.1016/j.abb.2007.03.034
6. Trefts E, Shaw RJ. AMPK: restoring metabolic homeostasis over space and time. Mol Cell (2021) 81:3677–90. doi: 10.1016/j.molcel.2021.08.015
7. Dorn GW 2nd. Parkin-dependent mitophagy in the heart. J Mol Cell Cardiol (2016) 95:42–9. doi: 10.1016/j.yjmcc.2015.11.023
8. Agarwal S, Muqit MMK. PTEN-induced kinase 1 (PINK1) and parkin: Unlocking a mitochondrial quality control pathway linked to parkinson's disease. Curr Opin Neurobiol (2022) 72:111–19. doi: 10.1016/j.conb.2021.09.005
9. Geisler S, Holmstrom KM, Treis A, Skujat D, Weber SS, Fiesel FC, et al. The PINK1/Parkin-mediated mitophagy is compromised by PD-associated mutations. Autophagy (2010) 6:871–8. doi: 10.4161/auto.6.7.13286
10. Abeliovich A. Parkinson's disease: Mitochondrial damage control. Nature (2010) 463:744–5. doi: 10.1038/463744a
11. Liu L, Sakakibara K, Chen Q, Okamoto K. Receptor-mediated mitophagy in yeast and mammalian systems. Cell Res (2014) 24:787–95. doi: 10.1038/cr.2014.75
12. Li Y, Zheng W, Lu Y, Zheng Y, Pan L, Wu X, et al. BNIP3L/NIX-mediated mitophagy: Molecular mechanisms and implications for human disease. Cell Death Dis (2021) 13:14. doi: 10.1038/s41419-021-04469-y
13. Liu H, Zang C, Yuan F, Ju C, Shang M, Ning J, et al. The role of FUNDC1 in mitophagy, mitochondrial dynamics and human diseases. Biochem Pharmacol (2022) 197:114891. doi: 10.1016/j.bcp.2021.114891
14. McWilliams TG, Prescott AR, Allen GF, Tamjar J, Munson MJ, Thomson C, et al. Mito-QC illuminates mitophagy and mitochondrial architecture in vivo. J Cell Biol (2016) 214:333–45. doi: 10.1083/jcb.201603039
15. Xiao L, Xu X, Zhang F, Wang M, Xu Y, Tang D, et al. The mitochondria-targeted antioxidant MitoQ ameliorated tubular injury mediated by mitophagy in diabetic kidney disease via Nrf2/PINK1. Redox Biol (2017) 11:297–311. doi: 10.1016/j.redox.2016.12.022
16. Li W, Du M, Wang Q, Ma X, Wu L, Guo F, et al. FoxO1 promotes mitophagy in the podocytes of diabetic Male mice via the PINK1/Parkin pathway. Endocrinology (2017) 158:2155–67. doi: 10.1210/en.2016-1970
17. Barrett T, Wilhite SE, Ledoux P, Evangelista C, Kim IF, Tomashevsky M, et al. NCBI GEO: archive for functional genomics data sets–update. Nucleic Acids Res (2013) 41:D991–5. doi: 10.1093/nar/gks1193
18. Grayson PC, Eddy S, Taroni JN, Lightfoot YL, Mariani L, Parikh H, et al. Metabolic pathways and immunometabolism in rare kidney diseases. Ann Rheum Dis (2018) 77:1226–33. doi: 10.1136/annrheumdis-2017-212935
19. Shi JS, Qiu DD, Le WB, Wang H, Li S, Lu YH, et al. Identification of transcription regulatory relationships in diabetic nephropathy. Chin Med J (Engl) (2018) 131:2886–90. doi: 10.4103/0366-6999.246063
20. Pan Y, Jiang S, Hou Q, Qiu D, Shi J, Wang L, et al. Dissection of glomerular transcriptional profile in patients with diabetic nephropathy: SRGAP2a protects podocyte structure and function. Diabetes (2018) 67:717–30. doi: 10.2337/db17-0755
21. Ju W, Greene CS, Eichinger F, Nair V, Hodgin JB, Bitzer M, et al. Defining cell-type specificity at the transcriptional level in human disease. Genome Res (2013) 23:1862–73. doi: 10.1101/gr.155697.113
22. Woroniecka KI, Park AS, Mohtat D, Thomas DB, Pullman JM, Susztak K. Transcriptome analysis of human diabetic kidney disease. Diabetes (2011) 60:2354–69. doi: 10.2337/db10-1181
23. Irizarry RA, Hobbs B, Collin F, Beazer-Barclay YD, Antonellis KJ, Scherf U, et al. Exploration, normalization, and summaries of high density oligonucleotide array probe level data. Biostatistics (2003) 4:249–64. doi: 10.1093/biostatistics/4.2.249
24. Leek JT, Johnson WE, Parker HS, Jaffe AE, Storey JD. The sva package for removing batch effects and other unwanted variation in high-throughput experiments. Bioinformatics (2012) 28:882–3. doi: 10.1093/bioinformatics/bts034
25. Ritchie ME, Phipson B, Wu D, Hu Y, Law CW, Shi W, et al. Limma powers differential expression analyses for RNA-sequencing and microarray studies. Nucleic Acids Res (2015) 43:e47. doi: 10.1093/nar/gkv007
26. Wu T, Hu E, Xu S, Chen M, Guo P, Dai Z, et al. clusterProfiler 4.0: A universal enrichment tool for interpreting omics data. Innovation (Camb) (2021) 2:100141. doi: 10.1016/j.xinn.2021.100141
27. Ashburner M, Ball CA, Blake JA, Botstein D, Butler H, Cherry JM, et al. Gene ontology: tool for the unification of biology. The gene ontology consortium. Nat Genet (2000) 25:25–9. doi: 10.1038/75556
28. Kanehisa M, Goto S. KEGG: kyoto encyclopedia of genes and genomes. Nucleic Acids Res (2000) 28:27–30. doi: 10.1093/nar/28.1.27
29. Sundermann B, Bode J, Lueken U, Westphal D, Gerlach AL, Straube B, et al. Support vector machine analysis of functional magnetic resonance imaging of interoception does not reliably predict individual outcomes of cognitive behavioral therapy in panic disorder with agoraphobia. Front Psychiatry (2017) 8:99. doi: 10.3389/fpsyt.2017.00099
30. Zhao E, Xie H, Zhang Y. Predicting diagnostic gene biomarkers associated with immune infiltration in patients with acute myocardial infarction. Front Cardiovasc Med (2020) 7:586871. doi: 10.3389/fcvm.2020.586871
31. Engebretsen S, Bohlin J. Statistical predictions with glmnet. Clin Epigenet (2019) 11:123. doi: 10.1186/s13148-019-0730-1
32. Garge NR, Bobashev G, Eggleston B. Random forest methodology for model-based recursive partitioning: the mobForest package for r. BMC Bioinf (2013) 14:125. doi: 10.1186/1471-2105-14-125
33. Robin X, Turck N, Hainard A, Tiberti N, Lisacek F, Sanchez JC, et al. pROC: an open-source package for r and s+ to analyze and compare ROC curves. BMC Bioinf (2011) 12:77. doi: 10.1186/1471-2105-12-77
34. Newman AM, Liu CL, Green MR, Gentles AJ, Feng W, Xu Y, et al. Robust enumeration of cell subsets from tissue expression profiles. Nat Methods (2015) 12:453–7. doi: 10.1038/nmeth.3337
35. Wang Q, Ren D, Li Y, Xu G. Klotho attenuates diabetic nephropathy in db/db mice and ameliorates high glucose-induced injury of human renal glomerular endothelial cells. Cell Cycle (2019) 18:696–707. doi: 10.1080/15384101.2019.1580495
36. Xu L, Fan Q, Wang X, Zhao X, Wang L. Inhibition of autophagy increased AGE/ROS-mediated apoptosis in mesangial cells. Cell Death Dis (2016) 7:e2445. doi: 10.1038/cddis.2016.322
37. Zhuo Z, Lin H, Liang J, Ma P, Li J, Huang L, et al. Mitophagy-related gene signature for prediction prognosis, immune scenery, mutation, and chemotherapy response in pancreatic cancer. Front Cell Dev Biol (2021) 9:802528. doi: 10.3389/fcell.2021.802528
38. Xu W, Zhao D, Huang X, Zhang M, Yin M, Liu L, et al. The prognostic value and clinical significance of mitophagy-related genes in hepatocellular carcinoma. Front Genet (2022) 13:917584. doi: 10.3389/fgene.2022.917584
39. Rong Z, Zheng K, Chen J, Jin X. Function and regulation of ULK1: From physiology to pathology. Gene (2022) 840:146772. doi: 10.1016/j.gene.2022.146772
40. Hochegger K, Koppelstaetter C, Tagwerker A, Huber JM, Heininger D, Mayer G, et al. p21 and mTERT are novel markers for determining different ischemic time periods in renal ischemia-reperfusion injury. Am J Physiol Renal Physiol (2007) 292:F762–8. doi: 10.1152/ajprenal.00084.2006
41. Cao YL, Meng S, Chen Y, Feng JX, Gu DD, Yu B, et al. MFN1 structures reveal nucleotide-triggered dimerization critical for mitochondrial fusion. Nature (2017) 542:372–76. doi: 10.1038/nature21077
42. Kim J, Kundu M, Viollet B, Guan KL. AMPK and mTOR regulate autophagy through direct phosphorylation of Ulk1. Nat Cell Biol (2011) 13:132–41. doi: 10.1038/ncb2152
43. Tian W, Li W, Chen Y, Yan Z, Huang X, Zhuang H, et al. Phosphorylation of ULK1 by AMPK regulates translocation of ULK1 to mitochondria and mitophagy. FEBS Lett (2015) 589:1847–54. doi: 10.1016/j.febslet.2015.05.020
44. Liang J, Xu ZX, Ding Z, Lu Y, Yu Q, Werle KD, et al. Myristoylation confers noncanonical AMPK functions in autophagy selectivity and mitochondrial surveillance. Nat Commun (2015) 6:7926. doi: 10.1038/ncomms8926
45. Wu W, Tian W, Hu Z, Chen G, Huang L, Li W, et al. ULK1 translocates to mitochondria and phosphorylates FUNDC1 to regulate mitophagy. EMBO Rep (2014) 15:566–75. doi: 10.1002/embr.201438501
46. Poole LP, Bock-Hughes A, Berardi DE, Macleod KF. ULK1 promotes mitophagy via phosphorylation and stabilization of BNIP3. Sci Rep (2021) 11:20526. doi: 10.1038/s41598-021-00170-4
47. Murakawa T, Okamoto K, Omiya S, Taneike M, Yamaguchi O. Otsu k. a mammalian mitophagy receptor, Bcl2-L-13, recruits the ULK1 complex to induce mitophagy. Cell Rep (2019) 26:338–45.e6. doi: 10.1016/j.celrep.2018.12.050
48. Li J, Qi W, Chen G, Feng D, Liu J, Ma B, et al. Mitochondrial outer-membrane E3 ligase MUL1 ubiquitinates ULK1 and regulates selenite-induced mitophagy. Autophagy (2015) 11:1216–29. doi: 10.1080/15548627.2015.1017180
49. Wong PM, Puente C, Ganley IG, Jiang X. The ULK1 complex: sensing nutrient signals for autophagy activation. Autophagy (2013) 9:124–37. doi: 10.4161/auto.23323
50. Lane JD, Korolchuk VI, Murray JT. Signalling mechanisms in autophagy: an introduction to the issue. Essays Biochem (2017) 61:561–63. doi: 10.1042/EBC20170116
51. Nishida Y, Arakawa S, Fujitani K, Yamaguchi H, Mizuta T, Kanaseki T, et al. Discovery of Atg5/Atg7-independent alternative macroautophagy. Nature (2009) 461:654–8. doi: 10.1038/nature08455
52. Gonzalez CD, Carro Negueruela MP, Nicora Santamarina C, Resnik R, Vaccaro MI. Autophagy dysregulation in diabetic kidney disease: From pathophysiology to pharmacological interventions. Cells (2021) 10(9):2497. doi: 10.3390/cells10092497
53. Ma Z, Li L, Livingston MJ, Zhang D, Mi Q, Zhang M, et al. p53/microRNA-214/ULK1 axis impairs renal tubular autophagy in diabetic kidney disease. J Clin Invest (2020) 130:5011–26. doi: 10.1172/JCI135536
54. Zhao C, Chen Z, Xu X, An X, Duan S, Huang Z, et al. Pink1/Parkin-mediated mitophagy play a protective role in cisplatin induced renal tubular epithelial cells injury. Exp Cell Res (2017) 350:390–97. doi: 10.1016/j.yexcr.2016.12.015
55. Yang YY, Gong DJ, Zhang JJ, Liu XH, Wang L. Diabetes aggravates renal ischemia-reperfusion injury by repressing mitochondrial function and PINK1/Parkin-mediated mitophagy. Am J Physiol Renal Physiol (2019) 317(4):F852–64. doi: 10.1152/ajprenal.00181.2019
56. Xu Y, Shen J, Ran Z. Emerging views of mitophagy in immunity and autoimmune diseases. Autophagy (2020) 16:3–17. doi: 10.1080/15548627.2019.1603547
57. Song Y, Zhou Y, Zhou X. The role of mitophagy in innate immune responses triggered by mitochondrial stress. Cell Commun Signal (2020) 18:186. doi: 10.1186/s12964-020-00659-x
58. O'Sullivan TE, Johnson LR, Kang HH, Sun JC. BNIP3- and BNIP3L-mediated mitophagy promotes the generation of natural killer cell memory. Immunity (2015) 43:331–42. doi: 10.1016/j.immuni.2015.07.012
59. Moossavi M, Parsamanesh N, Bahrami A, Atkin SL, Sahebkar A. Role of the NLRP3 inflammasome in cancer. Mol Cancer (2018) 17:158. doi: 10.1186/s12943-018-0900-3
60. Okon K, Stachura J. Increased mast cell density in renal interstitium is correlated with relative interstitial volume, serum creatinine and urea especially in diabetic nephropathy but also in primary glomerulonephritis. Pol J Pathol (2007) 58:193–7.
61. Nguyen D, Ping F, Mu W, Hill P, Atkins RC, Chadban SJ. Macrophage accumulation in human progressive diabetic nephropathy. Nephrol (Carlton) (2006) 11:226–31. doi: 10.1111/j.1440-1797.2006.00576.x
62. Yunna C, Mengru H, Lei W, Weidong C. Macrophage M1/M2 polarization. Eur J Pharmacol (2020) 877:173090. doi: 10.1016/j.ejphar.2020.173090
63. Zhang X, Yang Y, Zhao Y. Macrophage phenotype and its relationship with renal function in human diabetic nephropathy. PLoS One (2019) 14:e0221991. doi: 10.1371/journal.pone.0221991
64. Zhao Y, Guo Y, Jiang Y, Zhu X, Liu Y, Zhang X. Mitophagy regulates macrophage phenotype in diabetic nephropathy rats. Biochem Biophys Res Commun (2017) 494:42–50. doi: 10.1016/j.bbrc.2017.10.088
65. Sasamoto N, Stewart PA, Wang T, Yoder SJ, Chellappan S, Hecht JL, et al. Lifetime ovulatory years and ovarian cancer gene expression profiles. J Ovarian Res (2022) 15:59. doi: 10.1186/s13048-022-00995-1
66. Lin C, Xu JQ, Zhong GC, Chen H, Xue HM, Yang M, et al. Integrating RNA-seq and scRNA-seq to explore the biological significance of NAD + metabolism-related genes in the initial diagnosis and relapse of childhood b-cell acute lymphoblastic leukemia. Front Immunol (2022) 13:1043111. doi: 10.3389/fimmu.2022.1043111
67. Chua S, Cui J, Engelberg D, Lim LHK. A review and meta-analysis of influenza interactome studies. Front Microbiol (2022) 13:869406. doi: 10.3389/fmicb.2022.869406
68. Chen H, Zhang J, Sun X, Wang Y, Qian Y. Mitophagy-mediated molecular subtypes depict the hallmarks of the tumour metabolism and guide precision chemotherapy in pancreatic adenocarcinoma. Front Cell Dev Biol (2022) 10:901207. doi: 10.3389/fcell.2022.901207
Keywords: mitophagy, diabetic nephropathy, ULK1, biomarker, mitophagy-related genes
Citation: Yang Y-Y, Gao Z-X, Mao Z-H, Liu D-W, Liu Z-S and Wu P (2023) Identification of ULK1 as a novel mitophagy-related gene in diabetic nephropathy. Front. Endocrinol. 13:1079465. doi: 10.3389/fendo.2022.1079465
Received: 25 October 2022; Accepted: 28 December 2022;
Published: 18 January 2023.
Edited by:
Quan Hong, Chinese PLA General Hospital, ChinaReviewed by:
Hewang Lee, George Washington University, United StatesYonghong Shi, Hebei Medical University, China
Copyright © 2023 Yang, Gao, Mao, Liu, Liu and Wu. This is an open-access article distributed under the terms of the Creative Commons Attribution License (CC BY). The use, distribution or reproduction in other forums is permitted, provided the original author(s) and the copyright owner(s) are credited and that the original publication in this journal is cited, in accordance with accepted academic practice. No use, distribution or reproduction is permitted which does not comply with these terms.
*Correspondence: Peng Wu, wupengcg@zzu.edu.cn; Zhang-Suo Liu, zhangsuoliu@zzu.edu.cn