Role of Biochar in Anaerobic Digestion Based Biorefinery for Food Waste
 Carol W. Wambugu
 Eldon R. Rene
 Jack van de Vossenberg
 Capucine Dupont
  Eric D. van Hullebusch
- Department of Environmental Engineering and Water Technology, UNESCO-IHE Institute for Water Education, Delft, Netherlands
The effect of biochar addition on the anaerobic digestion (AD) of food waste was evaluated. From the five biochars tested, Fe, Co, Ni, and Mn were leached in very small quantities (<10 mg/kg), while a high amount of K (1,510 and 1,969 mg/kg) was leached from treated waste wood and willow tree pyrochar, respectively. AD batch experiments were performed at an inoculum:substrate ratio of 1:1, at 30°C and under agitating conditions. The results showed that the biogas volume produced by the treatments with the brewery residue hydrochar and treated waste wood pyrochar was lower than the amount of biogas produced by the control with only food waste. The food waste supplemented with 1.5 mL of trace elements yielded the highest biogas of 588 mL/g COD (CH4 content−48%). Furthermore, two identical upflow anaerobic sludge blanket (UASB) reactors, i.e., control reactor and biochar amended reactor, were operated at 30°C, at organic loading rates (OLR) varying from 3.4 to 7.8 g COD/L.day. The average COD removal efficiencies of the control and the biochar-amended reactor were 47 and 77% at an OLR of 6.9–7.8 g COD/L.day, respectively. These study results clearly indicate that the type of biochar and trace elements concentration in biochar play a key role in determining the effectiveness of the biochar in enhancing biogas production from food waste.
Introduction
Food waste accounts for about 32–62% of the municipal solid waste (MSW) fraction and is expected to increase due to the increasing population and urbanization around the world (Xu et al., 2018). Food waste generation is higher in developed countries, e.g., 98 million tons per annum in the European Union (EU) countries (Xu et al., 2018) and about 43.6 million tons of food is reported to have been thrown away in the U.S.A (Zhang et al., 2007). The methods commonly used for food waste disposal include incineration, landfilling and aerobic composting (Zhang et al., 2014). However, landfilling has been banned in most of the developed countries, leaving incineration as the preferred method. Incineration is energy intensive (Zhang et al., 2014) and an expensive technology to implement, especially in developing countries, incineration possesses environmental risks such as air pollution. Incineration of food waste is also not favorable because food waste contains high level of water.
In contrast, AD is emerging as a most efficient technology for food waste treatment and disposal. The high amount of the organic food waste fraction in MSW presents sufficient raw material for the AD process, which does not only remove the waste from the environment but is a promising source of renewable energy as well (Meyer-Kohlstock et al., 2016; Xu et al., 2018). The biogas produced from AD consists of about 65–70% methane (CH4) and 35–40% carbon dioxide (CO2) (Xu et al., 2018), which can be converted into a compressed natural gas (CNG), and electric energy. However, the AD process is quite sensitive to disturbance due to the presence of a variety of microorganisms that are involved in the four distinct stages such as hydrolysis, acidogenesis, acetogenesis, and methanogenesis (Fagbohungbe et al., 2017).
The first step is the hydrolysis, where the macromolecules (proteins, fats, and carbohydrates) are broken down into smaller molecules (peptides, fatty acids, and saccharides). It is catalyzed by exo-enzymes called hydrolyses produced by the fermentative bacteria, as shown in Equation (1) (Kondusamy and Kalamdhad, 2014). Example of these bacteria include Bacterioides succinogenes and Clostridium thermocellum.
The second step is acidogenesis, where the smaller molecules are converted into volatile fatty acids (VFA) such as propionic, acetic and butyric acid, and other by-product gases like ammonia, carbon dioxide, hydrogen sulfide, alcohols, and aldehydes by acidogenic bacteria (Clostridium butyricum) as shown in Equation (2) (Kondusamy and Kalamdhad, 2014; Zhang et al., 2014).
The third and fourth steps, i.e., the acetogenesis and methanogenesis, involve the conversion of acetic acid into acetate, which is then converted into carbon dioxide and methane (Equation 3) by acetoclastic methanogens such as Methanosarcina and Methanosaeta. The hydrogenotrophic methanogens also produce CH4 by using CO2 as a carbon source and hydrogen as a reducing agent (Equation 4) (Kondusamy and Kalamdhad, 2014; Lü et al., 2016).
Long-term AD of food waste is characterized by poor stability due to accumulation of volatile fatty acids (VFA), which is mostly caused by the deficiency of essential trace elements such as manganese (Mn), cobalt (Co), nickel (Ni), zinc (Zn), and iron (Fe) (Zhang and Jahng, 2012). Trace elements are very important in the methanogenesis step of AD that involves the action of acetyl-CoA synthase and methyl coenzyme M reductase to catalyze key metabolic steps and require sufficient amount of Fe, Ni, and Co (van Hullebusch et al., 2016), while some methanogens may require molybdenum (Mo), tungsten (W), copper (Cu), and selenium (Se) (Molaey et al., 2018). The inefficiency of the methanogenesis step leads to low CH4 production. AD metabolic by-products like ammonia (NH3) also inhibit the methanogenesis step. Several solutions have been provided to improve the long-term stability of the AD process. These include, (i) co-digestion with other substrates such as cattle manure and sewage sludge (Xu et al., 2018) due to their high buffering capacity, (ii) addition of trace elements (Banks et al., 2012), and (iii) multi-digestion steps to separate the acidogenic and methanogenic phase of AD. One of the emerging trends in AD is the use of biochar as an additive for enhanced biogas production. A few researchers have reported that biochar can help to alleviate this effect when used as an additive in AD (Mumme et al., 2014; Lü et al., 2016; Wang et al., 2017).
Biochar is a carbon-rich compound that is produced through thermochemical decomposition of biomass in the absence of oxygen (Cha et al., 2016). It is produced through different processes such as pyrolysis (300–700°C; N2; atmospheric pressure) and hydrothermal carbonization (170–250°C; water above saturated pressure) (Cha et al., 2016). The energy required for biochar production varies depending on the type of biomass used. For wood biomass used in the present study, approximately 160 MJ would be utilized for an effective pyrolysis process as illustrated in Figure 1 (Joseph et al., 2018).
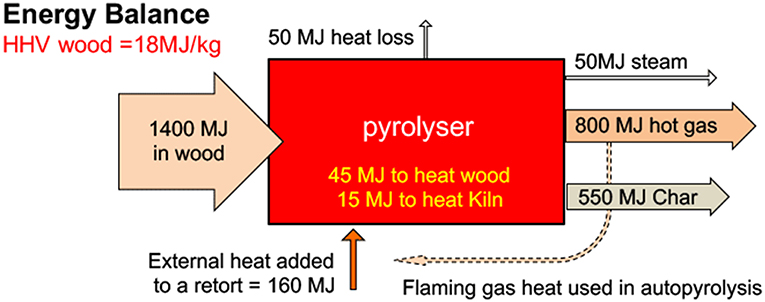
Figure 1. Energy balance for biochar production from wood biomass. HHV is the higher heating value, a measure of energy content, including the latent heat of vaporization of water in the biomass (adapted from Joseph et al., 2018).
Recent studies have shown that the addition of biochar in AD of food waste increased the biogas yield (Fagbohungbe et al., 2016; Meyer-Kohlstock et al., 2016; Sunyoto et al., 2016; Wang et al., 2017). Sunyoto et al. (2016) added pine sawdust biochar (produced at 650°C) to AD of aqueous carbohydrate food waste made from white bread and observed increased CH4 production by 41.6%. The addition of 8.3 g/L biochar to the food waste produced higher methane (from 55 to 78%), while 33.3 g/L biochar addition resulted in the lowest yield. It is hypothesized that the biochar creates a surface area for colonization by the microbial flora in the AD and acts as an adsorbent for compounds such as limonene (Fagbohungbe et al., 2016) and ammonia (Lü et al., 2016), that would otherwise inhibit the performance of the AD. Wang et al. (2017) added vermicompost based biochar (500°C) to mixed kitchen waste and observed that the biochar acted as a buffer and increased CH4 production due to 15–20% (w/w) biochar addition. Meyer-Kohlstock et al. (2016) added Holm oak residue biochar (produced at 650°C) to municipal bio-waste and observed an increase of CH4 production per organic dry matter (ODM) by 5% (257–272 NL/kgODM) due to 5% (w/w) biochar addition and 3% (252–267 NL/kgODM) due to 10% (w/w) biochar addition.
Recent studies have been carried out to evaluate the role of trace elements and biochar in the AD of food waste, independently, mostly in single-stage anaerobic systems. However, these studies have not addressed the role of biochar in improving the trace elements bioavailability in AD. The role of biochar in continuous AD process has also not yet been reported. Therefore, the objectives of the present study were to: (i) evaluate the ability of different types of biochar to leach trace elements, (ii) evaluate the effect of biochar and trace elements addition on the AD of food waste in batch reactors, and (iii) evaluate the effect of biochar addition on continuous AD of food waste using an upflow anaerobic sludge blanket (UASB) reactor.
Materials and Methods
Food Waste, Inoculum, and Biochar
The food waste was simulated using potatoes (30%), white bread (44%), spinach (10%), tomatoes (10%), and soya beans (6%). The total solids (TS) and volatile solids (VS) of the individual fractions of the food waste was analyzed, and the VS/TS ratio was used to select the required amounts used for this study. Shredding and dicing was done using a kitchen knife to reduce the size to ~2 mm. Small portion of the food waste was blended using a kitchen blender (Proline, MIX55) with frequent addition of de-ionized water (total of 2 L), which resulted in a thick paste that was used in the batch experiments. Some of the paste was stored at −20°C until further use in continuous experiments. Anaerobic granular sludge was collected from Veolia Water Technologies Techno Center Netherlands B.V. (Biothane). The sludge was stored at 4°C until use. Before every batch test and the continuous experiment, the sludge was maintained at 30°C for 24 h, in order to acclimatize the sludge to the experimental conditions. The biochar used was (i) treated waste wood (600°C, ETIA, France), (ii) spruce wood (650°C, CIRAD, France), (iii) scots pine bark (475°C, VTT, Finland), (iv) willow tree (475°C, VTT, Finland), and (iv) brewery residue (260°C, VTT, Finland).
Trace Elements Leaching From Biochar
Biochar samples were weighed and dried in an oven at 105°C for 24 h. The moisture content was calculated using the gravimetric method for total solid analysis. The biochar samples (0.5 g) were placed in 250 mL bottles, and 20 mL of demi-water added. The bottles were agitated at 200 rpm on an orbital shaker (InnovaTM 2100 platform shaker), for 48 h at 30°C, and samples were collected at intervals of 0, 24, and 48 h, respectively. The mixture was filtered using a vacuum pump (Knf laboport, N816.3KT.45.18) to obtain the leachate. The electrical conductivity (WTW EC meter) and volume of the leachate were measured. Concentrated nitric acid (5% per L of filtered volume) was added to acidify the leachate for trace metal analysis by an inductively coupled plasma mass spectrometry (ICP-MS, X series 2 by Thermo Scientific). The amount of trace elements leached was expressed in mg/kg, according to the calculations described in the EN12457-4 standard (Dutch Standardization Institute, 2002).
Batch AD Experiments
Batch AD tests were carried out in 250 mL glass bottles having a working volume of 150 and 170 mL headspace, respectively. The inoculum/substrate (ISR) ratio 1:1 (VSS inoculum/VS food waste) was used for all the batch experiments. The batch experiments were carried out in three treatments as summarized in Table 1. All the batch experiments were performed and analyzed in triplicates. The food waste paste used in treatments A and B had an organic load of 18 g COD/L(wetbasis), while the food waste used in treatment C had an organic load of 6 g COD/L(wetbasis). The trace elements solution was composed of Fe, Co, Ni, and Zn, each with a concentration of 1,000 mg/L. The headspace was purged with pure nitrogen gas for 2 min, and the bottles were tightly covered using a metallic ring cap fitted with a rubber septum. The reactors were incubated on an orbital shaker (InnovaTM 2100 platform shaker), at 150 rpm and 30°C, for 6 days. The daily increment of headspace gas pressure in the bottles was measured using a manometer (LEO 1 Keller, model: LEO 1/-1 to 3 bar/81000.2) and was used to calculate the biogas volume, according to the procedure described by de Lemos Chernicharo (2007). The biogas was expressed in mL/g COD.
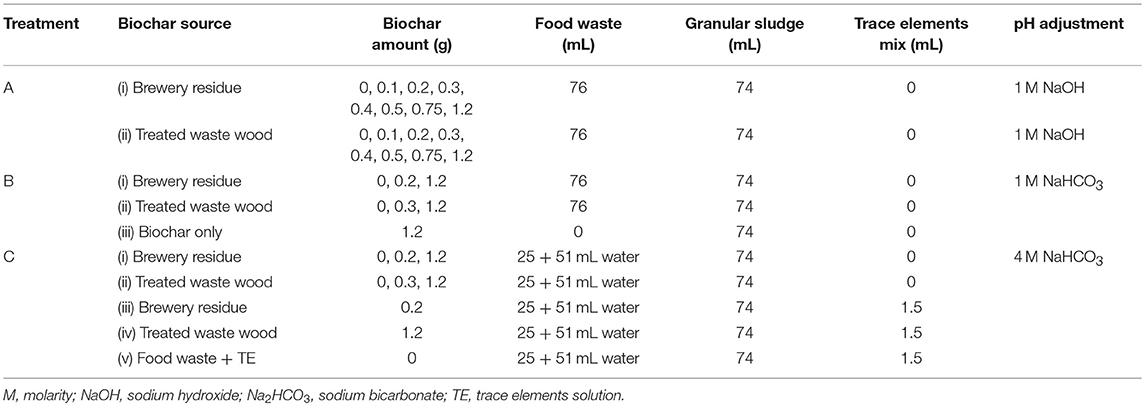
Table 1. Experimental design for batch experiments.
Continuous AD Experiments With UASB Reactors
Two identical UASB reactors made of perspex glass were used for continuous experiments. Figure 2 shows the schematic of the UASB reactor set up. The working volume was 2.25 L with a height of 91.5 cm and a diameter of 5.6 cm. One reactor was used as a control and the second one with biochar amendment as the test reactor. The granular sludge volume was maintained at 600 mL, which was about 30% of the reactors working volume in both reactors. The treated waste wood pyrochar was sieved to obtain 800 μm particle size fractions. The pyrochar was added to the granular sludge bed in the test reactor at a concentration of 8 g/L of the reactors working volume. The control contained the granular sludge only.
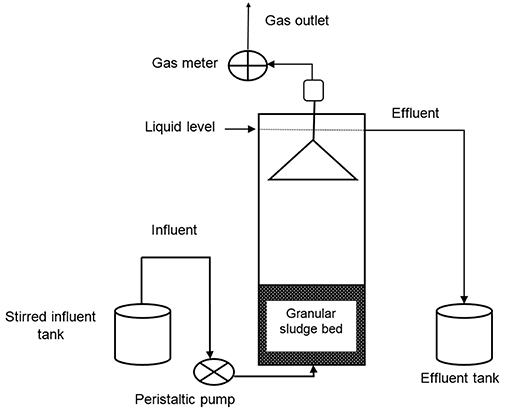
Figure 2. Schematic of the UASB reactor.
The mixed food waste paste was diluted with deionized water to the desired g COD/L and the pH adjusted to 7.0–7.5 using 1 M NaHCO3. The diluted food waste was continuously fed into the reactor using a peristaltic pump (Masterflex, by Cole-Parmer; Model: 7528-30), at a rate of 2.6 L.day and an upflow velocity of 0.04 m/h. The organic loading rate of the diluted food waste was increased stepwise from 3.4 to 7.8 g COD/L.day and the hydraulic retention time (HRT) maintained at 24 h throughout the operational period. The reactors were operated at 30°C for 40 days. On day 25 of the UASB reactor operation, the biomass in the two reactors was reduced to about 20% of the total reactor working volume. The effluent of both the reactors was sampled daily and analyzed for COD, NH4-N, pH, and VFA.
Analytical Methods
The analysis of different parameters was done according to the standard protocols adopted by the IHE Delft laboratory (Kruis, 2014). Total solids, volatile solids, and volatile suspended solids were analyzed using the gravimetric (oven method). The COD, total nitrogen, total phosphorous, and ammonia-nitrogen concentration were measured using a Perkin Elmer, UV/VIS Lambda 365 spectrophotometer at 600, 655, 880, and 655 nm, respectively. VFA was measured using a gas chromatograph (Varian 430-GC, CP-8400) as well as the CH4 composition (Scion 456-GC). The trace elements were analyzed using microwave digestion method with concentrated nitric acid and the concentration measured using an ICP-MS (ICP-MS, X series 2 by Thermo Scientific).
Results and Discussion
Feedstock Characteristics
The initial feedstock characteristics play an important role in AD. The selection of the mixed food waste recipe used for this research was inspired by research done on AD of kitchen waste (Qiang et al., 2013; Sunyoto et al., 2016). The food waste and inoculum were first characterized before the start of the AD and Table 2 illustrate the properties. The C:N ratio of the mixed food waste was 21.07, which was in line with the findings of Kondusamy and Kalamdhad (2014) who reported that a C:N ratio of 20–30 was sufficient for the AD process. The VS/TS ratio (organic content) was 97%, which indicates a very high potential for microbial treatment as reported by Xu et al. (2018). Trace elements concentration of important elements like Fe, Co, Ni, and Zn should be present in sufficient supply for a successful AD. The trace elements concentration in the food waste was very low and could not be detected by the ICP-MS used for the analysis. The minimum detection limits were (μg/L): Fe 200; Co 0.5; Ni 3.0; Zn 20; Cu 10; Mn 100; Na 6,000 and K 3,000. Hence supplementation was necessary for this food waste. The granular sludge used as the inoculum contained 842.5, 2.43, 8.02, and 186.35 μg/ (g d.w.) of Fe, Co, Ni, and Zn respectively which may have played a role in enhancing the AD process.
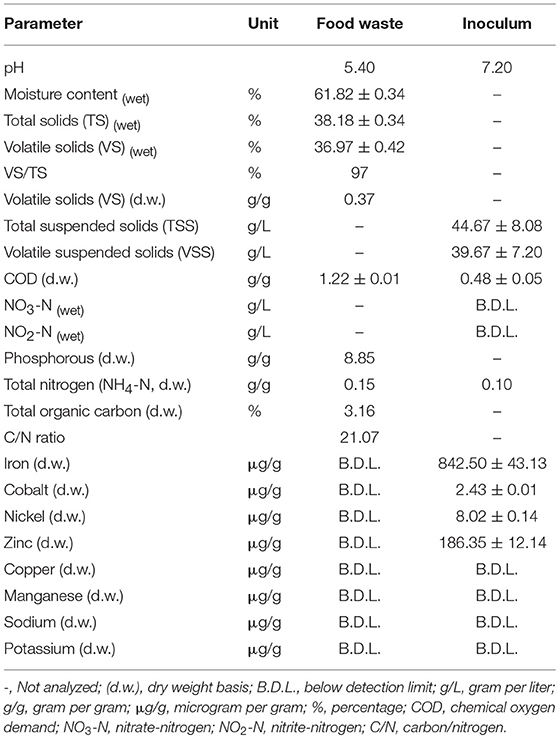
Table 2. Characteristics of the mixed food waste and the inoculum used for the AD process.
The characteristics of the biochar used for the AD are summarized in Table 3. The brewery residue hydrochar had a 4% ash content, which was lower than that of the treated waste wood pyrochar, which had 20%. This was in line with the hypothesis from literature by Kambo and Dutta (2015) who reported that hydrothermal carbonization produced a product with a lower ash content compared to slow pyrolysis. The ash content is an indicator of the amount of alkali metals that remained in the biochar after production (Kambo and Dutta, 2015). Poerschmann et al. (2015) reported a 6.3% ash content from HTC of brewer's spent grain, which is another term used to refer to the brewery residue. The pH of the brewery residue hydrochar was 6 while that of the treated waste wood pyrochar was 8. Poerschmann et al. (2015) also reported a pH of 6.9 of the produced hydrochar. The pH is important in that the biochar can provide buffering to the AD when used as an additive.
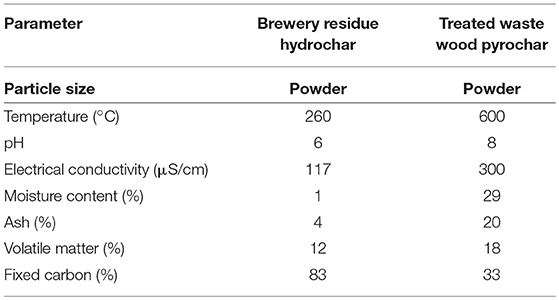
Table 3. Characteristics of biochar used for the AD process.
Trace Elements Leaching From Biochar
The essential trace elements (Fe, Co, Ni, and Zn) were leached out in very small rates as illustrated in Table 4 in all the biochar used in the leaching test. This can be explained by the fact that they were also in almost negligible amounts in the initial biomass. Only Na and K ions were leached out in high amounts. The Na and K ions released into the leachate were responsible for the increase in the EC in the leachate of all the biochars tested as illustrated in Figure 3. The treated waste wood pyrochar with the highest EC had the highest Na and K amount while the brewery residue hydrochar had the second lowest EC and Na, and the least K within 48 h. This finding corresponds to Kambo and Dutta (2015) who reported that pyrolyzed biochar contained higher ash content, which signifies a high amount of alkali metals in the end product.
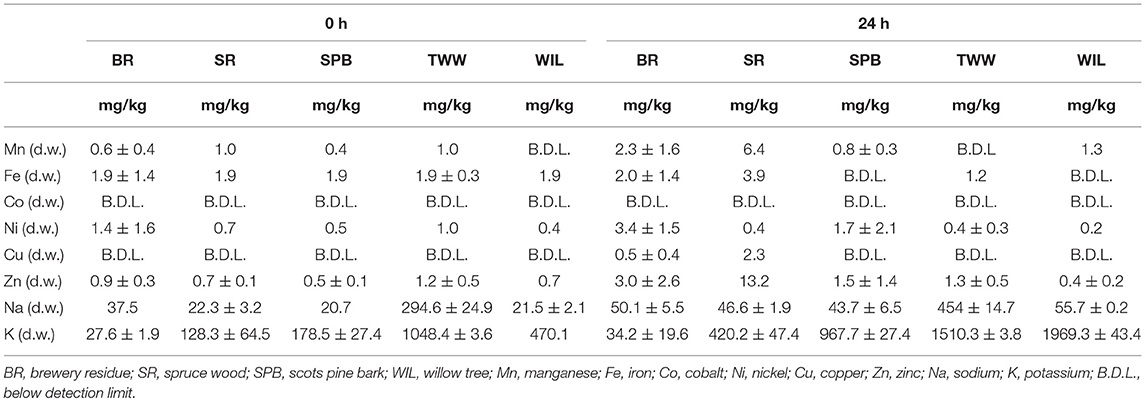
Table 4. Trace element concentration within 24 h of leaching from different biochar.
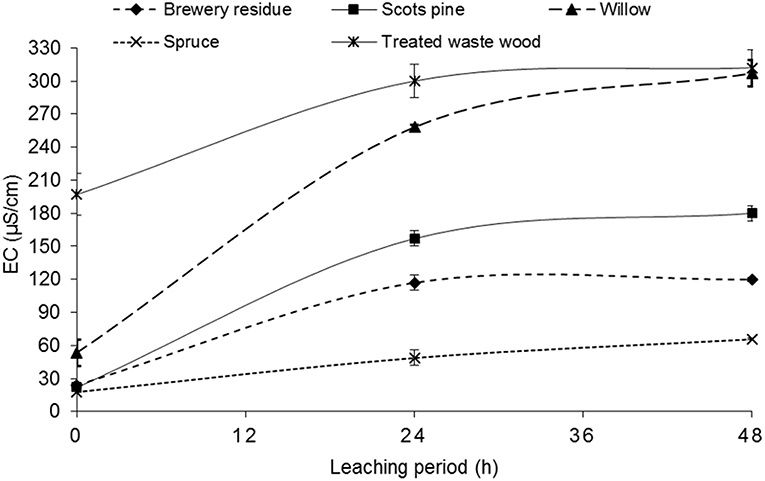
Figure 3. Increase in electrical conductivity (EC) over the 48 h leaching period.
The percentage of the leached trace and macro elements from the biochar about the original biomass composition was also calculated. The data for the brewery residue hydrochar and the treated waste wood pyrochar was not available for the initial biomass composition. The scots pine bark leached out 85% of the amount of Ni and 45.4% K. Cu was not detected in any of the biochar. The willow pyrochar leached 38.6% Na and 68.3% K, while the spruce wood pyrochar leached 33% Zn and 30% Fe.
Effect of Biochar on AD in Batch Reactors
Treatment A: pH Adjustment With 1 M NaOH
In the batch reactors treated with the brewery residue hydrochar, the addition of small doses of hydrochar, i.e., 0.2 g (332 mL/g COD) and 0.1 g (332 mL/g COD) increased the biogas production by 35 and 30%, respectively, when compared to the control which produced 215 mL/g COD (Figure 4A). The addition of a higher dose (1.2 g) produced the same biogas volume as the control (215 mL/g COD). This indicated that the addition of small amounts of the brewery residue hydrochar was enough to enhance the volume of the biogas produced. However, the CH4 percentage in all the treatments was only 7–10%.
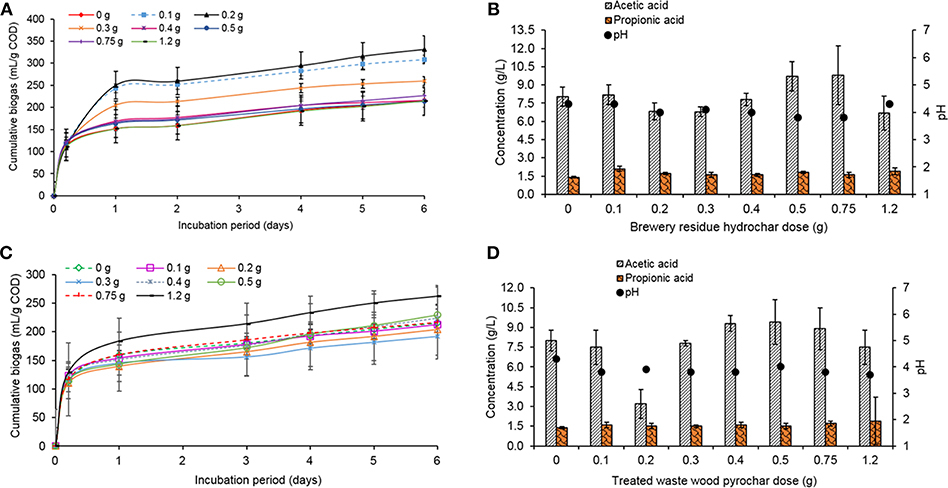
Figure 4. (A) Cumulative biogas production during the treatment with different doses of the brewery residue hydrochar, with 1 M NaOH, (B) Production of acetic and propionic acid in the treatments with the brewery residue hydrochar, with 1 M NaOH (incubation period: 6 days), (C) Cumulative biogas production during the treatment with different doses of the treated waste wood pyrochar, with 1 M NaOH, and (D) Production of acetic and propionic acid in the treatments with the treated waste wood pyrochar, with 1 M NaOH.
In the batch reactors with the treated waste wood pyrochar, the addition of 1.2 g (262 mL/g COD) pyrochar increased the biogas production by 18%. The lowest production was by the addition of 0.3 g (191 mL/g COD) pyrochar, which was 11% lower than the control (Figure 4C). This indicated that a higher amount of the treated waste wood pyrochar was required to enhance the volume of the produced biogas. The CH4 percentage in all the treatments was between 15 and 27%. The biogas volume was higher in the treatments with the brewery residue hydrochar, but the CH4 percentage in the biogas was higher in the treated waste wood pyrochar treatments.
The pH of the treatments with both the brewery residue hydrochar and the treated waste wood pyrochar decreased from 7.0 to below 4.5. This was caused by the rapid accumulation of VFA. Acetic (3.2–9.8 g/L) and propionic acids (1.4 to 2.1 g/L) were the most dominant in these treatments (Figures 4B,D). The pre-treatment of the food waste by blending made it highly biodegradable; hence, the rate of VFA production rate exceeded the consumption rate (Ren et al., 2018). The methanogenesis step was inhibited by the high VFA concentration leading to a low CH4 percentage in the biogas. This was in line with the findings of Sunyoto et al. (2016) who used pine sawdust biochar on AD of white bread without pH buffering and observed accumulation of VFA in their cultures that led to low pH of about 4.9. The hydrochar and the pyrochar did not provide buffering against the high VFA concentration as reported in the literature by Wang et al. (2017).
Treatment B: pH Adjustment With 1 M NaHCO3
1 M NaHCO3 was used as a buffer to adjust the pH to 7.0. Two brewery residue hydrochar and treated waste wood pyrochar doses were used for this set instead of the seven used in the treatments adjusted with NaOH (treatment A). The doses that produced the highest and lowest biogas yield in treatment A were used for this set, together with two controls (With biochar only and with food waste only). The 0.2 and 1.2 g brewery residue hydrochar, and 0.3 and 1.2 g treated waste wood pyrochar doses were used.
The treatment with 0.2 g hydrochar dose produced 325 mL/g COD which was an increase in biogas production by 3% when compared to the control which produced 315 mL/g COD (Figure 5A). This volume by the 0.2 g dose was 2% lower than the amount produced with 1 M NaOH pH buffering. The 1.2 g hydrochar dose (317 mL/g COD) increased the biogas production by only 0.6%. However, the volume produced by the 1.2 g dose in the buffered treatment was 32% more than in the treatment with NaOH (treatment A). The biogas produced by the control with hydrochar only (12 mL/g COD) could be attributed to the digestion of the organic carbon still present in the hydrochar as reported by Kambo and Dutta (2015). The CH4 percentage in the biogas was 23 and 24% for the treatments with the hydrochar and control, respectively, an increase from 7 to 10% reported in the treatment with NaOH (treatment A). The treatment with 1.2 g treated waste wood pyrochar dose (328 mL/g COD) increased the biogas production by 4%, but the volume was 20% higher than in the treatment with NaOH (treatment A). The CH4 percentage in the biogas with the treated waste wood pyrochar treatments was 24%, a slight increase for the 0.3 g dose that had 16% in the treatment with NaOH (treatment A).
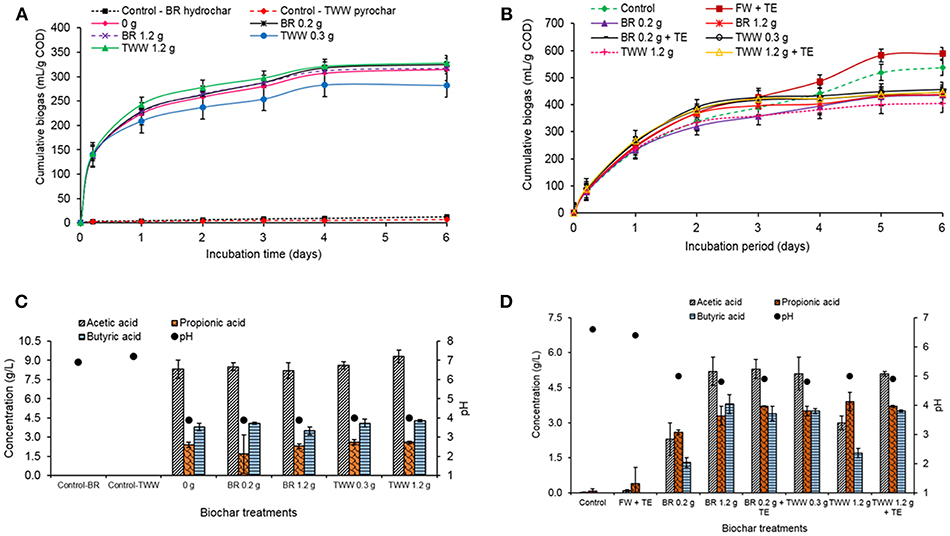
Figure 5. (A) Cumulative biogas production during the treatment with different doses of the brewery residue (BR) hydrochar and the treated waste wood (TWW) pyrochar, with 1 M NaHCO3, (B) Cumulative biogas production during treatment with the brewery residue hydrochar and the treated waste wood pyrochar (FW, food waste; TE, trace element; BR, brewery residue; TWW, treated waste wood), with 1 M NaHCO3, (C) VFA production in the treatments with different doses of the brewery residue (BR) hydrochar and the treated waste wood (TWW) pyrochar (incubation period: 6 days), with 1 M NaHCO3, and (D) VFA production in the treatments with the brewery residue hydrochar and the treated waste wood pyrochar (incubation period: 6 days; FW, food waste; TE, trace element; BR, brewery residue; TWW, treated waste wood), with 1 M NaHCO3.
The pH in all the biochar treatments and the control without biochar, reduced from 7.0 to 4.0 due to the accumulation of VFA in the reactors. Acetic acid was produced in high concentrations (more than 8 g/L) in all the treatments with the hydrochar, pyrochar, and the control without biochar. Butyric acid was the second highest concentration with more than 3 g/L in all the treatments. The highest concentration of propionic acid was 2.6 g/L in the 0.3, and 1.2 g treated waste wood dose treatment while 0.2 g brewery residue hydrochar dose had the lowest concentration of 1.7 g/L. The 6.9 and 7.2 pH in the hydrochar control without the food waste and the treated waste wood pyrochar respectively was an indicator that the organic load from the food waste was contributing to the high VFA production in the reactors (Hobbs et al., 2018).
The addition of the 1 M NaHCO3 pH buffer enhanced the volume of biogas produced in all the treatments, but the high VFA concentration quickly reduced its effect. At high organic load, a higher concentration of the pH buffer is required (Gao et al., 2015). The hydrochar and the pyrochar could not provide sufficient buffering to counter the effect of acidification from the VFA.
Treatment C: pH Adjustment With 4 M NaHCO3
The treatment with 4 M NaHCO3 was aimed at addressing the effect of the hydrochar and pyrochar on AD on a reduced organic load of the food waste. The food waste paste was diluted by reducing the amount of food waste from 76 to 25 mL and then adding 51 mL of de-ionized water to top up the volume to 76 mL, which was the required amount for the 1:1 ISR (Table 1). The same hydrochar and pyrochar doses used in the treatment with 1 M NaHCO3 (treatment B), were used in treatment C, together with a control without biochar, food waste with 1.5 mL mixed trace elements supplement (1,000 mg/L of Fe, Co, Ni, and Zn) and a combination of biochar doses with trace elements supplement. The NaHCO3 buffer concentration was increased to 4 M in treatment C.
In the batch reactors with the brewery residue hydrochar, the food waste with trace element supplement produced 588 mL/g COD which was an increase in biogas production by 9% when compared to the control without biochar, which had a biogas production of 538 mL/g COD as illustrated in Figure 5B. The biogas production by the control was 60 and 41% more compared to the treatment with NaOH (treatment A) and 1 M NaHCO3 (treatment B) treatments, respectively. The 0.2 g hydrochar dose biogas production (435 mL/g COD), was 24–25% higher than in the treatments with NaOH and 1 M NaHCO3, respectively. The 1.2 g hydrochar dose production (438 mL/g COD) was 51–28% more than in treatments A and B, respectively. The production was also higher than that of the 0.2 g hydrochar in treatments A and B. The 0.2 g hydrochar dose with trace elements supplement produced 4% more biogas compared to the hydrochar treatments without the supplement, and 22% lower than the treatment with the trace elements supplement without biochar addition. However, the hydrochar treatments still produced lower biogas when compared to the control without hydrochar.
The 0.3 g treated waste wood pyrochar dose treatment production (447 mL/g COD) was higher by 57–37% when compared to the treatment with NaOH (treatment A) and 1 M NaHCO3 (treatment B) treatments, respectively. The 1.2 g pyrochar dose production (405 mL/g COD) increased by 35–19% compared to treatments A and B. The 1.2 g pyrochar dose with trace elements supplement produced 9% more biogas than the treatments without the supplement but was 24% lower compared to the treatment with the trace elements supplement without biochar addition. This could be due to the adsorption of the trace elements ions by the hydrochar and the pyrochar as reported by Fagbohungbe et al. (2017) and Li et al. (2017). The trace elements were therefore not available for the enzymatic activity of the microorganisms. The CH4 composition in the biogas was 48% in the control and food waste with trace element supplement treatments, which was higher than in the treatments with the hydrochar and the pyrochar (36–38%). The biogas volume and CH4 composition improved with the high buffer concentration in this treatment compared to the treatment with NaOH (treatment A) and 1M NaHCO3 (treatment B) treatments. The addition of 4 M NaHCO3 provided good buffering capacity in the batch reactors as reported by Gao et al. (2015), wherein the authors used 1,000 mg/L NaHCO3 in the AD of kitchen waste and reported a 48% improvement in CH4 yield.
Even with a pH buffer, the pH of the treatments with the hydrochar and pyrochar reduced to between 4.8 and 5.0 due to VFA accumulation (Figures 5C,D). The propionic acid concentration was higher (2.6 to 3.9 g/L) in all the hydrochar and pyrochar treatments. This explains the rapid decline in the pH because the accumulation of propionic acid consumes the highest alkalinity in the AD, thus inhibiting the degradation of acetic acid, which was also very high (2.3 to 5.3 g/L). The high propionic acid concentration in the treatment with 4 M NaHCO3 (treatment C) could also be due to Na+ toxicity to the propionic utilizing microorganisms than the acetic acid utilizing ones (Gao et al., 2015). The pH buffer used contained a higher concentration of Na+. The control and the food waste with trace elements supplement had very low total VFA production of <0.7 g/L. Hence, the pH remained around neutral. The high VFA accumulation and low final pH observed in the three treatments are in line with the findings of Wang et al. (2017). The authors used kitchen waste and vermicompost biochar for the batch AD and after incubation recorded 0.4 g/L acetic acid, 5 g/L butyric and 1 g/L propionic acid at pH 4.9. The higher biogas volume and CH4 percentage in this treatment (C), for both the brewery residue hydrochar and the treated waste wood pyrochar, shows that the methanogenesis step was relatively successful compared to treatments A and B, due to the good buffering capacity provided by the addition of 4 M NaHCO3. However, the hydrochar and pyrochar treatments did not enhance the biogas production and composition when compared to the control.
From the trace elements leaching experiments, the hydochar and pyrochar used in the batch AD released negligible amounts of the trace elements into the batch reactors. This explains the inability of the biochar to enhance the biogas production as there was a deficiency of the required trace elements for utilization by the methanogens. The conversion of the organic matter in the food waste in the AD process takes place following the oxidation and reduction reactions as illustrated in Table 5. The oxidation reactions have a ΔG0 > 0; hence, the degradation of propionate and butyrate cannot occur under standard conditions and the reactions cannot shift to the right due to high amount of hydrogen (H+) ions. There was more hydrogen production in the batch experiments evidenced by the reduced pH due to high VFA concentration at the end of the incubation period, which inhibited the conversion of propionic and butyric acids into acetic acid, and CH4. The continuous removal of hydrogen from the AD system would ensure efficient completion of the process (de Lemos Chernicharo, 2007). This can be achieved by the addition of alkalinity (electron acceptors) in the form of bicarbonate to complete the methanogenesis step. The results from the three batch AD treatments indicate that even with the addition of a higher buffer concentration, the pH of the treatments with the brewery residue hydrochar and the treated waste wood pyrochar reduced to levels that inhibited the methanogenesis step, due to high VFA concentration. The pH of the biochar did not influence the AD process, but it led to the acidification in the reactors.
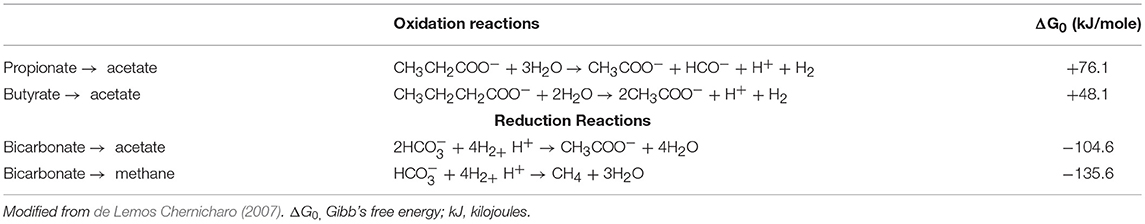
Table 5. Oxidation-reduction reactions in anaerobic digestion.
The NH4-N in the batch reactors of the three treatments (A, B, and C) was below 200 mg NH4-N/L. It is reported in the literature that concentrations in this range can be beneficial to the AD process, while more than 3,000 mg NH4-N/L can cause complete inhibition of methanogenic activity at any pH level (Rajagopal et al., 2013).
Effect of Biochar on AD in a Continuous UASB Reactor
The reactor with biochar (treated waste wood pyrochar) amendment produced the highest cumulative biogas (32 L/g CODremoved) with an average of about 0.86 L/g CODremoved per day. The highest volume was within the first 3 days with a production of 20 L/g CODremoved. This may have been due to the low amount of particles in the influent caused by some particles settling in the influent pipes. The diluted food waste was therefore easily digested owing to the high activity of the granular sludge at the beginning of the operation. The biogas production remained steady for the rest of the operation time. The control reactor cumulative biogas production was 18 L/g CODremoved with an average of 0.45 L/g CODremoved per day. The biogas production in the control was also steady during the operation time with the highest production of 5 L/g CODremoved on day 32 (Figure 6). On day 29, the pH of the control reduced to 5.8, which reduced the activity of the granular sludge. This led to the accumulation of organic matter in the sludge bed, and once the pH was restored to 7.0, the activity and COD removal recovered causing a sharp increase in the biogas volume.
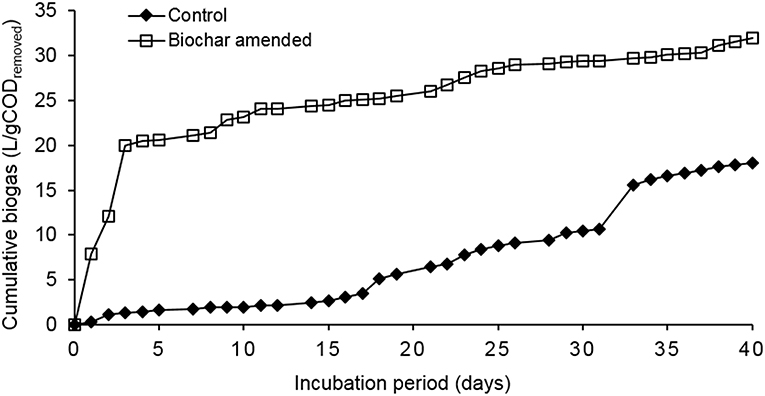
Figure 6. Cumulative biogas production in the control and biochar amended UASB reactors.
The COD removal efficiency (RE) was higher in the reactor with the biochar amendment than in control (Figure 7). For both reactors, the RE increased to 75% up to day 4 when the organic loading rate (OLR) was 3.4 g COD/L.day. The OLR was increased to 4.4 g COD/L.day on day 5. The RE of both reactors decreased to 33 and 25% for the control and the reactor with biochar amendment, respectively, between day 6 and 9. This was due to a design problem of the influent pipes, which led to clogging of the pipes hence the diluted food waste could not reach the granular sludge bed. This led to a sharp decrease in the pH (Figure 8) and reduced the activity of the microorganisms. The influent pipes were replaced with a smaller size, which allowed efficient pumping of the influent. The pH was adjusted to 7.0 using 1 M NaHCO3 and the reactors recovered on day 10. Apart from day 8 and 9, the pH of the two reactors remained stable (around neutral) up to day 40. The OLR was maintained at 4.4 to 5.2 g COD/L.day from day 5 to 29. The average RE of the control was 38–59% for the reactor with biochar amendment during this period. The CH4 percentage in the biogas was 28% for the control and 63% for the biochar amended reactor in this period.
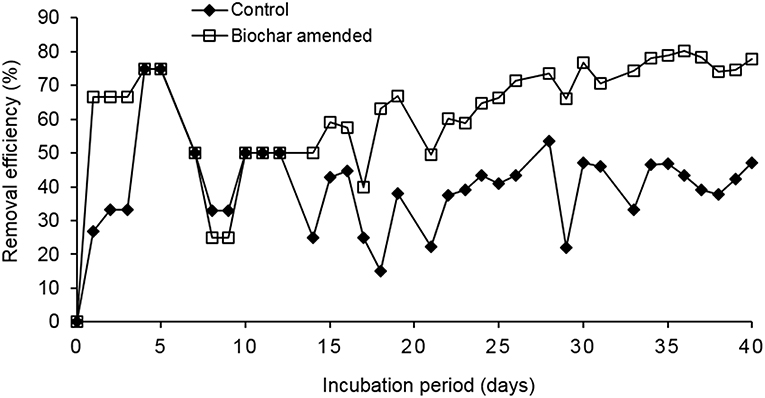
Figure 7. Comparison of the COD removal efficiencies (RE) of the control and biochar amended UASB reactors.
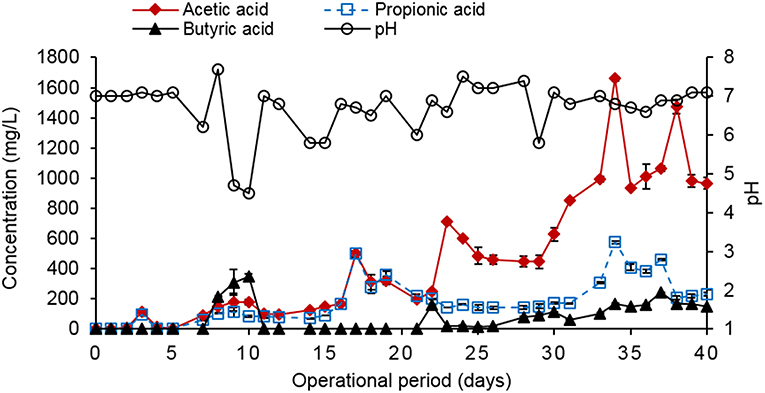
Figure 8. VFA production in the control UASB reactor.
During the operation, the granular sludge bed was rising to the top of the reactors (Figure 9). The produced gas was trapped within the sludge bed causing it to float, and because the diameter of the reactor was very narrow (5.6 cm); the granules could not fall back to the bottom without manual manipulation. Therefore, the biomass was reduced to about 20% of the reactors working volume on day 25. After the reduction, the granules were able to rise and fall back.
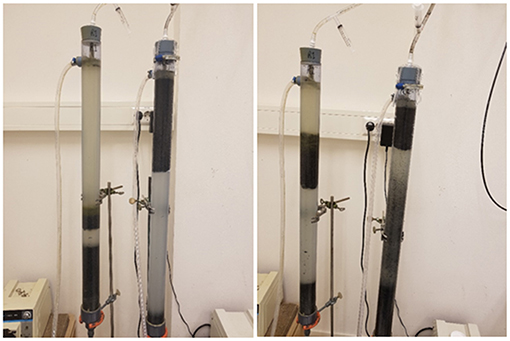
Figure 9. Photograph of the floating granular sludge during the operation period.
The OLR was later increased to 6.9–7.8 g COD/L.day on day 30–40. The average RE for the control was 47–77% for the reactor with biochar amendment during this period. The average CH4 percentage in the biogas during this period was 39% for the control and 65% for biochar amended reactor. The high CH4 percentage in the biogas produced by the biochar amended reactor was in line with the findings of Latif et al. (2012) who reported a 63% CH4 composition in the treatment of liquidized food waste at an OLR of 12.5 g COD/L.day, and a COD removal efficiency of 75%, but without biochar amendment. The control (R1) is more comparable to the findings of these authors and the CH4 percentage, and COD removal efficiency was 38–37% lower, respectively. The results indicate that the COD, RE and CH4 percentage increased in both reactors when the OLR was increased to 6.9–7.8 g COD/L.day. The treated waste wood biochar amendment in the test reactor enhanced the COD removal and increased the CH4% by 37–47% respectively when compared to the control. The high carbon content in the biochar enhanced the C:N ratio of the diluted food waste paste hence the better performance of AD in the test reactor.
The VFA production in control was slightly higher than in the reactor with the biochar amendment during the operation period (Figures 8, 10). The total VFA concentration in control was below 500 mg/L up to day 24 when it started increasing up to a high of 1,660 mg/L of acetic acid on day 34. This corresponds to the fluctuating pH level of the reactor. The total VFA concentration in the reactor with the biochar amendment was below 350 mg/L during the operation period. This indicated that the AD process in the biochar amended reactor was relatively stable. A total VFA concentration of between 50 and 250 mg/L would indicate a stable AD system (Ren et al., 2018). The VFA concentration in both reactors was below the inhibitory 2 g/L level as reported by Kondusamy and Kalamdhad (2014). The NH4-N concentration in both reactors was below 200 mg NH4-N/L and was below the inhibitory levels as reported by Rajagopal et al. (2013).
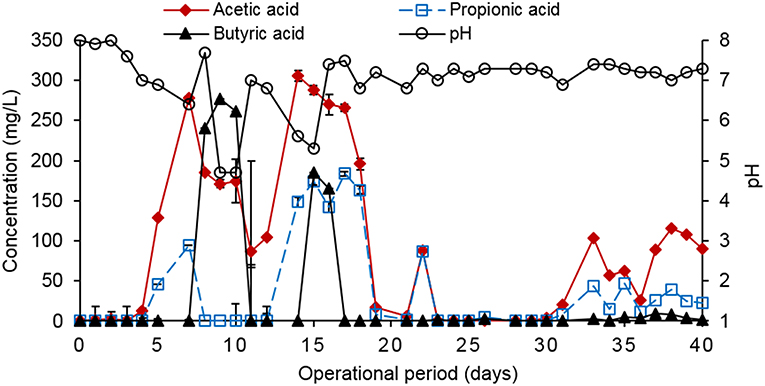
Figure 10. VFA production in the UASB reactor amended with biochar.
Practical Implications of This Research
The results of this research show that biochar addition can be used to enhance the AD process especially in the UASB reactor. However, some of the challenges faced in this research can be stated as follows:
(i) The pH drop in the batch reactors with the different biochars was caused by the accumulation of VFA.
(ii) The high particulate matter in the food waste used in the UASB reactors led to reactor failure at the start of the operations. Besides, the design of the reactors, less inner diameter and the fluctuation of the pH during the night also affected the performance of the reactor.
(iii) The physical and chemical properties of the pyrochar and hydrochar used in this research could not be compared to previous literatures because the available literature is on different types of biochar produced from a wide variety of biomass sources, i.e., different physico-chemical properties, which makes a direct comparison of the results difficult.
The effect of the biochar of this food waste in the batch reactors should further be investigated using different inoculum: substrate ratios, and trace elements concentration to establish the right ratios in case of future applications in large-scale applications to avoid VFA accumulation. The applicability of the UASB reactors in the AD of food waste requires research to establish the suitable design due to the high particulate matter present in the food waste. The reactors should be designed with an optimum height: diameter ratio than the ones used in this research to create more space for the granules to rise and release the gas with ease and fall back. The operation of the UASB at a large-scale level should be automated to ensure continuous pH monitoring and buffer dosing, which will prolong the longevity of the operations. The relationship between the initial biomass trace elements concentration will need to be established and the bioavailable amount at the end of the biochar production for AD applications. A database of suitable biomass and production temperature/process should be put in place to act as a guide for future AD applications. Biochar production at the industrial level for use in AD applications requires careful planning involving the integration of different policies. These include Waste Management, Renewable Energy, European GMO policy, Clean Development Mechanism (CDM) of the Kyoto Protocol, United Nations Framework Convention for Climate Change (UNFCCC), and Economic Policies. Some of the standards that need to incorporate the biochar include; the REACH (Registration, Evaluation, Authorization & Restriction of Chemicals) regulation (Regulation 1907/2006/EC), use of fertilizer regulation, soil remediation and protection regulations, and regulation of biodiversity (Van Laer et al., 2015). The International Biochar Initiative (IBI) has developed standards for biochar properties and testing of biochar, while the Delinat Institute defines on top of the biochar properties also the required properties of the feedstock used for the production of the biochar more in detail (Van Laer et al., 2015). The available standards are meant for the application of biochar in soils, hence, there is an urgent need to develop and integrate standards that apply to the use of biochar for AD processes.
Conclusions
The biochar used in this research leached very small quantities of trace elements because the initial biomass used for their production also had low quantities of Fe, Co, Ni, Zn, Cu, and Mn. The high amount of K leached from the treated waste wood (1,510 mg/kg) and the willow tree pyrochar (1,969 mg/kg), and relatively high amount of Na and K from the other biochars caused an increase of the EC in the leachate. Even with the addition of a buffer, the pH of the biochar treatments reduced to levels that inhibited the methanogenesis step (pH 3.8–5.0), at both higher (18 g COD/L) and lower (6 g COD/L) organic load of the food waste in the batch reactors. The biogas volume produced by the treatments with the brewery residue hydrochar and treated waste wood pyrochar was lower than that produced by the control with food waste only (538 mL/g COD). Trace elements supplementation enhanced the biogas production of the food waste without biochar addition (588 mL/g COD) by 8.5%. The combination of the 0.2 g brewery residue hydrochar and 1.2 g treated waste wood pyrochar with trace elements supplement in the batch AD enhanced the biogas production compared to the treatments without the supplement, but the biogas volume and composition was still lower when compared to the control. The treated waste wood pyrochar enhanced the COD removal efficiency and CH4 composition in the test UASB reactor by 37–47% respectively, compared to the control. This shows that addition of treated waste wood pyrochar can enhance the performance of a UASB reactor for the AD of food waste.
Author Contributions
CW performed the laboratory experiments, data analysis, and wrote the manuscript. ER assisted in designing the laboratory experiments, as well as in writing the manuscript. JV and CD offered technical guidance, supported in data analysis and worked on the completed manuscript. EH provided overall guidance, supervision, and scientific knowledge support for this research work.
Conflict of Interest Statement
The authors declare that the research was conducted in the absence of any commercial or financial relationships that could be construed as a potential conflict of interest.
Acknowledgments
CW thanks UNESCO-IHE Institute for Water Education and the Dutch government for financially supporting the MSc programme through the Nuffic fellowship. The authors thank the UNESCO-IHE laboratory staff members, ETIA (France), RAGT (France), VTT (Finland), CIRAD (France), and Veolia Water Technologies Techno Center, Netherlands B.V. (Biothane) for providing analytical support, the bio/pyrochars, and inoculum used in this study.
References
Banks, C. J., Zhang, Y., Jiang, Y., and Heaven, S. (2012). Trace element requirements for stable food waste digestion at elevated ammonia concentrations. Bioresour. Technol. 104, 127–135. doi: 10.1016/j.biortech.2011.10.068
Cha, J. S., Park, S. H., Jung, S.-C., Ryu, C., Jeon, J.-K., Shin, M.-C., et al. (2016). Production and utilization of biochar: a review. J. Indus. Eng. Chem. 40, 1–15. doi: 10.1016/j.jiec.2016.06.002
de Lemos Chernicharo, C. A. (2007). “Anaerobic Reactors,” in Biological Wastewater Treatment in Warm Climate Regions, Vol. 1, eds M. von Sperling and C. A. de Lemos Chernicharo (London: IWA Publishing), 659–827.
Dutch Standardization Institute, N. (2002). “One stage batch test at a liquid to solid ratio of 10 L/kg for materials with particle size below 10 mm (Without or with size reduction),” in Compliance test for leaching of granular waste materials and sludges, Vol. NEN-EN 12457-4 (en). NNI Delft (Delft).
Fagbohungbe, M. O., Herbert, B. M., Hurst, L., Ibeto, C. N., Li, H., Usmani, S. Q., et al. (2017). The challenges of anaerobic digestion and the role of biochar in optimizing anaerobic digestion. Waste Manage. 61, 236–249. doi: 10.1016/j.wasman.2016.11.028
Fagbohungbe, M. O., Herbert, B. M., Hurst, L., Li, H., Usmani, S. Q., and Semple, K. T. (2016). Impact of biochar on the anaerobic digestion of citrus peel waste. Bioresour. Technol. 216, 142–149. doi: 10.1016/j.biortech.2016.04.106
Gao, S., Huang, Y., Yang, L., Wang, H., Zhao, M., Xu, Z., et al. (2015). Evaluation the anaerobic digestion performance of solid residual kitchen waste by NaHCO3 buffering. Energy Convers. Manage. 93, 166–174. doi: 10.1016/j.enconman.2015.01.010
Hobbs, S. R., Landis, A. E., Rittmann, B. E., Young, M. N., and Parameswaran, P. (2018). Enhancing anaerobic digestion of food waste through biochemical methane potential assays at different substrate: inoculum ratios. Waste Manage. 71, 612–617. doi: 10.1016/j.wasman.2017.06.029
Joseph, S., Taylor, P., and Cowie, A. (2018). Basic Principles and Practice of Biochar Production and Kiln Design. Available online at: https://biochar.international/guides/basic-principles-of-biochar-production/#introduction (Accessed 24.12.2018).
Kambo, H. S., and Dutta, A. (2015). A comparative review of biochar and hydrochar in terms of production, physico-chemical properties and applications. Renew. Sustain. Energy Rev. 45, 359–378. doi: 10.1016/j.rser.2015.01.050
Kondusamy, D., and Kalamdhad, A. S. (2014). Pre-treatment and anaerobic digestion of food waste for high rate methane production - a review. J. Environ. Chem. Eng. 2, 1821–1830. doi: 10.1016/j.jece.2014.07.024
Kruis, F. (2014). Environmental Chemistry: Selected Methods for Water Quality Analysis. UNESCO-IHE Laboratory Manual, Delft.
Latif, M. A., Ahmad, A., Ghufran, R., and Wahid, Z. A. (2012). Effect of temperature and organic loading rate on upflow anaerobic sludge blanket reactor and CH4 production by treating liquidized food waste. Environ. Prog. Sustain. Energy 31, 114–121. doi: 10.1002/ep.10540
Li, H., Dong, X., da Silva, E. B., de Oliveira, L. M., Chen, Y., and Ma, L. Q. (2017). Mechanisms of metal sorption by biochars: Biochar characteristics and modifications. Chemosphere 178, 466–478. doi: 10.1016/j.chemosphere.2017.03.072
Lü, F., Luo, C., Shao, L., and He, P. (2016). Biochar alleviates combined stress of ammonium and acids by firstly enriching Methanosaeta and then Methanosarcina. Water Res. 90, 34–43. doi: 10.1016/j.watres.2015.12.029
Meyer-Kohlstock, D., Haupt, T., Heldt, E., Heldt, N., and Kraft, E. (2016). Biochar as additive in biogas-production from bio-waste. Energies 9:247. doi: 10.3390/en9040247
Molaey, P., Bayrakdar, A., Sürmeli, R. O., and Calli, B. (2018). Influence of trace element supplementation on anaerobic digestion of chicken manure: linking process stability to methanogenic population dynamics. J. Clean. Product. 181, 794–200. doi: 10.1016/j.jclepro.2018.01.264
Mumme, J., Srocke, F., Heeg, K., and Werner, M. (2014). Use of biochars in anaerobic digestion. Bioresour. Technol. 164, 189–197. doi: 10.1016/j.biortech.2014.05.008
Poerschmann, J., Weiner, B., Koehler, R., and Kopinke, F. D. (2015). Organic breakdown products resulting from hydrothermal carbonization of brewer's spent grain. Chemosphere 131, 71–77. doi: 10.1016/j.chemosphere.2015.02.057
Qiang, H., Niu, Q., Chi, Y., and Li, Y. (2013). Trace metals requirements for continuous thermophilic methane fermentation of high-solid food waste. Chem. Eng. J. 222, 330–336. doi: 10.1016/j.cej.2013.02.076
Rajagopal, R., Massé, D. I., and Singh, G. (2013). A critical review on inhibition of anaerobic digestion process by excess ammonia. Bioresour. Technol. 143, 632–641. doi: 10.1016/j.biortech.2013.06.030
Ren, Y., Yu, M., Wu, C., Wang, Q., Gao, M., Huang, Q., et al. (2018). A comprehensive review on food waste anaerobic digestion: research updates and tendencies. Bioresour. Technol. 247, 1069–1076. doi: 10.1016/j.biortech.2017.09.109
Sunyoto, N. M. S., Zhu, M., Zhang, Z., and Zhang, D. (2016). Effect of biochar addition on hydrogen and methane production in two-phase anaerobic digestion of aqueous carbohydrates food waste. Bioresour. Technol. 219, 29–36. doi: 10.1016/j.biortech.2016.07.089
van Hullebusch, E. D., Guibaud, G., Simon, S., Lenz, M., Yekta, S. S., Fermoso, F. G., et al. (2016). Methodological approaches for fractionation and speciation to estimate trace element bioavailability in engineered anaerobic digestion ecosystems: an overview. Critic. Rev. Environ. Sci. Technol. 46, 1324–1366. doi: 10.1080/10643389.2016.1235943
Van Laer, T., De Smedt, P., Ronsse, F., Ruysschaert, G., Boeckx, P., Verstraete, W., et al. (2015). Legal constraints and opportunities for biochar: a case analysis of EU law. Review. GCB Bioenergy 7, 14–24. doi: 10.1111/gcbb.12114
Wang, D., Ai, J., Shen, F., Yang, G., Zhang, Y., Deng, S., et al. (2017). Improving anaerobic digestion of easy-acidification substrates by promoting buffering capacity using biochar derived from vermicompost. Bioresour. Technol. 227, 286–296. doi: 10.1016/j.biortech.2016.12.060
Xu, F., Li, Y., Ge, X., Yang, L., and Li, Y. (2018). Anaerobic digestion of food waste – challenges and opportunities. Bioresour. Technol. 247, 1047–1058. doi: 10.1016/j.biortech.2017.09.020
Zhang, C., Su, H., Baeyens, J., and Tan, T. (2014). Reviewing the anaerobic digestion of food waste for biogas production. Renew. Sustain. Energy Rev. 38, 383–392. doi: 10.1016/j.rser.2014.05.038
Zhang, L., and Jahng, D. (2012). Long-term anaerobic digestion of food waste stabilized by trace elements. Waste Manage. 32, 1509–1515. doi: 10.1016/j.wasman.2012.03.015
Keywords: anaerobic digestion (AD), biochar, trace elements, food waste, leaching
Citation: Wambugu CW, Rene ER, van de Vossenberg J, Dupont C and van Hullebusch ED (2019) Role of Biochar in Anaerobic Digestion Based Biorefinery for Food Waste. Front. Energy Res. 7:14. doi: 10.3389/fenrg.2019.00014
Received: 15 November 2018; Accepted: 04 February 2019;
Published: 04 March 2019.
Edited by:
Abdul-Sattar Nizami, King Abdulaziz University, Saudi ArabiaReviewed by:
Muzammil Anjum, Pir Mehr Ali Shah Arid Agriculture University, PakistanRajendra Prasad Singh, Southeast University, China
Copyright © 2019 Wambugu, Rene, van de Vossenberg, Dupont and van Hullebusch. This is an open-access article distributed under the terms of the Creative Commons Attribution License (CC BY). The use, distribution or reproduction in other forums is permitted, provided the original author(s) and the copyright owner(s) are credited and that the original publication in this journal is cited, in accordance with accepted academic practice. No use, distribution or reproduction is permitted which does not comply with these terms.
*Correspondence: Eldon R. Rene, e.raj@un-ihe.org