Developing a Cell-Free Extract Reaction (CFER) System in Clostridium thermocellum to Identify Metabolic Limitations to Ethanol Production
 Jingxuan Cui1,2
  David Stevenson2,3 Travis Korosh2,3
  Daniel Amador-Noguez2,3
  Daniel G. Olson2,4* Lee R. Lynd1,2,4
- 1Department of Biological Sciences, Dartmouth College, Hanover, NH, United States
- 2Center for Bioenergy Innovation, Oak Ridge National Laboraory, Oak Ridge, TN, United States
- 3Department of Bacteriology, University of Wisconsin—Madison, Madison, WI, United States
- 4Thayer School of Engineering, Dartmouth College, Hanover, NH, United States
The cellulolytic bacterium Clostridium thermocellum is a promising candidate for lignocellulosic biofuel production; however, ethanol titer needs to be improved for commercialization. To understand the factors limiting ethanol titer in C. thermocellum, we developed a cell-free extract reaction (CFER) system. We demonstrated that 15 mM cellobiose could be converted, in vitro, to 25 mM ethanol and that this reaction functions both at thermophilic (55°C) and mesophilic (37°C) temperatures. Although the yield was similar to that produced by whole cells, the rate was much slower (~0.5 vs. 12 mM/h). In order to reliably quantify metabolites, rapid CFER quenching is necessary. Among the methods tested, filtration with a 3-kDa molecular weight cutoff filter proved to be the most effective. Metabolomic analysis revealed high levels of glucose-6-phosphate (G6P) and fructose-6-phosphate (F6P) in the CFER, identifying potential rate-limiting enzymes downstream of F6P. NADH was also found to accumulate in the CFER, suggesting that NADH recycling is rate-limiting. We used two complementary strategies to identify enzymes that limit metabolic flux, including feeding different substrates and supplementing with exogenous enzymes. In the enzyme addition experiment, the largest improvement was observed with the addition of yeast alcohol dehydrogenase (ADH), indicating a limitation at that reaction. The development of a CFER system for C. thermocellum, combined with detailed measurements of intermediate metabolites, allowed us to directly observe the metabolism of this organism, and suggested several potential metabolic engineering interventions for increasing ethanol titer. This demonstrates a technique that may be of general use for metabolic engineering in non-model organisms.
Introduction
Clostridium thermocellum is a cellulolytic thermophilic bacterium that is a good candidate organism for conversion of lignocellulosic biomass to biofuels, such as ethanol, through consolidated bioprocessing (CBP). CBP is a cost-effective approach for biofuel production, which combines enzyme production, biomass solubilization, and fermentation into a single step (Olson et al., 2012). Efforts in the past few years have focused on improving the ethanol yield of C. thermocellum, and several strategies including deleting competing pathways and introducing heterologous genes have been successfully used to increase the ethanol yield to 75% of the theoretical maximum (Tian et al., 2016; Hon et al., 2018). However, the maximum titer achieved so far is 27 g/L (Tian et al., 2016), and it needs to be increased to at least 40 g/L for commercial application (Dien et al., 2003).
One reason for the limitation of ethanol titer is ethanol toxicity. Wild-type C. thermocellum is inhibited by ethanol concentrations as low as 10 g/L and is completely unable to grow in 20 g/L of ethanol (Brown et al., 2011). However, it has been shown that wild-type C. thermocellum can be adapted to tolerate 50–70 g/L of ethanol (Williams et al., 2007; Shao et al., 2011). Ethanol tolerance was also studied in C. thermocellum with respect to membrane composition changes (Herrero et al., 1985; Williams et al., 2007; Timmons et al., 2009) and metabolic enzyme changes (Brown et al., 2011; Shao et al., 2011). One particular finding is that mutations in the bifunctional alcohol dehydrogenase enzyme (AdhE) result in increased ethanol tolerance in C. thermocellum (Brown et al., 2011; Tian et al., 2019). Since adapted C. thermocellum will grow at higher ethanol concentrations than it will produce, metabolic phenomena such as mass action leading to accumulation of metabolites and/or allosteric control appear to be more likely explanations than loss of biophysical function. Identifying limitations to ethanol production is an important goal in our efforts to engineer C. thermocellum for biofuel production.
C. thermocellum uses the Embden–Meyerhof–Parnas (EMP) glycolysis pathway to generate pyruvate from sugars (cellobiose or glucose). It differs from the canonical pathway in several ways (Zhou et al., 2013). Three key enzymes of the pathway: hexokinase (HK), phosphofructokinase (PFK), and phosphoglycerate kinase (PGK) use different cofactors (PPi/Pi or GTP/GDP) instead of the (ATP/ADP) pair usually associated with these reactions. Another key enzyme, pyruvate kinase (PYK), is not present, and its function is substituted by the malate shunt (Olson et al., 2016) and a reversible enzyme: pyruvate phosphate dikinase (PPDK) (see Figure 1 for a description of the pathway). The overall thermodynamic driving force in C. thermocellum glycolysis is less than a typical EMP pathway, which may explain why this microbe is more sensitive to the product (i.e., ethanol) accumulation (Dash et al., 2019).
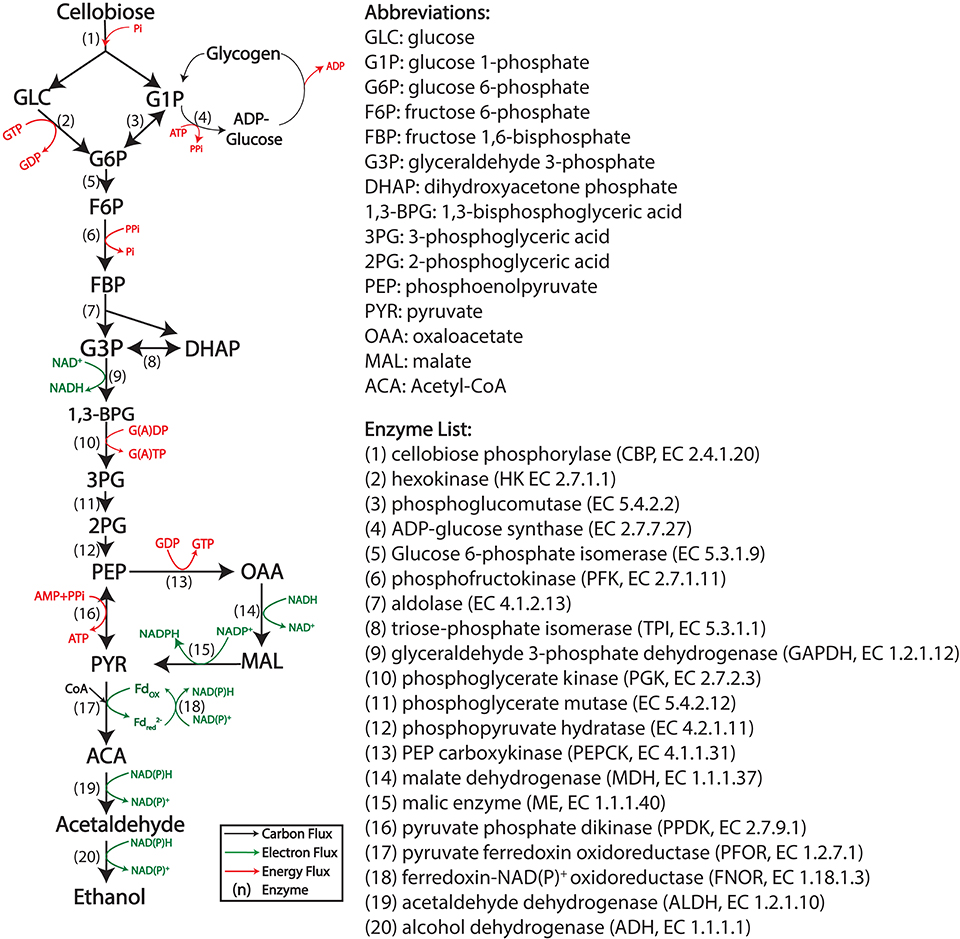
Figure 1. The cellobiose to ethanol pathway in Clostridium thermocellum. Energy cofactors are shown in red, electron carrier cofactors are shown in green. Enzymatic reactions are numbered.
Cellular metabolism is a complex system involving many simultaneous chemical reactions with various enzymes and metabolites. To understand complex systems, it is desirable to be able to study individual components and small subassemblies, but this is not always possible with whole cells, since many potential substrates are not transported across the membrane, and potentially interesting metabolic modifications cannot be performed because of problems with toxicity (Valliere et al., 2019; Wong et al., 2019). Furthermore, many genetic modifications are slow, particularly in non-model organisms. These challenges motivate the search for other tools, including the use of cell-free extract reaction systems.
A variety of products, including biofuels (Welch and Scopes, 1985; Krutsakorn et al., 2013; Karim and Jewett, 2016), value-added chemicals (Babich et al., 2011; Keller et al., 2013), and drug precursors (Kawai et al., 2003; Liu et al., 2006; Harper et al., 2012) have been successfully produced using cell-free systems. In particular, cell-free ethanol production has been demonstrated using purified enzymes from Saccharomyces cerevisiae and E. coli (Welch and Scopes, 1985; Guterl et al., 2012; Stevenson et al., 2012) or using crude cell lysate from Zymomonas mobilis (Algar and Scopes, 1985; Scopes and Griffiths-Smith, 1986) and S. cerevisiae (Khattak et al., 2014). The cell-free system is versatile because it allows direct access to the catalytic machinery and direct manipulations of the system. Without the constraints of specific transport mechanisms or the cell membrane, one can easily supplement the cell-free system with intermediate metabolites, which has been demonstrated in several studies where pathway intermediates (PEP, pyruvate, actyl-CoA) were used as substrate (Bogorad et al., 2013; Korman et al., 2014; Zhu et al., 2014; Kay and Jewett, 2015). In addition, it has been shown that it is possible to find bottleneck enzymes in a cell-free system by changing the concentration of each enzyme in the reconstituted pathway (Stevenson et al., 2012; Zhu et al., 2014; Korman et al., 2017) or by adding extra enzymes during in vitro fermentation (Bujara et al., 2011).
The use of cell-free systems to characterize physiology and prototype metabolic engineering strategies is particularly impactful in non-model organisms, like thermophilic bacteria or obligate anaerobes, where genetic tools would otherwise limit progress. For this reason, we set out to develop a cell-free system in a thermophilic obligate anaerobe, C. thermocellum.
Materials and Methods
Strains, Media, and Growth Condition
All reagents used in this study were obtained from Sigma Aldrich or Fisher Scientific, unless otherwise noted.
The strain used for the CFER is an engineered strain of Clostridium thermocellum DSM1313: LL1570, which was engineered for increased ethanol production by introducing genes from Thermoanaerobacterium saccharolyticum, including adhA, nfnAB, adhE, ferredoxin, and pfor; and deletion of native pfor genes. The complete genotype of this strain is DSM1313 ΔhptΔclo1313_0478 PClo1313_2638::adhA(Tsc)-nfnAB(Tsc)-adhEG544D (Tsc)Clo1313_2637::PpforA(Tsc)pforA(Tsc)-fd(Tsc)ΔClo1313_0020-0023ΔClo1313_1353-1356ΔClo1313_0673ΔClo1313_0382-0385ΔClo1313_1615-1616 (Hon et al., 2018).
C. thermocellum strains were grown at 55°C under anaerobic conditions in conical tubes in an anaerobic chamber (Coy Laboratory Products, Grass Lakes, MI, USA) with the hydrogen concentration in the anaerobic chamber maintained at a minimum of 1.5%. Defined MTC-5 medium and rich medium CTFUD were used to culture C. thermocellum.
MTC-5 medium was prepared by combining six solutions (A–F), filter sterilized by a vacuum filtration/storage system (Corning catalog No. 430517) and kept inside the anaerobic chamber. All concentrations describe the final 1 × concentration. Solution A contained 5 g/L of cellobiose or 10 g/L of glucose and 9.25 g/L of MOPS sodium salt, and was prepared at 1.1 × concentration. Solution B contained 2 g/L of potassium citrate monohydrate, 1.25 g/L of citric acid monohydrate, 1 g/L of Na2SO4, 1 g/L KH2PO4, 2.5 g/L of NaHCO3, and was prepared at 25 × concentration. Solution C contained 2.0 g/L of urea and was prepared at 50 × concentration. Solution D contained 1 g/L of MgCl2·6H2O, 0.2 g/L of CaCl2·2H2O, 0.1 g/L of FeCl2·6H2O, 1 g/L of L-cysteine HCl monohydrate, and 1 ml of Solution F, and was prepared at 50 × concentration. Solution E contained 0.02 g/L of pyridoxamine HCl, 0.004 g/L of p-amino benzoic acid (PABA), 0.004 g/L of D-biotin, and 0.002 g/L of vitamin B12, and was prepared at 50 × concentration. Solution F (trace minerals) contained 0.005 g/L of MnCl2·4H2O, 0.005 g/L of CoCl2·6H2O, 0.002 g/L of ZnCl2, 0.001 g/L of CuCl2·2H2O, 0.001 g/L of H3BO3, 0.001 g/L of Na2MoO4·2H2O, and 0.001 g/L of NiCl2·6H2O, and was prepared at 1,000 × concentration. All six solutions were sterilized through a 0.22-μm filter and purged with nitrogen gas. Solutions B–F were stored at 4°C for up to 6 months; solution A was always prepared fresh. The final pH was adjusted to 7.0. CTFUD medium was prepared as previously described (Olson and Lynd, 2012).
Cell-Free Extract Preparation
C. thermocellum cells were grown in an anaerobic chamber in MTC-5 medium containing 5 g/L of cellobiose and harvested in the exponential phase of growth (OD600 between 0.4 and 0.6). In several cases (described below), rich medium (CTFUD) with glucose as the substrate was used. To prepare cell-free extracts (CFE), cells were collected by centrifugation at 7,000 RCF for 15 min. Cell pellets were then transferred to the anaerobic chamber to prepare for lysis. Cell pellets from a 100-ml culture were resuspended in 1 ml of the CFER buffer. The composition of the CFER buffer is listed in Table 1. Resuspended cells were lysed with 1 μl of Ready-Lyse lysozyme solution (Epicenter, WI, USA) and incubated at room temperature (25°C) for 20 min. Then 1 μl of DNase I solution (Thermo Scientific, MA, USA) was added to reduce the viscosity of the solution, and it was incubated for an additional 20 min at room temperature. The crude lysate was centrifuged at 21,100 RCF for 5 min in the anaerobic chamber, and the supernatant was collected as CFE. The total amount of protein in the CFE was determined by Bradford assay, using bovine serum albumin (Thermo Scientific) as the standard.
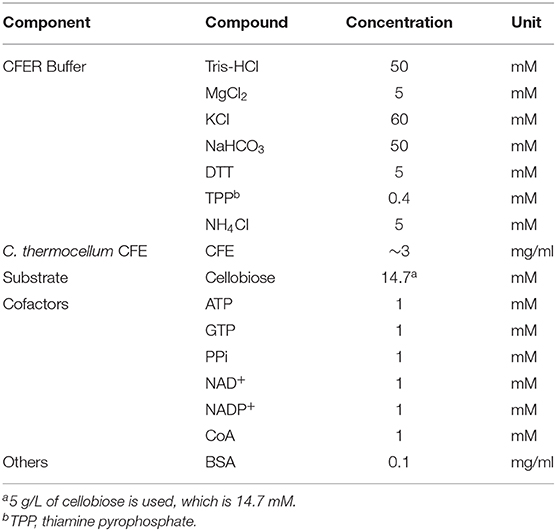
Table 1. CFER assay mixture.
Cell-Free Extract Reaction and Control Reaction Setup
Cell-free extract reactions (CFER) were performed in a 1-ml volume in 1.5-ml Eppendorf tubes and incubated at 37°C in the anaerobic chamber. As described below, an incubation temperature of 55°C was used during initial optimization. The standard reaction contained CFE (~3 mg/ml), substrate (5 g/l of cellobiose or others as specified in the Results section), and cofactor mix [1 mM each of ATP, GTP, PPi, NAD+, NADP+, and Coenzyme A (CoA)]. BSA, 0.1 mg/ml, was added to stabilize the enzymes in the CFE. For assays with purified enzyme addition, the final enzyme activity was adjusted to 3 U/ml. The enzymes used in this study are: hexokinase (HK) from Saccaromyces cerevisiae (H4502; Sigma-Aldrich), phosphofructose kinase (PFK) from Bacillus stearothermophilus (F0137; Sigma-Aldrich), pyruvate kinase (PYK) from rabbit muscle (P1506; Sigma-Aldrich), lactate dehydrogenase (LDH) from rabbit muscle (L2500; Sigma-Aldrich), pyruvate decarboxylase (PDC) from Saccaromyces cerevisiae (P5474; Sigma-Aldrich), and alcohol dehydrogenase (ADH) from S. cerevisiae (A3263; Sigma-Aldrich).
To compare the CFER with in vivo fermentation, washed whole cells were used as controls. To prepare for control reactions, cell pellets were resuspended in 1 ml (the same volume as the CFER system it was being compared to) of MTC-5 medium containing 5 g/L of cellobiose and incubated at 55°C in the anaerobic chamber.
Metabolite Concentration Measurements
During the course of a 48-h incubation, samples were taken at multiple timepoints from the CFER (and whole-cell controls) to measure metabolite concentrations. High-pressure liquid chromatography (HPLC) was used to analyze cellobiose, glucose, pyruvate, ethanol, acetate, formate, and lactate. Liquid chromatography-mass spectrometry (LC-MS) was used to measure glycolytic intermediates (e.g., G6P, FBP, and PEP) and cofactors (e.g., CoA, NADH) (Jacobson et al., 2019).
Fermentation End Product Analysis by HPLC
To prepare for HPLC samples, 50 μl of CFER sample was acidified with 0.5% H2SO4, followed by centrifugation at 21,100 relative centrifugal force (RCF) for 5 min. Supernatant was collected, and the fermentation products were quantified by HPLC with refractive index detection using an Aminex HPX-87H column (Bio-Rad, Hercules, CA, USA) with a 2.5 mM sulfuric acid solution mobile phase (Holwerda et al., 2014).
Quenching CFER for Intermediate Metabolite Measurement
To ensure accurate intermediate metabolite measurements, we tested the effectiveness of different quenching methods. Eight different quenching methods (QMs) were tested. Method A is the no-quenching control: the samples were diluted 1:10 in Tris-HCl buffer (50 mM, pH = 7.5). Quenching methods B, C, and D all use cold (−20°C) solvent (40:40:20, methanol:acetonitrile:H2O), followed by overnight storage at different temperatures (4°C for B, −20°C for C, and −80°C for D). Samples were diluted 1 in 10 in the solvent. Method E uses an Amicon Ultra protein purification column to filter out proteins larger than 3 kDa in the samples. Up to 500 μl of the samples was loaded to the filter and centrifuged at 14,000 × g at 4°C for 30 min. Method F uses boiling for 1 h to denature proteins. Method G uses 0.5% H2SO4 to acidify and denature proteins. Method H uses 0.5 M perchloric acid to acidify and denature proteins (Algar and Scopes, 1985). All samples were diluted 1:10 after quenching. In methods A, E, F, G, and H, samples were diluted in 50 mM Tris-HCl buffer before quenching, and in methods B, C, and D, samples were diluted in the solvent. Samples were stored at −80°C after quenching. After loading samples into the LC-MS instrument, they were kept at 4°C prior to injection.
To test for metabolite degradation due to quenching, we first tested the methods on a standard mix (STD) containing 500 μM of 22 metabolites (glucose, G1P, G6P, F6P, FBP, DHAP, 3PG, PEP, malate, pyruvate, acetyl-CoA, CoA, NAD+, NADH, NADP+, NADPH, ATP, ADP, AMP, GTP, GDP, GMP). Relative metabolite concentrations were measured before and after quenching, and a ratio calculated by equation [1] was used to show the degradation of each metabolite. Peak area is calculated in the EL-MAVEN software as the peakAreaTop measurement, which is the average of the intensity of the top three points of the peak (Clasquin et al., 2012).
To test the efficiency of quenching, we then tested the methods on cell-free extract (CFE). Freshly prepared CFE was quenched, and residual protein concentration as well as residual enzyme activities were measured. Protein concentration was measured by Bradford assay.
Residual PFK and GAPDH enzyme activities were measured from the quenched CFE by spectrophotometer-based enzyme assays.
Phosphofructokinase (PFK, EC 2.7.1.11) activity was measured by coupling with three other enzymes as previously described (Zhou et al., 2013) with the following modifications. The assay mixture contained 1 × CFE buffer (Table 1), 1 mM PPi, 0.15 mM NADH, 1 mM fructose 6-phosphate, 4 U/ml of aldolase, 4 U/ml of α-glycerophosphate dehydrogenase, 4 U/ml of triosephosphate isomerase, and 100 μl of quenched CFE. The disappearance of NADH was followed by photometric observation at 340 nm (ε = 6.3 mM−1 cm−1). The assay was started with 2 mM PPi.
Glyceraldehyde 3-phosphate dehydrogenase (GAPDH, EC 1.2.1.12) activity was measured by the formation of NADH as previously described (Tian et al., 2017) with the following modifications. The assay mixture contained 1 × CFE buffer (Table 1), 10 mM sodium arsenate, 10 mM glyceraldehyde-3-phosphate, 0.5 mM NAD+, and 100 μl of quenched CFE. The formation of NADH was followed by increase in absorbance at 340 nm. The assay was started with glyceraldehyde-3-phosphate.
To test all residual enzyme activities, quenched CFE samples were mixed with STD and kept at 4°C before loading on the LC-MS to measure changes in metabolite concentrations. (Note: since each sample takes about 30 min to run, in a large dataset, the first sample may only be incubated at 4°C for a few minutes, while the last sample may be incubated at 4°C for a whole day. To simulate the worst-case scenario, after storing our quenched samples at −80°C, we then incubated them for 1 day at 4°C before loading them on the LC-MS instrument.) The concentration of each metabolite in the standards was measured from the mixtures, quenched CFE samples, and non-treated STD controls. A ratio of each metabolite as described in equation [2] was calculated to indicate the change in metabolite concentrations due to residual enzyme activity.
Metabolite Measurement by LC-MS
To prepare for LC-MS analysis, samples were thawed on ice, diluted 1:10 in Solvent A [97:3 water:methanol with 10 mM tributylamine (TBA), adjusted to pH 8.2 with ~10 mM acetic acid] and injected to the LC-MS system, consisting of a Thermo Scientific Vanquish UHPLC coupled by heated electrospray ionization (HESI; negative mode) to a hybrid quadrupole-high-resolution mass spectrometer (Q Exactive Orbitrap, Thermo Scientific) for detection of targeted compounds based on their accurate masses and retention times. Liquid chromatography (LC) separation was achieved using an ACQUITY UPLC BEH C18 column (1.2 × 100 mm column, 1.7-μm particle size) and a flow rate of 0.2 ml/min. Total run time was 25 min with a gradient of differing ratios of Solvent A and Solvent B (100% methanol) as follows: at 0 min, 5% Solvent B; from 2.5 to 17 min, linear increase from 5% Solvent B to 95%; from 17 to 19.5 min hold at 95% Solvent B; from 19.5 to 20 min return to 5% Solvent B; from 20 to 25 min hold at 5% Solvent B. Mass spectrometry parameters were full MS-SIM (single ion monitoring) negative mode scanning for m/z values between 70 and 1,000 from time 0–18 min. Automatic gain (ACG) target was set to 1e6, maximum injection time (IT) to 40 ms and resolution to 70,000 full width at half maximum (FWHM). Metabolite peaks were identified using El-MAVEN 0.6.1 (Elucidata Inc.) and quantified using external standards. The standards concentration ranges from 0.1 to 400 μM, and quantification was performed by piecewise linear interpolation as the response was not linear.
Results and Discussion
Development of a Reliable CFER System for C. thermocellum
A strain of C. thermocellum engineered for improved ethanol production (strain LL1570) (Hon et al., 2018) was used to develop the CFER system. Strain LL1570 has both its native ethanol production pathway, as well as a heterologous ethanol production pathway from T. saccharolyticum (see Materials and Methods for more details) that is able to support ethanol production at 80% of the theoretical maximum yield, and a titer of 25 g/L (Hon et al., 2018). The CFE reaction mixture contained CFER buffer (Table 1), CFE (~3 mg/ml), cofactor mix, and BSA modified from the mixture described by Kwon and Jewett (2015). The CFER buffer composition was based on conditions used for individual enzyme assays of the activities involved in the cellobiose to ethanol pathway (Zhou et al., 2013; Tian et al., 2017; Cui et al., 2018). Owing to the unique cofactor specificity of several glycolytic reactions in C. thermocellum (Zhou et al., 2013), GTP, and pyrophosphate (PPi) were also included in the cofactor mix. Initially, we were able to observe ethanol production from cellobiose, but there were large variations in final ethanol titer (data not shown). To develop a reproducible CFER system for ethanol production, we optimized several aspects of the assay conditions.
Duration of storage of cell pellets, medium composition, incubation temperature, and initial cellobiose concentration were tested for their influence on CFER system function (Figure 2). Initially we prepared cell pellets in large batches, followed by storage at −80°C, following the well-established CFME (cell-free metabolic engineering) method in E. coli (Kay and Jewett, 2015; Dudley et al., 2016). However, compared with fresh cell pellets (i.e., cells grown and lysed on the same day), using pellets that were frozen at −80°C for 10 or 12 days showed a significant decrease in final ethanol production, although cellobiose consumption was the same (Figure 2A). Variations in duration of cell pellet storage at −80°C may account for the highly variable ethanol production in initial CFER tests.
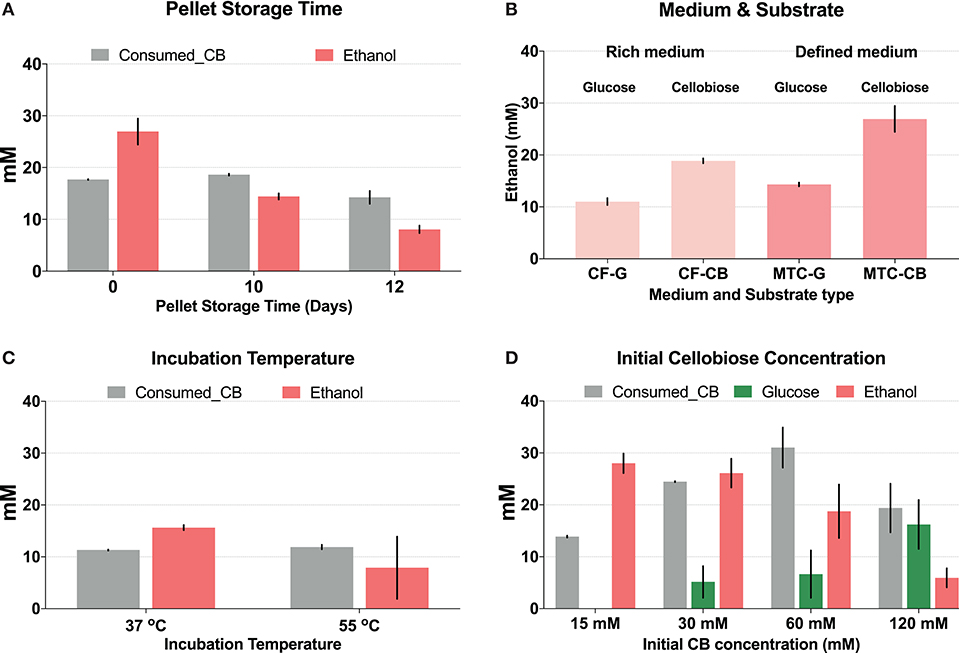
Figure 2. Optimization of the cell-free extract reaction (CFER) system for improved ethanol production. Gray bars represent consumed cellobiose, red bars represent ethanol production, and green bars represent glucose production. (A) The CFER system using cell pellets stored at −80°C for different amounts of time before lysis. Cell pellets were prepared from cells grown in MTC-5 with cellobiose as substrate and kept frozen at −80°C for 10 or 12 days. The CFER system was started with 15 mM (~5 g/L) cellobiose and incubated at 37°C for 48 h to measure ethanol production. Error bars represent one standard deviation from two replicates. (B) The CFER system using cell pellets grown in different medium and substrate combinations. CF, CTFUD; MTC, MTC-5; G, glucose; CB, cellobiose. Error bars represent one standard deviation from two replicates. (C) The CFER system incubated at different temperatures. Error bars represent one standard deviation from two replicates. (D) The CFER system with different initial cellobiose concentrations. Error bars represent 1 standard deviation from three replicates. Raw data for Figure 1 is included in Supplementary Table 2.
Growth medium and carbon substrate also were found to affect final ethanol titer (Figure 2B). CFE prepared from cells grown in defined medium (MTC-5) produced more ethanol compared to cells grown in rich medium (CTFUD). Cells grown on cellobiose produced more ethanol than cells grown on glucose. Wild-type C. thermocellum prefers to use cellobiose as a substrate over glucose (Ng and Zeikus, 1982; Hernández et al., 1985), and strain LL1570 has a longer lag phase when grown on glucose, compared to cellobiose. This may explain why cellobiose-grown cells work better than glucose-grown cells for preparing lysate for CFER. In E. coli, genes in central metabolism and biosynthesis pathways are expressed at higher levels when grown in minimal medium compared to rich medium (Tao et al., 1999), and a similar phenomenon may explain our observations in C. thermocellum.
The effect of temperature on CFER ethanol production is shown in Figure 2C. Although the optimal growth temperature for C. thermocellum is 55°C, incubating the CFER system at 37°C resulted in reduced variability, compared to 55°C (Figure 2C). The exact mechanism for this is not known. One possible explanation is that metabolites and cofactors are more stable at mesophilic temperatures, as has been reported previously for DHAP and PEP (Ye et al., 2012). Another possible explanation is that there is some protective factor, which keeps C. thermocellum enzymes active at 55°C in whole cells that is lost when cells are lysed. For example, high protein concentrations are known to stabilize proteins (Welch and Scopes, 1985; Hodgman and Jewett, 2012), and the protein concentration in the CFER system is at least 10-fold lower than in whole cells (Welch and Scopes, 1985). It is interesting that the effect of temperature on CFER function is similar to that of long-term storage at −80°C: cellobiose consumption is unchanged, but ethanol production decreases at high temperatures. This suggests that the initial steps in the cellobiose to ethanol pathway are more robust than the later steps.
In initial CFER experiments with 15 mM cellobiose, the substrate was completely consumed within 48 h. To determine whether additional substrate could allow more ethanol production, we tested initial cellobiose concentrations of 30, 60, and 120 mM (Figure 2D). More cellobiose was consumed with increased substrate concentration; however, no concentrations >15 mM showed complete consumption. Ethanol production remained the same with 30 mM cellobiose and was markedly decreased when the initial cellobiose was increased to 60 or 120 mM. The reduced ethanol production corresponded to accumulation of glucose in these groups (Figure 2D). In C. thermocellum, the conversion of glucose to G6P required GTP (Zhou et al., 2013), and thus, a lack of GTP regeneration may explain the glucose accumulation at high cellobiose concentrations.
Our final system, which we used for subsequent experiments, included CFE from C. thermocellum cells grown on the same day, cultured in defined MTC-5 medium using 15 mM cellobiose as substrate. During assays, the CFER was incubated at 37°C.
Ethanol Fermentation in C. thermocellum CFER vs. in vivo Fermentation
Next, we tested the ability of the CFER system to recapitulate in vivo fermentation behavior. To maintain equal amounts of enzymes, the same amount of starting material was used for each condition. From a 100-ml culture, the cells were divided into two aliquots. One was lysed and used in a 1-ml CFER system. The other was resuspended in 1 ml of growth medium. The whole-cell control was incubated at 55°C, while the CFER system was incubated at 37°C.
The whole-cell control rapidly consumed cellobiose to produce ethanol, acetate, and formate in the first 2 h of fermentation (Figure 3A), with molar ethanol:acetate:formate ratios of roughly 3:1:1. Maximum ethanol production was reached at 5 h, where 25.6 mM ethanol (with 7.2 mM acetate and 7.9 mM formate) was produced from 13.7 mM cellobiose. The rates of cellobiose consumption and production of ethanol, acetate, and formate in the first 2 h were 12.4, 12.2, 3.3, and 4.3 mM/h, respectively. The carbon recovery of total fermentation products in whole-cell controls was 67% at 2 h and 79% at 48 h.
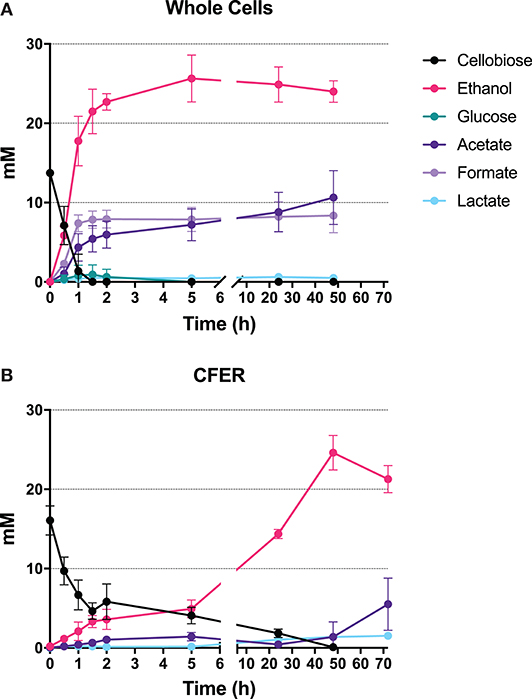
Figure 3. Fermentation products from intact cells and CFER. (A) Cells were harvested from a 50-ml culture, then resuspended in 1 mL of MTC-5 medium containing 15 mM cellobiose as substrate and incubated at 55°C for 48 h. (B) CFER was performed in a 1-ml volume by mixing CFE prepared from a 50-ml culture with CFE buffer, cofactors, and 15 mM cellobiose. The CFER was incubated at 37°C under anaerobic conditions. Error bars represent 1 standard deviation calculated from six replicates. Raw data included in Supplementary Table 3.
Several aspects of the CFER system were similar to those of the whole-cell control. Cellobiose was rapidly consumed in the first hour, and the final ethanol titer was about 25 mM for both systems. There were, however, a number of differences. The rate of ethanol production was much slower in the CFER system, and it was not tightly coupled to cellobiose consumption (as was observed in the whole-cell control). Ethanol was produced rapidly at 1.79 mM/h in the first 2 h and then at a slower rate of 0.46 mM/h (3% of cells controls) from 2 to 48 h. In addition, the production of fermentation products other than ethanol (i.e., formate and acetate) was greatly reduced. The carbon recovery of CFER fermentation at 48 h was 43%, which was lower than in the whole-cell control. Despite these differences, we think that there are sufficient similarities (at least for ethanol production) such that further study of the CFER system will improve our understanding of C. thermocellum metabolism.
Assessing Different Quenching Methods to Measure Intermediate Metabolite Concentrations in the CFER
The observation that cellobiose consumption and ethanol production are not tightly coupled in the CFER system indicated that one or more intermediate metabolites were accumulating. The concentration of these metabolites was determined by LC-MS. Quenching the reactions in the CFER system is essential for accurate measurement of intermediate metabolites. For metabolite measurements in whole-cell systems, cold methanol or mixtures of methanol, acetonitrile, and water have often been used to quench metabolism, followed by filtration to remove the cells (and associated enzymes) (Winder et al., 2008; Lu et al., 2017). In cell-free systems, quenching has most commonly been achieved by acidification (Welch and Scopes, 1985; Scopes and Griffiths-Smith, 1986; Stevenson et al., 2012; Kay and Jewett, 2015), although methanol is sometimes used (Krutsakorn et al., 2013). For our preliminary experiments, we started by quenching metabolism using a cold mixture of acetonitrile, methanol, and water, which has previously been adapted for use with intact C. thermocellum cells (Olson et al., 2016; Tian et al., 2017). After observing unanticipated 3PG accumulation in our standards solution when added to the CFER system after quenching (Figure 4), we suspected that the cold solvent was not completely inactivating all of our enzymes. Direct measurement of PFK and GAPDH activity in a quenched CFER system revealed that both enzymes retained a significant amount of activity, and this prompted us to search for better quenching methods.
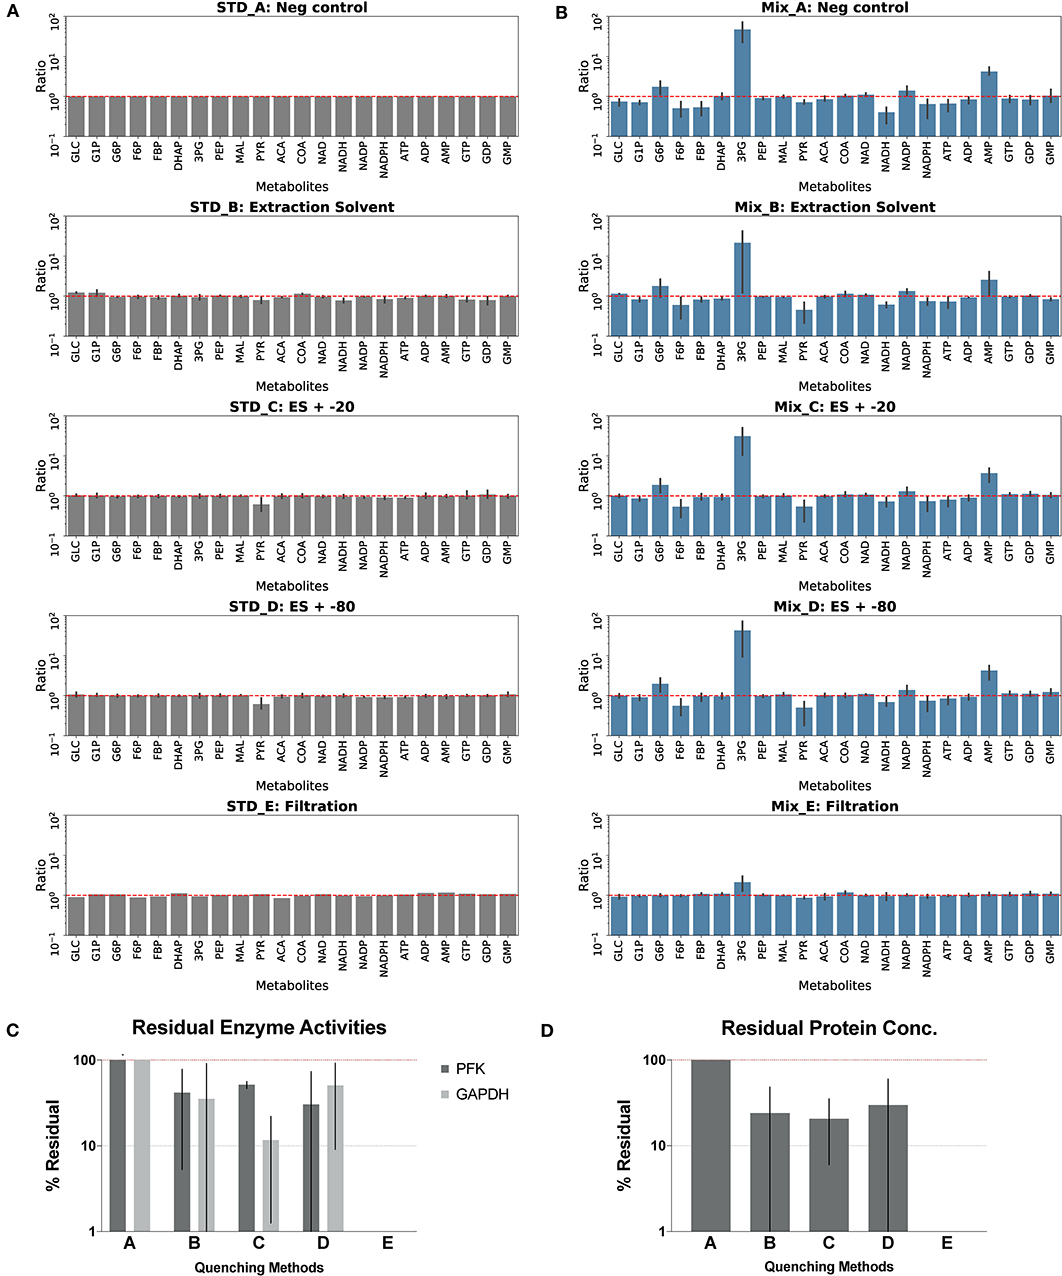
Figure 4. Assessment of quenching methods. Quenching methods A–E are: no-quenching control method A quenched with cold solvent (2:2:1 acetonitrile:methanol:water) and kept at 4°C overnight method B CFER quenched with cold solvent and kept at −20°C overnight method C CFER quenched with cold solvent and kept at −80°C overnight method D CFER filtered by Amicon Ultra 3K protein filter, method E. See Figure 1 for metabolite abbreviations. (A) Degradation of components of the standard mix is shown. Standards were treated with four different quenching methods, and the metabolite concentrations after treatment was compared to the no-quenching control (STD_A). Error bars represent one standard deviation (N = 4). Red dashed line indicates no degradation. (B) Post-quenching metabolite interconversion due to residual enzyme activity. CFER samples quenched by four methods were mixed with standards containing 500 μM of 22 metabolites and kept at 4°C before loading on LC-MS. Ratio was calculated by dividing the peak area of the mixture by the sum of peak area of standards and quenched CFE measured separately. Error bars represent one standard deviation (N = 4). Red dashed line indicates no interconversion of metabolites. (C) Residual phosphofructokinase (PFK) and glyceraldehyde 3-phosphate dehydrogenase (GAPDH) activities in the quenched CFE. Specific activities were measured and normalized to the no-quenching control (method A) Error bars represent one standard deviation (N = 3). (D) Residual protein concentration of quenched CFE. Error bars represent one standard deviation (N = 2). Raw data for (A,B) are included in Supplementary Table 4 (unprocessed) and Supplementary Table 5 (calculated ratios). Raw data for (C,D) are included in Supplementary Table 6.
A good quenching method should eliminate all enzyme activities in the CFE and also avoid changing metabolite levels. These properties were tested for several different quenching methods (QM):solvent-based quenching (with or without freezing at −20 or −80°C), ultrafiltration with filters small enough to remove proteins (≥3 kDa), and boiling or acidification (with two different acids) to denature proteins (see details in the Materials and Methods section). We first tested each extraction method on our LC-MS standards to measure metabolite degradation. Boiling was the most destructive, eliminating all nicotinamide cofactors, as well as DHAP and PEP, and substantially modifying the adenylate charge. Acidification with either sulfuric acid or perchloric acid eliminated reduced nicotinamide cofactors (NADH and NADPH). Furthermore, the presence of strong acids (or the salts resulting from their neutralization) complicates downstream LC-MS analysis. Owing to the negative impact on metabolites, we did not pursue further optimization of the boiling or acidification quenching methods (Supplementary Figure S1). The solvent-based and filtration methods did not degrade any of the metabolites (with the possible exception of pyruvate, for quenching methods C and D, which also involved freezing) (Figure 4A).
Next, we tested methods for prevention of post-quenching metabolite interconversion. After quenching, metabolite samples were divided into two aliquots. Metabolite standards were added to one of the two aliquots, and both were measured separately. After subtracting the metabolites contributed by the CFER system, changes in metabolite concentration due to post-quenching interconversion could be observed. In Figure 4B, interconversion is seen as a deviation from a ratio of 1 (see Materials and Methods section for more details). Relative metabolite concentrations for the quenching optimization experiments are presented in the supplement (Supplementary Table 4). All of the solvent-based methods showed high levels of 3PG accumulation as well as consumption of both F6P and PYR and were similar to the no-quenching control (quenching method A). Ultrafiltration (quenching method E) showed very little post-quenching metabolite interconversion. Although there appears to be a slight accumulation of 3PG with this method, this can be explained by random variation (p = 0.4) and is thus not significant.
Finally, we tested residual protein concentration and directly measured PFK and GAPDH activity. Boiling and perchloric acid treatment were highly effective in eliminating enzyme activity. Sulfuric acid did not completely denature all proteins or eliminate GAPDH activity (Supplementary Figure S1). Solvent-based methods reduced enzyme activity and protein concentration, but a substantial (>20%) amount remained in all cases (Figure 4C). Ultrafiltration (quenching method E) (Figure 4) was the only method that completely eliminated enzyme activity and also removed all proteins. Owing to its ability to eliminate enzyme activity without disrupting metabolites, ultrafiltration is the preferred method for quenching the CFER system.
CFER With Addition of Glycolytic Intermediates
We attempted to identify potential bottleneck reactions by starting the CFER with different glycolytic intermediates as substrate, with the hypothesis that starting the reaction downstream of the limiting reaction would increase final ethanol production.
The substrates tested included glucose (GLC), glucose 1-phosphate (G1P), glucose 6-phosphate (G6P), fructose 6-phosphate (F6P), dihydroxyacetone phosphate (DHAP), phosphoenolpyruvate (PEP), malate (MAL), and pyruvate (PYR), representing most steps of the cellobiose-to-ethanol production pathway (Figure 1). Control reactions using cellobiose as a substrate were run in parallel. Substrate concentrations were normalized to 30 mM C6 equivalent (e.g., 15 mM cellobiose, 30 mM G1P, and 60 mM DHAP). Final ethanol production at 48 h is shown in Figure 5. To our surprise, none of the substrates resulted in higher levels of ethanol production (compared to cellobiose controls), and only GLC and F6P supported similar levels of ethanol production.
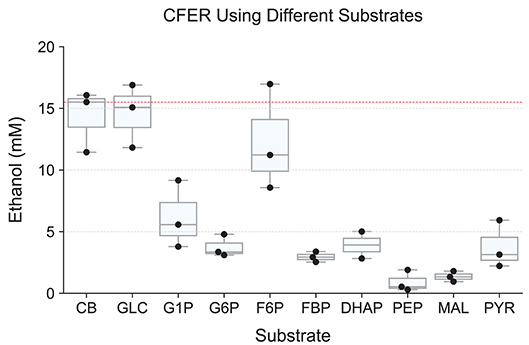
Figure 5. Starting the CFER with different metabolites as substrate. Intermediates in glycolysis were used as substrate to start the CFER in order to bypass specific enzymes. Since the substrates have different carbon backbones, the concentration used was adjusted to 30 mM C3 carbon equivalents. Explicitly, 15 mM CB, 30 mM GLC, G1P, G6P, F6P, and FBP, 60 mM DHAP, PEP, MAL, and PYR (Supplementary Table 1). Ethanol production was measured after 48 h of incubation. Individual replicates are plotted as black dots. The red dotted line represents the median production of ethanol in the CB control group. Whiskers of the boxplot represent 1.5 × interquartile range (IQR). See Figure 1 for metabolite abbreviations. Raw data included in Supplementary Table 7.
In most organisms that use glycolysis, FBP is one of the most abundant intracellular metabolites. In E. coli, levels can reach 10–20 mM (Bennett et al., 2009). In C. thermocellum, however, FBP levels are much lower (0.1–1 mM), and this has been taken as an indication that the FBP forming reaction mediated by phosphofructokinase may limit glycolytic flux, due to thermodynamic constraints (Dash et al., 2019). Although we expected to see increased ethanol production from FBP compared to F6P, we found the opposite result. F6P addition resulted in ethanol production at levels similar to the cellobiose control, while ethanol production with FBP addition was 3-fold lower (Figure 5). The PPi-linked PFK reaction is more thermodynamically reversible than the ATP-linked PFK reaction (Dash et al., 2017), and as a result, some of the initial FBP was converted to F6P (Supplementary Figure S2), which would be expected to result in a corresponding increase in PPi levels. Low levels (50 μM) of PPi have been shown to almost completely inhibit malic enzyme in C. thermocellum (Taillefer et al., 2015), and it is possible that it regulates other enzymes a well. In addition, FBP is known to regulate lactate production in C. thermocellum (Özkan et al., 2004; Lo et al., 2015), although the absence of lactate production in the presence of high levels of FBP suggests that another enzyme in the pathway is inhibited by FBP or PPi.
Another interesting comparison is the difference between starting the reaction with glucose or G6P. Final ethanol production from G6P was 3.77 mM, which was 84% less than the ethanol production from glucose. These substrates differ only by the glucokinase reaction (glucose + GTP → G6P + GDP). Furthermore, we have shown that high concentrations (20 mM) of G6P can be converted to ethanol as long as the G6P originated as cellobiose (Figure 6), which shows that a high concentration of G6P by itself does not eliminate ethanol production. The primary difference between glucose and G6P is that glucose should cause a rapid decrease in GTP levels, while G6P should not affect GTP (or cause a slight increase if it allows glucose production via glucokinase). Thus, high GTP levels are likely responsible for the low ethanol production from G6P.
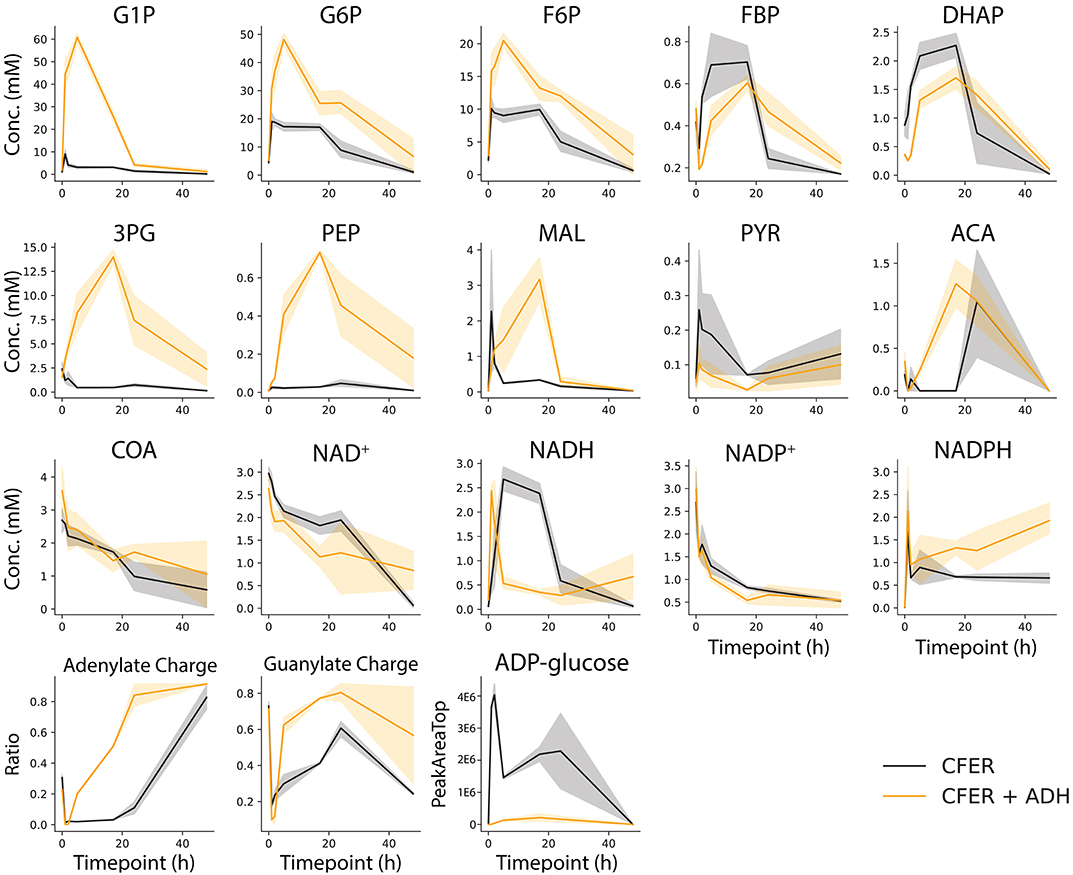
Figure 6. Intermediate metabolite concentrations in the CFER. Samples were taken from the CFER at 1, 2, 5, 17, 24, and 48 h and quenched by filtration. External standards were used to quantify each metabolite. The abbreviations used are listed in Figure 1. Energy charge was calculated by (NTP + 0.5 NDP)/(NTP + NDP + NMP), N is A or G. Black lines represent CFER with no additional enzymes, orange lines represent CFER with addition of yeast alcohol dehydrogenase (ADH) enzyme. Solid lines represent average concentration (or ratio) from four replicates, and the shaded band around the lines represents the 95% confidence interval from four replicates. Raw data included in Supplementary Table 8.
Starting the CFER with any of the metabolites downstream of F6P generated <5 mM ethanol, <8% of the theoretical yield from 30 mM C6 equivalent. Ignoring cofactor constraints, all of these substrates should allow 60 mM ethanol production. If we require nicotinamide cofactors to balance (a reasonable assumption for anaerobic systems), the ethanol yield of G3P, PEP, and PYR is reduced by half, with an expected increase in acetate production. In addition, several of the substrates have more opportunities for ATP/GTP generation by substrate-level phosphorylation (G6P, F6P, FBP, DHAP, and G3P), which could be important if energy charge limits metabolism (Supplementary Table 1). Although ethanol production does not seem to be correlated with ATP/GTP yield, the low final titer prevents us from making definitive conclusions. Pyruvate is the only substrate that led to increased production of acetate. After 48 h, 3.3 mM ethanol and 11.1 mM acetate were produced, suggesting that with pyruvate as a substrate, ethanol production may be limited by NADH availability. For C. thermocellum, the CFER system does not tolerate high levels of most metabolic intermediates.
Metabolite Concentrations in the C. thermocellum CFER
Using filtration to quench the CFER system, we measured intermediate metabolite concentrations in the CFER system at several timepoints during the fermentation (Figure 6, black lines). External standards were used for absolute quantification. During the first 5 h, most of the initial 15 mM cellobiose was consumed, but very little ethanol was produced (Figure 3B), suggesting the accumulation of glycolytic intermediates. Indeed, the accumulation of G6P (20 mM) and F6P (10 mM) can account for all of the initial cellobiose conversion (Figure 6). In addition, the ATP and GTP initially added to the CFER system were rapidly converted to ADP and GDP and, finally, AMP and GMP. This was reflected in the very low adenylate and guanylate energy charges. In yeast cell-free systems, ATP accumulation has been found to limit glycolytic flux (Welch and Scopes, 1985). This was evidently not a problem for C. thermocellum CFER systems.
The rapid conversion of GTP to GDP is expected, based on the GTP-linked glucokinase activity (glucose + GTP → G6P + GDP) reported in C. thermocellum (Zhou et al., 2013). We suspect that the initial ATP consumption is due to glycogen cycling, which results in a net conversion of ATP to PPi (ATP + Pi → ADP + PPi). ADP-glucose is a key intermediate in glycogen cycling. Although we did not have an external standard for ADP-glucose, a peak with the correct m/z ratio was observed to increase during the initial reaction period (Figure 6). The NAD+ initially added was rapidly converted to NADH in the first 5 h, suggesting high flux in upper glycolysis including GAPDH, which is responsible for NADH production. However, since the cellobiose to ethanol pathway is cofactor balanced, the accumulation of NADH at 5 h indicates that the fermentation reactions, which consume NADH (hydrogen, lactate, or ethanol production) are inhibited.
From 5 to 24 h, the concentration of G6P, F6P, and NADH gradually decreased corresponding to the gradual production of ethanol. During this time, the concentration of most other glycolytic intermediates remained relatively constant. The guanylate energy charge started to recover, indicating that GTP cofactor recycling (either due to phosphoglycerate kinase or phosphoenolpyruvate carboxykinase) was active.
Adding Purified Enzymes in CFER to Troubleshoot for Metabolic Bottlenecks
Previously, we studied the CFER system by perturbing it with different substrates. Another way to understand the CFER system is by adding different enzymes. Since our CFER system was active at 37°C, we were able to select from a wide range of commercially available enzymes including hexokinase (HK), phosphofructokinase (PFK), pyruvate kinase (PYK), lactate dehydrogenase (LDH), pyruvate decarboxylase (PDC), and alcohol dehydrogenase (ADH) (Figure 7A). Some of the enzymes were purchased as ammonium sulfate (NH4)2SO4 suspensions, so we included an ammonium sulfate buffer control. We did not observe any effect of ammonium sulfate on the CFER system (Figure 7B).
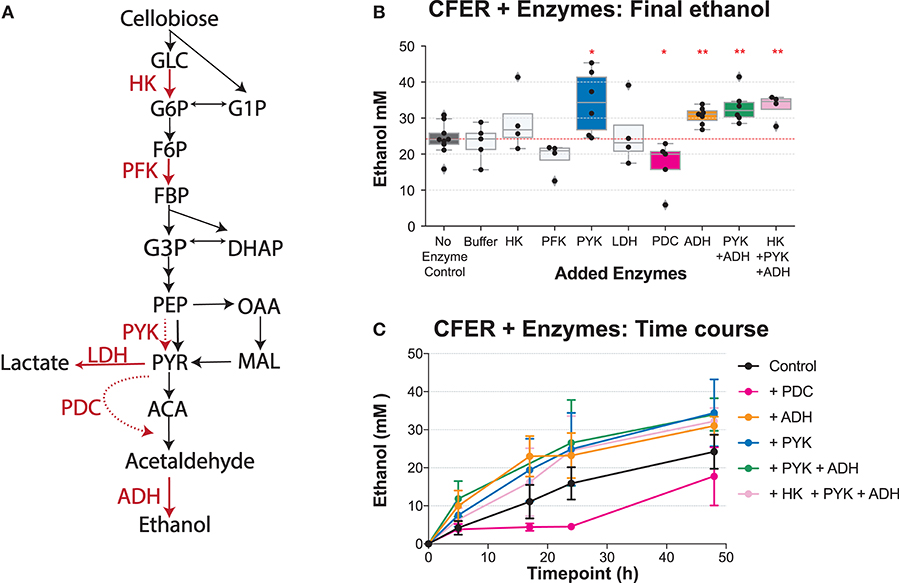
Figure 7. Adding purified enzymes to the CFER. (A) The cellobiose-to-ethanol pathway is shown. Added enzymes are highlighted in red. The dashed red lines indicate a reaction that does not exist in strain LL1570. HK, hexokinase; PFK, phosphofructokinase; PYK, pyruvate kinase; LDH, lactate dehydrogenase; PDC, pyruvate decarboxylase; ADH, alcohol dehydrogenase. (B) Final ethanol production of CFER with addition of different purified enzymes. The “Buffer” sample indicates the ammonium sulfate buffer control, since PYK, LDH, and PDC enzymes were added from ammonium sulfate stocks. All added enzymes were titrated to a final concentration of 3 U/ml. Individual paired t-tests were performed to compare different groups to the CFER control with no added enzymes; *p < 0.05 and **p < 0.01. Whiskers of the boxplot represent 1.5 × interquartile range (IQR). (C) The time course of ethanol production is shown for the subset of the reactions from (B) exhibiting significant differences in final ethanol titer. Error bars indicate 1 standard deviation (n ≥ 4). See Figure 1 for metabolite abbreviations. Raw data included in Supplementary Table 9.
In a typical glycolysis pathway, HK, PFK, and PYK are tightly controlled enzymes in response to changing cellular conditions (Berg et al., 2002). Compared to controls, we found that addition of HK or PFK had no effect. The addition of PYK, however, improved final ethanol production (Figure 7). The addition of PYK improved ethanol production, suggesting that PEP to pyruvate conversion, either via PPDK or the malate shunt, may limit ethanol production in C. thermocellum. This supports our previous observation that heterologous expression of a pyruvate kinase gene from T. saccharolyticum improves ethanol titer in C. thermocellum (Deng et al., 2014).
To test the possibility that enzymes downstream of pyruvate limit ethanol production in the CFER system, we performed experiments with three additional enzymes: lactate dehydrogenase (LDH), pyruvate decarboxylase (PDC), and alcohol dehydrogenase (ADH). Lactate production is an alternative to the ethanol production pathway for consuming pyruvate and recycling NADH. Thus, LDH can act as a relief valve for excess pyruvate and NADH. Since LDH is allosterically regulated by FBP in C. thermocellum (Van Der Veen et al., 2013) (which may explain why lactate production was <10% of total ethanol production both in vivo and in the CFER), we added purified LDH from rabbit muscle, which is not regulated by FBP.
Adding LDH resulted in only a small increase in lactate production, from 1.5 to 4.3 mM, and had almost no effect on ethanol production (Supplementary Table 9), indicating that there is no excess accumulation of pyruvate and NADH. These results suggest that the existing pyruvate to ethanol pathway in strain LL1570 is able to rapidly convert pyruvate and NADH to ethanol, and point to a metabolic bottleneck upstream of pyruvate.
The ethanol pathway in C. thermocellum consists of four steps (PFOR, FNOR, ALDH, and ADH) (Figure 1) and involves electron transfer between ferredoxin (Fd) and nicotinamide cofactors. In order to achieve ethanol production at the maximum theoretical yield, the PFOR-Fd-FNOR module has to function in the CFER system. Since Fd is an important catalyst in this system, the relatively dilute environment of the CFER system (compared to the cytoplasm in whole cells) may impair its function. To test this, we introduced a heterologous pyruvate to ethanol pathway, consisting of pyruvate decarboxylase (PDC) and alcohol dehydrogenase (ADH) (Figure 7A). To our surprise, adding PDC significantly reduced ethanol production, especially at earlier time points (Figures 7B,C). At 24 h, ethanol production following PDC addition was ~5 mM, only a third of the control value, with a final production of 18 mM. One possible explanation is that PDC generates an excess of acetaldehyde, which then inhibits metabolism, but preliminary experiments with added acetaldehyde at concentrations up to 60 mM did not show any inhibitory effects (data not shown). Another possibility is that PDC competes with PFOR for the thiamine pyrophosphate (TPP) cofactor, which both enzymes require.
Adding ADH to the CFER significantly increased ethanol production (Figures 7B,C), reaching a final production of 31 mM, 25% higher than the control. This was also surprising in light of the LDH addition experiment, which suggested that the existing pyruvate-to-ethanol pathway was sufficient. To better understand why added ADH improved ethanol production, intermediate metabolite concentrations in CFER with ADH addition were measured and shown in Figure 6 (orange lines). One effect seems to be inhibiting PFK activity, which can be seen by the increased concentrations of G1P, G6P, and F6P (relative to the control) and decreased concentrations (at initial timepoints) of FBP and DHAP. A second effect is increased activity of the GAPDH reaction, which can be seen by increases in 3PG, PEP, and MAL levels (relative to the control). As expected, this increase in lower glycolysis flux increased the adenylate charge. Since ADH directly affects NADH levels, it is clear how it could affect the GAPDH reaction. There is no obvious mechanism for its effect on the PFK reaction, however.
The most likely explanation for the results we observed with the enzyme addition experiments is that ethanol production in C. thermocellum is limited by high NADH levels, but not by pyruvate availability. Thus, adding LDH (which requires both NADH and pyruvate) did not result in high levels of lactate production, but adding ADH (which requires NADH and acetaldehyde) improved ethanol production. It also explains why adding PDC did not improve ethanol production (although the decrease in ethanol production is still a mystery).
To determine whether the improvements observed with individual enzymes could be combined, we tested combinations of ADH, PYK, and HK, but did not observe any significant differences in the multiple enzyme addition group compared to the single ADH addition group (Figure 7).
Conclusions
We report the development of a CFER system for studying the metabolism of C. thermocellum and a quenching method for performing LC-MS analysis of the intermediate metabolites. We show evidence for metabolic regulation at the PEP to pyruvate and acetaldehyde-to-ethanol conversion reactions, based on our enzyme addition experiments. Our substrate addition experiments show that C. thermocellum does not tolerate high levels most of glycolytic intermediates, indicating that there may be additional regulation in glycolysis. Replacing the malate shunt and PPDK with an efficient pyruvate kinase and increasing the ADH activity increase in vivo ethanol yields, suggesting metabolic engineering strategies for whole cells.
Data Availability Statement
All datasets generated for this study are included in the article, the Supplementary Material, and in the MetaboLights data repository, accession number MTBLS1504 (https://www.ebi.ac.uk/metabolights/MTBLS1504).
Author Contributions
JC designed experiments, performed experiments, analyzed data, and wrote the manuscript. DS, TK, and DA-N assisted with analysis and interpretation of metabolomic data. DO designed experiments and wrote the manuscript. LL obtained funding and provided guidance on the research objective. All authors contributed to manuscript revision, read and approved the submitted version.
Funding
Funding provided by the Center for Bioenergy Innovation, a U.S. Department of Energy Research Center supported by the Office of Biological and Environmental Research in the DOE Office of Science.
Conflict of Interest
LL is a founder of the Enchi Corporation, which has a financial interest in ethanol production using thermophilic bacteria such as Clostridium thermocellum.
The remaining authors declare that the research was conducted in the absence of any commercial or financial relationships that could be construed as a potential conflict of interest.
Supplementary Material
The Supplementary Material for this article can be found online at: https://www.frontiersin.org/articles/10.3389/fenrg.2020.00072/full#supplementary-material
References
Algar, E. M., and Scopes, R. K. (1985). Studies on cell-free metabolism: Ethanol production by extracts of Zymomonas mobilis. J. Biotechnol. 2, 275–287. doi: 10.1016/0168-1656(85)90030-6
Babich, L., van Hemert, L. J., Bury, A., Hartog, A. F., Falcicchio, P., van der Oost, J., et al. (2011). Synthesis of non-natural carbohydrates from glycerol and aldehydes in a one-pot four-enzyme cascade reaction. Green Chem. 13, 2895–2900. doi: 10.1039/c1gc15429j
Bennett, B. D., Kimball, E. H., Gao, M., Osterhout, R., Van Dien, S. J., and Rabinowitz, J. D. (2009). Absolute metabolite concentrations and implied enzyme active site occupancy in Escherichia coli. Nat. Chem. Biol. 5, 593–599. doi: 10.1038/nchembio.186
Berg, J. M., Tymoczko, J. L., and Stryer, L. (2002). Biochemistry, 5th Edn. New York, NY: W H Freeman.
Bogorad, I. W., Lin, T. S., and Liao, J. C. (2013). Synthetic non-oxidative glycolysis enables complete carbon conservation. Nature 502, 693–697. doi: 10.1038/nature12575
Brown, S. D., Guss, A. M., Karpinets, T. V., Parks, J. M., Smolin, N., Yang, S., et al. (2011). Mutant alcohol dehydrogenase leads to improved ethanol tolerance in Clostridium thermocellum. Proc. Natl. Acad. Sci. U.S.A. 108, 13752–13757. doi: 10.1073/pnas.1102444108
Bujara, M., Schümperli, M., Pellaux, R., Heinemann, M., and Panke, S. (2011). Optimization of a blueprint for in vitro glycolysis by metabolic real-time analysis. Nat. Chem. Biol. 7, 271–277. doi: 10.1038/nchembio.541
Clasquin, M. F., Melamud, E., and Rabinowitz, J. D. (2012). LC-MS data processing with MAVEN: a metabolomic analysis and visualization engine. Curr. Protoc. Bioinformatics Chapter 14, (Unit14.11). doi: 10.1002/0471250953.bi1411s37
Cui, J., Olson, D. G., and Lynd, L. R. (2018). Characterization of the Clostridium thermocellum AdhE, NfnAB, ferredoxin and Pfor proteins for their ability to support high titer ethanol production in Thermoanaerobacterium saccharolyticum. Metab. Eng. 51, 32–42. doi: 10.1016/j.ymben.2018.09.006
Dash, S., Khodayari, A., Zhou, J., Holwerda, E. K., Olson, D. G., Lynd, L. R., et al. (2017). Development of a core Clostridium thermocellum kinetic metabolic model consistent with multiple genetic perturbations. Biotechnol. Biofuels 10:108. doi: 10.1186/s13068-017-0792-2
Dash, S., Olson, D. G., Chan, S. H. J., Amador-Noguez, D., Lynd, L. R., and Maranas, C. D. (2019). Thermodynamic analysis of the pathway for ethanol production from cellobiose in Clostridium thermocellum. Metab. Eng. 55, 161–169. doi: 10.1016/j.ymben.2019.06.006
Deng, Y., Olson, D. G., Zhou, J., Herring, C. D., Joe Shaw, A., and Lynd, L. R. (2014). Redirecting carbon flux through exogenous pyruvate kinase to achieve high ethanol yields in Clostridium thermocellum. Metab. Eng. 22, 1–2. doi: 10.1016/j.ymben.2013.11.006
Dien, B. S., Cotta, M. A., and Jeffries, T. W. (2003). Bacteria engineered for fuel ethanol production: current status. Appl. Microbiol. Biotechnol. 63, 258–266. doi: 10.1007/s00253-003-1444-y
Dudley, Q. M., Anderson, K. C., and Jewett, M. C. (2016). Cell-free mixing of Escherichia coli crude extracts to prototype and rationally engineer high-titer mevalonate synthesis. ACS Synth. Biol. 5, 1578–1588. doi: 10.1021/acssynbio.6b00154
Guterl, J. K., Garbe, D., Carsten, J., Steffler, F., Sommer, B., Reiße, S., et al. (2012). Cell-free metabolic engineering : production of chemicals by minimized reaction cascades. ChemSusChem. 5, 2165–2172. doi: 10.1002/cssc.201200365
Harper, A. D., Bailey, C. B., Edwards, A. D., Detelich, J. F., and Keatinge-Clay, A. T. (2012). Preparative, in vitro biocatalysis of triketide lactone chiral building blocks. Chembiochem. 13, 2200–2203. doi: 10.1002/cbic.201200378
Hernández, P. E., Ordóñez, J. A., and Sanz, B. (1985). Utilization of cellobiose and D-glucose by Clostridium thermocellum ATCC-27405. Rev. Esp. Fisiol. 41, 195–199.
Herrero, A. A., Gomez, R. F., and Roberts, M. F. (1985). 31P NMR studies of Clostridium thermocellum. mechanism of end product inhibition by ethanol. J. Biol. Chem. 260, 7442–7451.
Hodgman, C. E., and Jewett, M. C. (2012). Cell-free synthetic biology: thinking outside the cell. Metab. Eng. 14, 261–269. doi: 10.1016/j.ymben.2011.09.002
Holwerda, E. K., Thorne, P. G., Olson, D. G., Amador-Noguez, D., Engle, N. L., Tschaplinski, T. J., et al. (2014). The exometabolome of Clostridium thermocellum reveals overflow metabolism at high cellulose loading. Biotechnol. Biofuels 7:155. doi: 10.1186/s13068-014-0155-1
Hon, S., Holwerda, E. K., Worthen, R. S., Maloney, M. I., Tian, L., Cui, J., et al. (2018). Expressing the Thermoanaerobacterium saccharolyticum pforA in engineered Clostridium thermocellum improves ethanol production. Biotechnol. Biofuels 11:242. doi: 10.1186/s13068-018-1245-2
Jacobson, T. B., Adamczyk, P. A., Stevenson, D. M., Regner, M., Ralph, J., Reed, J. L., et al. (2019). 2H and 13C metabolic flux analysis elucidates in vivo thermodynamics of the ED pathway in Zymomonas mobilis. Metab. Eng. 54, 301–316. doi: 10.1016/j.ymben.2019.05.006
Karim, A. S., and Jewett, M. C. (2016). A cell-free framework for rapid biosynthetic pathway prototyping and enzyme discovery. Metab. Eng. 36, 116–126. doi: 10.1016/j.ymben.2016.03.002
Kawai, T., Kubota, T., Hiraki, J., and Izumi, Y. (2003). Biosynthesis of ε-poly-L-lysine in a cell-free system of Streptomyces albulus. Biochem. Biophys. Res. Commun. 311, 635–640. doi: 10.1016/j.bbrc.2003.10.033
Kay, J. E., and Jewett, M. C. (2015). Lysate of engineered Escherichia coli supports high-level conversion of glucose to 2,3-butanediol. Metab. Eng. 32, 133–142. doi: 10.1016/j.ymben.2015.09.015
Keller, M. W., Schut, G. J., Lipscomb, G. L., Menon, A. L., Iwuchukwu, I. J., Leuko, T. T., et al. (2013). Exploiting microbial hyperthermophilicity to produce an industrial chemical, using hydrogen and carbon dioxide. Proc. Natl. Acad. Sci. U.S.A. 110, 5840–5845. doi: 10.1073/pnas.1222607110
Khattak, W. A., Ul-Islam, M., Ullah, M. W., Yu, B., Khan, S., and Park, J. K. (2014). Yeast cell-free enzyme system for bio-ethanol production at elevated temperatures. Process Biochem. 49, 357–364. doi: 10.1016/j.procbio.2013.12.019
Korman, T. P., Opgenorth, P. H., and Bowie, J. U. (2017). A synthetic biochemistry platform for cell free production of monoterpenes from glucose. Nat. Commun. 8:15526. doi: 10.1038/ncomms15526
Korman, T. P., Sahachartsiri, B., Li, D., Vinokur, J. M., Eisenberg, D., and Bowie, J. U. (2014). A synthetic biochemistry system for the in vitro production of isoprene from glycolysis intermediates. Protein Sci. 23, 576–585. doi: 10.1002/pro.2436
Krutsakorn, B., Honda, K., Ye, X., Imagawa, T., Bei, X., Okano, K., et al. (2013). In vitro production of n-butanol from glucose. Metab. Eng. 20, 84–91. doi: 10.1016/j.ymben.2013.09.006
Kwon, Y. C., and Jewett, M. C. (2015). High-throughput preparation methods of crude extract for robust cell-free protein synthesis. Sci. Rep. 5:8663. doi: 10.1038/srep08663
Liu, C., Kelly, G. T., and Watanabe, C. M. (2006). In vitro biosynthesis of the antitumor agent azinomycin B. Org. Lett. 8, 1065–1068. doi: 10.1021/ol052987l
Lo, J., Zheng, T., Hon, S., Olson, D. G., and Lynd, L. R. (2015). The bifunctional alcohol and aldehyde dehydrogenase gene, adhE, is necessary for ethanol production in Clostridium thermocellum and Thermoanaerobacterium saccharolyticum. J. Bacteriol. 197, 1386–1393. doi: 10.1128/JB.02450-14
Lu, W., Su, X., Klein, M. S., Lewis, I. A., Fiehn, O., and Rabinowitz, J. D. (2017). Metabolite measurement: pitfalls to avoid and practices to follow. Annu. Rev. Biochem. 86, 277–304. doi: 10.1146/annurev-biochem-061516-044952
Ng, T. K., and Zeikus, J. G. (1982). Differential metabolism of cellobiose and glucose by Clostridium thermocellum and Clostridium thermohydrosulfuricum. J. Bacteriol. 150, 1391–1399. doi: 10.1128/JB.150.3.1391-1399.1982
Olson, D. G., Hörl, M., Fuhrer, T., Cui, J., Zhou, J., Maloney, M. I., et al. (2016). Glycolysis without pyruvate kinase in Clostridium thermocellum. Metab. Eng. 39, 169–180. doi: 10.1016/j.ymben.2016.11.011
Olson, D. G., and Lynd, L. R. (2012). Transformation of Clostridium thermocellum by electroporation. Meth. Enzymol. 510, 317–330. doi: 10.1016/B978-0-12-415931-0.00017-3
Olson, D. G., McBride, J. E., Shaw, A. J., and Lynd, L. R. (2012). Recent progress in consolidated bioprocessing. Curr. Opin. Biotechnol. 23, 396–405. doi: 10.1016/j.copbio.2011.11.026
Özkan, M., Yilmaz, E. I., Lynd, L. R., and Özcengiz, G. (2004). Cloning and expression of the Clostridium thermocellum L-lactate dehydrogenase gene in Escherichia coli and enzyme characterization. Can. J. Microbiol. 50, 845–851. doi: 10.1139/w04-071
Scopes, R. K., and Griffiths-Smith, K. (1986). Fermentation capabilities of Zymomonas mobilis glycolytic enzymes. Biotechnol. Lett. 8, 653–656. doi: 10.1007/BF01025976
Shao, X., Raman, B., Zhu, M., Mielenz, J. R., Brown, S. D., Guss, A. M., et al. (2011). Mutant selection and phenotypic and genetic characterization of ethanol-tolerant strains of Clostridium thermocellum. Appl. Microbiol. Biotechnol. 92, 641–652. doi: 10.1007/s00253-011-3492-z
Stevenson, B. J., Liu, J. W., Kuchel, P. W., and Ollis, D. L. (2012). Fermentative glycolysis with purified Escherichia coli enzymes for in vitro ATP production and evaluating an engineered enzyme. J. Biotechnol. 157, 113–123. doi: 10.1016/j.jbiotec.2011.09.019
Taillefer, M., Rydzak, T., Levin, D. B., Oresnik, I., and Sparling, R. (2015). Reassesment of the transhydrogenase ‘malate shunt' in Clostridium thermocellum ATCC 27405 through kinetic characterization of malic enzyme and malate dehydrogenase. Appl. Environ. Microbiol. 81, 2423–2432. doi: 10.1128/AEM.03360-14
Tao, H., Bausch, C., Richmond, C., Blattner, F. R., and Conway, T. (1999). Functional genomics: expression analysis of Escherichia coli growing on minimal and rich media. J. Bacteriol. 181, 6425–6440. doi: 10.1128/JB.181.20.6425-6440.1999
Tian, L., Cervenka, N. D., Low, A. M., Olson, D. G., and Lynd, L. R. (2019). A mutation in the AdhE alcohol dehydrogenase of Clostridium thermocellum increases tolerance to several primary alcohols, including isobutanol, n-butanol and ethanol. Sci. Rep. 9:1736. doi: 10.1038/s41598-018-37979-5
Tian, L., Papanek, B., Olson, D. G., Rydzak, T., Holwerda, E. K., Zheng, T., et al. (2016). Simultaneous achievement of high ethanol yield and titer in Clostridium thermocellum. Biotechnol. Biofuels 9:116. doi: 10.1186/s13068-016-0528-8
Tian, L., Perot, S. J., Stevenson, D., Jacobson, T., Lanahan, A. A., Amador-Noguez, D., et al. (2017). Metabolome analysis reveals a role for glyceraldehyde 3-phosphate dehydrogenase in the inhibition of Clostridium thermocellum by ethanol. Biotechnol. Biofuels 10:276. doi: 10.1186/s13068-017-0961-3
Timmons, M. D., Knutson, B. L., Nokes, S. E., Strobel, H. J., and Lynn, B. C. (2009). Analysis of composition and structure of Clostridium thermocellum membranes from wild-type and ethanol-adapted strains. Appl Microbiol Biotechnol. 82, 929–939. doi: 10.1007/s00253-009-1891-1
Valliere, M. A., Korman, T. P., Woodall, N. B., Khitrov, G. A., Taylor, R. E., Baker, D., et al. (2019). A cell-free platform for the prenylation of natural products and application to cannabinoid production. Nat. Commun. 10:565. doi: 10.1038/s41467-019-08448-y
Van Der Veen, D., Lo, J., Brown, S. D., Johnson, C. M., Tschaplinski, T. J., Martin, M., et al. (2013). Characterization of Clostridium thermocellum strains with disrupted fermentation end-product pathways. J. Ind. Microbiol. Biotechnol. 40, 725–734. doi: 10.1007/s10295-013-1275-5
Welch, P., and Scopes, R. K. (1985). Studies on cell-free metabolism: Ethanol production by a yeast glycolytic system reconstituted from purified enzymes. J. Biotechnol. 2, 257–273. doi: 10.1016/0168-1656(85)90029-X
Williams, T. I., Combs, J. C., Lynn, B. C., and Strobel, H. J. (2007). Proteomic profile changes in membranes of ethanol-tolerant Clostridium thermocellum. Appl. Microbiol. Biotechnol. 74, 422–432. doi: 10.1007/s00253-006-0689-7
Winder, C. L., Dunn, W. B., Schuler, S., Broadhurst, D., Jarvis, R., Stephens, G. M., et al. (2008). Global metabolic profiling of Escherichia coli cultures: an evaluation of methods for quenching and extraction of intracellular metabolites. Anal. Chem. 80, 2939–2948. doi: 10.1021/ac7023409
Wong, M., Zha, J., Sorci, M., Gasparis, C., Belfort, G., and Koffas, M. (2019). Cell-free production of isobutanol: a completely immobilized system. Bioresour. Technol. 294:122104. doi: 10.1016/j.biortech.2019.122104
Ye, X., Honda, K., Sakai, T., Okano, K., Omasa, T., Hirota, R., et al. (2012). Synthetic metabolic engineering-a novel, simple technology for designing a chimeric metabolic pathway. Microb. Cell Fact 11:120. doi: 10.1186/1475-2859-11-120
Zhou, J., Olson, D. G., Argyros, D. A., Deng, Y., van Gulik, W. M., van Dijken, J. P., et al. (2013). Atypical glycolysis in Clostridium thermocellum. Appl. Environ. Microbiol. 79, 3000–3008. doi: 10.1128/AEM.04037-12
Keywords: biofuel, cellulose, alcohol dehydrogenase (Adh), quenching, metabolomics, pyruvate kinase (PYK)
Citation: Cui J, Stevenson D, Korosh T, Amador-Noguez D, Olson DG and Lynd LR (2020) Developing a Cell-Free Extract Reaction (CFER) System in Clostridium thermocellum to Identify Metabolic Limitations to Ethanol Production. Front. Energy Res. 8:72. doi: 10.3389/fenrg.2020.00072
Received: 13 February 2020; Accepted: 09 April 2020;
Published: 04 June 2020.
Edited by:
Michael C. Jewett, Northwestern University, United StatesReviewed by:
Yong-Chan Kwon, Louisiana State University, United StatesShihui Yang, Hubei University, China
Copyright © 2020 Cui, Stevenson, Korosh, Amador-Noguez, Olson and Lynd. This is an open-access article distributed under the terms of the Creative Commons Attribution License (CC BY). The use, distribution or reproduction in other forums is permitted, provided the original author(s) and the copyright owner(s) are credited and that the original publication in this journal is cited, in accordance with accepted academic practice. No use, distribution or reproduction is permitted which does not comply with these terms.
*Correspondence: Daniel G. Olson, dan268@gmail.com