Climate Change Projections for Tanzania Based on High-Resolution Regional Climate Models From the Coordinated Regional Climate Downscaling Experiment (CORDEX)-Africa
 Philbert Modest Luhunga1*
  Agnes L. Kijazi1 Ladislaus Chang'a1 Afredy Kondowe2 Hashim Ng'ongolo3 Habiba Mtongori1
- 1Tanzania Meteorological Agency, Research Section, Dar es Salaam, Tanzania
- 2Tanzania Meteorological Agency, Numerical Weather Prediction Section, Dar es Salaam, Tanzania
- 3Tanzania Meteorological Agency, Climatology and Climate Change Section, Dar es Salaam, Tanzania
The impacts of climate change are predicted to compromise social-economic developments in developing countries. Adaptation is the only option to reduce the impacts. However, before starting determining adaptation strategies, it is important to conduct scientific research to understand possible pathways of future climate change under different emission scenarios. This is essential for having scientific facts that would guide the formulation of effective adaptation strategies. In this study, climate change projections for Tanzania is carried out using outputs of high resolution Regional Climate Models (RCMs) from the Coordinated Regional Climate Downscaling Experiment program (CORDEX). Future (2011–2100) projections of daily rainfall, minimum and maximum temperatures under two Representative Concentration Pathways (RCPs): RCP 8.5 and RCP 4.5 are compared with baseline (1971–2000) simulations. The comparison is based on determining the departure of future climate during present (2011–2040), mid (2041–2070) and end (2071–2100) centuries from baseline (1971–2000) climate condition. Results reveal that there are likely to be an obvious increased minimum and maximum temperature trend over the entire country in three future periods (2011–2040), (2041–2070), and (2071–2100) under both emission scenarios RCP 8.5 and RCP 4.5. This is especially true for the western parts of the country, southwestern highlands and the eastern parts of Lake Nyasa where maximum temperatures are projected to be greater than 3.5°C and in the range of 2 to 2.4°C under RCP 8.5 and RCP 4.5 emission scenarios respectively. The western sides of the Lake Victoria basin and parts of Northeastern highlands are likely to feature increased minimum temperatures in the range of 4.5 to 4.8°C under RCP 8.5 emission scenario. The cold season: June-July-August-September (JJAS) is likely to become warmer than the warm season that starts from October and continue to April or May. During JJAS season, the country is likely to experience increased maximum temperature in the range of 1.7 to 2.4°C and 2 to 4°C in mid (2041–2070) and end (2070–2100) centuries respectively. Rainfall over parts of northeastern highlands and Coastal regions is projected to increase in the range of 0.5 to 1 mm/day and 0.25 to 0.5 mm/day under RCP 8.5 and RCP 4.5 emission scenarios respectively. However, the western regions, southwestern highlands and eastern side of Lake Nyasa are likely to experience decreased amount of rainfall in the range of 0.5 to 1mm/day under both RCP 8.5 and RCP 4.5 emission scenarios.
Introduction
Climate change is a threat to the survival of the human being as it has significant impacts on the environment, crop production, water resources, and livestock production (Araya et al., 2015). For instance, projected increase in temperature is expected to influence wilting and drying of plants, multiplication of pest, weeds, and diseases that would result in increased costs of crop production and failures in crop yields (United Republic of Tanzania, 2003). In addition warmer temperatures are also likely to cause an eruption of pests, new parasites and diseases that would affect a huge number of animals (IPCC, 2012).
The projected increase in rainfall is likely to influence nutrient leaching, washing away of the topsoil and water logging, pests, disease outbreaks and infrastructure damage that would result into low crop yields and disruption of food supply chain (United Republic of Tanzania, 2003; IPCC, 2007, 2013). Therefore a clear and thorough understanding of future climate change and its associated impacts at high spatial resolution and long temporal coverage is critical for formulating adequate and effective adaptation strategies for informed decision making in all socio-economic sectors.
Several studies (Mwandosya et al., 1998; Agrawala et al., 2003; de Wit and Stankiewicz, 2006; Ehrhart and Twena, 2006; Strzepek and McCluskey, 2006; Jack, 2010; Munishi et al., 2010; Ahmed et al., 2011; Arndt et al., 2011 and Rowhani et al., 2011; Wambura et al., 2014; Conway et al., 2017) have used the General Circulation Models (GCMs) to produce future climate change in Tanzania. Mwandosya et al. (1998) indicated that future rainfall over southwestern highlands of Tanzania will be decreased, while Northeastern highlands and the Lake Victoria basin will experience a slight increase in rainfall. Ahmed et al. (2011) used outputs from the GCMs to produce changes in temperatures and found that January to June growing season temperatures in the early Twenty-First century are going to be higher than in the late Twentieth century by 0.2–1.11°C should greenhouse gas concentration continues to rise. Agrawala et al. (2003) performed a more comprehensive study by reviewing climate trends and scenarios in Tanzania based on results from seventeen GCMs and found that temperatures over the country will increase by up to 2.2°C by 2100 with higher increases up to 2.6°C in June to August.
However, there are still substantial uncertainties about future climate change in Tanzania. The main uncertainties come from the fact that all previous studies were based on GCMs climate simulations which have coarse spatial resolutions to reproduce regional or local climate patterns (Jones et al., 2004). Physical and dynamical processes important in modulating regional or sub regional climate are parameterized insufficiently within the GCMs. Their outputs are therefore useful only, at global scale, but are not adequate for adaptation at regional, sub regional and local scales.
Downscaling of outputs from the GCMs is a necessary step and useful approach for obtaining high resolution and detailed climate simulations that can be used in the development of effective adaptation strategies at regional and sub regional scale. This approach is based on the assumption that large-scale weather exhibits a strong influence on local-scale weather but, in general, disregards any reverse effects from local scales upon global scales (Hewitson and Crane, 1996; Benestad et al., 2007).
There are two approaches to downscale output from the GCMs; statistical downscaling (Hewitson and Crane, 1996; Benestad et al., 2007) and dynamic downscaling (Leung et al., 2003; Di Luca et al., 2012). The earlier is a fully developed and widely used method for exploring climate condition at regional or local scale using outputs from the GCMs (Tumbo et al., 2010; Mtongori et al., 2015). It is based on the development of statistical links or transfer functions between local observations and the large scale fields such as output from the GCMs, with the main assumption that statistics from the past climate will remain valid in the future climate. The major advantage of the statistical downscaling is that it is computationally inexpensive. However, the skill of statistical downscaling depends on the choice of predictor (Fung et al., 2011). Another limitation of statistical downscaling is the stationarity problem. This is the critical assumption that the observed predictor-predictand relationships will remain valid under different forcing conditions of possible future climates (Trzaska and Schnarr, 2014).
The second downscaling approach is dynamical downscaling. This approach is based on nesting a high resolution regional climate model (RCM) within GCM and drives it using boundary condition from the GCM (Denis et al., 2002; Jones et al., 2004). The main hypothesis behind the use of high resolution RCM is that, they can simulate local climate conditions in greater details over a limited region (Denis et al., 2002). The dynamic downscaling approach provides better representation of the orographic influence on climate variables. Furthermore parameterization schemes within the high resolution RCM gridpoints produces realistic mesoscale circulation patterns (Bhuvandas et al., 2014).
Dynamical downscaling can be categorized into four types (Castro et al., 2005). The first type is when the Regional climate model (RCM) (Limited Area Model-LAM) is driven by lateral boundary conditions from a GCM or global reanalysis data at regular time interval (classically 6 or 12 h), and bottom boundary condition (terrain, sea surface temperature) and specified initial conditions. The initial global atmospheric conditions in the GCMs that provide lateral boundary conditions are not yet forgotten. This type of dynamical downscaling is used in day to day weather forecast (Chen and Kuo, 1992).
The second type is when the initial boundary conditions from global atmosphere are forgotten by the GCM or reanalysis data while the RCM still run using lateral boundary conditions from the GCMs or global reanalysis data and bottom boundary conditions. This type of downscaling is used for seasonal weather simulations. The third type is when the lateral boundary conditions are provided by the GCM forced by specific surface boundary conditions (e.g., observed SSTs) (Castro et al., 2005). This type of downscaling is also used for provision of seasonal weather prediction. The fourth type is when the lateral boundary conditions are from a completely coupled GCM in which the components of the climate system; the atmosphere-biosphere-cry sphere-ocean are coupled and interactive. This type is used to generate climate simulation for multiyear periods.
Generally, all types of dynamical downscaling are computationally expensive. At present many collaboration projects are generating climate simulation from dynamical downscaling for model inter-comparisons and impact assessments. These projects include the Coordinated Regional Climate Downscaling Experiment (CORDEX) that produce dynamical downscaled climate simulations for all continents, the North American Regional Climate Change Assessment Program (NARCCAP) that provide high resolution climate simulation for the United States, northern Mexico and Canada (Glotter et al., 2014). These projects have made available large number of high resolution climate simulations that can be used for analysis of future climate projections over different regions.
In this paper, dynamic downscaled climate simulations from high resolution-regional climate models obtained from the Coordinated Regional Climate Downscaling Experiment (CORDEX) are used to produce climate change projections for Tanzania. This study is important because the information provided is valuable for adaptation planning and impact assessment studies.
Data and Methodology
Study Area
Tanzania is located between latitudes 1°S and 12°S and longitudes 29°E to 41°E. The country has a tropical type of climate that varies across regions influenced by regional heterogeneity that covers a land area of 885,800 square kilometers that extends for more than 1,000 km2 inland from the Indian Ocean coastline (Luhunga et al., 2014). Also Tanzania has several physical features that contribute to its high local variability in its climate such as topography ranging from sea level to 1,600 m and Lake Tanganyika in the west, Mountain Kilimanjaro with altitudes of 5,895 m, and Lake Victoria in the North, River Ruvuma and Lake Nyasa in the South. Many areas of the country lie above 1,000 m altitude. The country has a complex seasonality associated with the Western Indian Ocean, Inter-Tropical Convergence Zone (ITCZ), monsoon winds, Congo air mass, tropical waves, and tropical Pacific Ocean (Black et al., 2003; Black, 2005; Anyah and Semazzi, 2007).
Tanzania experiences two types of rainfall patterns, bimodal and unimodal rainfall patterns. These rainfall patterns are influenced by the movement of the ITCZ which moves southwards in October and reaches the southern parts of the country in January or February and reverses Northwards in March, April, and May. This movement makes regions in the Southwestern, Central, Southern and Western parts of the country to receive a unimodal rainfall pattern that starts in October and continue through April or May. Whilst regions in the North, Northern coast, North-eastern highlands, Lake Victoria basin and the Island of Zanzibar receive two distinct seasonal rainfall-the short rainfall season (Vuli) that starts in October continues through December (OND) and the long rain season (Masika) that starts in March continues through May (MAM).
Seasonal rainfall over Tanzania varies significantly in space and time. The variation is higher during the short rains (Vuli) than the long rains (Masika) seasons (Zorita and Tilya, 2002). The amount of rainfall total in these seasons usually ranges from 50 to 200 mm per month, but varies greatly between regions (McSweeney et al., 2010). The annual rainfall total also varies from 200 to 1,000 mm over most part of the country. Higher amount of annual rainfall total is recorded over Southwestern and North eastern highlands. Central Tanzania is semi-arid regions that receive an annual rainfall of less than 400 mm. The annual average temperature over Tanzania ranges from 25 to 32°C. However, over the highland temperatures are slightly lower, for example, during the hot month (February) and the coldest month (July) temperature is 20°C and 10°C respectively. Other parts of the country have a temperature greater than 20°C, with the highest temperatures along the Coastal regions and western parts of the country. The season with high temperature starts in October continues through February or March, whilst the cold season start in May continues into August.
Data
Model Data
This study makes use of climate simulations from three high resolution Regional Climate Models (RCMs) forced by three General Circulation Models (GCMs) from the Coordinated Regional Climate Downscaling Experiment (CORDEX) initiative. This initiative was pioneered by the World Climate Research Program (WCRP) to produce high resolution climate datasets over different regions of the world (Gutowski et al., 2016). The Africa domain used by the CORDEX for model integration is depicted in Figure 1.
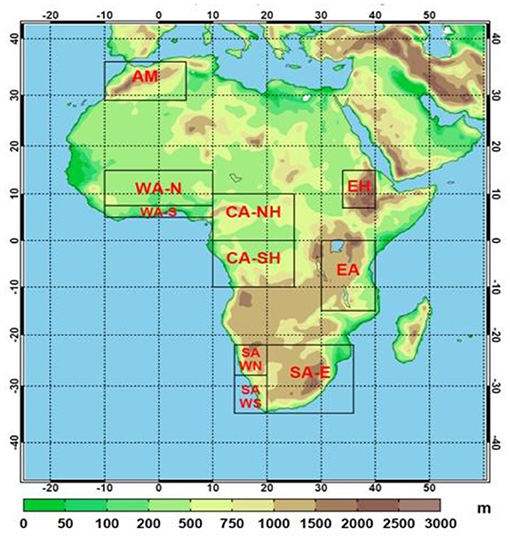
Figure 1. CORDEX domain for model integrations over Africa showing topography in (m) (taken from https://www.imk-tro.kit.edu/english/4659.php).
CORDEX archives all of its data at the Earth System Grid Federation (ESGF). The ESGF uses software that can allow the users to access all archived data in a transparent manner (Martin et al., 2013). In this study climate data from CORDEX-Africa were accessed from https://esg-dn1.nsc.liu.se/projects/esgf-liu/ website. These data sets are quality controlled and may be used according to the terms of use (http://wcrp-cordex.ipsl.jussieu.fr/). The spatial grid resolutions of all CORDEX Regional Climate Models (CORDEX_RCMs) are set to longitude 0.44° and latitude 0.44° using a rotated pole system coordinates where the models operates over an equatorial domain with a quasi-uniform spatial resolution of approximately 50 by 50 km. For a detailed description of CORDEX_RCMs and their dynamics and physical parameterization a reader may consult Nikulin et al. (2012). The CORDEX_RCMs and their driving GCMs used here are listed in Table 1. Daily values of minimum, maximum temperatures, and rainfall from CORDEX_RCMs for historical climate condition (1971–2000) and future climate projections under two Representative Concentration Pathways (RCP4.5) and (RCP 8.5) scenarios for present (2011–2040), mid (2041–2070), and end (2071–2100) centuries are used.
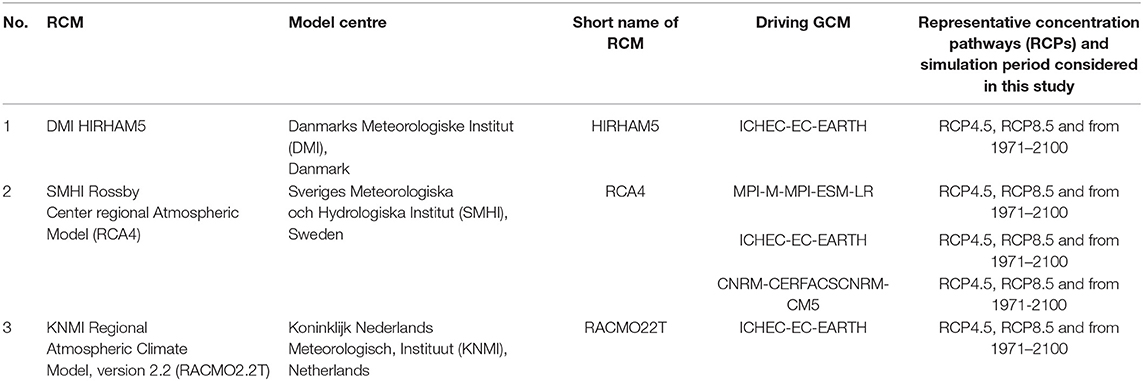
Table 1. Details of CORDEX-RCMs and the driving GCMs.
Methodology
The understanding of regional or sub regional future climate change based on individual climate model is subject to a number of uncertainties that comes from boundary conditions, natural variability within the climate models and differences in model formulations (Min et al., 2013). Figure 2 indicates projected annual cycles of maximum temperature over Tanzania during present (2011–2040), mid (2041–2070), and (2071–2100) under RCP 4.5. The figure portrays uncertainties associated with individual models in simulation of possible future maximum temperatures over Tanzania.
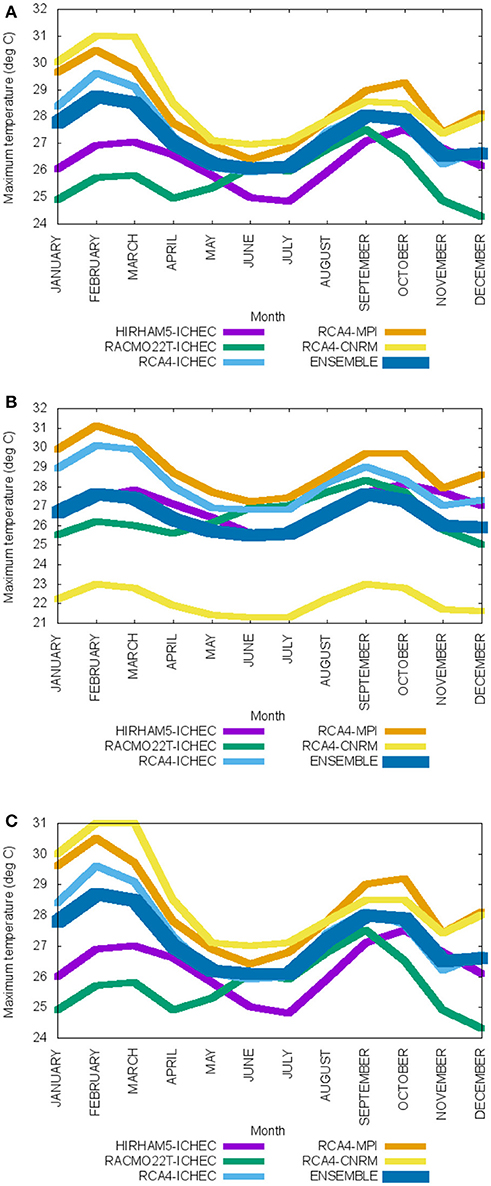
Figure 2. Projections of maximum temperature over Tanzania (A) in present (2011–2040), (B) mid (2041–2070), and (C) end (2071–2100) centuries under RCP 4.5 emission scenario.
In order to reduce the uncertainties associated by individual climate models an ensemble average or multi-model average approaches is adapted in this study. The ensemble average for present (1971–2000) and future (2011–2100) climate simulations from five RCM-GCM combinations was created and used to produce Tanzania future climate change.
The ensemble average of future climate was created based on two Representative Concentrations Pathways (RCPs): RCP 8.5 and RCP 4.5. The future climate change for Tanzania is assessed by analyzing the change in mean rainfall, minimum and maximum temperatures during present (2011–2040), mid (2041–2070), and end (2071–2100) centuries under both (RCP4.5) and (RCP 8.5) scenarios relative to the baseline period (1971–2000).
Results
The analysis of climate projection based on individual climate model is subject to an uncertainty that arises from Regional Climate Model (RCM) or from the driving General Circulation Model (GCM). To account for the uncertainties the ensemble average of 5 climate model members (HIRHAM5 and RACMO22T both forced by ICHEC-EC-EARTH, RCA4 forced by three GCMs: MPI-M-MPI-ESM-LR, CNRM-CERFACSCNRM-CM5, and ICHEC-EC-EARTH) was created and used for analysis. The results for climate projection from an ensemble average are presented here in two sub-sections. The first sub-section analyzes climate change projections within annual time series and the second sub-section analyzes climate change projections within seasonal time series.
Climate Change Projections Within Annual Time Series
The spatial distribution of maximum temperature in historical (1971–2000) and present century (2011–2040) under both RCP 8.5 and RCP 4.5 emission scenarios are presented in Figure 3. This figure shows that in the present century, the western parts of the country, Central, North, Lake Victoria basin, eastern parts of Lake Nyasa, southwestern and northeastern highlands are projected to have an increased maximum temperature in the range of 1 to 1.2°C under both RCP 8.5 and RCP 4.5 emission scenarios. The lowest increases in maximum temperature in the range of 0.4 to 0.8°C are projected to occur over Coastal regions during the present century under both RCP 4.5 and RCP 8.5 emission scenarios.
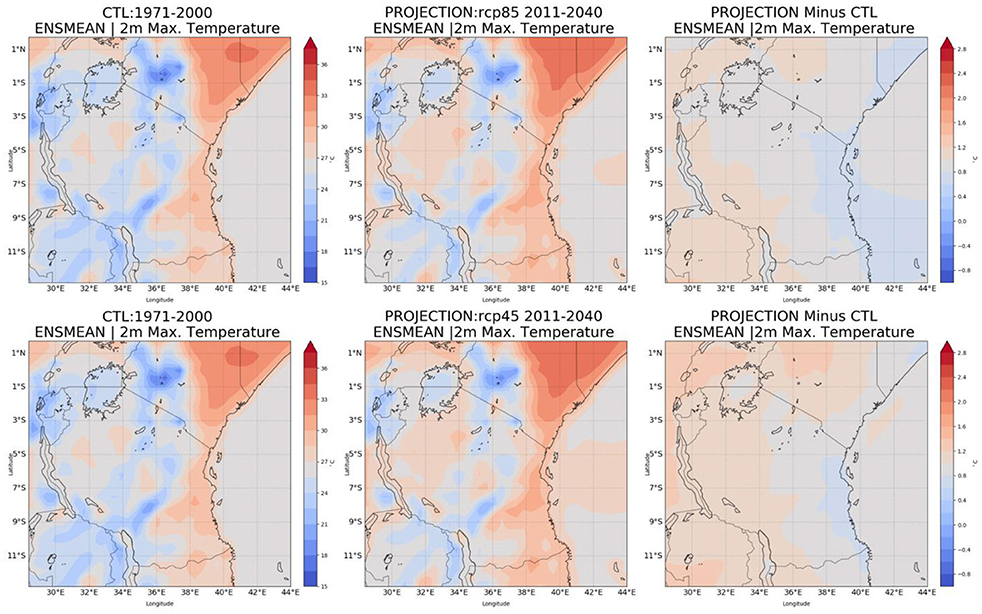
Figure 3. The average of maximum temperature during base period (1971–2000), present century (2011–2040), and the change in temperature during present century under both RCP8.5 (upper) and RCP 4.5 (lower).
The spatial distribution of maximum temperature in baseline (1971–2000) and mid century (2041–2070) climate under both RCP 8.5 and RCP 4.5 emission scenarios are presented in Figure 4. This figure shows that the maximum temperatures during the mid century are higher than those in the present century. Higher changes in the maximum temperatures in the range of 2.4 to 2.6°C and 2 to 2.2°C under RCP 8.5 and 4.5 emission scenarios respectively, are projected to occur over western regions, southwestern highlands, eastern side of Lake Nyasa and western side of Lake Victoria basin. However, lower changes in maximum temperature in the range of 1.6 to 2°C and 1 to 1.2°C are projected over the Coastal regions under RCP 8.5 and RCP 4.5 emission scenarios respectively. It seems that temperatures over the highlands of Tanzania are likely to be higher than those over the lower lands (i.e., Coastal regions).
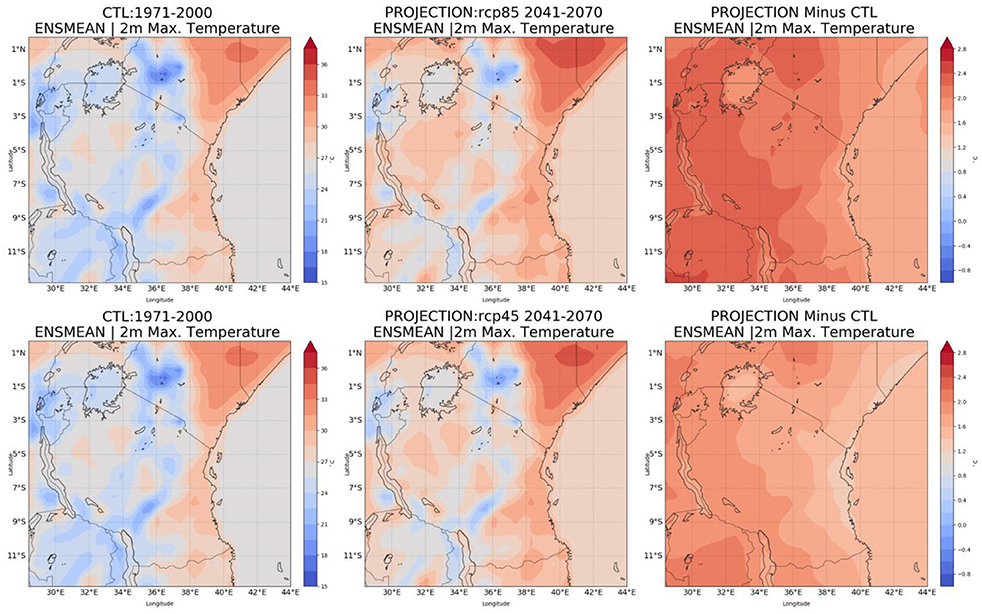
Figure 4. The average of maximum temperature during base period (1971–2000), mid century (2041–2070), and the change in temperature during mid century under both RCP8.5 (upper) and RCP 4.5 (lower).
The spatial distribution of maximum temperature in the baseline (1971–2000) and end century (1971–2100) climate are presented in Figure 5. Together with Figures 3,4, Figure 5 reveals that there are likely to be an obvious increased maximum temperature trend over the entire country in three future periods (2011–2040), (2041–2070), and (2071–2100) under both emission scenarios RCP 8.5 and RCP 4.5. This is especially true for the western parts of the country, southwestern highlands and the eastern parts of Lake Nyasa where maximum temperatures are projected to be greater than 3.5°C and in the range of 2 to 2.4°C under RCP 8.5 and RCP 4.5 emission scenarios respectively. Furthermore the eastern parts of Lake Victoria basin, parts of northeastern highlands, Central, southern, and northern regions are projected to feature increased maximum temperatures in the range of 3 to 3.5°C and 1.6 to 2°C in the end century (2071–2100) under RCP 8.5 and RCP 4.5 emission scenarios respectively. However, the Coastal region will experience lower increase in maximum temperature in the range of 2.5 to 3°C and 1.4 to 1.6°C in the end century (2071–2100) under RCP 8.5 and RCP 4.5 emission scenarios respectively.
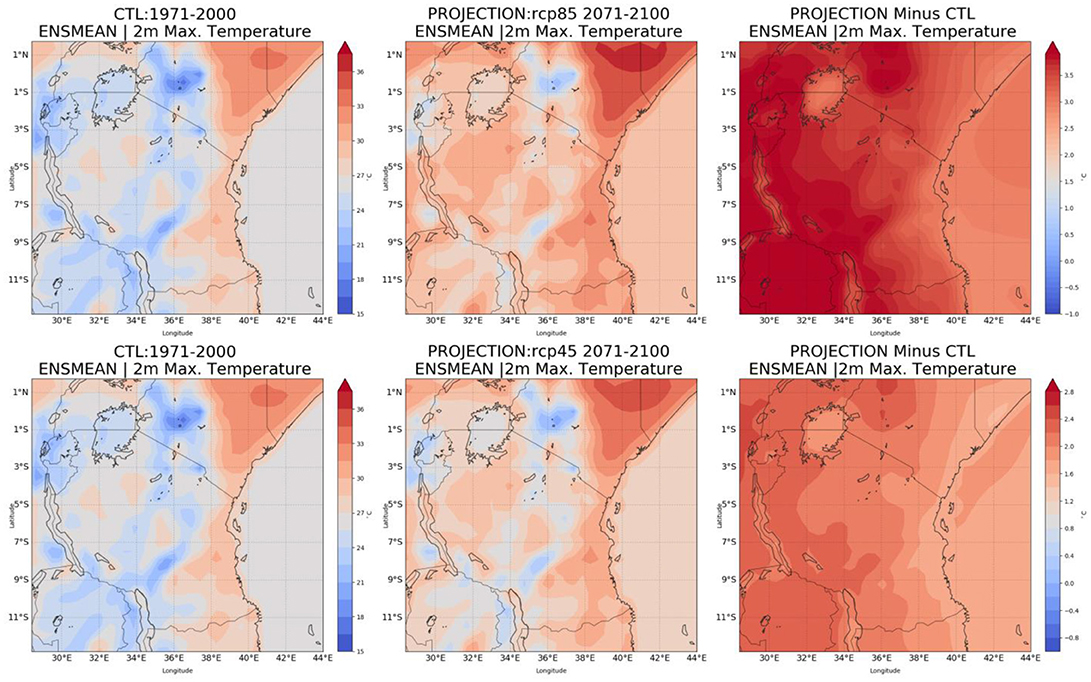
Figure 5. The average of maximum temperature during base period (1971–2000), end century (2071–2100), and the change in temperature during end century under both RCP8.5 (upper) and RCP 4.5 (lower).
To further analyze the projected increasing trends of maximum temperature across regions, we choose twenty (20) representative regions and extract the projections of maximum temperatures in three future periods (2011–2040), (2041–2070), and (2071–2100) under two emission scenarios RCP 8.5 and RCP 4.5 and compute their departure relative to the baseline period (1971–2000). Information about the selected regions is listed in Table 2. The results of the analysis are presented in Table 3. It is interesting to find that, in all representative regions, there is likely to be an obvious increasing trend of maximum temperature in three future periods, under both RCP 8.5 and RCP 4.5 emission scenarios. Under RCP 8.5, the increase in maximum temperature across representative regions is likely to be varying within the range of 0.2 to 2.4°C in the present century (2011–2040), 1.1 to 3.6°C in the mid century (2041–2070), and 2.3 to 5.2°C in the end century (2071–2100). Lower increased maximum temperature in the range of 0.2 to 2.3°C and higher increased maximum temperature in the range of 2.4 to 5.2°C are likely to occur over Tanga and Iringa regions respectively in three future periods under RCP 8.5. The higher increased maximum temperatures are likely to occur over Iringa region. This will possibly be attributed by the topography of Iringa region which is located over southwestern highlands of Tanzania at altitude of 1,428 m. While the lower increased maximum temperature over Tanga region will be possibly influenced by its location along northern Coast of Tanzania. In general regions over the highlands are projected to feature increased maximum temperature during three future periods under RCP 8.5. Under the controlled emission scenario (RCP 4.5) the maximum temperature across representative regions is likely to be varying within the range of 0.1 to 2.3°C in present century (2011–2040), 0.7 to 3°C in the mid century and 1 to 3.4°C in the end century.
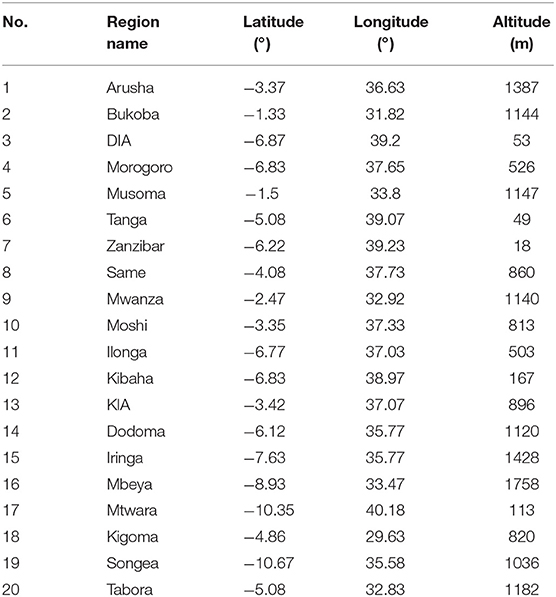
Table 2. Information of the selected representative regions.
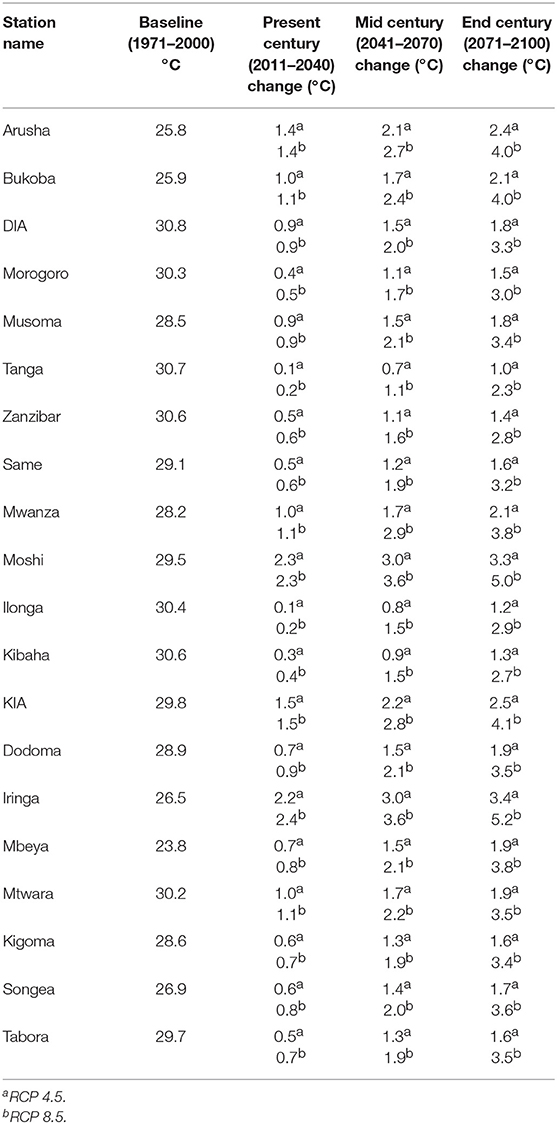
Table 3. Projected change in maximum temperature across representative regions over Tanzania.
The spatial distribution of minimum temperature in the baseline (1971–2000) and present century (2011–2040) climate are presented in Figure 6. This figure indicates that the western parts of the country, Central, North, Lake Victoria basin, eastern parts of Lake Nyasa, southwestern and northeastern highlands are projected to feature increased minimum temperature in the range of 1 to 1.4°C and 0.2 to 1.2°C under RCP 8.5 and RCP 4.5 emission scenarios respectively. The Coastal regions are projected to feature increased minimum temperature in the range of 0.8 to 1°C and 0.4 to 0.8°C under RCP 8.5 and RCP 4.5 emission scenarios respectively.
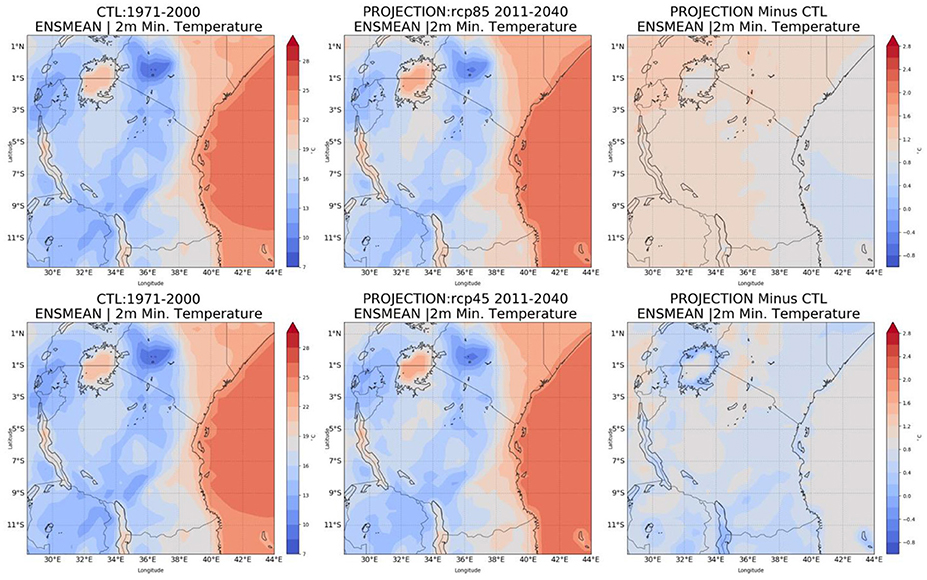
Figure 6. The average of minimum temperature during base period (1971–2000), present century (2011–2040), and the change in temperature during present century under both RCP8.5 (upper) and RCP 4.5 (lower).
Figure 7 indicates the projected change in minimum temperature during mid century (2041–2070) under RCP 8.5 and RCP 4.5 emission scenarios relative to baseline period (1971–2000). It can be seen that, the minimum temperatures in most parts of the country in mid century are likely to become warmer than those in the present century. This is especially true over the western side of Lake Victoria basin and parts of Northeastern highlands under RCP 8.5 emission scenario where minimum temperatures are projected to be greater than 2.8°C. The western side of the country and the southwestern highland are projected to feature increased minimum temperature in the range of 2.2 to 2.4°C and 1.6 to 2°C under RCP 8.5 and RCP 4.5 emission scenarios respectively. Southern parts of the country, Central and Coastal regions are projected to feature warmer minimum temperatures in the range of 1.8 to 2°C and 1.4 to 2°C under RCP 8.5 and RCP 4.5 emission scenarios respectively. In general the over the highlands minimum temperature is likely to become warmer than over low laying areas such as Coastal regions.
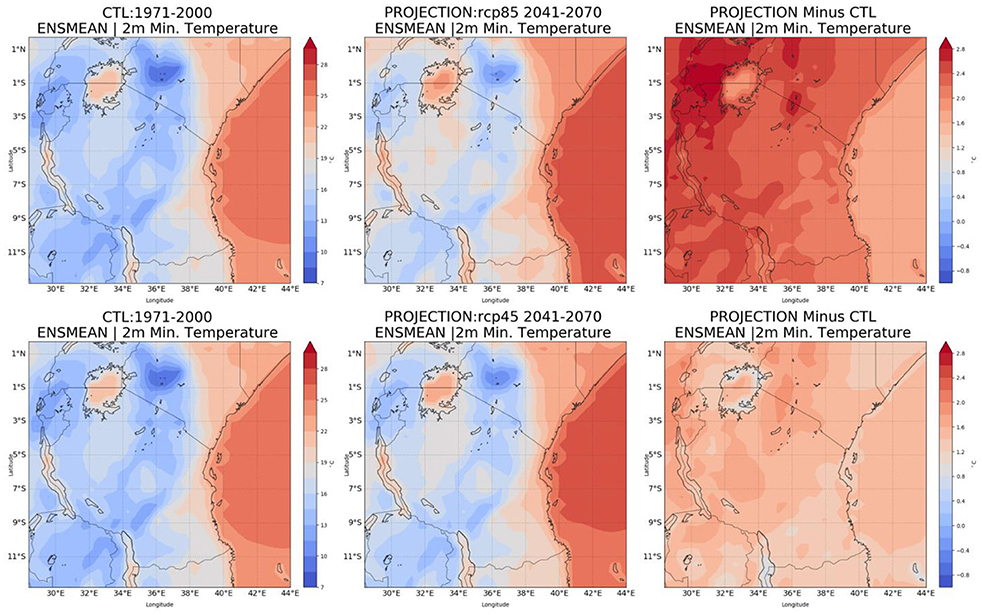
Figure 7. The average of minimum temperature during base period (1971–2000), mid century (2041–2070), and the change in temperature during present century under both RCP8.5 (upper) and RCP 4.5 (lower).
The distribution of minimum temperature during the baseline period (1971–2000) and end century (2071–2100) climate under both RCP 8.5 and RCP 4.5 emission scenarios are presented in Figure 8. In comparison with the projected changes in minimum temperatures presented in Figures 6,7, Figure 8 shows highest values of increased minimum temperature are likely to occur over most parts of the country during the end century (2071–2100). The western side of Lake Victoria basin and parts of Northeastern highlands are projected to feature increased minimum temperatures in the range of 4.5 to 4.8°C under RCP 8.5 emission scenario. While southwestern and northeastern highlands, western, and central regions are projected to feature increased minimum temperature in the range of 3.9 to 4.5°C and 1.6 to 2.2°C under RCP 8.5 and RCP 4.5 emission scenarios respectively.
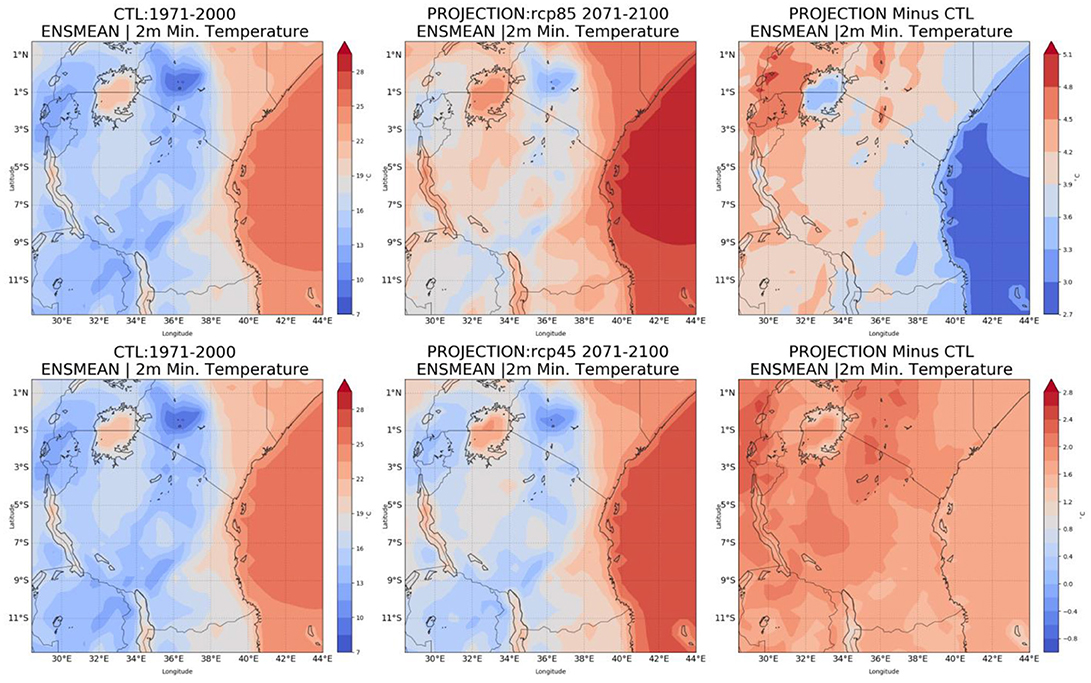
Figure 8. The average of minimum temperature during base period (1971–2000), end century (2071–2100), and the change in temperature during end century under both RCP8.5 (upper) and RCP 4.5 (lower).
For further analysis to investigate the temporal trend in minimum temperature, we extract the projected minimum temperature for twenty (20) representative regions in three future periods under RCP 8.5 and RCP 4.5 emission scenarios and compare with the simulations for the baseline period (1971–2000). The results are presented in Table 4. It is interesting to find most regions are likely to feature increased minimum temperature in three future periods under both RCP 8.5 and RCP 4.5 emission scenarios. However, in present century (2011–2040) Bukoba, Dar es Salaam and Mtwara regions are projected to feature decreased minimum temperature in the range of −0.5 to −0.4°C, −0.1°C to zero, and −0.9 to −0.8°C respectively.
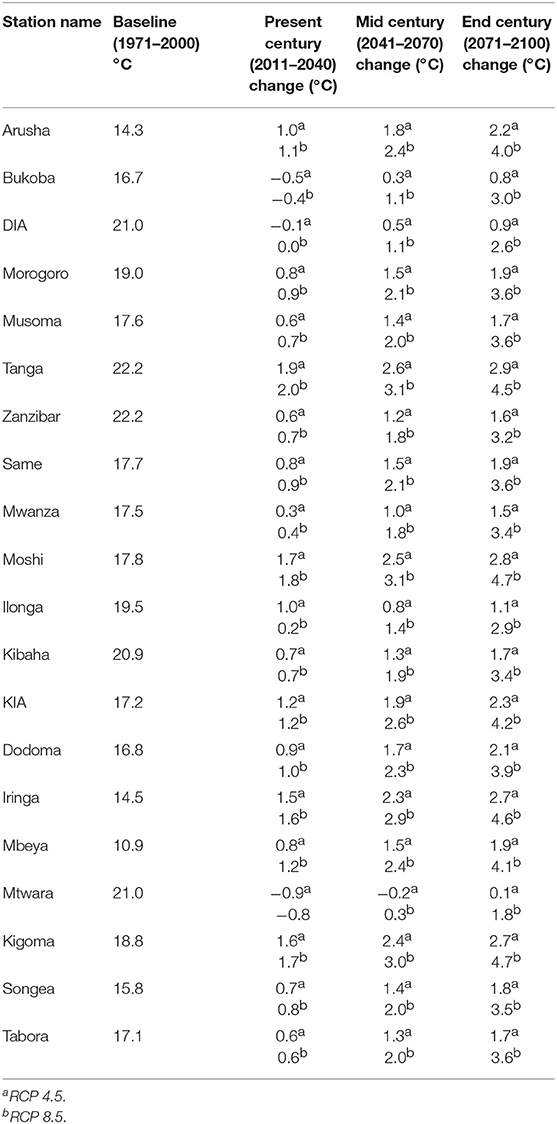
Table 4. Projected change in minimum temperature across representative regions over Tanzania.
Figure 9 shows the projected change of annual rainfall during the present century (2011–2040) relative to the baseline period (1971–2000) under both RCP 8.5 and RCP 4.5 emission scenarios. It seems that most parts of the country are likely to feature increased rainfalls during the current century under both RCP 8.5 and RCP 4.5 emission scenarios. This is true especially over Coastal regions, parts of northeastern highlands, northern regions, western and southern parts of the Lake Victoria basin where rainfall is projected to increase in the range of 0.15 to 0.45 mm/day under both RCP8.5 and RCP4.5 emission scenarios. Even though most parts of the country are projected to feature increased rainfall during the present century, the southwestern highlands, eastern parts of Lake Nyasa, and Western regions are projected to experience decreased rainfall in the range of 0.15 to 0.3 mm/day under both RCP8.5 and RCP4.5 emission scenarios.
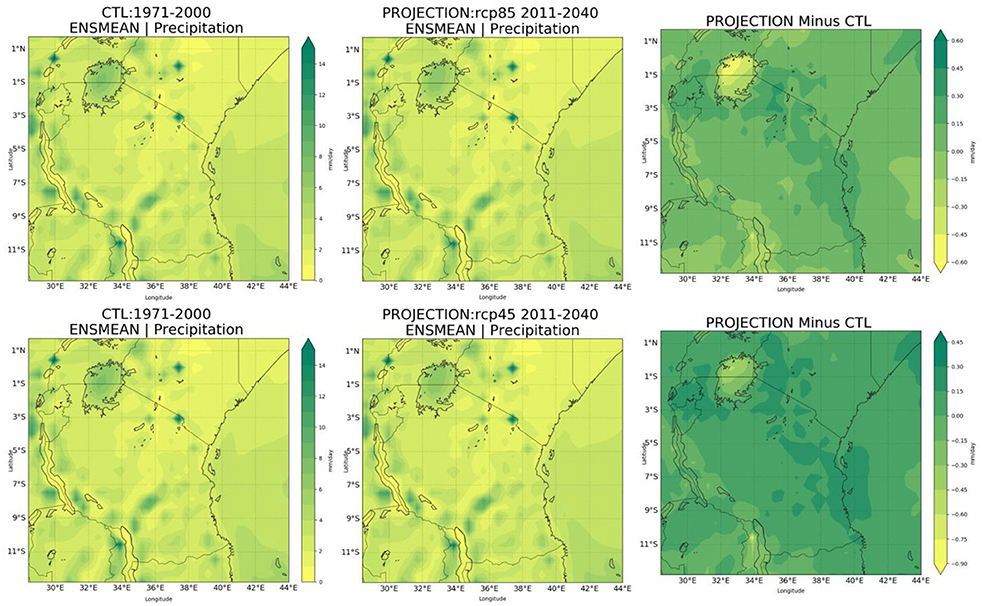
Figure 9. Precipitation in mm/day during base period (1971–2000), present century (2011–2040), and change in precipitation under both RCP8.5 (upper) and RCP 4.5 (lower).
The projected changes in rainfall during the mid century (2041–2070) relative to baseline period (1971–2000) are presented in Figure 10. This figure shows that under both (RCP 8.5 and RCP 4.5) emission scenarios most regions of the country will experience increased amount of rainfall in the range of zero to 0.25 mm/day. However, the northern regions, and parts of northeastern highlands are projected to experience relatively high increase in rainfall in the range of 0.25 to 0.5 mm/day under both RCP 8.5 and RCP 4.5 emission scenarios. Moreover, Coastal regions are projected to feature increased rainfall in the range of 0.25 to 0.5 mm/day under RCP 4.5 emission scenarios. Even though the changes in rainfall are projected to increase over most parts of the country during mid century (2041–2070) under both RCP 8.5 and RCP 4.5 emission scenarios, the western, southwestern highland, southern regions and eastern side of Lake Nyasa are projected to experience decreased rainfall in the range of 0.25 to 0.75 mm/day.
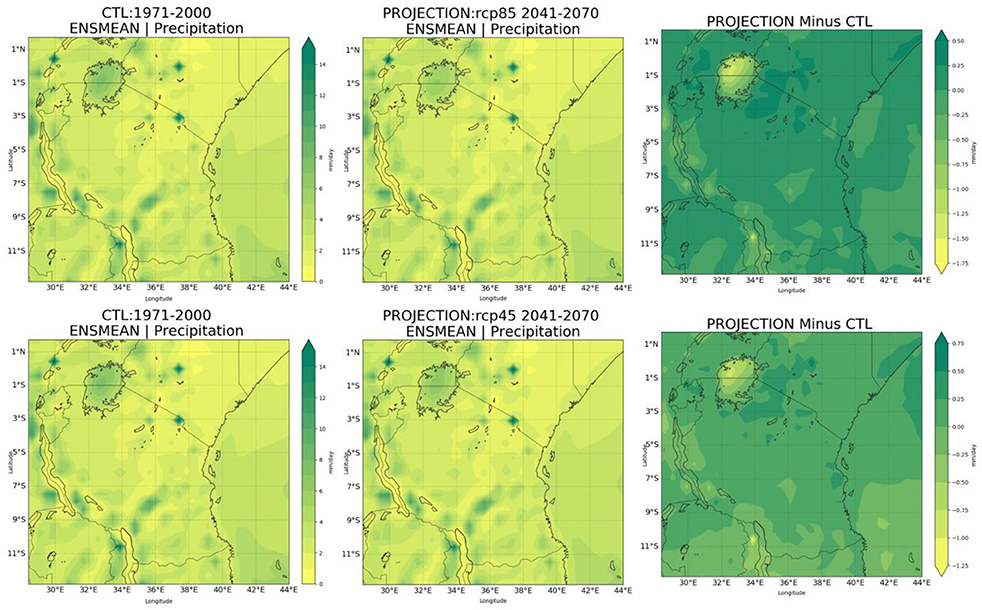
Figure 10. Precipitation in mm/day during base period (1971–2000), present century (2041–2070), and change in precipitation under both RCP8.5 (upper) and RCP 4.5 (lower).
Figure 11 shows the projected change in rainfall during the end century (2071–2100) under RCP 8.5 and RCP 4.5 emission scenarios relative to the baseline period (1971–2000). It seems that rainfall will increase in the end century under both RCP 8.5 and 4.5 emission scenarios. This is especially true over the northern regions, parts of northeastern highlands and Coastal regions where rainfall is projected to increase in the range of 0.5 to 1 mm/day and 0.25 to 0.5 mm/day under RCP 8.5 and RCP 4.5 emission scenarios respectively. However, the western regions, southwestern highlands and eastern side of Lake Nyasa are projected to experience decreased amount of rainfall in the range of 0.5 to 1 mm/day under both RCP 8.5 and RCP 4.5 emission scenarios.
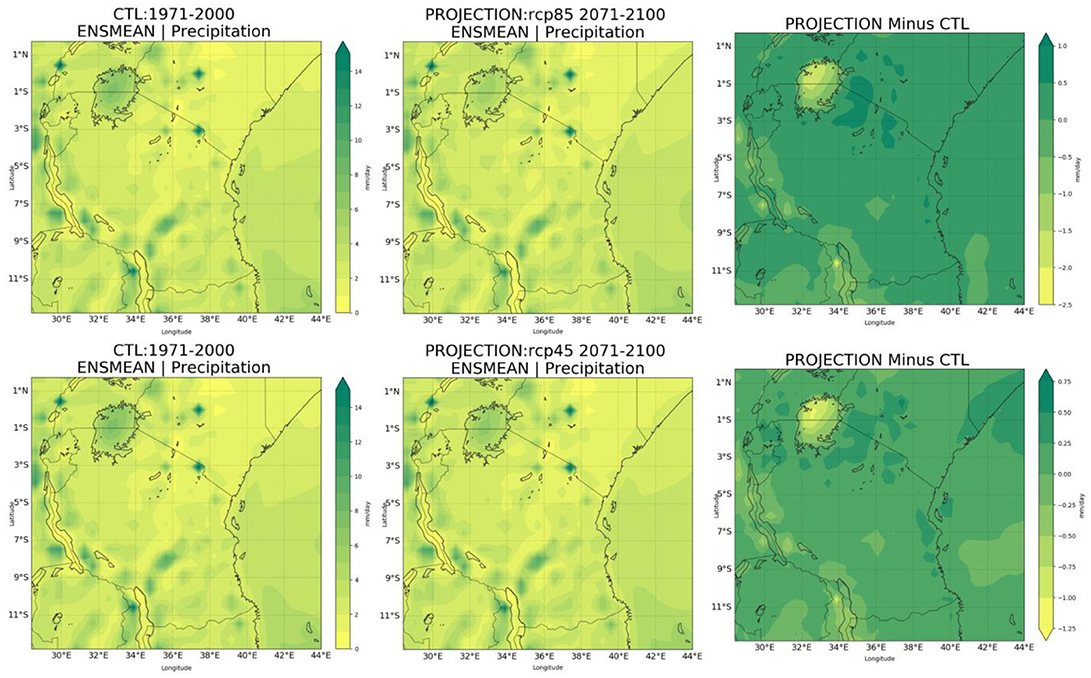
Figure 11. Precipitation in mm/day during base period (1971–2000), present century (2071–2100), and change in precipitation under both RCP8.5 (upper) and RCP 4.5 (lower).
The further analysis to investigate the temporal trend in annual rainfall was performed by extraction of the projected rainfall for representative twenty regions in the three future periods and compared with the simulations for the baseline period. The results are presented in Table 5. Although the changes in annual rainfall over these 20 regions are projected to distinct from each other, but the majority of the regions are likely to feature increased rainfall. Under RCP 8.5 most regions are likely to feature increased rainfall varying within the range of zero to 56% in the present century (2011–2040), zero to 51% in the mid century (2041–2070) and 1 to 62% during the end century. While under RCP 4.5 most regions are likely to feature increased rainfall in the range zero to 54.7%, zero to 53% and 2 to 55% during present (2011–2040), mid (2041–2070) and end (2071–2100) centuries respectively.
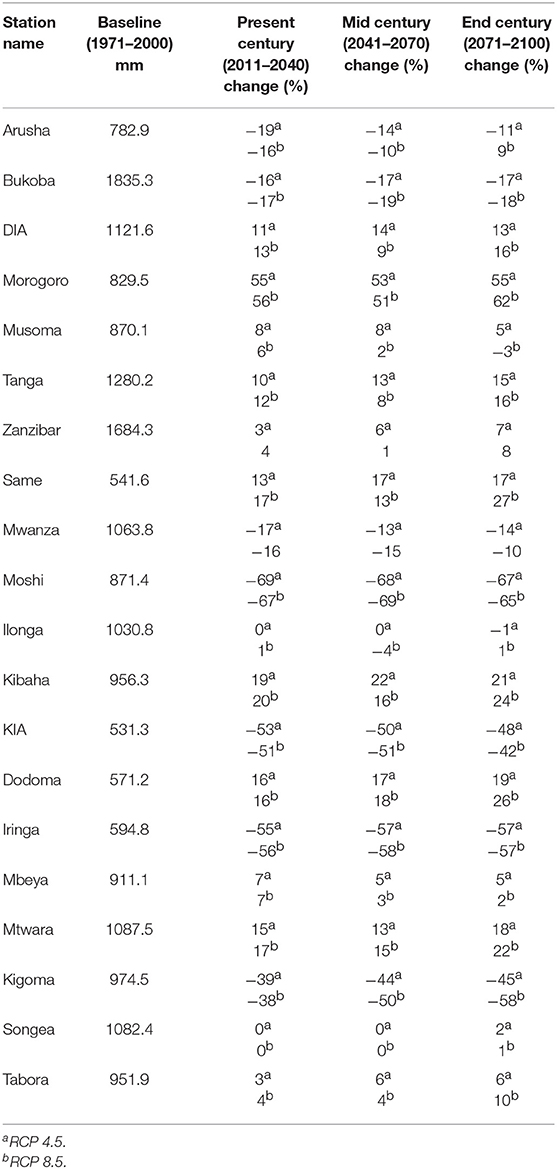
Table 5. Projected change in rainfall over selected representative regions of Tanzania.
Climate Change Projections Within Seasonal Time Series
The trends of seasonal minimum and maximum temperature for Tanzania in the baseline (1971–2000), present (2011–2040), mid (2041–2070), and end (2071–2100) centuries climate conditions under RCP 8.5 and RCP 4.5 emission scenarios are presented in Tables 6, 7. These tables indicates that Tanzania will experience increased minimum and maximum temperatures during present (2011–2040), mid (2041–2070), and end (2071–2100) centuries under both RCP 8.5 and RCP 4.5 emission scenarios. Table 6 shows that in June-July-August-September (JJAS) season, the country is likely to experience increased maximum temperature in the range of 1.7 to 2.4°C and 2 to 4°C in mid (2041–2070) and end (2070–2100) centuries respectively. Moreover minimum temperature during JJAS season is likely to increase in the range of 1.5 to 2.2°C and 1.9 to 3.8°C in mid (2041–2070) and end (2070–2100) centuries respectively. In general the cold season (JJAS) of Tanzania is likely to become warmer than the warm season that starts in October and continue through April or May. This warming may be attributed to the increased emission of greenhouse gases such as carbon dioxide. This is true due to facts that higher temperatures are projected under the business as usual emission scenarios (RCP 8.5) than under the controlled emission scenarios (RCP 4.5).
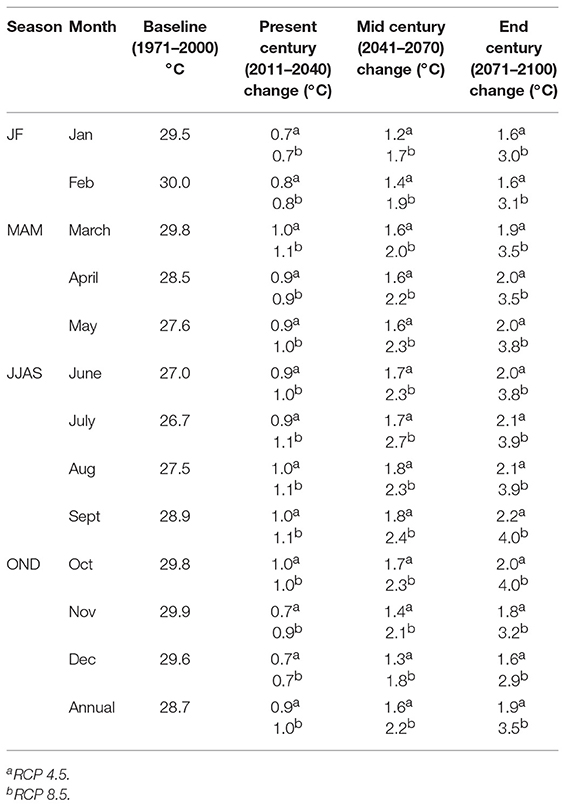
Table 6. Projected changes in maximum temperature for Tanzania.
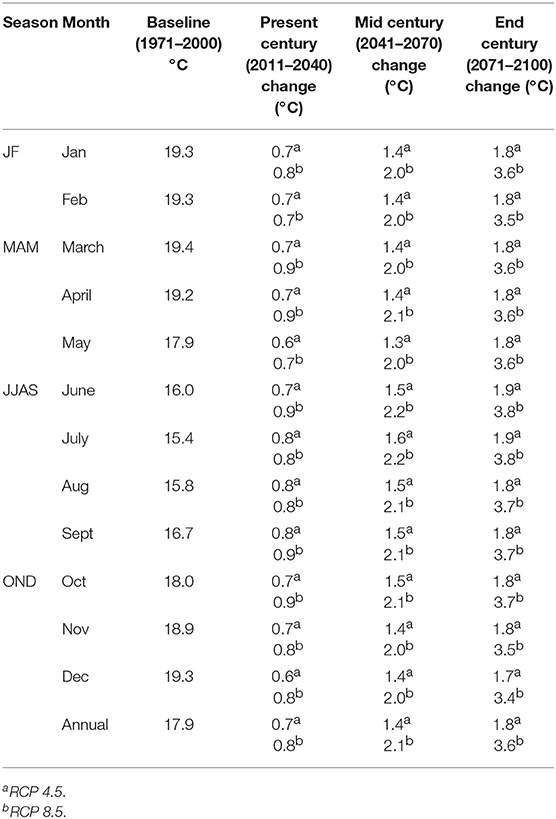
Table 7. Projected changes in minimum temperature for Tanzania.
The spatial distributions of rainfall in present century for October, November, and December (OND) season under both RCP 8.5 and RCP 4.5 are presented in Figure 12. From this figure, it is shown that most regions in the country will experience increased rainfall in the range 0.3 to 0.6 mm/day under both RCP 8.5 and RCP 4.5 emission scenarios. However, the western regions and southwestern highlands are projected to feature decreased rainfall in the range of zero to 0.3 mm/day under both RCP 8.5 and RCP 4.5 emission scenarios. Figure 13 shows the distribution of rainfall over different regions in the mid century under both RCP 8.5 and RCP 4.5. Regions over the Lake Victoria basin are projected to have increased rainfall in the range of 0.3 to 0.6 mm/day. However, the western regions and the southwestern highlands are projected to feature decreased rainfall in the range of zero to 0.6 mm/day. In the end century (see Figure 14), regions in the Lake Victoria basin, northeastern highlands are projected to feature increased rainfall in the range of 0.3 to 0.6 mm/day. The southwestern highlands and western regions are projected to experience decreased rainfall in the range of zero to 0.6 mm/day.
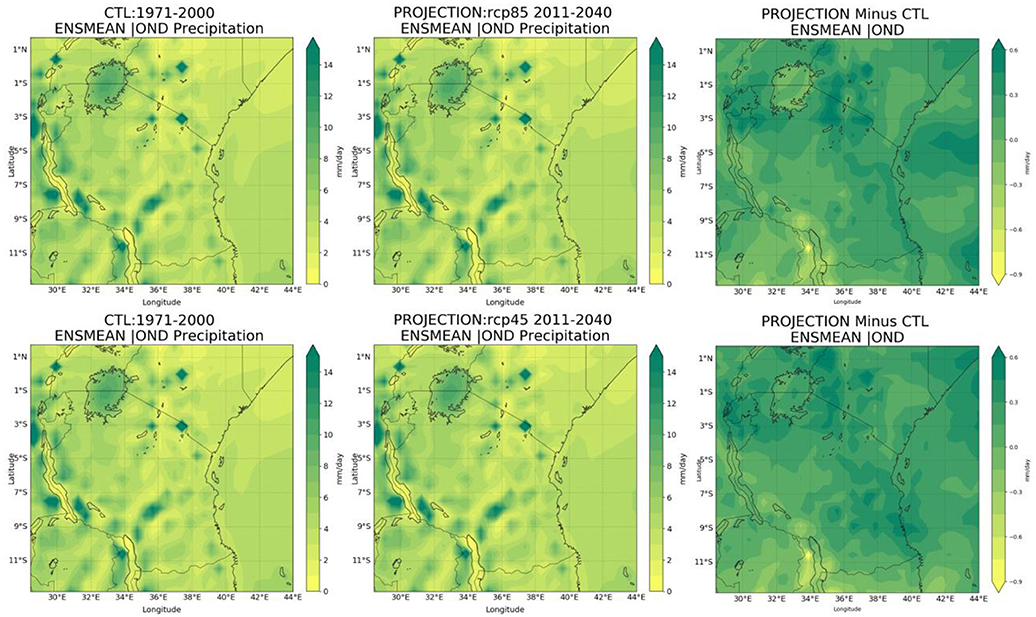
Figure 12. Precipitation in mm/day for OND during base period (1971–2000), present century (2011–2040), and change in precipitation under both RCP8.5 (upper) and RCP 4.5 (lower).
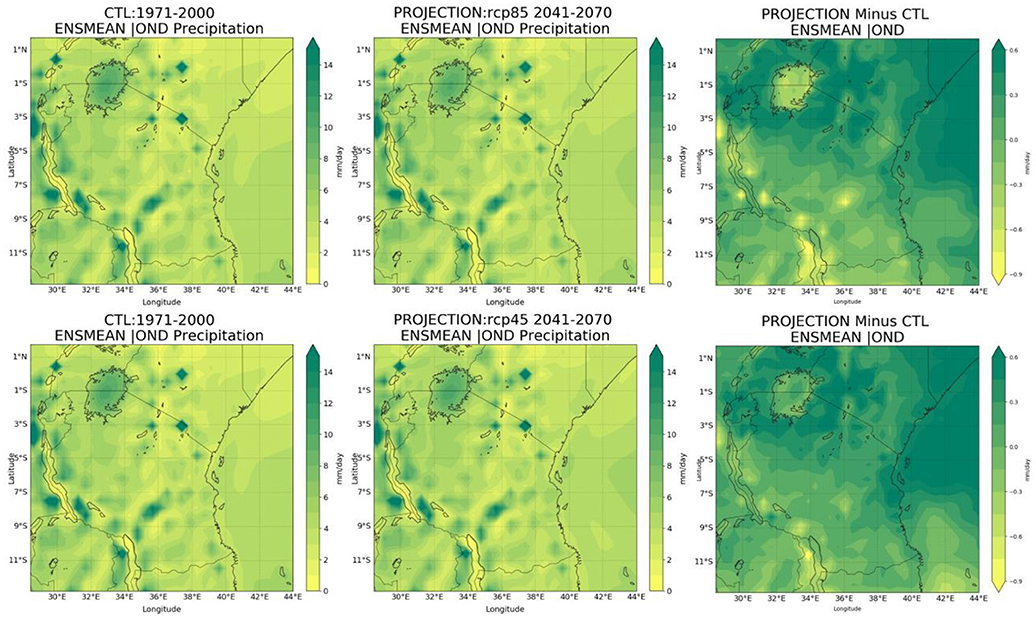
Figure 13. Precipitation in mm/day for OND during base period (1971–2000), mid century (2041–2070), and change in precipitation under both RCP8.5 (upper) and RCP 4.5 (lower).
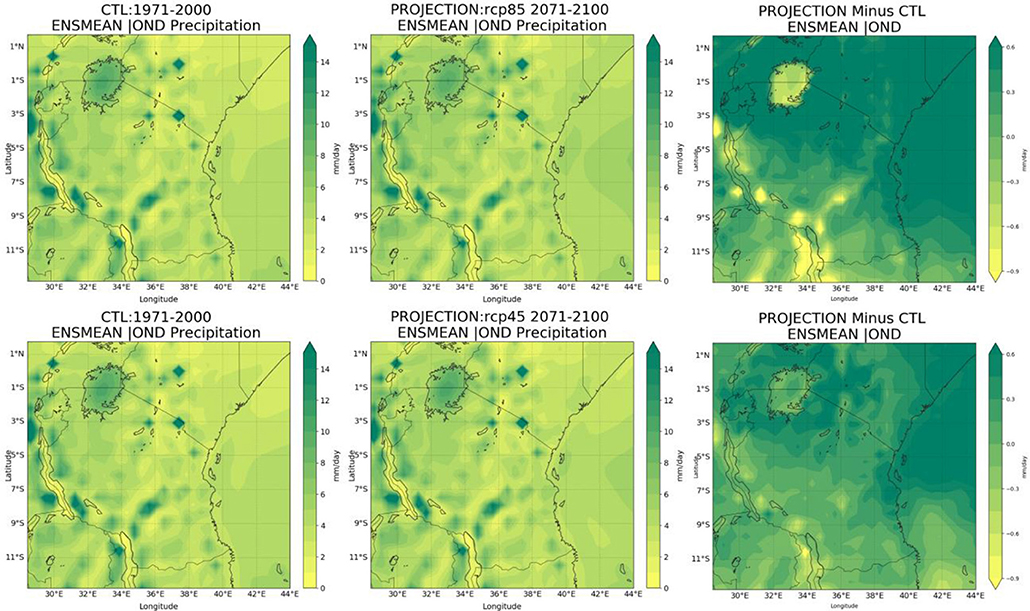
Figure 14. Precipitation in mm/day for OND during base period (1971–2000), end century (2071–2100), and change in precipitation under both RCP8.5 (upper) and RCP 4.5 (lower).
The spatial distribution of rainfall during the present century in March, April, and May (MAM) season under both RCP 8.5 and RCP 4.5 are presented in Figure 15. From this figure, it can be seen that under RCP 8.5 and RCP 4.5, most regions are projected to have increased rainfall in the range of zero to 0.3 mm/day. However regions over the Coast, northern, parts of northeastern highlands and parts of the Lake Victoria basin are projected to have higher increased rainfall in the range of 0.3 to 0.6 mm/day. The southwestern highlands will experience decreased rainfall in the range of zero to 0.3 mm/day. The western regions, parts of northeastern highlands and southwestern highlands are likely to feature decreased rainfall in the range of zero to 0.3 mm/day under RCP 4.5 emission scenario.
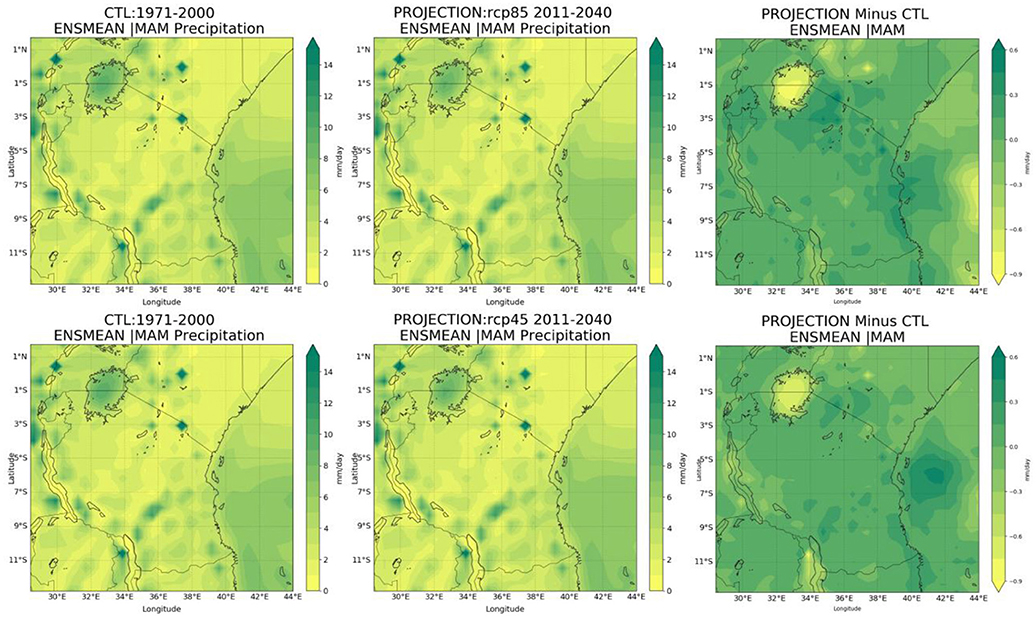
Figure 15. Precipitation in mm/day for MAM during base period (1971–2000), present century (2011–2040), and change in precipitation under both RCP8.5 (upper) and RCP 4.5 (lower).
In the mid century (see Figure 16) most regions are projected to feature increased rainfall in the range 0.15 to 0.6 mm/day and zero to 0.3 mm/day under RCP 8.5 and RCP 4.5 emission scenarios respectively. However, the western regions and the southwestern highlands will experience decreased rainfall in the range of zero to 0.6 mm/day and zero to 0.3 mm/day under both RCP 8.5 and RCP 4.5 emission scenarios respectively. In the end century (see Figure 17) most regions are projected to feature increased rainfall in the range of 0.3 to 0.6 mm/day under both RCP 8.5 and RCP 4.5 emission scenarios. However, western regions and southwestern highlands are projected to feature decreased rainfall in the range of zero to 0.6 mm/day and zero to 0.3 mm/day under RCP 8.5 and RCP 4.5 emission scenarios respectively.
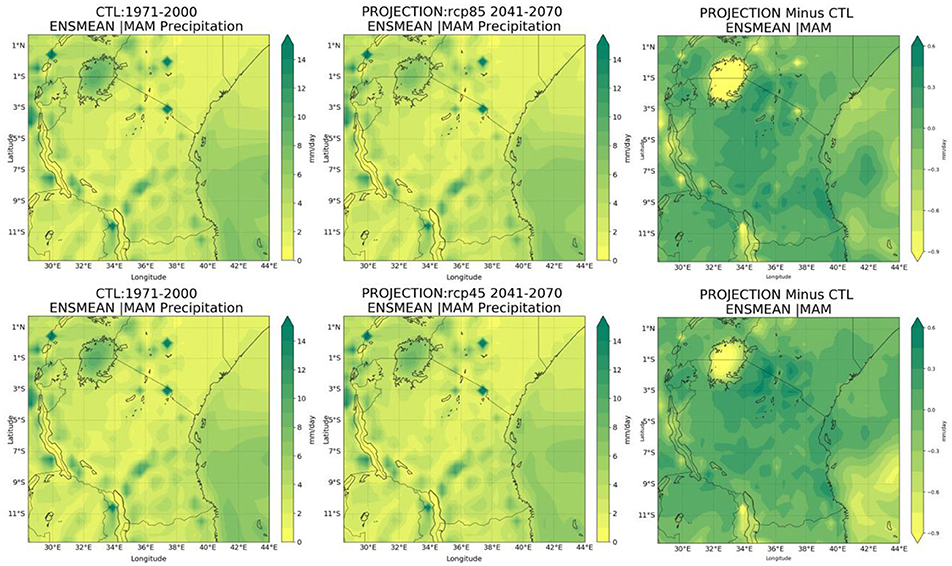
Figure 16. Precipitation in mm/day for MAM during base period (1971–2000), mid century (2041–2070), and change in precipitation under both RCP8.5 (upper) and RCP 4.5 (lower).
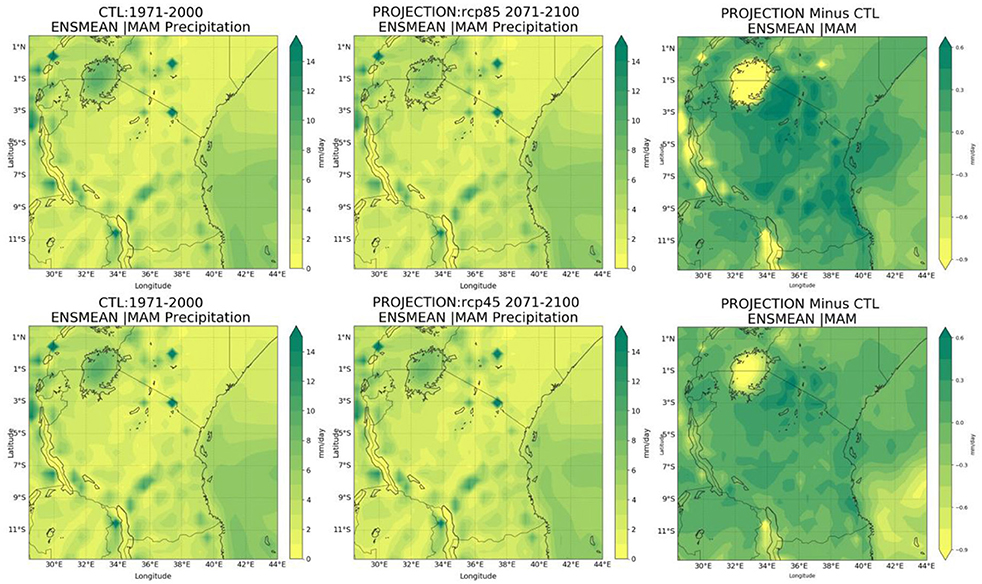
Figure 17. Precipitation in mm/day for MAM during base period (1971–2000), mid century (2041–2070), and change in precipitation under both RCP8.5 (upper) and RCP 4.5 (lower).
Discussion
The uncertainties in the previous studies (e.g., Mwandosya et al., 1998; Wambura et al., 2014; Conway et al., 2017) that analyzed climate change projections for Tanzania based on climate simulation from the coarse spatial resolution GCMs, provides salient evidence that much effort is needed to provide reliable climate change projections for Tanzania. In this study, we present climate change projections for Tanzania based on ensemble of five high resolution regional climate models from the Coordinated Regional Climate Downscaling Experiment (CORDEX) program. It is found that temperatures (minimum and maximum) are projected to increase throughout the country. These results provide further support for other previous studies (e.g., Wambura et al., 2014; Conway et al., 2017) which indicates increasing future temperatures over Tanzania. However, the pattern and the magnitude of changes in temperature presented in this study, differ greatly from previous studies. For instance, Conway et al. (2017) projected almost the entire country will experience increased temperature of 1 to 1.5°C in the near term (2021–2050) under RCP 8.5 pathway. They projected changes in temperatures in the same range of value almost throughout the country without regional variations. However, the temperatures (minimum and maximum) presented in this study vary regionally. For instance, in mid century (2041–2070), the central, northern and western regions, southwestern and northeastern highlands are projected to have increased maximum temperatures in the range of 2.4 to 2.6°C and 2 to 2.2°C relative to a historical period (1971–2000) under the RCP 8.5 and RCP 4.5 pathways, respectively. In the end century (2071–2100), the western parts of the country, southwestern highlands and the eastern parts of Lake Nyasa are projected to have an increased maximum temperature of greater than 3.5°C and in the range of 2 to 2.4°C under RCP 8.5 and RCP 4.5 emission scenarios respectively. These increases in maximum temperatures are expected to decline crop production especially over low lying area where some crops are near their maximum temperature tolerance level, as small change in temperature can cause major decline in yields.
The future minimum temperatures are projected to increase throughout the country. In mid century (2041–2070) for instance, higher changes in minimum temperatures of greater than 2.8°C are projected to occur over the western side of Lake Victoria basin and parts of Northeastern highlands under RCP 8.5 emission scenario. The western side of the country and the southwestern highland are projected to have increased minimum temperature in the range of 2.2 to 2.4°C and 1.6 to 2°C during the mid century under RCP 8.5 and RCP4.5 emission scenarios respectively. Southern parts of the country, Central, and Coastal regions are projected to have warmer minimum temperatures in the range of 1.8 to 2°C and 1.4 to 2°C during the mid century under RCP 8.5 and RCP 4.5 emission scenarios respectively. These projected increased changes in minimum temperatures are expected to decline rice yields (Peng et al., 2004).
In general, projected increased temperatures (minimum and maximum temperatures) over different regions in Tanzania are expected to impacts on socio-economic development. The increased temperatures are expected to reduce the length of growing season for some crops and are expected to encourage diseases and pest eruption (Luhunga, 2017a). In central regions (Dodoma and Singida) which are semi arid, eruption of new parasite and diseases can be expected that would affect a huge number of animals. Increased temperatures may results into decreased soil moisture which would affect runoff and river flows (United Republic of Tanzania, 2003).
Rainfalls are projected to increase almost throughout the country. Most regions are projected to feature increased rainfall in the range 0.15 to 0.6 mm/day and zero to 0.3 mm/day under RCP 8.5 and RCP 4.5 emission scenarios respectively. However, in mid century, the western regions and the southwestern highlands are projected to experience decreased rainfall in the range of zero to 0.6 mm/day and zero to 0.3 mm/day under both RCP 8.5 and RCP 4.5 emission scenarios respectively. In the end century most regions are likely to have increased rainfall in the range of 0.3 to 0.6 mm/day under both RCP 8.5 and RCP 4.5 emission scenarios. However, western regions and southwestern highlands are projected to feature decreased rainfall in the range of zero to 0.6 mm/day and zero to 0.3 mm/day under RCP 8.5 and RCP 4.5 emission scenarios respectively. The projected increase in temperature and decreased rainfall may compromise socio-economic activities over western and southwestern highlands regions. These regions contain the main four major staple food production regions in the country: Iringa, Mbeya, Ruvuma, and Rukwa (Luhunga, 2017b). The regions are the grain basket of Tanzania growing maize for commercial purposes. The current climate projections over western and southwestern highlands regions call for preparedness for informative approach on climate change adaptation strategies to make these regions feasible to continue crop production in future climate.
Conclusion
This study presented the climate projection for Tanzania based on climate simulations from high resolution CORDEX regional climate models. The general aim of this study was to provide up to date climate change projection during the present (2011–2040), mid (2041–2070), and end (2071–2100) centuries relative to a historical (1971–2000) climate condition. This information is crucial needed by different policy and decision makers, researchers, practitioners and civil societies. We have found that most regions in the country are projected to have increased temperatures (minimum and maximum). The highest maximum temperatures of greater than 3.5°C and in the range of 2 to 2.4°C under RCP 8.5 and RCP 4.5 emission scenarios respectively, are projected to western parts of the country, southwestern highlands and the eastern parts of Lake Nyasa. These regions contain the main four major staple food production regions in the country: Iringa, Mbeya, Ruvuma, and Rukwa and therefore require proper informative approach on climate change adaptation strategies to continue crop production in future climate.
Minimum temperatures are expected to increase throughout the country. For instance, over the western side of Lake Victoria basin and parts of Northeastern highlands (Ngorongoro) are projected to have increased minimum temperatures in the range of 4.5 to 4.8°C under RCP 8.5 emission scenario. The western, central, southwestern and northeastern highlands are projected to have increased minimum temperature in the range of 3.9 to 4.5°C and 1.6 to 2.2°C under RCP 8.5 and RCP 4.5 emission scenarios respectively.
The increases in minimum and maximum temperatures are expected to compromise socio-economic activities in many regions. Therefore the presented results suggest that tailored adaptation strategies should be formulated to adapt the projected increase in temperatures over different regions. It is also found that, projected increases in temperatures over all regions are higher for the business as usual scenario (RCP 8.5) than for the adaptation scenario (RCP 4.5).
Rainfall is projected to increase in future climate in almost all regions. However over western and southwestern regions, rainfall is projected to decrease during the present (2011–2040), mid (2041–2070), and end (2071–2100) centuries under both RCP 8.5 and RCP 4.5 emission scenarios. For instance, the western regions, and southwestern highlands are projected to experience decreased amount of rainfall in the range of 0.5 to 1 mm/day in the end century under both RCP 8.5 and RCP 4.5 emission scenarios. The projected decrease in rainfall over the western regions, and southwestern highlands call for urgent preparations of adaptation strategies especially in the water, agriculture and food security sub sectors.
Author Contributions
All authors contributed in the designing, analyzing, and writing of the manuscript. The data search and analysis was done by PL and AK. The validation of the model data was done by PL. Results analysis and manuscript writing was done by all authors.
Conflict of Interest Statement
The authors declare that the research was conducted in the absence of any commercial or financial relationships that could be construed as a potential conflict of interest.
Acknowledgments
The authors would like to thank the Tanzania Meteorological Agency, research section for providing computing facilities and CORDEX Africa for providing model data used in this study.
References
Agrawala, S., Moehder, A., Hemp, A., Van Aalst, M., Hitz, S., Meena, H., et al. (2003). Development and Climate Change in Tanzania: Focus on Mount Kilimanjaro. Paris: OECD.
Ahmed, S. A., Diffenbaugh, N. S., Hertel, T. W., Lobell, D. B., Ramankutty, N., Rios, A. R., et al. (2011). Climate volatility and poverty vulnerability in Tanzania. Glob. Environ. Change 21, 46–55. doi: 10.1016/j.gloenvcha.2010.10.003
Anyah, R. O., and Semazzi, H. H. M. (2007). Variability of East African rainfall based on multi year RegCM3 simulations. Int. J. Climatol. 27, 357–371. doi: 10.1002/joc.1401
Araya, A., Girma, A., and Getachew, F. (2015). Exploring impacts of climate change on maize yield in two contrasting agro-ecologies of Ethiopia. Asian J. Appl. Sci. Eng. 4, 27–37.
Arndt, C., Farmer, W., Strzepek, K., and Thurlow, J. (2011). Climate Change, Agriculture, and Food Security in Tanzania. United Nations University, UNU-WIDER.
Benestad, R. E., Hanssen-Bauer, I., and Førland, E. J. (2007). An evaluation of statistical models for downscaling precipitation and their ability to capture long-term trends. Int. J. Climatol. 27, 649–665. doi: 10.1002/joc.1421
Bhuvandas, N., Timbadiya, P. V., Patel, P. L., and Porey, P. D. (2014). Review of downscaling methods in climate change and their role in hydrological studies. Int. J. Environ. Ecol. Geol. Mar. Eng. 8, 713–718. Available online at: http://waset.org/Publication/9999530
Black, E. (2005). The relationship between Indian Ocean sea-surface temperature and East African rainfall. Philos. Trans. R. Soc. 363, 43–47. doi: 10.1098/rsta.2004.1474
Black, E., Slingo, J., and Sperber, K. R. (2003). An observational study of the relationship between excessively strong short rains in coastal east Africa and Indian ocean SST. Mon. Weather Rev. 131, 74–94. doi: 10.1175/1520-0493(2003)131<0074:AOSOTR>2.0.CO;2
Castro, C. L., Pielke Sr, R. A., and Leoncini, G. (2005). Dynamical downscaling: assessment of value retained and added using the Regional Atmospheric Modeling System (RAMS). J. Geophys. Res. 110:D5. doi: 10.1029/2004JD004721
Chen, Q.-S., and Kuo, Y.-H. (1992), A harmonic-sine series expansion its application to partitioning reconstruction problems in a limited area, Mon. Weather Rev. 120, 91–112.
Conway, D., Mittal, N., and Vincent, K. (2017). Future Climate Projections for Tanzania. Future for Climate Africa. Available online at: https://www.africaportal.org/publications/future-climate-projections-tanzania/
de Wit, M., and Stankiewicz, J. (2006). Changes in surface water supply across Africa with predicted climate change. Science 311, 1917–1921. doi: 10.1126/science.1119929
Denis, B., Laprise, R., Caya, D., and Cote, J. (2002). Downscaling ability of one-way nested regional climate models: the Big-Brother experiment. Clim. Dyn. 18, 627–646. doi: 10.1007/s00382-001-0201-0
Di Luca, A., de Elía, R., and Laprise, R. (2012). Potential for added value in precipitation simulated by high-resolution nested Regional Climate Models and observations. Clim. Dyn. 38, 1229–1247. doi: 10.1007/s00382-011-1068-3
Ehrhart, C., and Twena, M. (2006). Climate Change and Poverty in Tanzania: Realities and Response Options for CARE. Background Report. CARE International Poverty-Climate Change Initiative. Available online at: http://www.care.dk/multimedia/pdf/web_english/Climate%20Change%20and%20Poverty%20in%20Tanzania%20-%20Country%20Profile.pdf
Fung, F., Lopez, A., and New, M. (2011). Modelling the Impact of Climate Change on Water Resources. Oxford: Wiley-Blackwell.
Glotter, M., Elliott, J., McInerney, D., Best, N., Foster, I., and Moyer, E. J. (2014). Evaluating the utility of dynamical downscaling in agricultural impacts projections. Proc. Natl. Acad. Sci. U.S.A. 111, 8776–8781. doi: 10.1073/pnas.1314787111
Gutowski, W. J. Jr, Giorgi, F., Timbal, B., Frigon, A., Jacob, D., Kang, H.-S., et al. (2016). WCRP COordinated Regional Downscaling EXperiment (CORDEX): a diagnostic MIP for CMIP6. Geosci. Model Dev. 9, 4087–4095. doi: 10.5194/gmd-9-4087-2016
Hewitson, B. C., and Crane, R. G. (1996). Climate downscaling: techniques and application. Clim. Res. 7, 85–95.
IPCC (2012). “Managing the risks of extreme events and disasters to advance climate change adaptation - summary for policy makers,” in A Special Report of Working Groups, I., and II of the Intergovernmental Panel on Climate Change, eds C. B. V. Field, T. Barros, F. Stocker, D. Qin, D. J. Dokken, K. L. Ebi, M. D. Mastrandrea, K. J. G. Mach, K. Plattner, S. K. Allen, M. Tignor, and P. M. Midgley (Geneva: World Meteorological organization), 24.
IPCC (2013). “Summary for policy makers,” in Climate Change 2013: The Physical Science Basis. Contribution of Working Group I to the Fifth Assessment Report of the Intergovernmental Panel on Climate Change, eds T. F. Stocker, D. G. Qin, K. Plattner, M. Tignor, S. K. Allen, J. Boschung, A. Nauels, Y. Xia, V. Bex, and P. M. Midgley (Cambridge; New York, NY: Cambridge University Press), 4–29.
IPCC (2007). Working Group II Fourth Assessment Report. Climate Change: Climate Change Impacts, Adaptation and Vulnerability. Available online at: https://www.ipcc.ch/pdf/assessment-report/ar4/wg2/ar4_wg2_full_report.pdf
Jack, C. (2010). Climate Projections for United Republic of Tanzania, Climate Systems Analysis Group, University of Cape Town. Available online at: http://www.tzdpg.or.tz/fileadmin/_migrated/content_uploads/Climate_projections_CCE_report_01.pdf
Jones, R. G., Noguer, M., Hassell, D. C., Hudson, D., Wilson, S. S., Jenkins, G. J., et al. (2004). Generating High Resolution Climate Change Scenarios Using PRECIS. Exeter: Met Office Hadley Centre, 40.
Leung, L. R., Mearns, L. O., Giorgi, F., and Wilby, R. L. (2003). Regional climate research. Bull. Am. Meteorol. Soc. 84, 89–95. doi: 10.1175/BAMS-84-1-89
Luhunga, P. M. (2017a). Evaluation of the impacts of climate variability on rainfed maize production over the Wami Ruvu basin of Tanzania. J. Water Clim. Change 8, 207–222. doi: 10.2166/wcc.2017.036
Luhunga, P. M. (2017b). Assessment of the impacts of climate change on maize production in the Southern and Western Highlands Sub-agro Ecological Zones of Tanzania. Front. Environ. Sci. 5:51. doi: 10.3389/fenvs.2017.00051
Luhunga, P. M., Mutayoba, E., and Ng'ongolo, H. (2014). Homogeneity of monthly mean air temperature of the United Republic of Tanzania with HOMER. Atmos. Clim. Sci. 4, 70–77. doi: 10.4236/acs.2014.41010
Martin, J., Michael, L., Stephanie, L., Ole, B. C., Michael, K., and Sébastien, D. (2013). The CORDEX Archive in ESGF: A Global Archive for Regional Data, EGU General Assembly 2013, Vienna: EGU General Assembly.
McSweeney, C., New, M., and Lizcano, G. (2010). UNDP Climate Change Country Profiles, Tanzania. Available online at: https://digital.library.unt.edu/ark:/67531/metadc226754/
Min, E., Hazeleger, W., Oldenborgh, G. J., and Sterl, A. (2013). Evaluation of trends in high temperature extremes in north-western Europe in regional climate models. Environ. Res. Lett. 8:014011. doi: 10.1088/1748-9326/8/1/014011
Mtongori, H., Stordal, F., and Benestad, R. (2015). Evaluation of Empirical Statistical Downscaling models' skill in predicting Tanzanian rainfall and their application in providing future downscaled scenarios. J. Clim. 29, 3231–3252. doi: 10.1175/JCLI-D-15-0061.1
Munishi, P. K. T., Shirima, D., Jackson, H., and Kilungu, H. (2010). Analysis of Climate Change and its Impacts on Productive Sectors, particularly Agriculture in Tanzania. Ministry of Finance and Economic Affairs, United Republic of Tanzania.
Mwandosya, M. J., Nyenzi, B. S., and Luhanga, M. L. (1998). The Assessment of Vulnerability and Adaptation to Climate Change Impacts in Tanzania. Dar-es-Salaam: Centre for Energy, Environment, Science and Technology (CEEST).
Nikulin, G., Jones, C., Giorgi, F., Asrar, G., Büchner, M., Cerezo-Mota, R., et al. (2012). Precipitation climatology in an ensemble of CORDEX-Africa regional climate simulations. J. Clim. 25, 6057–6078. doi: 10.1175/JCLI-D-11-00375.1
Peng, S., Huang, J., Sheehy, J. E., Laza, R. C., Visperas, R. M., Zhong, X., et al. (2004). Rice yields decline with higher night temperature from global warming. Proc. Natl. Acad. Sci. U.S.A. 101, 9971–9975. doi: 10.1073/pnas.0403720101
Rowhani, P., Lobell, D. B., Linderman, M., and Ramankutty, N. (2011). Climate variabilty and crop production in Tanzania. Agric. Forest Meteorol. 151, 449–460. doi: 10.1016/j.agrformet.2010.12.002
Strzepek, K., and McCluskey, A. (2006). District Level Hydroclimatic Time Series and Scenario Analyses to Assess the Impacts of Climate Change on Regional Water Resources and Agriculture in Africa. CEEPA Discussion Paper No. 13, Centre for Environmental Economics and Policy in Africa. University of Pretoria.
Trzaska, S., and Schnarr, E. (2014). A Review of Downscaling Methods for Climate Change Projections. African and Latin American Resilience to Climate Change (ARCC). Available online at: http://www.ciesin.org/documents/Downscaling_CLEARED_000.pdf
Tumbo, S. D., Mpeta, E., Tadross, M., Kahimba, F. C., Mbillinyi, B. P, and Mahoo, H. F. (2010). Application of self-organizing maps technique in downscaling GCMs climate change projections for Same, Tanzania. Phys. Chem. Earth 35, 608–617. doi: 10.1016/j.pce.2010.07.023
United Republic of Tanzania (2003). Initial National Communication under the United Nations Framework Convention on Climate Change (UNFCCC). Dar es Salaam. Available online at: http://unfccc.int/resource/docs/natc/tannc1.pdf
Wambura, F., Tumbo, S., Ngongolo, H., Mlonganile, P., and Sangalugembe, C. (2014). “Tanzania CMIP5 climate change projections,” in Proceedings of the International Conference on Reducing Climate Change Challenges through Forestry and Other Land Use Practices. Available online at: https://www.researchgate.net/profile/Frank_Wambura2/publication/309493992_Tanzania_CMIP5_Climate_Change_Projections/links/5813c05d08ae90acb23b7c14/Tanzania-CMIP5-Climate-Change-Projections.pdf
Zorita, E., and Tilya, F. (2002). Rainfall variability in North Tanzania in the March-May season (long rains) and its links to large-scale climate forcing. Clim. Res. 20, 31–40. doi: 10.3354/cr020031. Available online at: https://www.int-res.com/articles/cr2002/20/c020p031.pdf (Accessed March 25, 2015).
Keywords: climate change, temperature, rainfall, CORDEX, regional climate models
Citation: Luhunga PM, Kijazi AL, Chang'a L, Kondowe A, Ng'ongolo H and Mtongori H (2018) Climate Change Projections for Tanzania Based on High-Resolution Regional Climate Models From the Coordinated Regional Climate Downscaling Experiment (CORDEX)-Africa. Front. Environ. Sci. 6:122. doi: 10.3389/fenvs.2018.00122
Received: 14 June 2018; Accepted: 26 September 2018;
Published: 16 October 2018.
Edited by:
Tomas Halenka, Charles University, CzechiaReviewed by:
Xander Wang, University of Prince Edward Island, CanadaGovindan Krishnan, Indian Council of Agricultural Research (ICAR), India
Copyright © 2018 Luhunga, Kijazi, Chang'a, Kondowe, Ng'ongolo and Mtongori. This is an open-access article distributed under the terms of the Creative Commons Attribution License (CC BY). The use, distribution or reproduction in other forums is permitted, provided the original author(s) and the copyright owner(s) are credited and that the original publication in this journal is cited, in accordance with accepted academic practice. No use, distribution or reproduction is permitted which does not comply with these terms.
*Correspondence: Philbert Modest Luhunga, philuhunga@yahoo.com; philbert.luhunga@meteo.go.tz