The “Hidden Urbanization”: Trends of Impervious Surface in Low-Density Housing Developments and Resulting Impacts on the Water Balance
 Michael W. Strohbach1*
  Anneke O. Döring2
  Malte Möck3
  Maycon Sedrez4
  Olaf Mumm4
  Anne-Kathrin Schneider1
  Stephan Weber5
  Boris Schröder1,6
- 1Landscape Ecology and Environmental Systems Analysis, Institute of Geoecology, Technische Universität Braunschweig, Braunschweig, Germany
- 2Institute of Fluid Mechanics and Environmental Physics in Civil Engineering, Leibniz University Hannover, Hannover, Germany
- 3Comparative Politics and Public Policy, Institute of Social Sciences, Technische Universität Braunschweig, Braunschweig, Germany
- 4Institute for Sustainable Urbanism, Technische Universität Braunschweig, Braunschweig, Germany
- 5Climatology and Environmental Meteorology, Institute of Geoecology, Technische Universität Braunschweig, Braunschweig, Germany
- 6Berlin-Brandenburg Institute of Advanced Biodiversity Research, Berlin, Germany
Impervious surface is an important factor for the ecological performance of the built environment, in particular for the water balance. Therefore, the rainwater drainage infrastructure of new housing developments is planned according to the expected amount of impervious surface and the resulting surface runoff. Drainage infrastructure could be overwhelmed, however, due to small, dispersed, and often overlooked increases in impervious surface cover, a process we refer to as “hidden urbanization.” There is some evidence that impervious surface cover in housing areas has increased significantly over decades, but is there also a gap between planning and implementation? In order to find out, we compared eight development plans (i.e., the legally binding documents that steer building in Germany) of low-density (single-family) housing with the actual status-quo extracted from 2016 orthophotos. All sites are located in Lower Saxony, Germany; four are close to major urban centers and four are in small municipalities. We then modeled the local water balance for the plans and status-quo and compared results. All sites but one showed a relative increase between 8 and 56% of impervious surface, comparing plans with status-quo. For all sites with an increase of impervious cover, infiltration rates decreased by 4–19%, evaporation rates increased by 0.2–1% and surface runoff increased by 4–18%. In general, the more impervious surface, the stronger the effect. Our results point to a gap between planning and implementation and they underline the environmental consequences, illustrated by effects on the water balance. In order to prevent “hidden urbanization,” we suggest that more emphasis should be put on integrated design of housing areas and monitoring of impervious surface cover.
Introduction
Urbanization is commonly defined as the process by which an area becomes less rural and more urban (Gaston, 2010). Although there is some ambiguity in what is considered to be urban across different disciplines (McIntyre et al., 2000), urbanization is undoubtedly an ongoing global trend (UN, 2017) with major environmental impacts (Grimm et al., 2008). Recent trends suggest that urbanization is also becoming more expansive (Seto et al., 2011; UN, 2018). This means that the land uptake per new resident has actually increased over the last decades in most parts of the world. In fact, especially developed countries with slow or stagnating population growth have experienced disproportional increases in land uptake per capita (Prokop et al., 2011; Seto et al., 2011; UN, 2018). The unsustainable nature of expansive urbanization is well understood, as is reflected in a range of policy briefs, reports, political strategies, and goals (Prokop et al., 2011; Science for Environment Policy, 2016; UN, 2018). One example is the German sustainability strategy (Bundesregierung, 2016), which includes the goal of slowing “land consumption” in Germany from 120 ha per day in the early 1990s to below 30 ha per day in 2030 (known as the “30 ha goal”). The sustainability strategy defines “land consumption” as an increase in traffic and settlement area (including residential, industrial, and commercial land use), based on cadaster land-use data (Bundesregierung, 2016). In 2015 (newest available data), the average daily “land consumption” was ~66 ha (Destatis, 2017). Siedentop (2018) found that rather than general population growth, the immigration of people aged 30–50 years is a particularly good explanatory variable for “land consumption” and the author assumes that this is an age group with a strong tendency to low-density (single-family) housing. Low-density housing (one dwelling per house) has seen much stronger increases in recent decades in Germany than higher-density housing (more than two dwelling per house; 30 vs. 12% between 1995 and 2017, respectively; Destatis, 2018). While “land consumption” is a good approximation of general trends on national to regional level, it does not allow for monitoring of changes within existing settlements, for example of impervious surface (Beckmann and Dosch, 2018).
Impervious surface is generally defined as the cover of soils with impervious materials such as concrete, metal, glass, tarmac, and plastic (Scalenghe and Marsan, 2009). It is highly variable across settlements and an important factor for the ecological performance of the built environment (Arnold and Gibbons, 1996; Alberti, 2007; Scalenghe and Marsan, 2009). In particular, when it comes to the water balance, even small increases of impervious surface have been shown to have negative effects, because they increase surface runoff (Booth and Jackson, 1997). This in turn can reduce water purification, groundwater recharge, and water quality of streams (Arnold and Gibbons, 1996; Foster et al., 2011; Howard, 2015; Walsh et al., 2016), overwhelm retention ponds (Booth and Jackson, 1997), strain the pipe network and increase the risk of flooding (Booth and Jackson, 1997; Zhou et al., 2012).
Because of these known effects, the water infrastructure of new developments is planned according to the expected amount of impervious surface and the resulting surface runoff (Booth and Jackson, 1997; van Roon, 2007; Marlow et al., 2013; Walsh et al., 2016). Gray (e.g., underground pipes) and green infrastructure (e.g., bio-swales) would be overwhelmed, however, if the impervious surface cover increases after implementation (post-implementation increase). In fact, there is empirical evidence of post-implementation increases of impervious surface (as a result of increased driveways, parking spaces, extension buildings, etc.) from residential areas in Europe and the USA (Pauleit et al., 2005; Perry and Nawaz, 2008; Verbeeck et al., 2011; Warhurst et al., 2014; Lee et al., 2017). Gray and green infrastructure would also be overwhelmed if the implementation already contained more impervious surface cover than originally planned (post-planning increase). Small and dispersed increases of impervious surface, whether post-implementation or post-planning, would not be registered in land-use cadaster data. Hence, they remain invisible for indicators like the German “land consumption” measure. This is why we refer to this phenomenon as “hidden urbanization.”
Given the limited empirical evidence base for “hidden urbanization,” we aim at quantifying possible post-planning changes in impervious surface and our assumption is that a gap exists between planning and implementation. In order to do so, we compare development plans of low-density (single-family) housing developments in Lower Saxony, Germany, to the actual status-quo. We model the environmental impact of differences between planning and status-quo using the local water balance, because of its sensitivity to even small changes in impervious surface and its central role in ecosystem processes and services. After a brief introduction of the case study area, a description of the sites and the hydrological modeling, we present and discuss our results. We finish the article with recommendations for indicators that could monitor “hidden urbanization,” debate the policy implications of “hidden urbanization” and rethink design processes in order to prevent “hidden urbanization.”
Materials and Methods
Case Study Region
Our study is part of the METAPOLIS project (Neumann et al., 2017), which focuses on two parts of the state of Lower Saxony, in northwestern Germany (Figure 1A). One part is located in the east of Lower Saxony and includes the cities of Braunschweig, Wolfsburg and Salzgitter, with 251,364, 124,045, and 101,079 inhabitants in 2015, respectively (LSN, 2018). The second part is located south of Bremen and includes Vechta with 31,558 inhabitants as its largest city (LSN, 2018). The rationale behind the split case study region derives from the study design of the METAPOLIS project. It is a compromise between not being able to study all of Lower Saxony, while still covering two typical regions in respect to biogeography, industrialization, agriculture, and settlement structure.
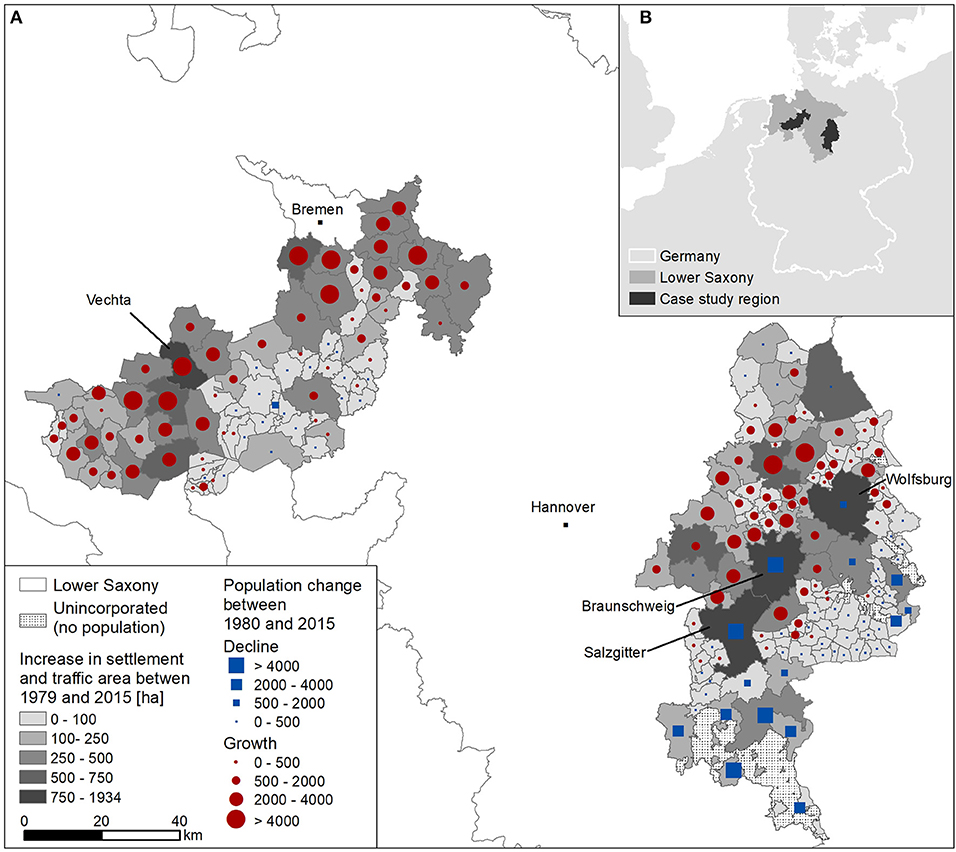
Figure 1. Land consumption (increase of settlement and traffic area) between 1979 and 2015 is shown in grayscale, population decline between 1980 and 2015 in blue squares, population increase between 1980 and 2015 in red circles (A). Land consumption is widespread and even occurred in municipalities with population decline. The case study area in Lower Saxony (B). Data A: ESRI basemap Europe and BKG (2016). Data B: LSN (2018) and BKG (2016).
The total population of the case study region in 2015 was 1,671,926 and the total size 911 km2. Between 1980 and 2015, the population has increased by 7% while the area covered by settlement and traffic area increased by 34%. While some parts of the study region have experienced an overall decline in population and stagnating growth of settlement and traffic area, smaller municipalities around Braunschweig, Wolfsburg and Bremen, but also Vechta and surrounding municipalities have seen population growth and growth of settlement and traffic area. Some municipalities, especially Braunschweig, Wolfsburg and Salzgitter, have actually experienced growth of settlement and traffic area while the population declined (Figure 1B; statistical data from LSN, 2018). According to the latest census (Statistische Ämter des Bundes und der Länder, 2014) the majority (77%) of the 451,264 buildings in our case study region with residential use have been built after 1949: 11% between 1950 and 59, 15% between 1960 and 69, 15% between 1970 and 79, 10% between 1980 and 89, 14% between 1990 and 99, and 11% between 2000 and 2010. Approximately 72% of all houses with residential use are single family (one dwelling per house).
Development Plans
The legally binding document that steers building in Germany is the development plan (in German: “Bebauungsplan”). It contains detailed information on permitted type of building, permitted floor number, the detailed definition of land uses, and most important for this study, permitted base area (in German “Grundflächenzahl”; Streich, 2011). The base area is the total area of land assigned for residential use, divided by the sum of the main building and other built structures like garages or driveways (§19 BauNVO) and thus represents a good approximation of anticipated impervious surface cover. For example, a base area of 0.3 means that 30% of a property can be covered. The law is rather lax when it comes to exceeding the base area, however, and it can be surpassed by 50% (§19 BauNVO). In the case of the 0.3 base area example, the legal limit would be 0.45.
From within our study region, we selected eight development plans, also referred to as “sites” below. We relied on publicly available plans (through either download of PDF files or WMS GIS server). All plans represented predominantly single-family housing developments in formerly undeveloped outskirt areas. They came into effect between 1997 and 2013. The sites were selected so they would cover our case study area: three sites are from the western part of the case study region and five from the eastern. Four of the sites are located in the outskirts of major urban centers (“higher-order central places”), while the other four are part of smaller municipalities (“lower-order central places”) according to a recent assessment (BBSR, 2018; Table 1).
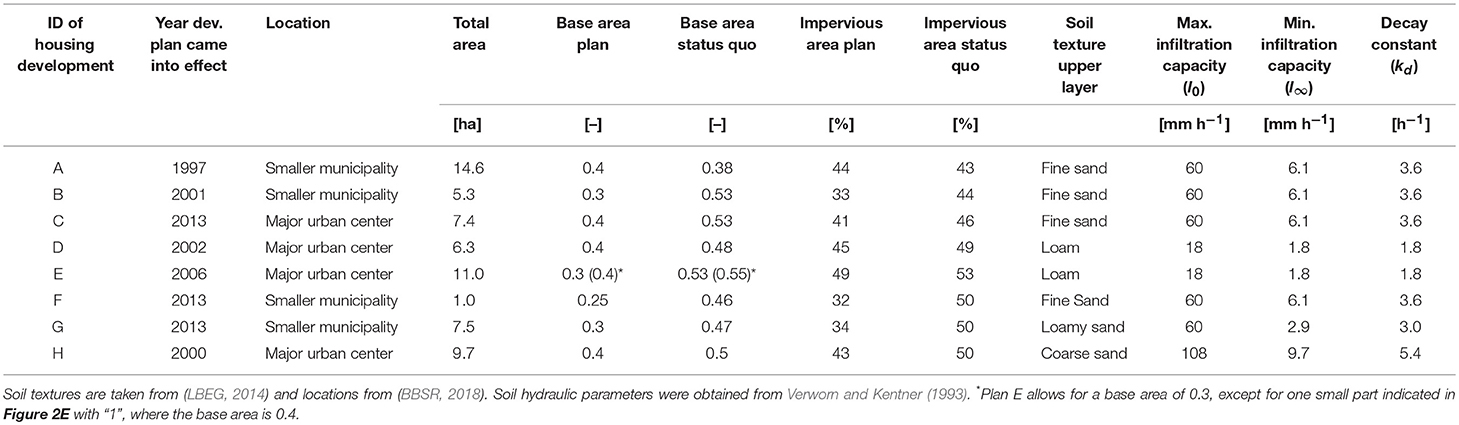
Table 1. Key characteristics of the housing development plans (PLAN), and the actual realization (STATUS QUO), model setup and soil properties of the hydrological simulations in SWMM.
The original plans (PLAN) were georeferenced (unless they were already on a GIS server) and digitized into vector format in ArcGIS 10.5. We then digitized the actual land cover (STATUS QUO) using 2016 orthophotos (LGLN, 2016) but also referred to Google Maps to assist with the interpretation. We digitized houses, terraces, garages, and driveways as impervious surface, admitting that terraces and driveways could be partially permeable, but this was not visible on orthophotos. Gravel gardens were considered fully pervious. Green roofs were not observed. Metadata on the plans are provided in Table 1 and the plans are shown in Figure 2. We do not provide names and locations of the developments, because we do not want to single out specific municipalities or even homeowners for something that we consider a broad phenomenon. The later would also very likely collide with Germany's strict data protection laws (Hermerschmidt, 2014).
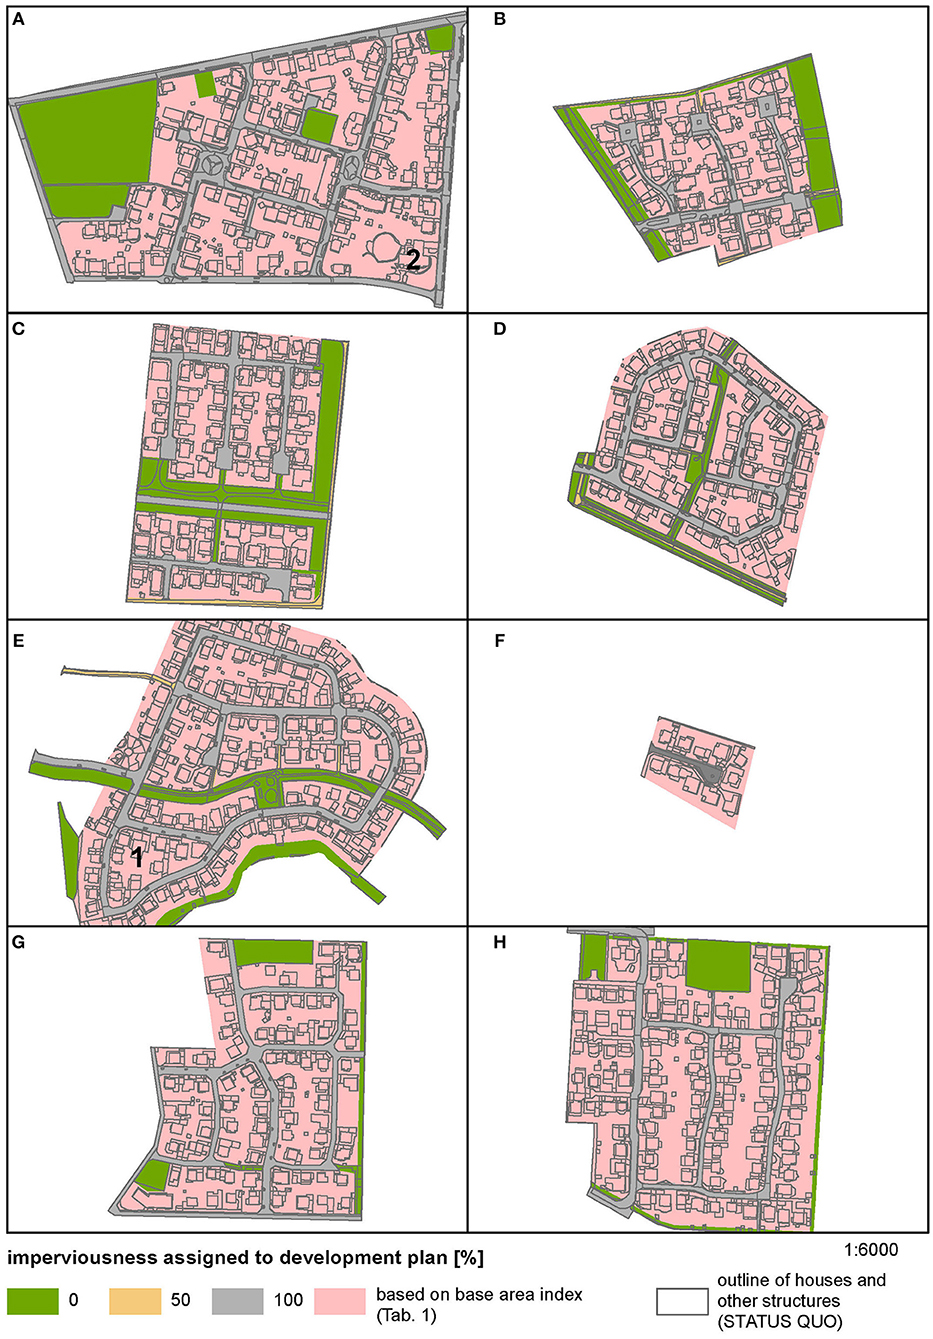
Figure 2. The housing development plans with the assigned imperviousness. The status quo of built structures (houses, garages, driveways) are shown as light gray lines. For more information on the sites, refer to Table 1. The number 1 in development plan E refers to a section with higher base area (c.f. Table 1). Number 2 in the development plan A refers to an area of public use where no base area was given. Therefore, the base area was assumed to be equal to the rest of the area.
Modeling of Local Water Balance
Water balance simulations were conducted using the US EPA Stormwater Management Model (SWMM5; Rossman, 2010). SWMM5 is a hydrological-hydraulic modeling software, frequently used in the context of urban drainage research. To analyze the effect of heavy rainfall events on the different sites, we performed simulations using hourly design rain events (P) of different annuality (0.5, 1, 2, 3, 5, 10, 20, 50, and 100 years, respectively; Supplementary Figure 1).
In this study, only the runoff (Q) from the recharging surfaces, infiltration (I) and evaporation rates (E) are calculated, neglecting the pipe network, which is not necessary when comparing relative changes. After a simulation time of 1 day, the following global water balance can be analyzed:
Two models were set up for each of the sites. The first model, PLAN, relates to the impervious surface area proposed in the development plan (housing + roads + other). The base area is used to calculate the percentage of imperviousness for the housing areas (Figure 2 and Table 1). The second model, STATUS QUO, builds on the subcatchment shapes from the first model, but on the percentage of imperviousness of the digitalized status quo (housing + roads + other land cover; Figure 2 and Table 1). The subcatchment shapes with their spatial properties are translated into surcharging surface in SWMM. For each surcharging surface, a water balance is calculated independently. At the end of the simulation time, the water balances are summarized to the global balance (Equation 1).
Runoff calculation in SWMM is implemented conceptualizing the flow across the surcharging surfaces as a uniform flow within a rectangular channel, in order to solve the Manning-Strickler equation:
The roughness coefficient (n) is estimated 0.01 s m−1/3 for impervious areas and 0.2 s m−1/3 for pervious areas. All of the sites are situated in flat terrain with slopes (S) around 1%. The terrain was interpolated between ground heights of soil drilling cores (LBEG, 2014). The hydraulic radius (R) is calculated based on the water depth per time step. The cross-sectional area (Ax) is defined as the width through which runoff occurs times the difference of water depth and depression storage. Because of the lack of high resolution topographical maps, the width is estimated. Comparability of PLAN and STATUS QUO is given, since the width of the surcharging surfaces does not change. Depression storages are estimated as 0.58 mm for impervious surface and 1.5 mm for pervious surface.
In this study, we calculate infiltration applying Horton's infiltration model with the parameters maximum (initial) infiltration capacity (I0), minimum (equilibrium) infiltration capacity (I∞), and a decay constant (kd). Potential infiltration (Ip(t)) is estimated by:
The texture of upper soil layers was obtained from soil drilling cores near the different sites (LBEG, 2014). Soil hydraulic parameters for the different soil textures used in the Horton model are based on Verworn and Kentner (1993) and are listed in Table 1. Actual infiltration (I) is defined as the precipitation (P) per time step unless it exceeds potential infiltration (Ip(t)); in that case, actual infiltration (I) is defined as potential infiltration (Ip(t)). In this study the evaporation rate (E) is kept constant at 0.9 mm d−1 during the entire simulation period. This rate refers to the multiannual mean real evapotranspiration rate for Lower Saxony (DWD, 2015). The effect of transpiration by plants is only included in the calculation of the constant evaporation rate, however, and there is no advanced evapotranspiration model implemented in this setup. Furthermore, daily variations are not taken into account.
Results
Base Area and Impervious Surface
All sites are different in total size, road pattern and layout of public green (Figure 2, filled colors), but relatively similar when it comes to floor area of buildings (Figure 2, gray lines). All sites had base areas between 0.25 and 0.4 according to PLAN, and all but one exceed this base area when looking at STATUS QUO (Table 1). When the legal margins of an additional 50% of the base area is added to the plans, sites B, E, F, and G also exceed the legal margin in STATUS QUO. Only site A remains below the base area of PLAN.
Since the base area is closely related to the impervious surface area, the total impervious surface, which includes public streets, paths, etc., shows the same pattern (Table 1). With exception of site A, the total impervious area is higher in the STATUS QUO than in the original PLAN. The highest relative increases of impervious area occur at sites F (33%), G (47%), and B (56%).
The location of the sites either in the outskirt of major urban centers (C, D, E, H) or in smaller municipalities (A, B, G, F) does not appear to have an effect on the change in base area and impervious surface.
Water Balance
Comparing the water balances of PLAN with STATUS QUO of all the sites but A, infiltration rates decrease between 4 and 19%, evaporation rates and surface runoff increase by 0.2–1% and 4–18%, respectively (Figure 3). This is consistent with the increase of total impervious surface cover. The biggest reduction of infiltration occurs in the smallest sites (F), which also shows the largest transgression of base area when comparing PLAN with STATUS QUO.
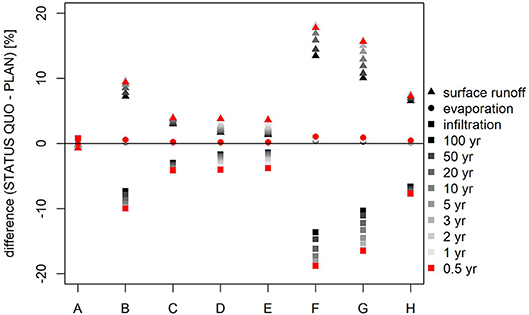
Figure 3. Differences in water fluxes (surface runoff, evaporation, and infiltration) between the STATUS QUO and the PLAN models of the eight low-density housing developments (A–H) for rain events of increasing annuality (0.5–100 years; Supplementary Figure 1). A negative difference of water fluxes corresponds to a decrease in water fluxes in the STATUS QUO compared to the PLAN; whereas, accordingly, a positive difference corresponds to an increase.
With increasing difference of the percentage of impervious area, the scattering between the rain events is getting wider (Figure 3). While sites B, F, and G would be about 65% pervious according to PLAN and lots of water could infiltrate during rain events of low annualities, in the STATUS QUO only 50% of the area is pervious. These differences become less important with higher annualities. In general, the differences between STATUS QUO and PLAN are smaller for rain events with high annuality (storm events). In that case, the effect of surface sealing becomes less important, since soils become fully saturated and begin to act as if they were impervious. Soils with low maximum infiltration capacities are saturated faster than those with high maximum infiltration capacities. Thus, the differences between the simulations become smaller at small annualities for residential areas D and E and at large annualites for residential area H (Table 1, Figure 3). In general, the higher the percentage of impervious surface, the more water evaporates. Increasing the impervious surface by 10% results in an increase of evaporation of 0.06 mm m−2 d−1.
Discussion
All sites but one show higher base area and consequently higher impervious surface in STATUS QUO than in PLAN, thus experiencing what we would call “hidden urbanization.” This seems to be independent of location (major urban center or smaller municipalities), but we cannot make broad generalizations due to the small number of studied sites. The scale of post-planning increases of impervious surface (between 8 and 56%) is similar to previously observed post-implementation increases: In Los Angeles County, USA, impervious cover of residential lots increased by 17.8% between 2000 and 2009 (Lee et al., 2017). In urban domestic gardens in collective housing projects in Leuven, Belgium, impervious surfaces increased between 38 and 56% between the year of construction (1923–1962) and 2008 (Verbeeck et al., 2011). The impervious cover of front gardens in Southampton, UK, increased by 22.47% between 1991 and 2011 (Warhurst et al., 2014). In a suburban part of Leeds, UK, impervious surfaces increased by 13% between 1971 and 2004 (Perry and Nawaz, 2008), and in Merseyside, UK, cover of built and paved areas increased by 6–8% between 1975 and 2000 (Pauleit et al., 2005). In most of these cases, the increase of impervious surface has happened over decades. In our case, even the very recent developments C, F, and G show an estimated increase of 12, 47, and 56%, respectively (c.f. Table 1 and Figure 3). We take this as evidence for post-planning, rather than post-implementation increases in imperviousness. We discuss the impacts of the observed “hidden urbanization” on the hydrological cycle in the next section. After that, we make recommendations for indicators that monitor post-implementation and post-planning increases of impervious cover, debate the policy implications of “hidden urbanization” and rethink design processes in order to prevent “hidden urbanization.”
Environmental Impacts of “Hidden Urbanization”
Compared to PLAN, in some cases the STATUS QUO both reduces infiltration and increases surface runoff by over 10%. There is some modulation due to soil type, but biggest increases of impervious surface cover also lead to the biggest changes in the hydrological cycle (c.f. F in Table 1 and Figure 3). While increasing rainfall (events of low recurrence) decreases the relative differences between STATUS QUO and PLAN, the absolute amounts could still be enough to overwhelm the pipe network and retention capacity. With information on the local water infrastructure, this could be studied in the future. In any case, if such trends happen across larger catchments, there are serious consequences, for example, regarding the water quality of surface and ground water, groundwater recharge or flood risk (Arnold and Gibbons, 1996; Booth and Jackson, 1997; Pauleit et al., 2005; Perry and Nawaz, 2008; Foster et al., 2011; Warhurst et al., 2014).
Secure supply of clean water, public health, waste water drainage, and water treatment were drivers for development of urban water systems in the past (Gandy, 2004). Nowadays, localizing the water balance by increasing on-site infiltration and storage is gaining more and more attention, an approach referred to as sustainable urban drainage management (Marlow et al., 2013) or water sensitive urban design (Fletcher et al., 2013, 2014). It requires integrated planning and community acceptance and it is probably safe to say that the success of such an approach is diminished by “hidden urbanization.” Based on our results, simply relying on the adherence to specifications such as the base area is not recommended.
Measuring “Hidden Urbanization”
In order to assess the full scale and impact of “hidden urbanization,” impervious surface needs to be measured. So far, studying post-implementation increases of imperviousness within residential areas has involved digitizing orthophotos manually (Pauleit et al., 2005; Perry and Nawaz, 2008; Verbeeck et al., 2011; Warhurst et al., 2014; Lee et al., 2017). This is a very slow process and probably the reason why only few studies on the subject exist. Since around the turn of the century, digital orthophotos or high-resolution satellite images are available. Automatically detecting changes of imperviousness will thus become easier (Klopp and Petretta, 2017; Rienow et al., 2018; UN, 2018). Given the small area covered by our sites, automation was not necessary in this study, even though we had access to digital orthophotos.
Studying post-development increases of impervious surface is mostly limited in respect to availability and accessibility of the development plans. The plans are stored on various platforms, in different data formats, and had to be transformed into GIS data. While they are open to the public, only some municipalities make them available in a digital form. Older plans sometimes only exist on paper. Technically, there is no reason why these plans could not be provided in a standardized form on a single platform. Providing standardized and publicly available data, comparing plans to outcomes, and measuring changes in impervious surface in real time is possible. But who should measure “hidden urbanization” and what should be the consequences? As we discuss in the next section, there are no simple answers.
The Policy Implication of “Hidden Urbanization”
In the German multi-level governance system, municipalities have strong constitutionally protected powers when it comes to organizing and shaping space. In local building policies, municipalities often aim at attracting new inhabitants and businesses, and because municipalities compete over people and money, they often pursue a demand-oriented building policy: If people want to build new and large structures, this is generally being made possible (Malburg-Graf, 2018). In addition, our results indicate that specifications such as the base area are not strictly enforced.
A straightforward approach for reducing “land consumption” and “hidden urbanization” within housing areas is top-down regulatory steering of the municipalities. The instruments of the administrative levels above municipalities, in the German case the districts and the federal states, mainly consist of more binding provisions. A less liberal strategy toward extent and specification of urban development would effectively preserve land and avoid extensive sealing (Siedentop, 2018). This goal may be achieved by providing more specific and measurable goals for private land use (see also section The design implications of hidden urbanization) and subsequent monitoring. The subsequent issue of how to deal with local defectors, however, could become hazardous for local communities, when measures include suing residents or even neighbors. A less drastic approach would be to address people directly, in order to change behavior. Information campaigns, including publications or events, may be one approach. Fostering existing associations, groups and initiatives active in conservation, gardening or building culture, could be another (Artmann, 2015). A wastewater fee that is partially based on sealed surface (so-called “split waste water fee”), is another incentive that could help prevent surface sealing (Nickel et al., 2013). Such a fee actually exists for five of the eight sites studied here. It is not clear if it could prevent “hidden urbanization,” though. For example, the average annual stormwater charge is € 0.89/m2 (Nickel et al., 2013), which would mean that the annual fee for a 600 m2 property would only increase by €53 for an increase of impervious surface from 30 to 40%. This is probably not high enough in order to prevent “hidden urbanization.” More research would also be needed on the effectiveness of the assessment methods of the local water authorities for detecting small-scale changes of imperviousness. In one of our cases, the fee is actually assessed according to the base area of the development plans. Therefore, changes of impervious surface would remain hidden.
In agenda setting, indicators fulfill the task of pointing toward deficits and problematic developments. Political stakeholders will utilize and interpret existing indicators and their results in order to bring up and justify their own policies (Kingdon, 2003; DeLeo, 2018). In the case of “land consumption,” the cadaster data used in the German national sustainability strategy does not directly measure changes in imperviousness, so a part of urbanization remains hidden. Although it cautions to confuse “land consumption” with impervious surface (Bundesregierung, 2016), it elaborates on the latter as if it was a part of the phenomenon of interest. If indicators emphasize some aspects while leaving out others, consequences unfold regarding implementation and agenda setting. They include “gaming” with the indicator by concentrating resources on a certain measured aspect of a process. This may enhance the outcome in terms of the indicator, but is also likely to reduce the quality of unmeasured aspects (Bevan and Hood, 2006). This effect, known as “synecdoche” in the administration literature, is also a risk for sustainability indicators. Although the new edition of the German sustainability strategy has introduced two new indicators on land use, critical evaluations that point toward missing ecological aspects (Leukhardt and Allen, 2013), are still valid. On the other hand, keeping instruments parsimonious and avoiding a “logic of escalation” leading to more and more indicators is an opposing but also important goal (Pollitt, 2013). In the case of “land consumption,” a comprehensive impervious surface indicator would actually be a useful addition (Beckmann and Dosch, 2018). In order to detect “hidden urbanization,” its spatial resolution would have to be high (~1 m). In the German multi-level governance system, the federal level would probably be the best to ensure comparability across the whole country.
The Design Implications of “Hidden Urbanization”
Putting the observation aside that low-density housing development is not the path to greater sustainability (Rees and Wackernagel, 1996; Kahn, 2000; Carlow, 2016; Holl, 2018), planners, architects, and urban designers would need to introduce integrated design strategies for low-density housing towards more sustainable neighborhoods with reduced surface sealing; or together with authorities rethink the need for this type of development. Our results indicate that the dwellers deliberately seal areas planned to be pervious. One possible driver for increasing imperviousness commonly discussed, is the need for parking (Pauleit et al., 2005; Perry and Nawaz, 2008; Warhurst et al., 2014). In our case, the development plans account for parking, but we can only speculated whether the assigned space corresponds with the actual needs of residents. We know that the number of vehicles has constantly increased in Germany over the last decades (Umweltbundesamt, 2018) and so has the average car size (e.g., Van den Brink and Van Wee, 2001). Other reasons for increasing impervious surface cover could be related to garden trends and lifestyle changes, e.g., a lower demand for homegrown fruits and vegetables and a higher demand for low maintenance (Cameron et al., 2012; Jakobsson and Dewaelheyns, 2018). The drivers of “hidden urbanization” in low-density housing areas should be subject to future investigation.
Our results indicate that the base area is not a reliable instrument for limiting the amount of impervious surface in low-density housing areas. A more reliable approach could be to include more specific and measurable goals in the design. For example, the “Bo01” development in Malmö, Sweden, adopts the so-called “Green Space Factor” to secure a minimum of permeable area for each lot. Also, parking is reduced to only 0.7 spaces per unit, which contributes to less sealed surfaces (Austin, 2013). Another example is the “Arkadien Winnenden,” Germany, which implemented water sensitive design that includes large public spaces for water retention (Wojnowska-Heciak and Janus, 2016).
In the end, the key challenge of making human settlements more sustainable and preventing “hidden urbanization” cannot rest solely on the shoulders of designers and planners. It involves many actors on many scales: from the national level, where perverse incentives through tax-breaks or substitutes encourage low-density housing; to municipalities, which open up land for low-density housing with few regulations; to individual house owners, whose decisions have consequences beyond their fence.
Data Availability
Due to privacy concerns, we do not provide names and location of the housing developments. The material can be made available upon request to interested researchers.
Author Contributions
MWS, AOD, and MM contributed conception and design of the study. MWS collected, digitized, and organized the data, AOD performed the modeling. MWS, AOD, MM, and MS wrote the first draft of the manuscript. OM, A-KS, BS, and SW contributed sections of the manuscript. All authors contributed to manuscript revision, read, and approved the submitted version.
Funding
This research was funded by the program Science for Sustainable Development of the VolkswagenFoundation and the Ministry for Science and Culture of Lower Saxony (METAPOLIS, grant no. ZN3121).
Conflict of Interest Statement
The authors declare that the research was conducted in the absence of any commercial or financial relationships that could be construed as a potential conflict of interest.
Acknowledgments
We would like to thank all our colleagues of the METAPOLIS team and our METAPOLIS stakeholders, who helped identifying the topic of this study and continue to contribute to our research. We would also like to thank Till Metge and Mario App for their help with digitizing geodata and André Dehus for helping with setting up the water balance simulations.
Supplementary Material
The Supplementary Material for this article can be found online at: https://www.frontiersin.org/articles/10.3389/fenvs.2019.00029/full#supplementary-material
Supplementary Figure 1. Euler Type II design rains of 1-h duration and annuality between 0.5 and 100 years in 5-min resolution, including the total amount of precipitation in mm over the whole interval of 1 h.
References
Alberti, M. (2007). Ecological signatures: the science of sustainable urban forms. Places 19, 56–60. Available online at: https://escholarship.org/uc/item/6nv1x61b
Arnold, C. L., and Gibbons, C. J. (1996). Impervious surface coverage: the emergence of a key environmental indicator. J. Am. Plann. Assoc. 62, 243–258. doi: 10.1080/01944369608975688
Artmann, M. (2015). Managing urban soil sealing in Munich and Leipzig (Germany)—From a wicked problem to clumsy solutions. Land Use Policy 46, 21–37. doi: 10.1016/j.landusepol.2015.02.004
Austin, G. (2013). Case study and sustainability assessment of Bo01, Malmö, Sweden. J. Green Build. 8, 34–50. doi: 10.3992/jgb.8.3.34
BBSR (2018). Data from: Zuordnung der Gemeinden zu ihrer Zentralörtlichen Einstufung, Raumordnungsplan-Monitor (ROPLAMO) des BBSR.
Beckmann, G., and Dosch, F. (2018). “Monitoring der Siedlungsflächenentwicklung,” in Flächeninanspruchnahme in Deutschland, eds M. Behnisch, O. Kretschmer and G. Meinel. (Berlin; Heidelberg: Springer Spektrum), 3–24. doi: 10.1007/978-3-662-50305-8_1
BKG (2016). GeoBasis-DE. Available online at: http://www.bkg.bund.de (Accessed February 28, 2019).
Booth, D. B., and Jackson, C. R. (1997). Urbanization of aquatic systems: degradation thresholds, stormwater detention, and the limits of mitigation. J. Am. Water Resour. As. 33, 1077–1090. doi: 10.1111/j.1752-1688.1997.tb04126.x
Bundesregierung (2016). Deutsche Nachhaltigkeitsstrategie. Available online at: www.deutsche-nachhaltigkeitsstrategie.de (Accessed October 31, 2018).
Cameron, R., Blanuša, T., Taylor, J., Salisbury, A., Halstead, A., Henricot, B., et al. (2012). The domestic garden – its contribution to urban green infrastructure. Urban For. Urban Gree. 11, 129–137. doi: 10.1016/j.ufug.2012.01.002
DeLeo, R. A. (2018). Indicators, agendas and streams: analysing the politics of preparedness. Policy Polit. 46, 27–45. doi: 10.1332/030557317X14974484611316
Destatis (2017). Nachhaltige Entwicklung in Deutschland. Indikatorenbericht 2016. Statistisches Bundesamt (Destatis). Available online at: www.destatis.de/DE/Publikationen/Thematisch/UmweltoekonomischeGesamtrechnungen/Umweltindikatoren/IndikatorenPDF_0230001.pdf (Accessed October 31, 2018).
Destatis (2018). Data from: GENESIS Database. Table 31231-0001. Statistische Bundesamt (Destatis). Available online at: https://www-genesis.destatis.de/genesis/online (Accessed: December, 22, 2018)
DWD (2015). DWD Climate Data Center Calculated Mean Monthly Values for Different Characteristic Elements of Soil and Crops, Version V0.x. Available online at: www.dwd.de (Accessed: October 31, 2018)
Fletcher, T. D., Andrieu, H., and Hamel, P. (2013). Understanding, management and modelling of urban hydrology and its consequences for receiving waters: a state of the art. Adv. Water Resour. 51, 261–279. doi: 10.1016/j.advwatres.2012.09.001
Fletcher, T. D., Shuster, W., Hunt, W. F., Ashley, R., Butler, D., Arthur, S., et al. (2014). SUDS, LID, BMPs, WSUD and more – The evolution and application of terminology surrounding urban drainage. Urban Water J. 12, 1–18. doi: 10.1080/1573062X.2014.916314
Foster, S. D., Hirata, R., and Howard, K. W. F. (2011). Groundwater use in developing cities: policy issues arising from current trends. Hydrogeol. J. 19, 271–274. doi: 10.1007/s10040-010-0681-2
Gandy, M. (2004). Rethinking urban metabolism: water, space and the modern city. City 8, 363–379. doi: 10.1080/1360481042000313509
Gaston, K. J. (ed.). (2010). “Urbanization,” in Urban Ecology (Cambridge: Cambridge University Press), 10–34. doi: 10.1017/CBO9780511778483.003
Grimm, N. B., Faeth, S. H., Golubiewski, N. E., Redman, C. L., Wu, J., Bai, X., et al. (2008). Global change and the ecology of cities. Science 319, 756–760. doi: 10.1126/science.1150195
Hermerschmidt, S. (2014). “Datenschutz bei kleinräumigen Auswertungen – Anforderungen und Grenzwerte,” in Flächennutzungsmonitoring VI. Innenentwicklung – Prognose – Datenschutz, IÖR Schriften Band 65, eds G. Meinel, U. Schumacher and M. Behnisch (Berlin; Heidelberg: Rhombos-Verlag), 251–259.
Holl, C. (2018). Vom Gebiet zum Quartier. Marlowes. Available online at: https://www.marlowes.de/vom-gebiet-zum-quartier/ (Accessed: October 31, 2018)
Howard, K. W. F. (2015). Sustainable cities and the groundwater governance challenge. Environ. Earth Sci. 73, 2543–2554. doi: 10.1007/s12665-014-3370-y
Jakobsson, A., and Dewaelheyns, V. (2018). Contemporary interpretation of the meaning and heritage of early 20th century private gardens: from an historical reflection to a future outlook in planning. Urban For. Urban Gree. 30, 210–219. doi: 10.1016/j.ufug.2018.02.003
Kahn, M. E. (2000). The environmental impact of suburbanization. J. Policy Anal. Manag. 19, 569–586. doi: 10.1002/1520-6688(200023)19:4<569::AID-PAM3>3.0.CO;2-P
Klopp, J. M., and Petretta, D. L. (2017). The urban sustainable development goal: indicators, complexity and the politics of measuring cities. Cities 63, 92–97. doi: 10.1016/j.cities.2016.12.019
LBEG (2014). “Lower Saxony Soil Information System NIBIS®,” in Landesamt für Bergbau, Energie und Geologie (LBEG). Available online at: http://nibis.lbeg.de/cardomap3/ (Accessed October 31, 2018)
Lee, S., Longcore, T., Rich, C., and Wilson, J. P. (2017). Increased home size and hardscape decreases urban forest cover in Los Angeles County's single-family residential neighborhoods. Urban For. Urban Gree. 24, 222–235. doi: 10.1016/j.ufug.2017.03.004
Leukhardt, F., and Allen, S. (2013). How environmentally focused is the German sustainability strategy? A critical discussion of the indicators used to measure sustainable development in Germany. Environ. Dev. Sustain. 15, 149–166. doi: 10.1007/s10668-012-9380-6
LGLN (2016). “Orthophoto. Auszug aus den Geobasisdaten der Niedersächsischen Vermessungs- und katasterverwaltung.” Landesamt für Geoinformation und Landesvermessung Niedersachsen. Available online at: https://www.lgln.niedersachsen.de/startseite/ (Accessed October 31, 2018)
LSN (2018) “LSN-Online - die kostenfreie Regionaldatenbank für Niedersachsen,” in Landesamt für Statistik Niedersachsen. Available online at: https://www1.nls.niedersachsen.de/statistik/default.asp (Accessed October 31, 2018).
Malburg-Graf, B. (2018). “Herausforderungen für das Flächenmanagement im ländlichen Raum – Handlungsoptionen für die Praxis,” in Flächeninanspruchnahme in Deutschland, eds M. Behnisch, O. Kretschmer and G. Meinel (Berlin; Heidelberg: Springer Spektrum), 95–108.
Marlow, D. R., Moglia, M., Cook, S., and Beale, D. J. (2013). Towards sustainable urban water management: a critical reassessment. Water Res. 47, 7150–7161. doi: 10.1016/j.watres.2013.07.046
McIntyre, N. E., Knowles-Yánez, K., and Hope, D. (2000). Urban ecology as an interdisciplinary field: differences in the use of “urban” between the social and natural sciences. Urban Ecosyst. 4, 5–24. doi: 10.1023/A:1009540018553
Neumann, D., Sedrez, M., and Carlow, V. M. (2017). “Scenarios for Sustainable development of the Lower Saxony Metapolis,” in Territories: Rural-Urban Strategies, eds J. Schröder, M. Carta, M. Ferretti and B. Lino (Berlin: Jovis), 258–265.
Nickel, D., Schoenfelder, W., Medearis, D., Dolowitz, D. P., Keeley, M., and Shuster, W. (2013). German experience in managing stormwater with green infrastructure. J. Environ. Plann. Man. 57, 403–423. doi: 10.1080/09640568.2012.748652
Pauleit, S., Ennos, R., and Golding, Y. (2005). Modeling the environmental impacts of urban land use and land cover change—a study in Merseyside, UK. Landsc. Urban Plan.71, 295–310. doi: 10.1016/S0169-2046(04)00083-0
Perry, T., and Nawaz, R. (2008). An investigation into the extent and impacts of hard surfacing of domestic gardens in an area of Leeds, United Kingdom. Landsc. Urban Plan. 86, 1–13. doi: 10.1016/j.landurbplan.2007.12.004
Pollitt, C. (2013). The logics of performance management. Evaluation 19, 346–363. doi: 10.1177/1356389013505040
Prokop, J., Obstmann, H., and Schönbauer, A. (2011). Report on Best Practices for Limiting Soil Sealing and Mitigating Its Effects. European Commission, DG Environment.
Rees, W., and Wackernagel, M. (1996). Urban ecological footprints: why cities cannot be sustainable—And why they are a key to sustainability. Environ. Impact Asses. 16, 223–248. doi: 10.1016/S0195-9255(96)00022-4
Rienow, A., Thonfeld, F., and Valentin, A. (2018). Flächenverbrauch in der Metropolregion Rheinland 1975–2030. Wiesbaden: Springer Vieweg.
Rossman, L. A. (2010). Storm Water Management Model Reference Manual Volumes I-III. United States Environmental Protection Agency Reports.
Scalenghe, R., and Marsan, F. (2009). The anthropogenic sealing of soils in urban areas. Landscape Urban Plan. 90, 1–10. doi: 10.1016/j.landurbplan.2008.10.011
Science for Environment Policy (2016). “No net land take by 2050?” Future Brief 14. Produced for the European Commission DG Environment by the Science Communication Unit, Bristol. Available online at: http://ec.europa.eu/science-environment-policy (Accessed October 31, 2018)
Seto, K. C., Fragkias, M., Güneralp, B., and Reilly, M. K. (2011). A meta-analysis of global urban land expansion. PLoS ONE 6:e23777. doi: 10.1371/journal.pone.0023777
Siedentop, S. (2018). “Ursachen der Flächeninanspruchnahme in Deutschland – eine Zwischenbilanz,” in Flächeninanspruchnahme in Deutschland, eds M. Behnisch, O. Kretschmer and G. Meinel (Berlin; Heidelberg: Springer Spektrum), 45–55.
Statistische Ämter des Bundes und der Länder (2014). Gebäude und Wohnungen. Ergebnisse des Zensus am 9. Mai 2011. Available online at: https://www.zensus2011.de/ (Accessed January 30, 2019)
Streich, B. (ed.). (2011). “Bauleitplanung,” in Stadtplanung in der Wissensgesellschaft (Wiesbaden: VS Verlag für Sozialwissenschaften), 399–457.
Umweltbundesamt (2018). Verkehrsinfrastruktur und Fahrzeugbestand. Available online at: https://www.umweltbundesamt.de/daten/verkehr/verkehrsinfrastruktur-fahrzeugbestand. (Accessed December 22, 2018)
UN (2017). World Urbanization Prospects: The 2018 Revision. United Nations, Department of Economic and Social Affairs, Population Division.
UN (2018). DG 11 Synthesis Report 2018: Tracking Progress Towards Inclusive, Safe, Resilient and Sustainable Cities and Human Settlements. United Nations.
Van den Brink, R. M. M., and Van Wee, B. (2001). Why has car-fleet specific fuel consumption not shown any decrease since 1990? Quantitative analysis of Dutch passenger car-fleet specific fuel consumption. Transport. Res. D Tr. E. 6, 75–93. doi: 10.1016/S1361-9209(00)00014-6
van Roon, M. (2007). Water localisation and reclamation: steps towards low impact urban design and development. J. Environ. Manage. 83, 437–447. doi: 10.1016/j.jenvman.2006.04.008
Verbeeck, K., Orshoven, J., and Hermy, M. (2011). Measuring extent, location and change of imperviousness in urban domestic gardens in collective housing projects. Landscape Urban Plan. 100, 57–66. doi: 10.1016/j.landurbplan.2010.09.007
Verworn, H. R., and Kentner, G. (1993). Abflussbildungsansätze für niederschlag-abfluss-modellierung. Z. Stadtentwässerung Gewässerschutz 24, 3–50.
Walsh, C. J., Booth, D. B., Burns, M. J., Fletcher, T. D., Hale, R. L., Hoang, L. N., et al. (2016). Principles for urban stormwater management to protect stream ecosystems. Freshw. Sci. 35, 398–411. doi: 10.1086/685284
Warhurst, J. R., Parks, K. E., McCulloch, L., and Hudson, M. D. (2014). Front gardens to car parks: changes in garden permeability and effects on flood regulation. Sci. Total Environ. 485, 329–339. doi: 10.1016/j.scitotenv.2014.03.035
Wojnowska-Heciak, M., and Janus, A. (2016). Landscape solutions for small retention. Struct. Environ. 8, 116–124. Available online at: https://www.infona.pl/resource/bwmeta1.element.baztech-744cd540-2b18-40a2-9911-462217a3ca8a
Keywords: urbanization, impervious surface, land consumption, surface runoff, infiltration, hydrological modeling, sustainability indicators, low-density housing
Citation: Strohbach MW, Döring AO, Möck M, Sedrez M, Mumm O, Schneider A-K, Weber S and Schröder B (2019) The “Hidden Urbanization”: Trends of Impervious Surface in Low-Density Housing Developments and Resulting Impacts on the Water Balance. Front. Environ. Sci. 7:29. doi: 10.3389/fenvs.2019.00029
Received: 03 November 2018; Accepted: 20 February 2019;
Published: 15 March 2019.
Edited by:
Ioan Cristian Ioja, University of Bucharest, RomaniaReviewed by:
Martina Artmann, Leibniz Institute of Ecological Urban and Regional Development (LG), GermanyManuel Wolff, Humboldt-Universität zu Berlin, Germany
Copyright © 2019 Strohbach, Döring, Möck, Sedrez, Mumm, Schneider, Weber and Schröder. This is an open-access article distributed under the terms of the Creative Commons Attribution License (CC BY). The use, distribution or reproduction in other forums is permitted, provided the original author(s) and the copyright owner(s) are credited and that the original publication in this journal is cited, in accordance with accepted academic practice. No use, distribution or reproduction is permitted which does not comply with these terms.
*Correspondence: Michael W. Strohbach, m.strohbach@tu-braunschweig.de; michael.strohbach@gmail.com