Correlation analyses between volatiles and glucosinolates show no evidence for chemical defense signaling in Brassica rapa
 Florian P. Schiestl
- Institute of Systematic Botany, University of Zürich, Zürich, Switzerland
Positive correlations between volatile organic compounds (VOCs) and defense chemicals indicate signaling of defense status. Such aposematic signaling has been hypothesized to be widespread in plants, however, it has up to now only been shown for visual signals. Correlations between identical compounds in different plant tissues, on the other hand, can be informative about the (co-)regulation of their biosynthesis or emission. Here I use Brassica rapa to investigate (1) correlations between identical metabolites (volatiles, glucosinolates) in leaf and flower tissue, and (2) correlations between volatiles and glucosinolates in the same plant organs (flowers and leaves). Whereas the amounts of many glucosinolates were positively correlated in leaves and flower tissue, identical leaf, and floral VOCs showed no such correlations, indicating independent regulation of emission. None of the leaf or flower volatiles showed positive correlations with the two major glucosinolates (gluconapin, glucobrassicanapin) or the sum of all glucosinolates in either leaves or flowers. Some VOCs, however, showed positive correlations with minor glucosinolates which, however, represented less than one percent of the total amounts of glucosinolates. Some leaf monoterpenes showed negative associations with gluconapin. The lack of consistent positive correlations between VOCs and major defense compounds suggests that plants do not chemically signal their defense status. This could be adaptive as it may avoid eavesdropping by specialist herbivores to locate their host plants. Negative correlations likely indicate chemical trade-offs in the synthesis of secondary metabolites.
Introduction
Plants produce an array of different secondary metabolites with many different functions. Volatile compounds can act as signals to interacting organisms (Turlings et al., 1995; Schiestl and Johnson, 2013), and may contain “honest” information, for example about reward or defense status of a plant (Eisner and Grant, 1981; Wright and Schiestl, 2009; Cooney et al., 2012). The information in a signal can be mediated qualitatively (presence/absence) or quantitatively, namely through a correlation between the strengths of the signal and the trait of interest. Examples of honest signals are flower size or shape indicating the available amount of floral rewards (Gomez and Perfectti, 2010), or correlations between amounts of given volatiles and floral rewards (Knauer and Schiestl, unpublished). In leaves, patterns such as stripes and red margins have been shown to signal defense (i.e., aposematic signaling; Lev-Yadun, 2009a,b; Cooney et al., 2012). Volatiles that are quantitatively associated with defense have so far not been found in plants (Pearse et al., 2013). Nevertheless, some plant volatiles have been shown to deter herbivores (Massei et al., 2007; Unsicker et al., 2009). Some of those signals are, however, not honest but mimic e.g., alarm pheromones of herbivores and thus act through sensory bias (Schiestl and Johnson, 2013).
Here I use the white turnip Brassica rapa to investigate associations between volatile organic compounds (VOCs) and defense compounds (glucosinolates) in leaves and flowers. In principle, associations between volatiles and defense compounds can be both constitutive or herbivore-induced. Natural populations, however, almost always contain plants with and without herbivory, I thus analyze a large sample of plants with and without herbivore infestation. In addition, I analyze the subset of plants without herbivory separately, to detect specific constitutive associations. The study was designed to control for genetic background by using full sib families, with each family including both control and herbivore-infested plants. Defense compounds of Brassicaceae are glucosinolates which are not volatile; their breakdown products are isothiocyanates (ITCs), which are volatile and are emitted from flowers and leaves (Textor and Gershenzon, 2009). Isothiocyanates are thus good candidates for honest signals of defense status, because a positive correlation between the amount of glucosinolates and isothiocyanates seems plausible. Brassicaceae typically contain aliphatic, indolic, and aromatic glucosinolates in leaves and flowers, which's biosynthesis is regulated by different genes (Sonderby et al., 2010). Some, especially indolic glucosinolates, are upregulated after herbivory (Hopkins et al., 2009). Among plant volatiles, flower and leaf VOCs also show considerable chemical overlap, i.e., many compounds are shared and originate from the same biosynthetic pathways (Schiestl, 2010; Dudareva et al., 2013). Whereas flower and leaf glucosinolates presumably have the same defense functions, flower and leaf VOC evolve under different primary selection pressures, namely for sexual reproduction (i.e., attraction of pollinators) in floral volatiles, but survival (deterrence of herbivores, attraction of predators) in leaf VOCs. It seems thus likely that identical glucosinolates are correlated between leaves and flowers, whereas this may not be the case for volatiles. In this study I address the following specific questions: (1) Are identical flower and leaf glucosinolates and VOCs correlated with each other? (2) Do any of the floral or leaf VOCs show correlations with either floral or leaf glucosinolates?
Materials and Methods
Plants and Treatments
Seeds of B. rapa from a natural population near Maarssen, the Netherlands, were grown in a greenhouse, and full sib families were created by artificial crosses. Ten individuals from 40 different genotypes (full sib families) were sown out sequentially from February to March, 2013, in a greenhouse under standardized soil, light and watering conditions. All plants were treated once a week with the pesticides Alaxon and Thiovit (Maag, Dielsdorf, Switzerland). These treatments were stopped and not resumed 4 days before the first application of caterpillars. At the start and during the experiment, families that had at least six members at approximately the same growth stage were selected for inclusion in the experiment. Six individuals from each family were used, of which two plants were randomly assigned to one of the three treatment groups; specifically, the control group (C), the Pieris group (P), and the Spodoptera group (S). Plants in P and S were infested with 2–10 caterpillars (depending on larval instar) of either P. brassicae or S. littoralis ca 5 days before flowering (i.e., when the flowering shoot was approximately 10 cm long). Pieris and Spodoptera caterpillars were obtained from the Institute of Agricultural Sciences, ETH, Zürich and Syngenta Crop Protection AG, Stein, respectively. Feeding was limited to the leaves by containing caterpillars in clip cages made of petri dishes. Feeding was regularly monitored, and the caterpillars were replaced, if necessary. At the time of volatile sampling, Pieris had consumed a mean (± s.e.m.) 12.24% ± 1.83 total leaf area, whereas Spodoptera had consumed only 2.25% ± 0.58 leaf area [t(39.5) = 5.2, P < 0.001]. In the C group, empty clip cages were applied as the control treatment. Generally, volatiles and glucosinolates were analyzed from the same plant individuals, but the numbers of plants analyzed for each type of compounds differed as described below.
VOC Collection
Volatiles of all plants were collected by headspace sorption in a non-destructive way, before bioassays, 2–3 days after the onset of flowering. Floral volatiles were sampled from 32 C, 32 P, and 27 S plant individuals. Leaf volatiles were sampled from a subsample of those (12 C, 13 P, and 12 S individuals) but from the same individuals and at the same time when floral volatiles were sampled. For floral and leaf volatile collection, a push-pull system was used. Inflorescences or leaves were enclosed in glass cylinders previously treated with Sigmacote (Sigma-Aldrich, St Louis, USA), and the number of open flowers was counted. The glass cylinders were closed with Teflon plates that had a central hole to avoid injuring the petiole. Air cleaned with activated charcoal filters was pushed into the glass cylinder at a rate of 100 ml/min. At the same time, air was pulled out of the cylinder at the same flow rate over a glass tube filled with 20 mg Tenax TA (60/80 mesh, Supelco, Bellefonte USA). Volatile collection was performed from 13:00 to 15:30 on 14 days. Samples from empty glass cylinders were collected as air controls.
Chemical Analysis
VOC analysis
For the analysis of floral and leaf scent, gas chromatography with mass selective detection (GC-MSD) was used. Samples were injected into a GC (Agilent 6890 N, Agilent Technologies, Santa Clara, USA) using a Gerstel thermodesorption system (TDS3, Gerstel, Mühlheim, Germany) with a cold injection system (KAS4, Gerstel). For thermodesorption, the TDS was heated from 30 to 240°C at a rate of 60°C/min and held at a final temperature for 5 min. The KAS was set to −150°C during the trapping of eluting compounds from the TDS. For injection, the KAS was heated to 250°C at a rate of 12°C/s, and the final temperature was held for 3 min. The GC was equipped with a DB-5 column (0.32 mm ID, 0.25 lm film thickness, 30 m length), and helium was used as carrier gas at a flow rate of 2 ml/min. Compound determination and quantification was completed using a mass selective detector (Agilent MSD 5975). Compounds were identified by comparing the spectra obtained from the natural samples with those from a reference collection (NIST mass spectral library). In addition, retention times and spectra of synthetic standard compounds were compared against those of natural samples. The Agilent MSD ChemStation Program was used for quantification. Three different amounts (1, 10, and 100 ng) of the synthetic standards of all compounds were analyzed on the GC-MSD system, and specific target ions were selected for each compound. The peak areas of target ions were used to calculate calibration curves and subsequent quantification implemented in the ChemStation program. All amounts of VOCs were calculated in ng per flower per liter of sampled air. For comparison, the amounts of all compounds were also calculated and compared at the per inflorescence level, with very similar results being obtained (data not shown). Compounds that were found in less than 20% of plants were not included in the analysis.
Glucosinolate analysis
Samples of fresh leaves and flowers were collected from each plant and immediately flash frozen in liquid nitrogen. Samples were weighed (50–60 mg) and ground to a fine powder in liquid nitrogen with a mortar and pestle. The fresh grinded powder was collected in an Eppendorf tube and 1 ml of ice cold MeOH:water (70:30; methanol HPLC grade) with sinalbin (5 μg/ml) as internal standard was added. Samples were vortexted for 5 s and immediately incubated at 85°C for 10 min in a block heater and simultaneously mixed with 600 rpm (Eppendorf Thermomixer® comfort). For further extraction, samples were put in an ultrasonic bath for 10 min (Advantage-Lab, Typ AL 04-04). Extracts were then centrifuged at 14,000 rpm for 10 min (Sorvall RMC 14) Kendro Laboratory Products (USA) and the supernatant was transferred to a new tube and stored at −20°C until UHPLC analysis. Extractions of flower samples were diluted (1:10) with ice cold MeOH:water (70:30) and the sinalbin standard. For UHPLC/MS analysis, gluconapin, glucobrassicin and sinalbin were used as internal standards (IS; Applichem Darmstadt, Germany). Acetonitrile (ACN), methanol (MeOH) and formic acid were ULC/MS grade solvents (Biosolve, Chemie Brunschwig, Basel, Switzerland). Ultra-pure water (<2 ppb) was supplied by a MilliQ Gradient water purification system (Millipore, Milford, MA, USA). Quantitative determination of the glucosinolates was performed on an UHPLC-high-resolution mass spectrometer (MS), which was composed of a Waters Acquity UPLC system (Waters, Milford, USA) connected to a Bruker quadrupole time-of-flight mass spectrometer (maXis; Bruker Daltonics, Bremen, Germany; Glauser et al., 2012). Glucosinolates were separated at 25°C on a Waters Acquity UPLC CSH column (2.1 × 100 mm, 1.7 μm), which had a flow rate of 0.4 mL/min, and a mobile phase composed of water (solution A) and ACN (solution B), both of which contained 0.1% HCOOH. The gradient program conditions were (the values indicate theroportion of percentage of solvent B used): 2% at 0.0 min, 45% at 6 min, and 100% at 6.5 min. The gradient was followed by a washing step with 100% solvent B for 2 min and a re-equilibration step with the initial composition for 2 min. The UHPLC was connected to the MS equipped with an electrospray ion source operated in negative ionization mode. Nitrogen was used as nebulizer (4.0 bar) and as dry gas (2.5 l/min, 205°C). Detection was performed in the full scan mode in the mass range of 50 to 1400 m/z, and at a scan rate of 1.5 Hz. Flex Analysis software (Bruker) was used for the control of the instrument and Quant Analysis was used for quantitative data processing. Glucosinolates were quantified using two calibration curves with fives level (k = 5) prepared in MeOH/water (70/30 ratio) at the following concentrations: 2, 10, 50, 200, 500, and 1000 ng/ml for gluconapin (quadratic curve fit, R = 0.9992), and 0.02, 0.1, 0.5, 2, and 5 μg/ml for glucobrassicin (linear curve fit, R = 0.9996). Calibration curves and quantifications were based on the peak area ratio between each analyte and the internal standard (sinalbin at 5 μg/ml). The concentration range was selected to include the expected natural glucosinolate values and the calibration curve (gluconapin or glucobrassicin) selected accordingly.
Statistics
Before statistical analysis, all volatile and glucosinolates variables were ln(1+x) transformed to obtain homogeneity of variance, and approach normal distributions. A dependent samples t-test was calculated to compare amounts of glucosinolates in leaves and flowers. Pearson product moment correlations were calculated between amount of floral VOCs, leaf VOCs, and the respective glucosinolates. All variables were examined for outliers using boxplot diagrams, and in case outliers were found, the correlation analyses were repeated without outliers. For VOCs and major glucosinolates (gluconapin, glucobrassicanapin, sum of all glucosinolates), correlations were also calculated for the three treatment groups separately (control, Pieris, Spodoptera). For those compounds where different significant correlations were found between the treatment groups, a univariate general linear model with the VOC as dependent variable, treatment as fixed factor and glucosinolate as covariate was calculated. The model included the interaction between treatment and glucosinolate, to assess whether the association between VOC and glucosinolate was significantly different among treatments. To reduce number of variables, a principle component analysis (PCA) with varimax rotation was done with glucosinolate and scent variables separately. Principle components (factors) with an eigenvalue above one were extracted and saved as variables. For floral traits, PCAs were calculated for all treatments together, and for the control treatment only (plants without herbivory). For flower glucosinolates with all treatments, 4 factors were extracted which explained 79.8% of the total variance. For floral volatiles, 6 factors were extracted explaining a total of 74.5% of the total variance. For leaf traits, PCA with glucosinolates of all treatment groups resulted in 3 factors explaining 66.4% of the total variance. For leaf volatiles, 6 factors explaining 77.3% of the total variance were extracted. For PCAs with only control plants, 3 glucosinolate factors explaining 74.4% of the total variance were extracted, and 5 volatile factors explaining 81.0% of the total variance. Subsequently, multivariate regressions were calculated using each of the glucosinolate factors as dependent, and all factors of the scent variables as explanatory variables. All statistical analyses were carried out in IMB SPSS Statistics 22 (http://www-01.ibm.com/software/analytics/spss/products/statistics/).
Results
Glucosinolates
Nine glucosinolates were detected in leaves and flowers, one was found only in flowers (for names see Table 1). Absolute amounts of individual compounds are reported in (Schiestl et al., 2014). Flowers produced a sum of 12.11 μg/mg fresh weight glucosinolates, whereas leaves produced 9.1 μg/mg fresh weight [t(69) = −7.47, P < 0.001). The glucosinolate content was strongly dominated by two aliphatic glucosinolates, gluconapin and glucobrassicanapin. These two compounds made up 91.6 and 5.9% of the total glucosinolate content in flowers, and 91.8 and 7.4% of the total glucosinolate content in leaves. Each of the other glucosinolates constituted less than 1% of the total amount in both flowers and leaves. Strong positive correlations were found between major identical leaf and flower glucosinolates (Table 1; Figure 1A). Also there were correlations between different glucosinolates in leaf and flower tissue; correlation were evident both within different aliphalic glucosinolates but also between aliphatic and indolic glucosinolates (Table 1).
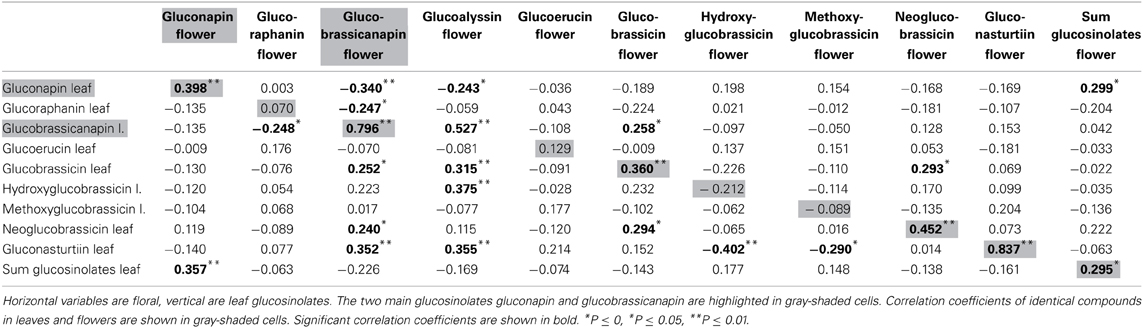
Table 1. Correlation coefficients between leaf and flower glucosinolates (n = 70).
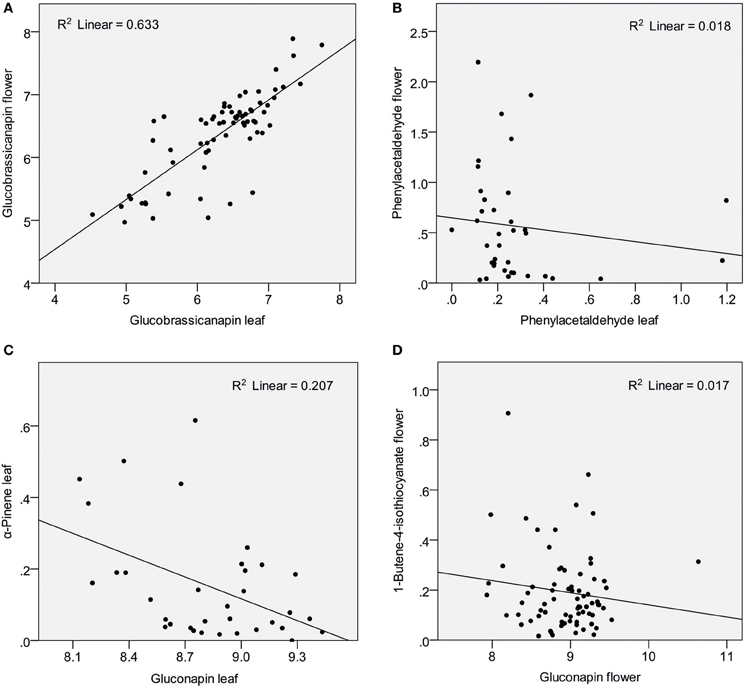
Figure 1. Scatter plots showing amounts of glucosinolates and VOCs (ln transformed values) in Brassica rapa. The figure shows examples of strong correlation between leaf and flower glucosinolates (A), lack of correlation between identical leaf and flower VOCs (B), negative correlation between glucosinolates and VOCs in leaves (C) and an example for no correlation between glucosinolates and VOCs in flowers (D).
VOCs
Nineteen VOCs were found to be emitted from leaves and flowers, two were found only in flowers, one only in leaves (Table 2). Identical leaf and flower scent compounds were not correlated (Table 2; Figure 1B). This lack of correlations was also evident when the three treatment groups were analyzed separately. For all treatments together, correlations were found, however, between different VOCs emitted from leaves and flowers. Leaf benzaldehyde, for example, showed negative correlations with floral phenylacetaldehyde, phenylethyl alcohol, and positive correlations with floral nonanal and decanal (Table 2).
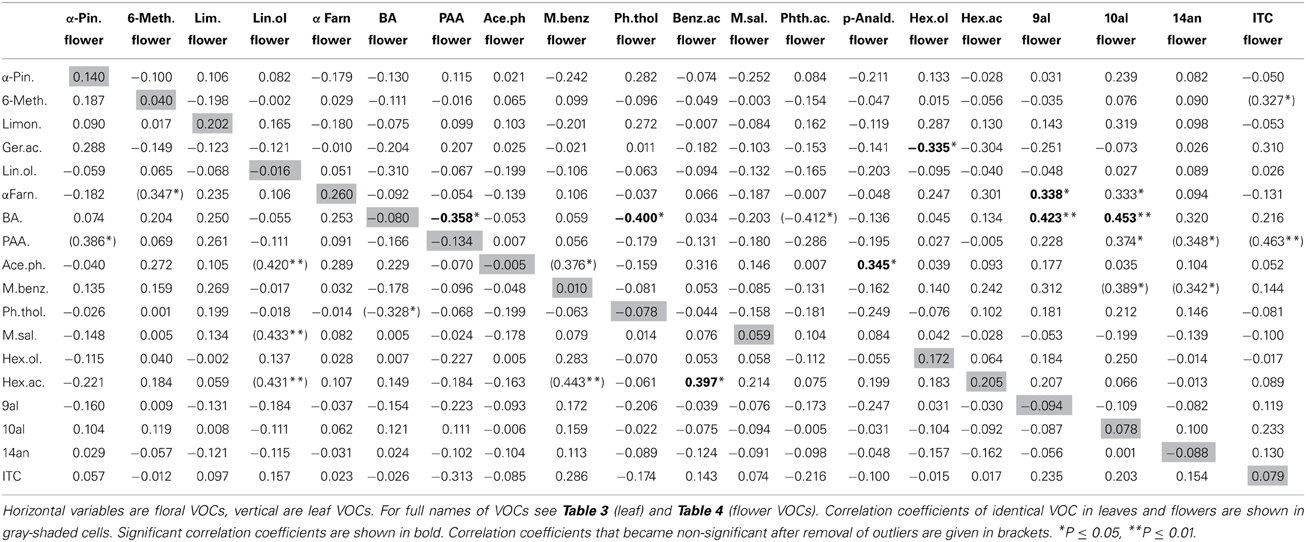
Table 2. Correlation coefficients between leaf and flower VOCs (n = 34).
Leaf VOCs and Glucosinolates
α-Pinene and 3-carene were negatively correlated with the major leaf glucosinolate gluconapin (Table 3; Figure 1C). α-Pinene was also negatively correlated with the sum of all glucosinolates. Acetophenone showed a positive correlation with one of the minor glucosinolates, hydroxybrassicin, and tetradecane was positively correlated with methoxyglucobrassicin. Interestingly, 1-butene-4-isothiocyanate was not correlated with any of the leaf glucosinolates. When the three treatment groups were analyzed separately, benzaldehyde was positively correlated with the sum of glucosinolates in the control group [r(10) = 0.608, P = 0.047], but negatively correlated with glucosinolates in the Spodoptera group [r(9) = −0.849, P = 0.002]. Methyl salicylate was positively correlated with gluconapin in the Spodoptera group [r(9) = 0.673, P = 0.033]. To test whether the associations between VOCs and glucosinolates were statistically different between treatments, I calculated a univariate general linear model with interactions between treatment and sum of glucosinolates or gluconapin. For both compounds this analysis showed no significant interactions [benzaldehyde: F(3) = 0.848, P = 0.478; methyl salicylate: F(3) = 0.199, P = 0.896], indicating that the slope of the regression did not differ significantly between treatments. In the multivariate regression analyses with PC factors including all treatments, only volatile factor 4 (highest factor loadings: α-pinene and limonene) had a significant negative association (β = −0.431, P = 0.012) with glucosinolate factor 2 (loadings: gluconapin, glucoraphanin, glucoerucin). Multivariate regression with PC factors of only control plants showed no significant associations.
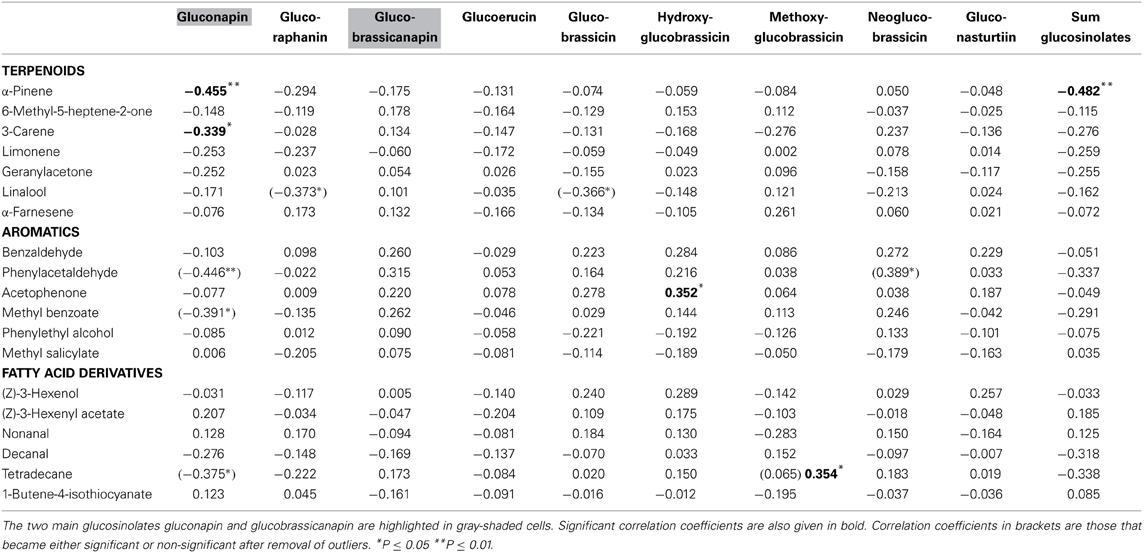
Table 3. Correlation coefficients between leaf VOCs and leaf glucosinolates (n = 34).
Flower VOCs and Glucosinolates
None of the floral VOCs were correlated with the two main floral glucosinolates (gluconapin, glucobrassicanapin) or the sum of all glucosinolates (Table 4; Figure 1D). The same was true when the three treatment groups were analyzed separately. For all treatment groups together, several VOCs were correlated, however, with minor glucosinolates. Among the aromatics, methyl salicylate was negatively correlated with hydroxy- and methoxyglucobrassicin, p-anisaldehyde was negatively correlated with hydroxyglucobrassicin, and phenylethyl alcohol was positively correlated with glucoraphanin. Among the terpenoids, α-pinene and α-farnesene were positively correlated with gluconasturtiin; among the fatty acid derivatives (FADs), nonanal and decanal were positively correlated with gluconasturtiin, and nonanal was positively correlated with glucoallyssin. (Z)-3-Hexenol was negatively correlated with hydroxyglucobrassicin, and (Z)-3-hexenyl acetate was positively correlated with glucobrassicin and neoglucobrassicin. Again, floral 1-butene-4-isothiocyanate was not correlated with any of the flower glucosinolates.
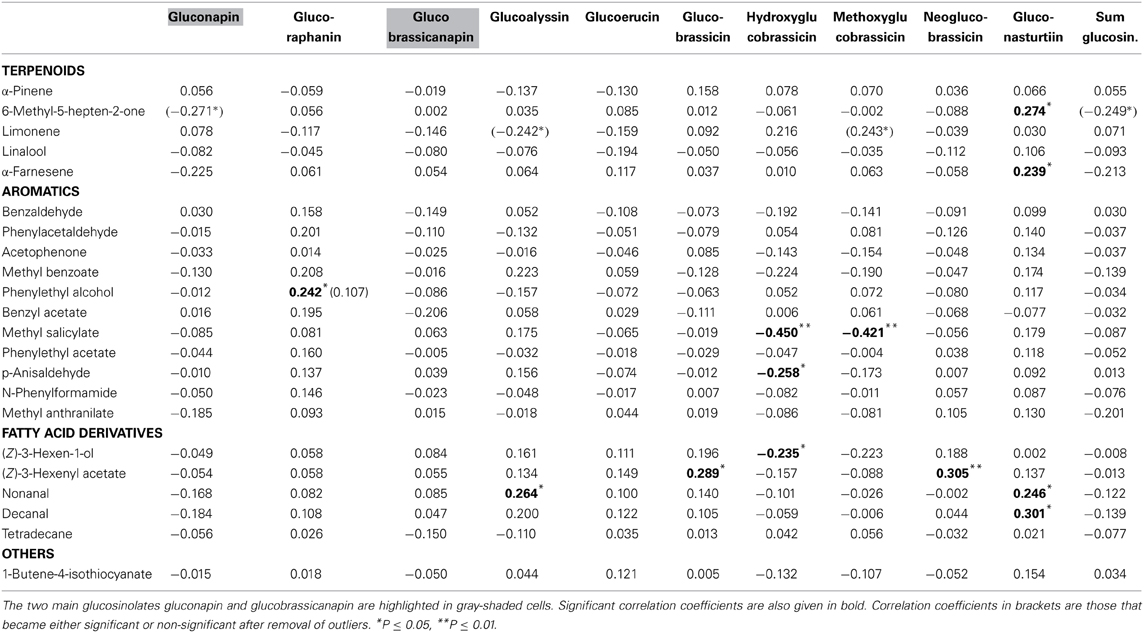
Table 4. Correlation coefficients between floral VOCs and floral glucosinolates (n = 72).
In the multivariate regression analyses with PC factors of all treatment groups, volatile factor 3 (highest factor loadings: benzaldehyde, benzyl acetate, methyl salicylate, methyl benzoate) had a significant negative association (β = −0.283, P = 0.020) with glucosinolate factor 1 (highest factor loadings: hydroxyglucobrassicin and methoxyglucobrassicin). For the same analysis with only control groups included, volatile factor 3 (loadings: 6-methyl-5-heptene-2-one, nonanal, decanal) had a positive association (β = 0.447, P = 0.012) and factor 4 (loadings: benzaldehyde, methyl salicylate, methyl benzoate) had a negative association (β = −0.503, P = 0.005) with glucosinolate factor 3 (loadings: hydroxyglucobrassicin and methoxyglucobrassicin).
Discussion
Aposematic signaling is well known in animals, both through warning coloration (Bradbury and Vehrencamp, 2011) and chemical signals (Eisner and Grant, 1981; Weldon, 2013). My study shows no evidence for consistent chemical aposematic signaling in Brassica rapa, as none of the leaf or floral VOCs were positively correlated with major defense compounds. The alternative to aposematic signaling, “chemical crypsis,” may be a strategy to avoid detection by specialist herbivores.
Associations between plant metabolites can be caused by various different biochemical and/or evolutionary processes. Positive correlations can be based on shared biosynthetic pathways or common regulation, or caused by selection for co-occurrence (abundance). Negative correlations, on the other hand, indicate chemical trade-offs, e.g., through competition for substrate availability during biosynthesis, or ecological trade-offs (Agrawal, 2011). In my study, the amounts of many identical glucosinolates were positively correlated between flower and leaf tissue. Shared regulatory mechanisms in the biosynthesis of these compounds in leaves and flowers seem thus likely and may underlie these correlations. As an evolutionary explanation, glucosinolates probably have similar defense functions in both plant organs, and may thus face similar patterns of selection. Flowers, however, contained higher amounts of glucosinolates, which is explained by optimal defense, because flowers contain the reproductive organs and are thus more valuable for plant fitness (McKey, 1974; Strauss et al., 2004). In contrary to glucosinolates, identical leaf and flower volatiles were not correlated, indicating independent regulation of emission. This makes sense because flower and leaf VOCs have primarily different functions, despite their similar chemistry. Floral VOCs serve as key pollinator-attracting signal, and thus primarily mediate reproduction. Recently, however, potential defense functions of floral VOCs have also been highlighted (Kessler et al., 2012). Leaf VOCs, on the other hand, primarily serve defense functions such as the attraction of parasitoids after herbivore attack (Turlings et al., 1995). Occasionally, leaf VOCs may also be involved in pollinator attraction, though (Dufay et al., 2003).
Volatiles that indicate host plant or floral reward quality can be used by insects to optimize host plant use (Zakir et al., 2013). In contrast to visual signals (Cooney et al., 2012), volatiles that quantitatively indicate defense status have not yet been found in plants. Pearse et al. (2013), for example, found no correlation between leaf VOC abundance or diversity and defense in oaks. In line with these results, my data show no positive correlations between any of the analyzed volatiles and major glucosinolates. Some of the analyzed VOCs, however, showed positive correlations with some of the minor glucosinolates, but these correlations would only contain meaningful information about defense if a herbivore would be especially susceptible to these particular compounds, as each of them constitutes less than one percent of the total glucosinolate content. On the other hand, several VOCs showed negative correlations with glucosinolates. Most notably, α-pinene and 3-carene emitted from leaves were negatively correlated with gluconapin, the major glucosinolate in B. rapa. α-Pinene was also negatively correlated with the total amount of glucosinolates. This negative association was confirmed for α-Pinene and limonene in multivariate regression with principle components. These terpenoids thus can act as a cue for low defense, which could be exploited by herivores. Such negative associations are, however, unlikely the product of adaptive evolution of defense signaling, as lower amounts of a volatile will be more difficult to detect by a receiver. The likely reason for a negative association between volatiles and defense compounds are allocation trade-offs in the biosynthesis of the compounds (Agrawal, 2011).
Interestingly, my data did not show a correlation between 1-butene-4-isothiocyanate and its precursor glucosinolate, gluconapin. Isothiocyanate (ITC) production in B. rapa may thus be regulated via myrosinase activity, rather than substrate availability (Textor and Gershenzon, 2009). It is known that ITCs are used as volatile oviposition cues by herbivores specialized on Brassicaceae plants (Renwick et al., 2006; Agerbirk et al., 2009). Therefore, a correlation of ITCs and gluconapin would lead to a trade-off between defense against generalists and attraction of specialists, which may be selectively disadvantageous if specialists invoke more damage to the plant than generalists. In summary, lack of aposematic chemical signaling, “chemical crypsis,” could be adaptive if such signals can be used by specialist herbivores, that are not negatively affected by defense compounds (Wittstock et al., 2004; Winde and Wittstock, 2011) to locate or identify their host plants. Visual signals are perhaps better suited for aposematic signaling as they are less specific and thus not easily exploited by specialist herbivores.
Conflict of Interest Statement
The author declares that the research was conducted in the absence of any commercial or financial relationships that could be construed as a potential conflict of interest.
Acknowledgments
I would like to thank Qiyan Wang-Müller and Laurent Bigler for their help with glucosinolate analysis. Markus Meierhofer and Rayko Jonas took good care of the here used plants. This research was funded by the Swiss National Science Funds (SNF/ESF grant no. 31VL30_134416 to Florian P. Schiestl, embedded in the Eurocores Invavol program). The research leading to these results has received funding from the European Union's Seventh Framework Programme ([FP7/2007-2013] [FP7/2007-2011]) under grant agreement no 281093.
References
Agerbirk, N., De Vos, M., Kim, J. H., and Jander, G. (2009). Indole glucosinolate breakdown and its biological effects. Phytochem. Rev. 8, 101–120. doi: 10.1007/s11101-008-9098-0
Agrawal, A. A. (2011). New synthesis-trade-offs in chemical ecology. J. Chem. Ecol. 37, 230–231. doi: 10.1007/s10886-011-9930-7
Bradbury, J. W., and Vehrencamp, S. L. (2011). Principles of Animal Communication. Sunderland: Sinauer Associates.
Cooney, L. J., Van Klink, J. W., Hughes, N. M., Perry, N. B., Schaefer, H. M., Menzies, I. J., et al. (2012). Red leaf margins indicate increased polygodial content and function as visual signals to reduce herbivory in Pseudowintera colorata. New Phytol. 194, 488–497. doi: 10.1111/j.1469-8137.2012.04063.x
Dudareva, N., Klempien, A., Muhlemann, J. K., and Kaplan, I. (2013). Biosynthesis, function and metabolic engineering of plant volatile organic compounds. New Phytol. 198, 16–32. doi: 10.1111/nph.12145
Dufay, M., Hossaert-Mckey, M., and Anstett, M. C. (2003). When leaves act like flowers: how dwarf palms attract their pollinators. Ecol. Lett. 6, 28–34. doi: 10.1046/j.1461-0248.2003.00382.x
Eisner, T., and Grant, R. P. (1981). Toxicity, odor aversion, and olfactory aposematism. Science 213, 476–476. doi: 10.1126/science.7244647
Glauser, G., Schweizer, F., Turlings, T. C. J., and Reymond, P. (2012). Rapid profiling of intact glucosinolates in Arabidopsis leaves by UHPLC-QTOFMS using a charged surface hybrid column. Phytochem. Anal. 23, 520–528. doi: 10.1002/pca.2350
Gomez, J. M., and Perfectti, F. (2010). Evolution of complex traits: the case of Erysimum corolla shape. Int. J. Plant Sci. 171, 987–998. doi: 10.1086/656475
Hopkins, R. J., Van Dam, N. M., and Van Loon, J. J. A. (2009). Role of glucosinolates in insect-plant relationships and multitrophic interactions. Annu. Rev. Entomol. 54, 57–83.
Kessler, D., Diezel, C., Clark, D. G., Colquhoun, T. A., and Baldwin, I. T. (2012). Petunia flowers solve the defence/apparency dilemma of pollinator attraction by deploying complex floral blends. Ecol. Lett. 16, 299–306. doi: 10.1111/ele.12038
Lev-Yadun, S. (2009a). “Aposematic (warning) coloration in plants,” in Plant-Environment Interactions: From Sensory Plant Biology to Active Plant Behavior, ed F. Baluska (Berlin: Springer-Verlag Berlin), 167–202.
Lev-Yadun, S. (2009b). Mullerian and Batesian mimicry rings of white-variegated aposematic spiny and thorny plants: a hypothesis. Isr. J. Plant Sci. 57, 107–116. doi: 10.1560/IJPS.57.1-2.107
Massei, G., Cotterill, J. V., Coats, J. C., Bryning, G., and Cowan, D. P. (2007). Can Batesian mimicry help plants to deter herbivores? Pest Manag. Sci. 63, 559–563. doi: 10.1002/ps.1360
McKey, D. (1974). Adaptive patterns in alkaloid physiology. Am. Nat. 108, 305–320. doi: 10.1086/282909
Pearse, I. S., Gee, W. S., and Beck, J. J. (2013). Headspace volatiles from 52 oak species advertise induction, species identity, and evolution, but not defense. J. Chem. Ecol. 39, 90–100. doi: 10.1007/s10886-012-0224-5
Renwick, J. A., Haribal, M., Gouinguene, S., and Stadler, E. (2006). Isothiocyanates stimulating oviposition by the diamondback moth, Plutella xylostella. J. Chem. Ecol. 32, 755–766. doi: 10.1007/s10886-006-9036-9
Schiestl, F. P. (2010). The evolution of floral scent and insect chemical communication. Ecol. Lett. 13, 643–656. doi: 10.1111/j.1461-0248.2010.01451.x
Schiestl, F. P., and Johnson, S. D. (2013). Pollinator-mediated evolution of floral signals. Trends Ecol. Evol. 28, 307–315. doi: 10.1016/j.tree.2013.01.019
Schiestl, F. P., Kirk, H., Bigler, L., Cozzolino, S., and Desurmont, G. A. (2014). Herbivory and floral signaling: phenotypic plasticity and trade-offs between reproduction and indirect defense. New Phytol. doi: 10.1111/nph.12783. [Epub ahead of print].
Sonderby, I. E., Geu-Flores, F., and Halkier, B. A. (2010). Biosynthesis of glucosinolates - gene discovery and beyond. Trends Plant Sci. 15, 283–290. doi: 10.1016/j.tplants.2010.02.005
Strauss, S. Y., Irwin, R. E., and Lambrix, V. M. (2004). Optimal defence theory and flower petal colour predict variation in the secondary chemistry of wild radish. J. Ecol. 92, 132–141. doi: 10.1111/j.1365-2745.2004.00843.x
Textor, S., and Gershenzon, J. (2009). Herbivore induction of the glucosinolate-myrosinase defense system: major trends, biochemical bases and ecological significance. Phytochem. Rev. 8, 149–170. doi: 10.1007/s11101-008-9117-1
Turlings, T. C. J., Loughrin, J. H., McCall, P. J., Rose, U. S. R., Lewis, W. J., and Tumlinson, J. H. (1995). How caterpillar-damaged plants protect themselves by attracting parasitic wasps. Proc. Natl. Acad. Sci. U.S.A. 92, 4169–4174. doi: 10.1073/pnas.92.10.4169
Unsicker, S. B., Kunert, G., and Gershenzon, J. (2009). Protective perfumes: the role of vegetative volatiles in plant defense against herbivores. Curr. Opin. Plant Biol. 12, 479–485. doi: 10.1016/j.pbi.2009.04.001
Weldon, P. J. (2013). Chemical aposematism. Chemoecology 23, 201–202. doi: 10.1007/s00049-013-0140-3
Winde, I., and Wittstock, U. (2011). Insect herbivore counteradaptations to the plant glucosinolate-myrosinase system. Phytochemistry 72, 1566–1575. doi: 10.1016/j.phytochem.2011.01.016
Wittstock, U., Agerbirk, N., Stauber, E. J., Olsen, C. E., Hippler, M., Mitchell-Olds, T., et al. (2004). Successful herbivore attack due to metabolic diversion of a plant chemical defense. Proc. Natl. Acad. Sci. U.S.A. 101, 4859–4864. doi: 10.1073/pnas.0308007101
Wright, G. A., and Schiestl, F. P. (2009). The evolution of floral scent: the influence of olfactory learning by insect pollinators on the honest signalling of floral rewards. Funct. Ecol. 23, 841–851. doi: 10.1111/j.1365-2435.2009.01627.x
Keywords: pollination, herbivory, plant defense, honest signals, flower scent, glucosinolates
Citation: Schiestl FP (2014) Correlation analyses between volatiles and glucosinolates show no evidence for chemical defense signaling in Brassica rapa. Front. Ecol. Evol. 2:10. doi: 10.3389/fevo.2014.00010
Received: 15 January 2014; Accepted: 25 March 2014;
Published online: 11 April 2014.
Edited by:
Jeffrey A. Riffell, University of Washington, USAReviewed by:
Jeremy J. Heath, North Carolina State University, USAShuqing Xu, Max Planck Institute for Chemical Ecology, Germany
Gaylord Alexandre Desurmont, University of Neuchâtel, Switzerland
Copyright © 2014 Schiestl. This is an open-access article distributed under the terms of the Creative Commons Attribution License (CC BY). The use, distribution or reproduction in other forums is permitted, provided the original author(s) or licensor are credited and that the original publication in this journal is cited, in accordance with accepted academic practice. No use, distribution or reproduction is permitted which does not comply with these terms.
*Correspondence: Florian P. Schiestl, Institute of Systematic Botany, University of Zürich, Zollikerstrasse 107, 8008 Zürich, Switzerland e-mail: florian.schiestl@systbot.uzh.ch