Nuclear and Mitochondrial Gene Data Support Recent Radiation within the Sea Spider Species Complex Pallenopsis patagonica
 Jana S. Dömel
 Roland R. Melzer
 Avril M. Harder
 Andrew R. Mahon
 Florian Leese
- 1Faculty of Biology, Aquatic Ecosystem Research, University of Duisburg-Essen, Essen, Germany
- 2Zoologische Staatssammlung München, Munich, Germany
- 3Faculty of Biology, Biocenter, Ludwig-Maximilians-University Munich, Munich, Germany
- 4GeoBioCenter, Ludwig-Maximilians-University Munich, Munich, Germany
- 5Department of Biology, Institute for Great Lakes Research, Central Michigan University, Mount Pleasant, MI, USA
- 6Center for Water and Environmental Research, University of Duisburg-Essen, Essen, Germany
The climate history of the Antarctic continental shelf has formed a diverse benthic ecosystem over evolutionary time scales. The extent of faunal diversity has only recently been unveiled especially by using genetic data. In addition to newly reported species, known species of benthic invertebrates in the Southern Ocean turned out to be in fact species complexes representing genetically very distinct clades. Previous studies have shown that the sea spider Pallenopsis patagonica is such a species complex consisting of several divergent mitochondrial clades. However, genetic analyses of another sea spider complex, Colossendeis megalonyx, showed that looking at one mitochondrial gene only can lead to overestimation of species number within a species complex and revealed mito-nuclear discordances. In this study we expand the current data set of P. patagonica by adding not only samples from Patagonia, the Subantarctic and the Eastern Weddell Sea, but also sequence data for the nuclear internal transcribed spacer (ITS) region to obtain more information about the species complex. In fact, the number of distinct clades is reduced when looking at nuclear data, but there are no cases of mito-nuclear discordance and hence no evidence for hybridization and speciation reversal events between divergent mitochondrial clades as in C. megalonyx. As patterns of mitochondrial COI diversity and divergence within P. patagonica and C. megalonyx are very similar and molecular dating analyses of both species complexes suggest a recent separation of clades during the Pleistocene, different biological processes seem to have led to fast and stable species boundaries in P. patagonica as opposed to C. megalonyx where hybridization even across major mitochondrial lineages occured.
Introduction
Increased sampling of Southern Ocean habitats and the application of molecular taxonomy uncovered that Antarctic biodiversity has been drastically underestimated (Gutt et al., 2004; De Broyer and Danis, 2011; De Broyer et al., 2014). The main reason for the significant boost in number of newly found species is the detection of morphologically cryptic species in basically all studied taxonomic groups (see Janosik and Halanych, 2010; Kaiser et al., 2013 for reviews). Therefore, paradoxically the Southern Ocean has emerged from being regarded as a biodiversity sink to a center of marine biodiversity in the past two decades. This phenomenon of high in situ species diversity has been termed the Antarctic diversity pump (sensu Clarke and Crame, 1989).
Several processes have been discussed as drivers fueling this diversity pump (Clarke and Crame, 1989). In this context, molecular data have led to a paradigm shift: Most of the cryptic species have rendered the distribution ranges of formerly described species from broad (i.e., circum-Antarctic) to small and allopatric (Lörz et al., 2009; Held, 2014). As the timing of many of these divergence events was rather recent in the Plio- or Pleistocene (see Convey et al., 2009 for a review), an influence of the recurrent large-scale glaciations in these periods has been suggested as a main driver fueling the diversity pump, mainly through random genetic drift and lineage sorting in independent glacial refugia (Thatje et al., 2005, 2008; Allcock and Strugnell, 2012). Prominent signatures of population bottlenecks, in particular for shallow-water organisms, have supported that view (e.g., Janko et al., 2007; Raupach et al., 2010).
In this context, Pycnogonida or sea spiders have attracted particular attention, since they show an exceptionally high species diversity in the Southern Ocean (Clarke and Johnston, 2003; Munilla and Soler Membrives, 2009; Griffiths et al., 2011). Moreover, many pycnogonids are benthic brooders with probably limited dispersal capacity. Therefore, lineage sorting events in glacial refugia driving speciation should have been stronger than in other, free-spawning taxa (Allcock and Strugnell, 2012).
In agreement with these predictions, several molecular studies have reported evidence for overlooked diversity in various sea spider species (Mahon et al., 2008; Krabbe et al., 2010; Dietz et al., 2015a,b). Furthermore, intraspecific diversity was found to be significantly partitioned regionally, indicating limited gene flow (Arango et al., 2011; Dietz et al., 2015b; Dömel et al., 2015). Two species complexes stand out by far in terms of their identified numbers of mitochondrial clades revealed by classical DNA barcoding (amplification of cytochrome c oxidase subunit I gene, COI): Colossendeis megalonyx (Hoek, 1881) (Krabbe et al., 2010; Dietz et al., 2015b) and Pallenopsis patagonica (Hoek, 1881) (Weis et al., 2014; Harder et al., 2016). For C. megalonyx, Krabbe et al. (2010) reported the presence of six distinct mitochondrial lineages that likely represent cryptic species with mostly small and allopatric distribution ranges. However, extending the sampling range substantially Dietz et al. (2015b) revealed a much greater number of mitochondrial clades. These also showed mostly circum-Antarctic distribution instead of regional partitioning. Similar findings were made for the crinoid Promachocrinus kerguelensis [Wilson et al. (2007): restricted distribution range; Hemery et al. (2012): circumpolar distribution range with extended data set]. Interestingly, analyses of a nuclear gene of C. megalonyx indicated that several of the mitochondrial clades do not represent distinct species as they had identical sequences for the otherwise highly variable nuclear internal transcribed spacer region (ITS; Dietz et al., 2015b). This suggests hybridization events between several mitochondrial clades and subsequently speciation reversal after the completion of mitochondrial lineage sorting within C. megalonyx.
For P. patagonica, Weis et al. (2014) showed that it is also a species complex as has been anticipated by Gordon (1944) and Pushkin (1975, 1993), and described a new species (P. yepayekae Weis, 2014 in Weis et al., 2014) using integrative taxonomy combining mitochondrial sequences with morphological characters. Harder et al. (2016) found evidence for even more diversity within the complex by adding further mitochondrial data specifically for Antarctic specimens. As Dietz et al. (2015b) have shown, only looking at mitochondrial data can lead to an overestimation of species number. Therefore nuclear data are needed for P. patagonica to explicitly test whether the identified mitochondrial clades reported by Weis et al. (2014) and Harder et al. (2016) are supported by such independent markers. Thus, in this study we analyzed both mitochondrial and nuclear data of the P. patagonica complex for a substantially extended data set as compared to Weis et al. (2014) and Harder et al. (2016). We hypothesized that (i) extending the data set for P. patagonica by new samples, specifically from previously unsampled locations, reveals further distinct mitochondrial clades, (ii) the number of distinct species is substantially smaller than the number of mitochondrial lineages when analyzing an independent nuclear gene marker, and (iii) the extended data set reveals broader distribution ranges for previously reported clades. Moreover, we addressed the significance of our results in the context of currently discussed evolutionary mechanisms generating Southern Ocean benthic diversity.
Materials and Methods
Specimens and Sampling Sites
For the remainder of this study, we use the term P. patagonica sensu lato (s.l.) when referring to the whole species complex including P. yepayekae, because it groups within clades morphologically originally identified as P. patagonica. Individuals of P. patagonica s.l. from the shelf of South America, Subantarctic islands as well as around the Antarctic continent were analyzed (Table 1, Figure 1). Chilean specimens were collected by divers during Huinay Fjordos expeditions (HF16, HF21, HF24, and HF26). Falkland samples (ZDLT1) were provided by Vladimir Laptikhovsky (Falkland Islands Fisheries Department, Stanley, Falkland Islands). Samples from the Southern Ocean were collected using different bottom trawls during several cruises on board the RRS James Clark Ross (British Antarctic Survey, Cambridge, UK) and the RV Polarstern (Alfred Wegener Institute Helmholtz Center for Polar and Marine Research, Bremerhaven, Germany). After collection, specimens were stored in ethanol (96%). Specimens were morphologically inspected and assigned to P. patagonica s.l. before being molecularly studied.
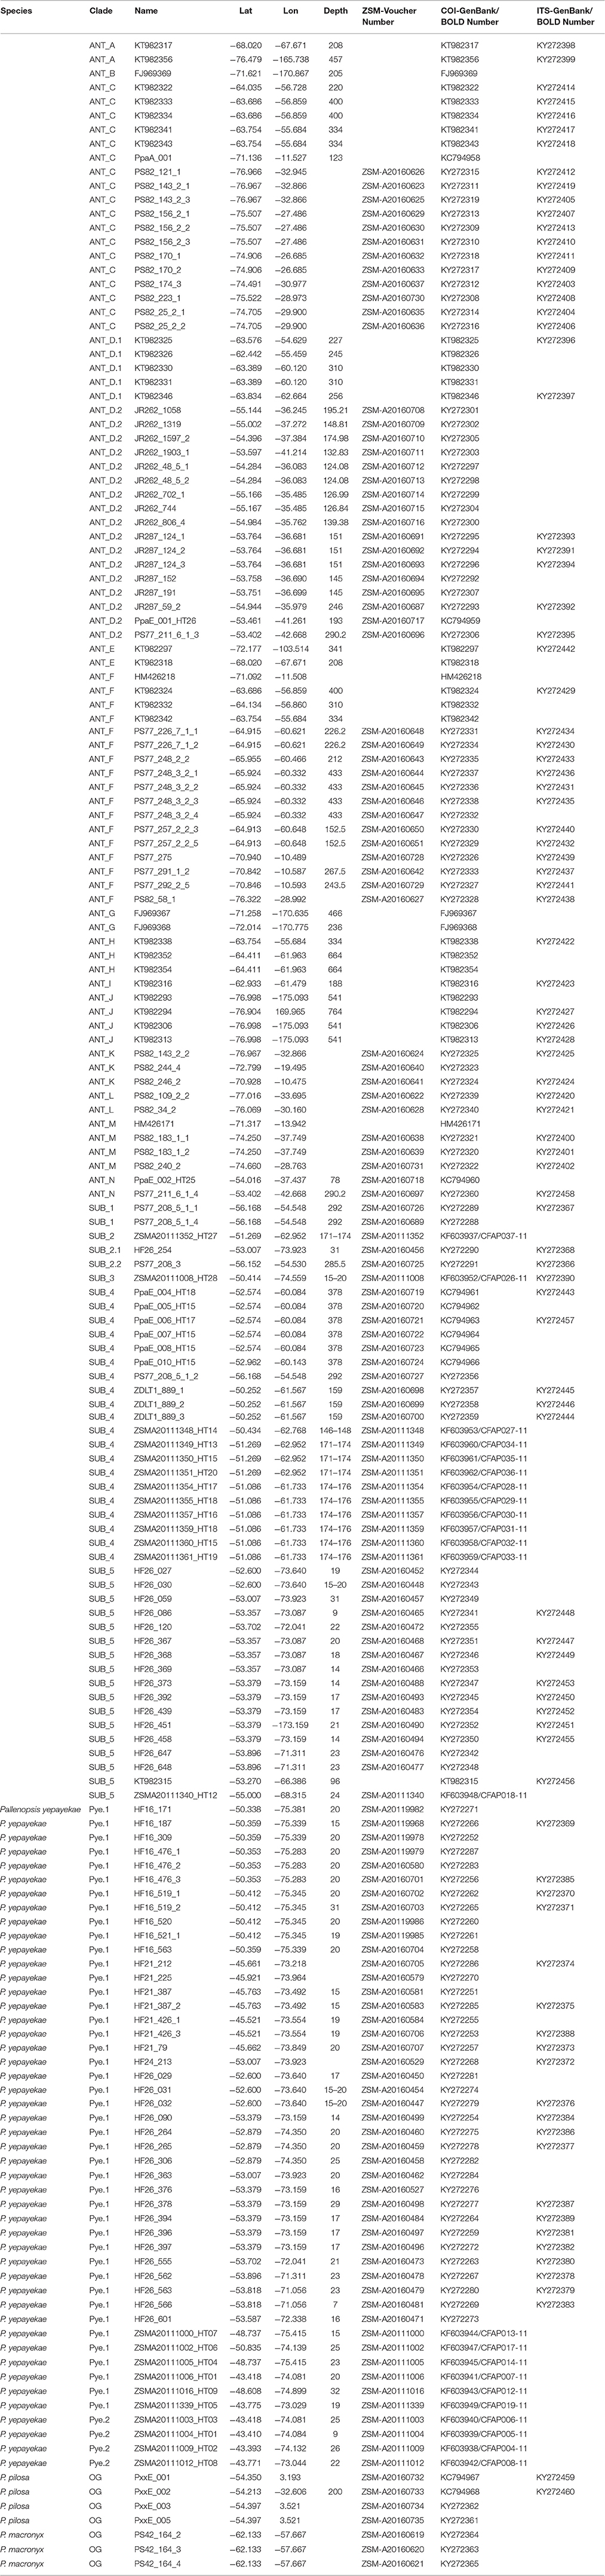
Table 1. Specimens list for P. patagonica s.l. and outgroups used during study. Species names are only given for outgroups and P. yepayekae as other morphological determinations are as yet not possible. Sampling details (location, latitude, longitude, depth) and haplotype information for the specimens analyzed (molecular clade, sequence availability).
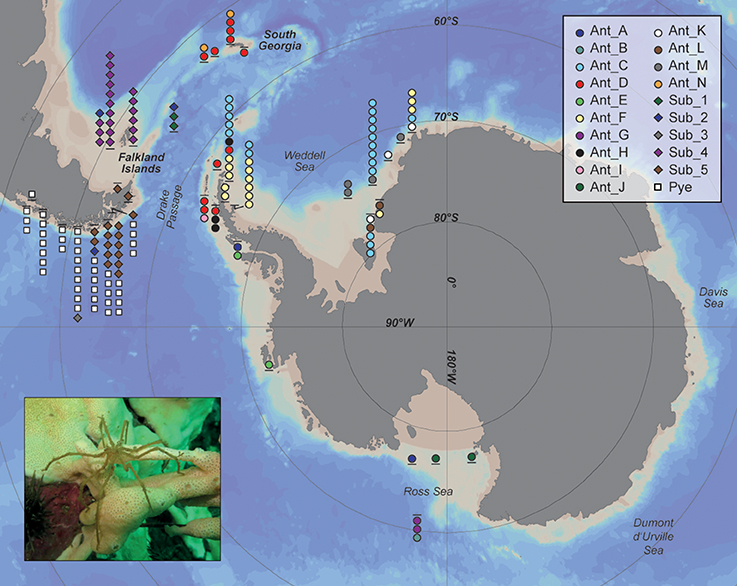
Figure 1. Sampling sites (dashes) and distribution of Antarctic, Subantarctic, and Patagonian Pallenopsis patagonica s.l. specimens and their assignment to molecular clades. Different clades are represented by different symbols/colors. Each symbol below or above the dash represents one specimen. Picture in lower left corner shows P. patagonica in its natural habitat (photo taken by Roland R. Melzer).
Molecular Analyses
Muscle tissue was extracted from the tibia using sterile scalpel and forceps. DNA was isolated from the tissue using a modified salt precipitation protocol after Sunnucks and Hales (1996; see Weiss and Leese, 2016). Extracted DNA was eluted in 100 μl TE minimum buffer (1 mM Tris BASE, 0.1 mM EDTA, pH 8.0). The amplification of the mitochondrial cytochrome c oxidase subunit I gene (COI) and a ribosomal gene region covering the 18S–ITS1–5.8S–ITS2–28S stretch (ITS) was carried out in 25 μl reactions containing 1x (2.5 μl) PCR buffer (5Prime), 0.2 mM dNTPs, 0.5 μM of each primer, 0.025 U/μl (0.125 μl) Hotmaster Taq (5Prime) and 1 μl template DNA, topped up to 25 μl with sterile water. A 658 bp long fragment of the COI was amplified using the common barcoding primer pair HCO2198 and LCO1490 (Folmer et al., (1994). The optimal temperature profile for the PCRs with these primers was an initial denaturation at 94°C for 2 min, followed by 36 cycles of denaturation at 94°C for 20 s, annealing at 46°C for 30 s, extension at 65°C for 60 s, and a final extension at 65°C for 7 min.
For ITS, an approximately 1000 bp long fragment was amplified using primers ITSRA2 and ITS2.2 (Arango and Brenneis, 2013). PCR cycling program was initial denaturation at 94°C for 3 min, followed by 35 cycles of denaturation at 94°C for 30 s, annealing at 55°C for 75 s, extension at 65°C for 1 min, with a final extension at 65°C for 5 min.
For sequencing, 10 U (0.5 μl) Exonuclease I (Thermo Scientific), 1.5 U (1 μl) FastAP Thermosensitive Alkaline Phosphatase (Thermo Scientific) and 9 μl PCR product per reaction were used. The purification mix was incubated for 25 min at 37°C, followed by a denaturation step at 85°C for 15 min. For sequencing at GATC Biotech AG (Cologne, Germany) 5 μl of purified PCR product was mixed with 5 μl of 5 pmol/μl primer. Forward and reverse primers were used to sequence both directions of the DNA strands.
For ITS sequences of samples reported by Harder et al. (2016; herein labeled with GenBank numbers starting with KT98) DNA extraction was performed as stated in Harder et al. (2016). For ITS amplification the same primer pair as mentioned above was used. PCR mixture consisted of 1x PCR buffer, 0.75 U Taq DNA polymerase (5Prime, Hotmaster Taq), 2.5 mM Mg2+, 10 nmol of each dNTP, 1 μl of template DNA, 0.5 μM of each primer, and water to 25 μl. PCR cycling program was run, with an initial denaturation at 94°C for 2 min, followed by 37 cycles of denaturation at 94°C for 20 s, annealing at 55°C for 30 s, extension at 65°C for 80 s, with a final extension at 65°C for 10 min. Successful amplification was confirmed by visualizing PCR products on a 1% agarose gel stained with ethidium bromide. Target PCR product was gel extracted and purified using a Qiagen QIAquick® Gel Extraction Kit according to the manufacturer's recommendations. Bidirectional Sanger sequencing of amplicons was performed at High Throughput Genomics Center (Seattle, WA, USA).
Phylogenetic Analyses
For COI, P. patagonica s.l. sequences from Weis et al. (2014; n = 34 including five downloaded from NCBI) and Harder et al. (2016; n = 26) were added to the final data set. ITS sequences of specimens of both previous studies were generated and also included in the ITS alignment, too.
For both gene regions, sequences were edited with Geneious v. 8.1.3 (Kearse et al., 2012) and aligned in Geneious using MAFFT v. 7.017 Multiple Sequence Alignment (Katoh and Standley, 2013) with default parameters as implemented in Geneious, with a gap opening penalty of 1.53 and offset value of 0.123. For COI, sequences were translated into amino acids using the invertebrate mitochondrial genetic code (transl_table = 5) to verify that all codons could be translated without stop codons. For ITS, a version of the alignment where ambiguously aligned regions were removed was produced with Gblocks v. 0.91b (Castresana, 2000) using less stringent parameters (smaller blocks, gaps in final alignment allowed, less strict flanking positions) as has been done in Dietz et al. (2015b). For analyses when only unique copies were needed, sequences were collapsed into unique sequences (“haplotypes” for COI data) with the online tool FaBox v. 1.41 (Villesen, 2007).
For both data sets a maximum-likelihood (ML) analysis was performed with RAxML v. 8.2.4 (Stamatakis, 2014) using the GTRCAT model of sequence evolution and branch support was assessed with 10,000 rapid bootstrap replicates. In addition, for the mitochondrial data set a resolved ultrametric gene tree was calculated using BEAST v. 1.8.3 (Drummond et al., 2012) with the model specified by jModelTest v. 2.1.10 (Guindon and Gascuel, 2003; Darriba et al., 2012). An XML file was created with BEAUti v. 1.8.3 (Drummond et al., 2012) with the following settings: HKY+G+I as substitution models and 80 × 106 as length of MCMC chain sampling every 1000th tree. Convergence of the likelihood and appropriate effective sampling size (ESS > 200) of parameter estimates were checked using TRACER v. 1.6 (Rambaut et al., 2014), and a consensus tree was calculated using TREEANNOTATOR v. 1.8.3 of the BEAST package. Furthermore, uncorrected pairwise distance matrices were created using MEGA v. 7 (Tamura et al., 2011).
Species Delimitation Methods
For species delimitation analysis of the COI data set we used ABGD (Automatic Barcode Gap Discovery; Puillandre et al., 2012). As no clear barcode gap was found in the pairwise distance data, ABGD results varied strongly depending on single sequences and run parameters tested. Results presented here are mainly from the default settings but using Kimura-2-parameter (K2P) distance correction. The same settings were applied to the ITS alignment (including and excluding ambiguously aligned regions). Due to the smaller data set for the ITS alignment and the fact that informative alignment gaps cannot easily be interpreted as additional character in tree-based delimitation methods, further species delimitation methods were only applied to the COI data set. The final mitochondrial COI ML tree was used to perform a Bayesian Poisson Tree Processes (bPTP) analysis using the web server (http://species.h-its.org/ptp; Zhang et al., 2013). Furthermore, a Generalized Mixed Yule Coalescent (GMYC) analysis based on the resolved ultrametric gene tree was conducted at the web server (http://species.h-its.org/gmyc; Fujisawa and Barraclough, 2013) using the single-threshold method only (see Fujisawa and Barraclough, 2013).
Molecular Clock Analysis
A calibrated molecular clock rate for sea spiders has not been reported in previous studies. However, in order to infer possible divergence date ranges for the different clades we applied a widely adopted COI molecular clock rate reported for insects: 1.15% per myr and lineage (Brower, 1994). BEAST v. 1.8.2 was used to estimate divergence times using an HKY+I+G evolution model as well as an uncorrelated local clock model. Analyses were run for 10 × 106 generations sampling every 1000th tree. Convergence of parameter estimates and ESS control and subsequent steps were done as described above.
Results
Number of COI Clades
The data set of P. patagonica s.l. was extended to a total of 173 specimens including 47 sequences from P. yepayekae. For the first time, we studied individuals from the Strait of Magellan and the Eastern Weddell Sea. Further sequences from P. pilosa (Hoek, 1881) (n = 3) and P. macronyx (Bouvier, 1911) (n = 3) were added to the data set as outgroups.
The final COI alignment consisted of 426 bp (GC content 32.9%) with 278 identical and 128 parsimony informative sites. Neither stop codons nor frame shift mutations were observed after translation. Both the ML and Bayesian phylogenetic tree (Figure 2) resolved P. patagonica s.l. as monophyletic and well-separated from the outgroup. In addition, P. yepayekae represented a monophyletic group within P. patagonica s.l. Moreover, all individuals from the Antarctic shelf formed an “Antarctic super-clade” that also contained one clade with specimens from South Georgia, i.e., one of the Subantarctic islands. The two other specimens collected around South Georgia that did not cluster inside this group represented the basal-most group (Clade N) in the whole P. patagonica s.l. group (Figure 2). Analysis of the final COI alignment with ABGD using K2P substitution model revealed a steady decrease from 21 to 13 in number of recovered groups between P = 0.002 and P = 0.05 in the recursive partition. No clear barcode gap was visible when plotting pairwise uncorrected distances between P. patagonica s.l. specimens (Supporting information Table S1; see upper diagram in Figure 3 showing distances between members of the Antarctic clade). When choosing a threshold value of P = 0.05 ABGD suggested 13 clades, with several formerly reported clades merged (clade E, F, and G from Harder et al., 2016). At P = 0.06 ABGD merged all sequences into one group. Analysis of the Bayesian tree with bPTP, suggested the presence of 20 distinct groups, hence, subdivided five ABGD groupings further resulting in seven additional clades. With 22 groups, GMYC reported the highest number of clades for the ML tree. In contrast to bPTP, GMYC furthermore subdivided P. yepayekae and clade ANT_D into two subclades each. Here, we named the clades according to the bPTP results (see Section Discussion for further information). Several “clades” (two for ABGD, four for bPTP and GMYC) consisted of single specimens only (Figure 2).
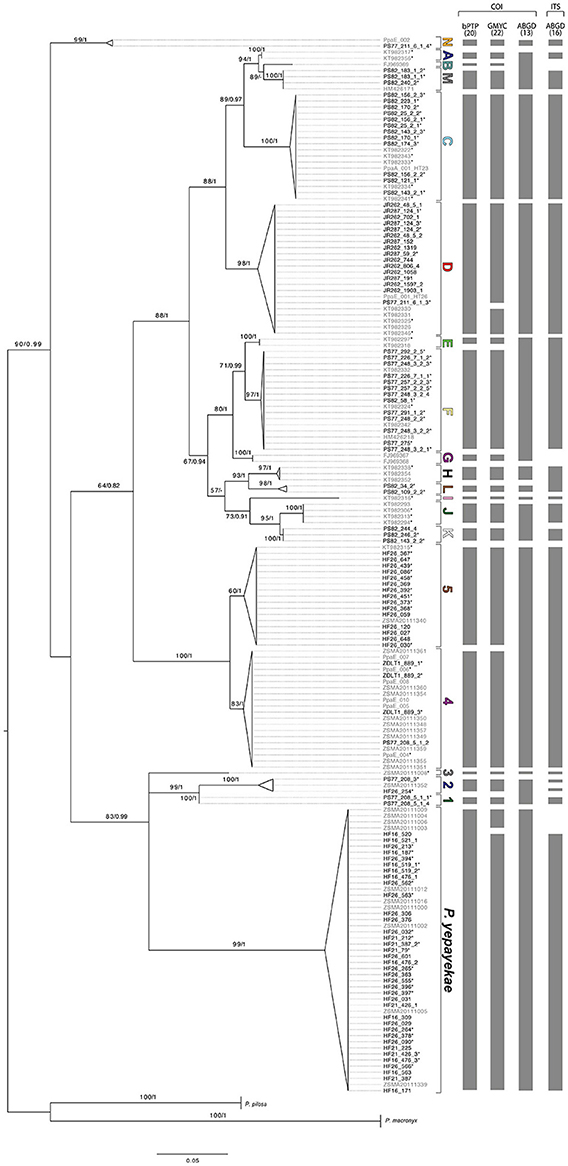
Figure 2. Maximum likelihood tree of COI sequences of Pallenopsis patagonica s.l. combining new (black) and previously (gray) reported samples. P. pilosa and P. macronyx serve as outgroups. Asterisks (*) indicate availability of ITS sequence data for the respective specimens. Bootstrap/posterior probabilities values above 50/0.5 are provided next to each node. Letters and numbers stand for mitochondrial clades from Antarctica (ANT) and the Subantarctic (SUB), respectively. Columns show results of COI-based species delimitation methods (bPTP, GMYC, and ABGD), number in parentheses denote the total number of predicted species by each method. In addition, results of ABGD when analyzing ITS (see Figure 4) are shown in the rightmost column.
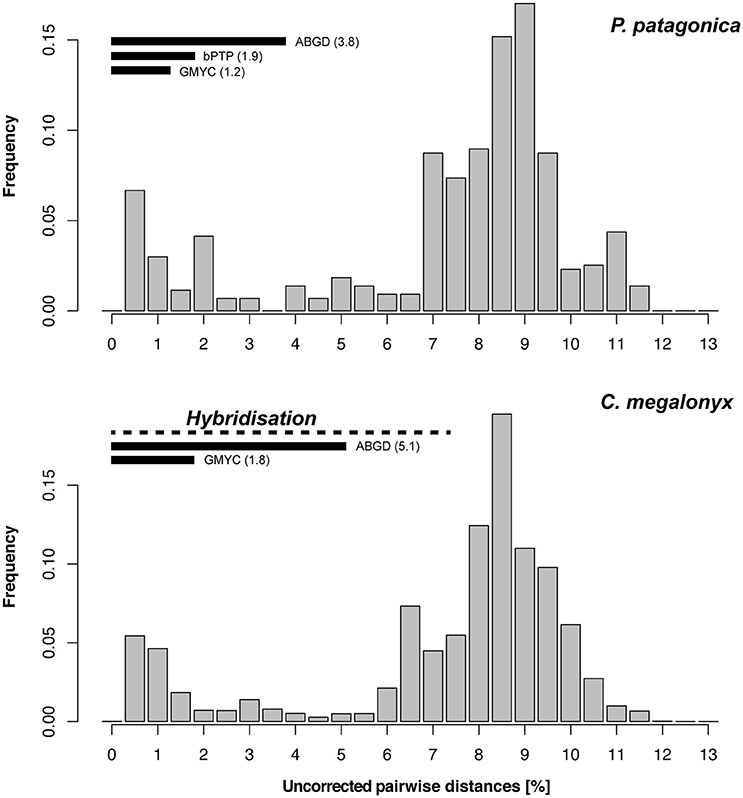
Figure 3. Barcode gap analysis for Antarctic super-clade of Pallenopsis patagonica s.l. (upper) and Colossendeis megalonyx (lower) in comparison. For both data sets, the uncorrected pairwise COI distances between the haplotypes were used. Horizontal bars indicate pairwise distance limits used by delimitation methods to distinguish clades. Dashed line indicates the range of pairwise COI distances across which hybridization was revealed by ITS analyses in C. megalonyx (Dietz et al., 2015b).
Upon reviewing the data set, the following points are of particular interest to address our hypotheses. Newly collected specimens from the Strait of Magellan that were morphologically determined as P. yepayekae clustered with available sequences of P. yepayekae (Weis et al., 2014; Figure 2). Using the GMYC delimitation method, this species was split into two subclades. One subclade (Pye.2, Table 1) included all three haplotypes reported for four specimens sampled in the Chilean region Los Lagos, i.e., at the northernmost occurrence of P. yepayekae. Both other delimitation methods resolved P. yepayekae as a single clade.
All P. patagonica samples from the Strait of Magellan clustered together with sequences that in Weis et al. (2014) formed a sister clade to the Falkland clade (specimens ZSMA20111017 and ZSMA20111340, see Figure 2 in Weis et al., 2014). Average p-distance between this clade and the Falkland clade is 2.7%. The 15 new samples collected around South Georgia clustered together with a specimen from Shag Rocks that was reported as member of the Antarctic clade of P. patagonica (PpaE_001, see Weis et al., 2014). All these specimens formed a subclade (ANT_D.2, Table 1) of clade ANT_D that so far consisted of specimens sampled around the tip of the Antarctic Peninsula (ANT_D.2; Harder et al., 2016). One sample from Shag Rocks grouped together with one individual from South Georgia (PpaE_002), which form the most basal clade (ANT_M) within P. patagonica s.l. For P. patagonica s.l. from the Antarctic shelf, our data set, analyzed with bPTP and GMYC, revealed the presence of three further clades (ANT_K, ANT_L, and ANT_M) in addition to the 10 clades reported from the Antarctic by Harder et al. (2016). These three new clades are exclusively found in the Eastern Weddell Sea (Figure 1). The newly found clade ANT_K is sister clade to ANT_J, clade ANT_L to ANT_H, and clade ANT_M to ANT_B (Figure 2). The two sequences HM426171 and HM426218 reported in Weis et al. (2014) as P. buphtalmus (Pushkin, 1993) and P. latefrontalis (Pushkin, 1993) based on provisional ID in BOLD by that time, clustered together with clade ANT_M and clade ANT_F, respectively. Sampling sites of these are also in the same region.
Nuclear Support for COI Based Species Delimitation
We tested for congruence between the COI and the nuclear ITS clades by analyzing 96 sequences from the majority (bPTP: 18 of 20; GMYC 19 of 22) of reported COI clades (Figure 2). Very few ambiguities were included in sequences due to sequence quality issues for some sequences. The ITS sequence for JR287_124_2 was composed only of two shorter single read sequences (forward and reverse) but had no overlap (108 missing data symbols, “?”). The initial alignment was 1071 bp long, but was shortened to 583 bp after filtering for noisy positions with GBlocks. The final alignment consisted of sequences of 344–582 bp in length with 126 sites being identical and 159 parsimony informative. The base composition was very homogenous with A: 23.2%, C: 27.2%, G: 25.8%, and T: 23.8%. The number of ITS haplotypes was 23 representing 18 of the mitochondrial bPTP clades, i.e., four mitochondrial clades (ANT_C, ANT_F, SUB_2, and SUB_5) had two corresponding ITS sequences and P. yepayekae had three. ANT_H and ANT_L shared the same sequence. No heterozygous individuals were observed.
The phylogenetic ITS tree is much less resolved than the COI tree (Figure 4). However, most samples grouped similar to the COI tree. Separated, albeit poorly supported in the ITS tree, ANT_E and ANT_F clustered together when analyzed with ABGD. Pairwise identity between sequences of the clades was very high (98.9%). Together with ANT_G, for which no ITS data could be obtained, these clades represented a monophyletic group in the mitochondrial tree. In few cases there were minor disagreements in terms of the resolved clades. For examples ANT_L and ANT_H have identical sequences for ITS and hence grouped together. In the COI tree, these two clades represented slightly divergent sister clades. The other dissimilarity between the two phylogenetic trees was a well-supported nuclear clade (bootstrap support of 99%) that included ANT_A and ANT_D as sister groups (no shared haplotypes, however). ABGD distinguished the groups but in the mitochondrial tree ANT_A and ANT_D were not sister groups, yet closely related. In general, ITS showed substantially less variation than COI, and most mitochondrial clades were supported by ITS with minor exceptions mentioned above. However, within the clade SUB_2 we obtained two different ITS sequences from two individuals (PS77_208_3 and HF26_254) that showed much greater nucleotide variation within the ITS than the COI data. Interestingly, in the ITS tree they formed a paraphylum rather than a monophylum as the sequence of another clade (SUB_1) was also included. ABGD split these sequences with low pairwise identity (90.5%) into two separate groups.
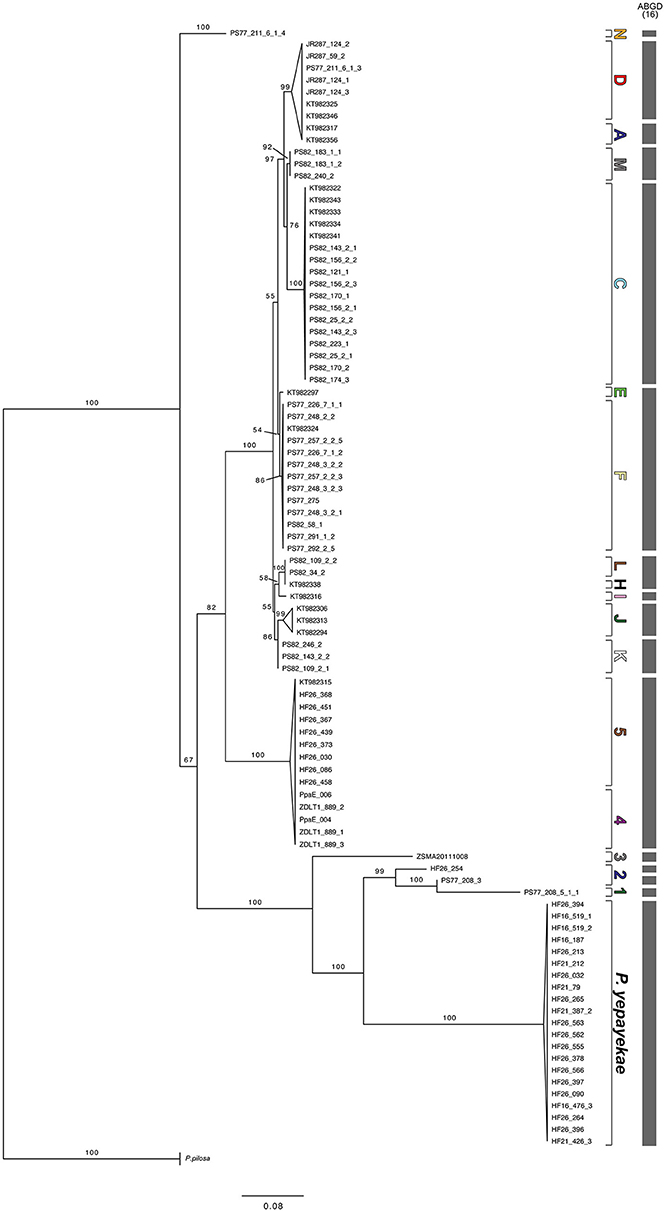
Figure 4. Maximum likelihood tree of ITS sequences of Pallenopsis patagonica s.l. Bootstrap values above 50 are provided next to each node. Letters on the right correspond to the labels used in the mitochondrial tree (see Figure 2). Letters and numbers stand for mitochondrial clades from Antarctica (ANT) and the Subantarctic (SUB), respectively. Bars represent results of the ABGD analysis that was based on the full alignment.
Biogeographic Patterns
The new samples included here prove that P. yepayekae also occurs in the Strait of Magellan and here even in sympatry with an other clade of P. patagonica s.l. (SUB_5; see Figure 1). SUB_5 was represented by only two specimens in Weis et al. (2014) and in contrast to Weis et al. (2014) merged into the “Falkland clade” in Harder et al. (2016). Here, with the additional data, both bPTP and GMYC supported that SUB_5 represents a distinct clade. One formerly reported P. patagonica s.l. clade (termed HT25 in Weis et al., 2014), represented by a single specimen found around South Georgia (Ppa_E002), now included one further specimen from the Shag Rocks (PS77_211_6_1_4). This clade is herein referred to as ANT_N. Vice versa, another clade of P. patagonica s.l., formerly represented by a single specimen from Shag Rocks (Ppa_E001), now clustered together with newly collected specimens from South Georgia (representing one subclade of ANT_D). ANT_N formed a cluster basal to the split between the Antarctic super-clade (i.e., specimens sampled South of the Polar Front) and the Falkland/Strait of Magellan clade (Figure 2). South Georgia individuals belonging to ANT_D thus grouped within the Antarctic clade reported by Weis et al. (2014) and clade D reported by Harder et al. (2016). Hence, these two clades (ANT_N and ANT_D) that occur in the same area, are not sister clades but only distantly related.
The new specimens sampled from the Eastern Weddell Sea grouped into five clades. Two of these clades, ANT_C and ANT_F, were already reported from the Antarctic Peninsula by Harder et al. (2016). Thus, our new data extended the reported distribution range for these two clades to the Eastern Weddell Sea. Specimens of the other three clades have not been reported earlier and were only found in the Eastern Weddell Sea. Specimens of clade ANT_D, found at the northernmost tip of the Antarctic Peninsula, grouped together with the individuals mentioned above from around South Georgia and Shag Rocks (Figure 2). No clades with individuals from either side of the Antarctic Polar Front were found in our data set.
Divergence Dating
The divergence from the most recent common ancestor of P. patagonica s.l. occurred 13.6 myr before present [HPD 95% interval: 9.8–17.7 myr before present (BP)]. Also, the divergence of the Antarctic vs. the Falkland/Magellan clade took place in the mid Miocene (9.5 myr BP), 7.2–12.9 myr BP). Divergence of the distinct mitochondrial clades occurred (independently on whether choosing ABGD, bPTP or GMYC as a delimitating criterion) in the Plio- and Pleistocene, mostly before the last 2 myr BP (Supplementary Figure S1).
Discussion
Number of Mitochondrial Clades
As predicted by the first hypothesis, we found additional mitochondrial clades within P. patagonica s.l. when analyzing the extended COI data set with bPTP and GMYC. The groupings of bPTP and GMYC were congruent for most clades with the exception that GMYC further subdivided P. yepayekae and ANT_D into two geographically separated subclades each. However, when using ABGD with default settings, the number of mitochondrial clades inferred was actually smaller than the number reported by Harder et al. (2016) (Figure 2, Supplementary Table S2).
Which Mitochondrial Clades Can Be Considered As Species?
When trying to find an objective value that best describes the number of species (defined as independently evolving units) with the classical COI barcoding alone, the original approach was to quantify intra- vs. inter-specific genetic distances through a barcoding gap analysis that defines the maximum threshold distance found within a species. For animal taxa, this value has often been found at 2% pairwise distances (e.g., Hebert et al., 2003). Other approaches expect distinct species to show a 10x greater divergence than found within species (Hebert et al., 2004). Barcode gap analyses within sea spiders have reported intraspecific threshold distances of up to 5% (Mahon et al., 2008). Here, we could not detect a distinct barcoding gap for the P. patagonica species complex but rather a gradient of pairwise distances, though many at low frequency (Supporting Information Table S1). This is similar to results observed within the sea spider complex C. megalonyx (Dietz et al., 2015b). Consequently, species delimitation based on COI is not straightforward and we followed several lines of argumentation summarized in Kekkonen and Hebert (2014) in order to discuss whether mitochondrial clades resemble species or not. According to the ideas presented in Kekkonen and Hebert (2014), species status can be assigned to clades with a full match of all different species delimitation methods. This is the case for the following six clades: SUB_3, ANT_C, ANT_H, ANT_I, ANT_L, and ANT_N. For all other clades, only a partial match between the different methods was observed. In such cases, Kekkonen and Hebert (2014) suggest to test whether (a) the resolved clades are monophyletic, (b) individuals are supported by diagnostic characters (nucleotide substitutions, insertions or deletions, see also Jörger and Schrödl, 2013), or (c) specimens of different clades occur in sympatry. All three criteria are based on species concepts. Both, monophyletic entities and diagnostic characters missing in sister taxa matter for the phylogenetic species concept. The biological species concept requires groups that are reproductively isolated, which in nature can only be detected when groups occur in sympatry. Due to a limited sample size and geographical range and hence the potential for unsampled haplotypes leading to ascertainment biases, the criterion of diagnostic characters is not considered here and only the two remaining criteria, monophyly and occurrence in sympatry, are applied to the evaluation of the mitochondrial data set.
The GMYC-subclades for P. yepayekae are the only example of the data set where the monophylum criterium cannot be applied, because although the individuals from Los Lagos themselves form a monophylum, the remaining specimens, which represent the majority, would be rendered as paraphyletic. Furthermore, specimens of both subclades do not occur in sympatry. As the Los Lagos specimens represent the northernmost occurrence of P. yepayekae known to date, a straightforward explanation of this pattern is isolation-by-distance. In particular because genetic differences between specimens from these two clades (max. uncorrected p-distances observed 0.9%) lie well within the range typically reported as intraspecific for other sea spider species (Mahon et al., 2008; Krabbe et al., 2010; Arango and Brenneis, 2013; Dietz et al., 2015a,b) as well as other arthropods (see Supporting Information Table S1 in Smith et al., 2005) we refrain from assigning species-level status to these two subclades and rather accept the grouping based on bPTP and ABGD.
For clade ANT_D, the found divergence of 1.6% between the two GMYC-subclades (ANT_D.1 vs. ANT_D.2, Antarctic Peninsula vs. South Georgia, respectively) is larger than between the GMYC-subclades of P. yepayekae. But because this value is still within the range reported as intraspecific and the subclades occur in different regions it cannot be ruled out that they represent two geographically separated populations. Hence, we refer to these subclades as one clade. ANT_D represents the only reported P. patagonica s.l. clade that crossed the deep sea between the continental shelf and the Subantarctic islands, but stayed within the Polar Front. Gene flow between the Antarctic continental shelf and South Georgia has already been reported in a few studies on other benthic invertebrates (Thornhill et al., 2008; Wilson et al., 2009; Dietz et al., 2015a,b).
ABGD merged five of the bPTP/GMYC-clades. All single bPTP/GMYC-clades are reciprocally monophyletic, but only SUB_1 and SUB_2 occur in sympatry. Following the protocol of Kekkonen and Hebert (2014), SUB_1 and SUB_2 would represent two distinct species as revealed by bPTP and GMYC. All other clades merged by ABGD do not occur in sympatry and therefore species assignments are not possible based on the limited data set. ANT_A, ANT_B, and ANT_M were sampled from Ross Sea and Eastern Weddell Sea with not exceedingly high uncorrected pairwise distances ranging from 2.1 to 3.5%. Thus, the grouping suggested by ABGD seems adequate. ANT_E, ANT_F, and ANT_G were sampled from the Western side of the Antarctic Peninsula, on both sides of the Weddell Sea and the Ross Sea. This pattern could be the result of isolation by distance, too. Harder et al. (2016) also found clade G as a distinct clade using bPTP, GMYC, and ABGD as delimitation methods. Clades E and F were separated by bPTP and GMYC, but merged with ABGD. Although Harder et al. (2016) decided to keep all three distinct, we suggest to be more careful here in particular in view of the few specimens available (only two for each of clade E and G) and the shallow divergences. Similar as above, ANT_J and ANT_K from the Ross Sea and Weddell Sea, respectively, have a moderate uncorrected pairwise distance of 2.1%. Hence, they are also not treated as different units here. This is also true for groupings of SUB_4 and SUB_5. Specimens of both again do not occur in sympatry (Strait of Magellan vs. Falkland Plateau), and divergence falls well in the range of values reported as intraspecific (average uncorrected pairwise distance 1.93%). In the reported cases of (partial) mismatch between the three delimitation methods it is difficult to apply a general rule, because no clear barcoding gap is known that allows for a clear cut between intra- and inter-specific genetic distances. The fact that we find clades, e.g., ANT_A and ANT_C, with very low intra-clade divergences (<1%) despite a broad distribution range would suppose that intraspecific genetic distances are small also for species with a broad distribution range (i.e., argument against isolation-by-distance). However, limited sampling size does not allow for further conclusions.
We suggest that for partial matches between delimitation methods every case should be evaluated on its own. Combining all these arguments in a conservative way, we suggest 14 distinct evolutionary units in P. patagonica s.l. based on the COI data (Table 2, Supporting information Table S2).
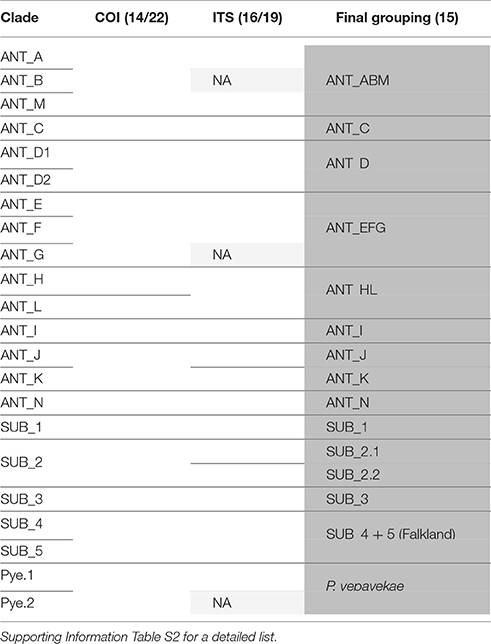
Table 2. Comparison of results from species delimitation analyses using mitochondrial (COI) and nuclear (ITS) data of Pallenopsis patagonica and a final recommendation for groupings.
Nuclear Support for COI Based Species Delimitation
As shown in Dietz et al. (2015b) for pycnogonids only looking at mitochondrial data can lead to overestimation and misinterpretation of the actual species number (see Toews and Brelsford, 2012 for a review). Dietz et al. (2015b) also showed that ITS is a suitable marker for sea spiders as unlike the situation reported for other organisms (e.g., Weitemier et al., 2015) no multiple intragenomic variants for this gene could be detected when using high-throughput sequencing data (Leese et al., 2012). Comparing ITS and COI data we first see that contrary to C. megalonyx (Dietz et al., 2015b) no mito-nuclear discordances are observed in P. patagonica s.l. (Figures 2, 4) This indicates that different processes acted after initial mitochondrial lineage sorting on both sea spider species complexes and will be discussed below. Most importantly, ITS sequences are not shared between different COI clades in P. patagonica, with the exception of the mitochondrial sister clades ANT_H and ANT_L (both with a full match when comparing delimitation methods) that show the same ITS sequence. Even though ANT_E and ANT_F do not share one haplotype, ITS sequences are very similar and species delimitation analysis clusters them together. However, the groupings ANT_H and ANT_L as well as ANT_E and ANT_F (including ANT_G) represent a monophylum within the mitochondrial tree each. Whereas, ANT_H and ANT_L both had a full match when comparing mitochondrial data across delimitation methods, ANT_E and ANT_F were grouped together with ANT_G by ABGD. Unfortunately, we were not able to obtain ITS sequences of an individual from ANT_G to analyse whether ANT_G also groups with ANT_E and ANT_F when analyzing ITS. However, ANT_E and ANT_F clustered into one ABGD group in the mitochondrial tree similar to the ITS tree. Given the lack of resolution, we here suggest not proposing species status for clades ANT_H, ANT_L, ANT_E, ANT_F and ANT_G based on mitochondrial results but suggest to refer to the two groups containing ANT_H and ANT_L as well as ANT_E, ANT_F and ANT_G as one clade each. We are aware of the fact that speciation could be recent and thus has not been picked up with ITS (Table 2).
Mitochondrial clades considered as one evolutionary unit sometimes comprise up to three different but genetically very similar ITS sequences. These sequences, however, cluster together when using ABGD on the ITS data set. For example, based on COI data clades ANT_J and ANT_K that were both distinguished as separate clades by bPTP and GMYC were treated as one hyper-clade as there was a lack of characters distinguishing them and ABGD clustered them together when analyzing mitochondrial data. But ITS data within this hyper-clade can be assigned to the two different bPTP/GMYC clades. The same holds true for further combinations that are also congruent between ITS and the bPTP/GMYC delimitation of the COI gene (SUB_1 and SUB_2, SUB_4, and SUB_5 as well as ANT_A and ANT_M). In the case of ANT_D, ITS sequences of all available representatives are identical. Thus, the assignment of all individuals to one clade by ABGD and bPTP is congruent with the ITS result. The more resolved delimitation into subclades suggested by the GMYC analysis of the COI data is not supported by the ITS data (Supporting Information Table S2). As above, we here also suggest a conservative approach to not treat these clades as distinct species prior to further evidence.
In view of the evidence from the COI data set and the protocol by Kekkonen and Hebert (2014) as well as the nuclear gene marker results we propose 15 putative evolutionary units for the current data set of P. patagonica s.l. (Table 2). The number is likely to change should further data become available as major regions of the Southern Ocean, especially East Antarctica, still remain unexplored. More important though, is to add further evidence that helps defining a clear boundary between intra- and interspecific characters of the species complex. COI combined for the first time with ITS data of P. patagonica s.l. is a major step forward. However, data are not sufficient for a final delimitation across all clades and additional independent characters (morphology, further genes) are needed to make clear statements. Still, the finding of mito-nuclear agreement supports that in contrast to C. megalonyx we can describe the distinct groups contained within P. patagonica s.l. reasonably well with the current data available.
Distribution Ranges
Our data supports a strong barrier effect of the Antarctic Polar Front as we did neither observe sister clades nor clades containing individuals from either side of the Polar Front of P. patagonica s.l. Such a pattern has also been observed for many other benthic invertebrates (e.g., Page and Linse, 2002; Thornhill et al., 2008; Krabbe et al., 2010). The fact that individuals from South Georgia, i.e., a Subantarctic island south of the Polar Front, form one clade with individuals reported from the northernmost tip of the Antarctic Peninsula (ANT_D) and cluster within the Antarctic super-clade of P. patagonica s.l. hints at a colonization event of South Georgia from the Antarctic. This direction of gene flow makes sense as it is consistent with a pattern of colonization with the Antarctic Circumpolar Current from West to East (Leese et al., 2010). However, for C. megalonyx also shared haplotypes between South Georgia and the Antarctic Peninsula were found for one clade (Clade A; Dietz et al., 2015b). Interestingly, here genetic diversity patterns clearly indicated the opposite pattern, i.e., gene flow from South Georgia to the tip of the Antarctic Peninsula. Dietz et al. (2015b) considered South Georgia as the likely refugium for members of this clade given the exceptionally greater diversity. Colossendeis has been reported from bathypelagic samples (Staples, 2007 and references therein) and a distribution with deep-sea currents and not the Antarctic Circumpolar Current are conceivable. It should be noted that whereas haplotypes were shared at least partly for C. megalonyx clade A between the two distant regions, no haplotype sharing was observed for P. patagonica clade ANT_D here. This indicates that, if at all, gene flow is extremely limited or represented a singular colonization event in P. patagonica.
Our enlarged sampling has extended the previously reported distribution ranges of some clades. P. yepayekae was found in the Strait of Magellan, which extends the occurrence of this species southwards (Weis et al., 2014). With the first records of specimens of clades ANT_F and ANT_C in the Eastern Weddell Sea, we could extend the distribution range of clades previously only reported from the Antarctic Peninsula (Harder et al., 2016). This is also the case for clade ANT_D where individuals from South Georgia were added to a clade previously only reported from the Antarctic Peninsula. It has been stated that narrow rather than broad distribution ranges might be the rule rather than the exception for sea spiders. Krabbe et al. (2010) postulated that most C. megalonyx clades have a narrow and allopatric distribution. However, analyzing more samples lead to the result of clades with a circumpolar distribution with isolation by distance (Dietz et al., 2015b). Thus, for P. patagonica s.l. we may also expect much broader distribution ranges when further material especially from unsampled locations is going to be included.
Furthermore, geographic separation between populations within clades (regional pattern) seems likely as we find subclades in several clades that are geographically separated. GMYC analyses revealed a subclade within P. yepayekae consisting of four individuals from the same area. A stronger effect of geographic separation can be seen for the second reported subdivision of the bPTP/ABGD clade by GMYC. For ANT_D there is a separation between an island population (South Georgia) and one from the Antarctic shelf (i.e., Antarctic Peninsula). Although supported by nuclear data, SUB_4 and SUB_5 clustered together in the ABGD analysis. Here, SUB_4 is represented by individuals from the Falkland Islands only. Isolation of Falkland Island populations from those found on the rest of the South American continental shelf has also been reported for the isopod Serolis paradoxa (Leese et al., 2008).
We also found three new clades in the Eastern Weddell Sea only. It thus might be that different clades have different dispersal capabilities, however, as many habitats around the Antarctic shelf (e.g., Davis Sea and Dumont d'Urville Sea) and Subantarctic islands (e.g., Kerguelen Plateau) have been scarcely sampled, we cannot exclude that distribution ranges are generally broader than currently reported.
Which Clade Represents P. patagonica Sensu Stricto
The type specimen of P. patagonica (Hoek, 1881) has been collected from the Atlantic opening of the Strait of Magellan. In the absence of material from the Strait of Magellan, Weis et al. (2014) already proposed the Falkland clade as P. patagonica sensu stricto. Adding new samples, the Falkland clade also included samples from the Strait of Magellan, however it should be mentioned that this clade can geographically and genetically be subdivided into two sub clades. Both, GMYC and bPTP divided the Falkland clade into SUB_4 and SUB_5 that respectively included either samples from the Falkland Islands or the Strait of Magellan. Likely, specimens here assigned to clade SUB_5 represent the closest relatives of P. patagonica sensu stricto. However, ABGD results for the mitochondrial data combined SUB_4 and SUB_5 into a single clade. This was also supported by ITS data. Further information about the sub clades and the assignment of the type specimen might be obtained by a morphological reinvestigation of the type material in comparison with the new material from the Strait of Magellan.
Divergence Dates
In the absence of calibrated rates, molecular clock estimates using rates from other taxa can only be regarded as a rough proxy. For cold environments it might be assumed that mutation rate is lower as compared to temperate and tropic regions (“slow-rate hypothesis”; Bargelloni et al., 1994). However, evidence for this is still ambivalent (Held, 2001). Specifically, as we are addressing very recent divergence times it can be assumed that divergence times may be systematically higher than the rates inferred from rather deep calibration points (see Ho et al., 2005). The rate used and the error bars should thus be regarded as a rough orientation helping to interpret the radiation of P. patagonica. Even when considering the huge error bars, it is obvious that the divergence of the Subantarctic and the Antarctic super-clades took likely place in the Miocene after the opening of the Drake Passage. This indicates a single colonization event after the onset of the Polar Front and the Antarctic Circumpolar Current. The direction of the colonization (out of or into the Antarctic) remains unsolved in view of the limited number of outgroups. Also, the radiation of the many Antarctic P. patagonica species very likely started in the late Pliocene and increased during the Pleistocene (last 2.5 myr). Such patterns have been reported before (e.g., Held, 2000; Page and Linse, 2002; Thornhill et al., 2008; Krabbe et al., 2010; Leese et al., 2010; Hemery et al., 2012; Dietz et al., 2015a,b) suggesting that over evolutionary time scales the Polar Front has not been an impermeable barrier to gene flow in general, though we did not observe across Drake Passage exchange in more recent clades of P. patagonica s.l. However, in view of the above-mentioned limitations of molecular clock calculations, we advise to use the divergence estimates made here with caution.
Comparing Species Complexes of P. patagonica and C. megalonyx
It becomes obvious that total divergence contained in P. patagonica s.l. exceeds the genetic divergence found within C. megalonyx (17 vs. 11% maximum pairwise distances, respectively). This suggests that species delimitation using morphological characters is more advanced in Colossendeis as compared to Pallenopsis. The description of P. yepayekae within P. patagonica s.l. shows that morphologically clearly distinguishable species exist, but no similarly detailed morphological inspections as within Colossendeis have been performed yet (Hodgson, 1907, 1908; Fry and Hedgpeth, 1969; Pushkin, 1993; Child, 1995; Dietz et al., 2013, 2015a). Thus, when comparing the complexes of C. megalonyx and P. patagonica side by side a similar proportion of the tree should be taken into consideration. When comparing pairwise COI sequence divergence between C. megalonyx (Krabbe et al., 2010; Dietz et al., 2015b) with all representatives of the Antarctic clade within P. patagonica s.l. a striking result is that barcode gap patterns look almost identical (Figure 3). Also, neither of the two species complexes shows a distinct barcode gap, pairwise sequence distances in the range of 2–5% are found at low frequencies. This is the reason for the more ambiguous ABGD results. However, the majority of inter-clade comparisons for both complexes are in the range of 6.5–9.5% (see Figure 3). These are values typically reported as interspecific.
Still, there is a substantial difference between this study and the study on C. megalonyx by Dietz et al. (2015b) in that all mitochondrial clades in P. patagonica s.l. (with the exception of ANT_L and ANT_H that are identical for ITS) are also supported by diagnostic ITS substitutions (Supporting Information Table S2), whereas in C. megalonyx there is strong evidence for hybridization across several clades that have even more than 7% COI divergence. The results for P. patagonica thus are similar to most other studies on Southern Ocean biota finding mito-nuclear agreement (e.g., Leese and Held, 2008; Dietz et al., 2015a) and thus support of distinct species. It thus remains subject to discussion whether hybridization among C. megalonyx clade members as opposed to P. patagonica is possible due to the slower build-up of pre- or post-zygotic reproductive barriers.
One result of the direct comparison of both species complexes with the same molecular markers made here is that similar processes may have led to the divergence of distinct mitochondrial lineages. Assuming similar molecular clock rates, both have likely taken place in the same period (Plio-/Pleistocene) characterized by drastic environmental changes between glacial and interglacial periods (see Thatje et al., 2005; Allcock and Strugnell, 2012). Yet, whereas for C. megalonyx hybridization of many of the species has been detected, this is not the case for P. patagonica s.l. Given the limited information on the biology of the species reasons for this difference are difficult to estimate. One reason might be differences in the reproductive mode, another one differences in dispersal capabilities. Due to a lack of knowledge about reproduction within different sea spider species a direct comparison is not possible. However, larval stages and egg carrying males have never been reported for the genus Colossendeis possibly indicating low reproduction rate, whereas for Pallenopsis, males carry the eggs until hatching (benthic brooding) indicating a higher reproduction rate than in Colossendeis. Therefore, a low dispersal capability is assumed for Pallenopsis (except for occasional dispersal of adults, see below) while the situation in Colossendeis is unclear. The data for C. megalonyx Clade A (shared haplotypes between South Georgia and the Antarctic Peninsula) as well as most of the circumpolar clades in comparison to the many clades in P. patagonica that show rather narrow distribution ranges add further support for this difference in mobility. A lack of dispersal between isolated habitats can in principle promote the rise of reproductive barriers. Other possibilities include e.g., much stronger patterns of sexual selection and thus pre-zygotic mechanisms leading to faster complete lineage sorting. Also, C. megalonyx might show generally greater effective population sizes that counteract speciation. In view of similar divergence and diversity patterns for the COI data this seems, however, implausible. Perhaps the Antarctic Peninsula was colonized by active (i.e., walking) migration of C. megalonyx Clade A individuals from South Georgia through the deep sea after the end of the last glacial period. Pallenopsis has only been reported for the meso-pelagial but also in upper water plankton samples and drifting on jellyfish (Pages et al., 2007 and references therein). However, most likely the Antarctic Circumpolar Current prevents a drift across of the Antarctic Polar Front.
While for C. megalonyx we see strong evidence for an in situ evolution in Antarctica and migration to the Subantarctic (Clade B, M), this can neither be proved nor rejected for P. patagonica yet.
Conclusions
The results of our study on the sea spider P. patagonica support some, but not all of our initial hypotheses: (1) We find an increase of mitochondrial clades and an extension of distribution ranges with additional sampling. (2) Adding for the first time nuclear ITS data to verify the detected mitochondrial lineages in general found good agreement between both marker systems, i.e., no mito-nuclear discordances. This is in disagreement to a recent report in C. megalonyx where strong evidence for hybridization and introgression was reported. Therefore, we suggest that the number of mitochondrial clades likely resembles the number of distinct species. However, application of state of the art species delimitation methods and analysis of both mitochondrial and nuclear genes does not lead to an unequivocal species delineation. Hence, future work needs to include more sets of characters for integrative taxonomy. The application of a molecular clock approach suggests that drivers of the biodiversity pump (speciation drivers) have acted at the same time scales producing mainly young divergences in both P. patagonica s.l. and C. megalonyx but led to the formation of new species more efficiently in P. patagonica s.l.
Author Contributions
Conceived the study: JSD, FL, and RRM. Laboratory analyses: JSD, AMH, and ARM. Bioinformatic analyses: JSD, FL. Wrote the paper: JSD, FL, and RRM.
Funding
This work was supported by the Deutsche Forschungsgemeinschaft (DFG) in the framework of the priority programme “Antarctic Research with comparative investigations in Arctic ice areas” by a grant to FL (LE 2323/3-1) and RRM (ME 2683/8-1), and by research grant “Biodiversity of the Chilean Fjords” of Sea Life Center Munich to RRM. This work was also supported by National Science Foundation Grants to ARM (ANT-1043745, PLR-1043670).
Conflict of Interest Statement
The authors declare that the research was conducted in the absence of any commercial or financial relationships that could be construed as a potential conflict of interest.
Acknowledgments
Chester Sands (British Antarctic Survey) provided samples of cruises on the RV Polarstern PS77/ PS82. Dave Barnes raised funding for cruises on the RV James Clark Ross JR262/JR287. Vladimir Laptikhovsky (Falkland Islands Fisheries Department) provided further samples from the Falkland Islands. Pallenopsis from South America were collected during Huinay Fjordos expeditions organized by Vreni Häussermann and Günter Försterra of the Huinay Scientific field station. We thank the staff and crew of the ASRV Laurence M. Gould and the RVIB Nathaniel B. Palmer and the Antarctic Support Company for field assistance to AMH and ARM. This paper is publication #145 of the Huinay Scientific field station.
Supplementary Material
The Supplementary Material for this article can be found online at: https://www.frontiersin.org/article/10.3389/fevo.2016.00139/full#supplementary-material
References
Allcock, A. L., and Strugnell, J. M. (2012). Southern Ocean diversity: new paradigms from molecular ecology. Trends Ecol. Evol. 27, 520–528. doi: 10.1016/j.tree.2012.05.009
Arango, C. P., and Brenneis, G. (2013). New species of Australian Pseudopallene (Pycnogonida: Callipallenidae) based on live colouration, morphology and DNA. Zootaxa 3616, 401–436. doi: 10.11646/zootaxa.3616.5.1
Arango, C. P., Soler-Membrives, A., and Miller, K. J. (2011). Genetic differentiation in the circum-Antarctic sea spider Nymphon australe (Pycnogonida; Nymphonidae). Deep Sea Res. II 58, 212–219. doi: 10.1016/j.dsr2.2010.05.019
Bargelloni, L., Ritchie, P. A., Patarnello, T., Battaglia, B., Lambert, D. M., and Meyer, A. (1994). Molecular evolution at subzero temperatures: mitochondrial and nuclear phylogenies of fishes from Antarctica Suborder Notothenioidei), and the evolution of antifreeze glycopeptides. Mol. Biol. Evol. 11, 854–863.
Bouvier, E. L. (1911). Les Pycnogonides du “Pourquoi Pas?” Comptes Rendus des Séances Hebdomadaires de l'Académie des Sciences 152, 1136–1141.
Brower, A. V. (1994). Rapid morphological radiation and convergence among races of the butterfly Heliconius erato inferred from patterns of mitochondrial DNA evolution. Proc. Natl. Acad. Sci. U.S.A. 91, 6491–6495. doi: 10.1073/pnas.91.14.6491
Castresana, J. (2000). Selection of conserved blocks from multiple alignments for their use in phylogenetic analysis. Mol. Biol. Evol. 17, 540–552. doi: 10.1093/oxfordjournals.molbev.a026334
Child, C. A. (1995). Antarctic and subantarctic pycnogonida: the families Nymphonidae, Colossendeidae, Rhynchothoraxidae, Pycnogonidae, Endeididae, and Callipallenidae. Antarct. Res. Ser. 69, 1–68. doi: 10.1029/AR069
Clarke, A., and Crame, J. A. (1989). The origin of the Southern Ocean marine fauna. Geol. Soc. Spec. Publ. 47, 253–268. doi: 10.1144/GSL.SP.1989.047.01.19
Clarke, A., and Johnston, N. M. (2003). Antarctic marine benthic diversity. Oceanogr. Mar. Biol. Annu. Rev. 41, 47–114.
Convey, P., Stevens, M. I., Hodgson, D. A., Smellie, J. L., Hillenbrand, C. D., Barnes, D. K. A., et al. (2009). Exploring biological constraints on the glacial history of Antarctica. Q. Sci. Rev. 28, 3035–3048. doi: 10.1016/j.quascirev.2009.08.015
Darriba, D., Taboada, G. L., Doallo, R., and Posada, D. (2012). jModelTest 2: more models, new heuristics and parallel computing. Nat. Methods 9, 772. doi: 10.1038/nmeth.2109
De Broyer, C., and Danis, B. (2011). How many species in the Southern Ocean? Towards a dynamic inventory of the Antarctic marine species. Deep Sea Res II 58, 5. doi: 10.1016/j.dsr2.2010.10.007
De Broyer, C., Koubbi, P., Griffiths, H. J., Raymond, B., d'Udekem d'Acoz, C., Van de Putte, A. P., et al. (eds.). (2014). Biogeographic Atlas of the Southern Ocean. Cambridge: Scientic Committee on Antarctic Research.
Dietz, L., Arango, C. P., Dömel, J. S., Halanych, K. M., Harder, A. M., Held, C., et al. (2015b). Regional differentiation and extensive hybridization between mitochondrial clades of the Southern Ocean giant sea spider Colossendeis megalonyx. R. Soc. Open Sci. 2:140424. doi: 10.1098/rsos.140424
Dietz, L., Krapp, F., Hendrickx, M. E., Arango, C. P., Krabbe, K., Spaak, J. M., et al. (2013). Evidence from morphological and genetic data confirms that Colossendeis tenera Hilton, 1943 (Arthropoda: Pycnogonida), does not belong to the Colossendeis megalonyx Hoek, 1881 complex. Org. Divers. Evol. 13, 151–162. doi: 10.1007/s13127-012-0120-4
Dietz, L., Pieper, S., Seefeldt, M. A., and Leese, F. (2015a). Morphological and genetic data clarify the taxonomic status of Colossendeis robusta and C. glacialis (Pycnogonida) and reveal overlooked diversity. Arthropod. Syst. Phyl. 73, 107–128.
Dömel, J. S., Convey, P., and Leese, F. (2015). Genetic data support independent glacial refugia and open ocean barriers to dispersal for the Southern Ocean sea spider Austropallene cornigera (Möbius, 1902). J. Crust. Biol. 35, 480–490. doi: 10.1163/1937240X-00002351
Drummond, A. J., Suchard, M. A., Xie, D., and Rambaut, A. (2012). Bayesian phylogenetics with BEAUti and the BEAST 1.7. Mol. Biol. Evol. 29, 1969–1973. doi: 10.1093/molbev/mss075
Folmer, O., Black, M., Hoeh, W., Lutz, R., and Vrijenhoek, R. (1994). DNA primers for amplification of mitochondrial cytochrome c oxidase subunit I from diverse metazoan invertebrates. Mol. Mar. Biol. Biotechnol. 3, 294–299.
Fry, W. G., and Hedgpeth, J. W. (1969). The fauna of the Ross Sea: Part 7. Pycnogonida, 1: Colossendeidae, Pycnogonidae, Endeidae, Ammotheidae. Bull. New Zealand Dept. sci. ind. Res. 198, 1–139.
Fujisawa, T., and Barraclough, T. G. (2013). Delimiting species using single-locus data and the generalized mixed Yule coalescent (GMYC) approach: a revised method and evaluation on simulated datasets. Syst. Biol. 62, 707–724. doi: 10.1093/sysbio/syt033
Griffiths, H. J., Arango, C. P., Munilla, T., and McInnes, S. J. (2011). Biodiversity and biogeography of Southern Ocean pycnogonids. Ecography 34, 616–627. doi: 10.1111/j.1600-0587.2010.06612.x
Guindon, S., and Gascuel, O. (2003). A simple, fast, and accurate algorithm to estimate large phylogenies by maximum likelihood. Syst. Biol. 52, 696–704. doi: 10.1080/10635150390235520
Gutt, J., Sirenko, B. I., Smirnov, I. S., and Arntz, W. E. (2004). How many macrozoobenthic species might inhabit the Antarctic shelf? Antarct. Sci. 16, 11–16. doi: 10.1017/S0954102004001750
Harder, A. M., Halanych, K. M., and Mahon, A. R. (2016). Diversity and distribution within the sea spider genus Pallenopsis (Chelicerata: Pycnogonida) in the Western Antarctic as revealed by mitochondrial DNA. Polar Biol. 39, 677–688. doi: 10.1007/s00300-015-1823-8
Hebert, P. D., Cywinska, A., Ball, S. L., and deWaard, J. R. (2003). Biological identifications through DNA barcodes. Proc. R. Soc. B 270, 313–321. doi: 10.1098/rspb.2002.2218
Hebert, P. D., Stoeckle, M. Y., Zemlak, T. S., and Francis, C. M. (2004). Identification of birds through DNA barcodes. PLoS Biol. 2:e312. doi: 10.1371/journal.pbio.0020312
Held, C. (2000). Phylogeny and biogeography of serolid isopods (Crustacea, Isopoda, Serolidae) and the use of ribosomal expansion segments in molecular systematics. Mol. Phylogenet. Evol. 15. 165–178. doi: 10.1006/mpev.1999.0739
Held, C. (2001). No evidence for slow-down of molecular substitution rates at subzero temperatures in Antarctic serolid isopods (Crustacea, Isopoda, Serolidae). Polar Biol. 24, 497–501. doi: 10.1007/s003000100245
Held, C. (2014). “Chapter 10.5. Phylogeography and population genetics,” in Biogeographic Atlas of the Southern Ocean, eds C. De Broyer and P. Koubbi (Cambridge: Scientic Committee on Antarctic Research), 437–440.
Hemery, L. G., Eléaume, M., Roussel, V., Améziane, N., Gallut, C., Steinke, D., et al. (2012). Comprehensive sampling reveals circumpolarity and sympatry in seven mitochondrial lineages of the Southern Ocean crinoid species Promachocrinus kerguelensis (Echinodermata). Mol. Ecol. 21, 2502–2518. doi: 10.1111/j.1365-294X.2012.05512.x
Ho, S. Y., Phillips, M. J., Cooper, A., and Drummond, A. J. (2005). Time dependency of molecular rate estimates and systematic overestimation of recent divergence times. Mol. Biol. Evol. 22, 1561–1568. doi: 10.1093/molbev/msi145
Hodgson, T. V. (1907). Pycnogonida. Natural history collections of the “Discovery” National Antarctic Expedition. Zoology 3, 1.
Hodgson, T. V. (1908). VI.—The Pycnogonida of the Scottish National Antarctic Expedition. Trans. R. Soc. Edinb. 46, 159–188. doi: 10.1017/S0080456800015659
Hoek, P. P. C. (1881). Report on the Pycnogonida, dredged by HMS Challenger during the Years 1873-76. Rep. Sc. Res. Voy. Hms. Challeng. Zool. 3, 1.
Janko, K., Lecointre, G., Devries, A., Couloux, A., Cruaud, C., and Marshall, C. (2007). Did glacial advances during the Pleistocene influence differently the demographic histories of benthic and pelagic Antarctic shelf fishes? -Inferences from intraspecific mitochondrial and nuclear DNA sequence diversity. BMC Evol. Biol. 7:220. doi: 10.1186/1471-2148-7-220
Janosik, A. M., and Halanych, K. M. (2010). Unrecognized Antarctic biodiversity: a case study of the genus Odontaster (Odontasteridae; Asteroidea). ICB 50, 981–992. doi: 10.1093/icb/icq119
Jörger, K. M., and Schrödl, M. (2013). How to describe a cryptic species? Practical challenges of molecular taxonomy. Front. Zool. 10:59. doi: 10.1186/1742-9994-10-59
Kaiser, S., Brandão, S., Brix, S., Barnes, D. K. A., Bowden, D. A., Ingels, J., et al. (2013). Patterns, processes and vulnerability of Southern Ocean benthos: a decadal leap in knowledge and understanding. Mar. Biol. 160, 2295–2317. doi: 10.1007/s00227-013-2232-6
Katoh, K., and Standley, D. M. (2013). MAFFT multiple sequence alignment software version 7: improvements in performance and usability. Mol. Biol. Evol. 30, 772–780. doi: 10.1093/molbev/mst010
Kearse, M., Moir, R., Wilson, A., Stones-Havas, S., Cheung, M., Sturrock, S., et al. (2012). Geneious Basic: an integrated and extendable desktop software platform for the organization and analysis of sequence data. Bioinformatics 28, 1647–1649. doi: 10.1093/bioinformatics/bts199
Kekkonen, M., and Hebert, P. D. (2014). DNA barcode-based delineation of putative species: efficient start for taxonomic workflows. Mol. Ecol. Resour. 14, 706–715. doi: 10.1111/1755-0998.12233
Krabbe, K., Leese, F., Mayer, C., Tollrian, R., and Held, C. (2010). Cryptic mitochondrial lineages in the widespread pycnogonid Colossendeis megalonyx Hoek, 1881 from Antarctic and Subantarctic waters. Polar Biol. 33, 281–292. doi: 10.1007/s00300-009-0703-5
Leese, F., Agrawal, S., and Held, C. (2010). Long-distance island hopping without dispersal stages: transportation across major zoogeographic barriers in a Southern Ocean isopod. Naturwissenschaften 97, 583–594. doi: 10.1007/s00114-010-0674-y
Leese, F., Brand, P., Rozenberg, A., Mayer, C., Agrawal, S., Dambach, J., et al. (2012). Exploring pandora's box: potential and pitfalls of low coverage genome surveys for evolutionary biology. PLoS ONE 7:e49202. doi: 10.1371/journal.pone.0049202
Leese, F., and Held, C. (2008). Identification and characterization of microsatellites from the Antarctic isopod Ceratoserolis trilobitoides: nuclear evidence for cryptic species. Conserv. Genet. 9, 1369–1372. doi: 10.1007/s10592-007-9491-z
Leese, F., Kop, A., Wägele, J.-W., and Held, C. (2008). Cryptic speciation in a benthic isopod from Patagonican and Falkland Island waters and the impact of glaciations on its population structure. Front. Zool. 5:19. doi: 10.1186/1742-9994-5-19
Lörz, A. N., Maas, E. W., Linse, K., and Coleman, C. O. (2009). Do circum-Antarctic species exist in peracarid Amphipoda? A case study in the genus Epimeria Costa, 1851 (Crustacea, Peracarida, Epimeriidae). ZooKeys 18, 91. doi: 10.3897/zookeys.18.103
Mahon, A. R., Arango, C. P., and Halanych, K. M. (2008). Genetic diversity of Nymphon (Arthropoda: Pycnogonida: Nymphonidae) along the Antarctic Peninsula with a focus on Nymphon australe Hodgson 1902. Mar. Biol. 155, 315–323. doi: 10.1007/s00227-008-1029-5
Munilla, T., and Soler Membrives, A. (2009). Check-list of the pycnogonids from Antarctic and sub-Antarctic waters: zoogeographic implications. Antarct. Sci. 21, 99. doi: 10.1017/S095410200800151X
Page, T. J., and Linse, K. (2002). More evidence of speciation and dispersal across the Antarctic Polar Front through molecular systematics of Southern Ocean Limatula (Bivalvia: Limidae). Polar Biol. 25, 818–826. doi: 10.1007/s00300-002-0414-7
Pages, F., Corbera, J., and Lindsay, D. (2007). Piggybacking pycnogonids and parasitic narcomedusae on Pandea rubra (Anthomedusae, Pandeidae). Plank. Benth. Res. 2, 83–90. doi: 10.3800/pbr.2.83
Puillandre, N., Lambert, A., Brouillet, S., and Achaz, G. (2012). ABGD, Automatic Barcode Gap Discovery for primary species delimitation. Mol. Ecol. 21, 1864–1877. doi: 10.1111/j.1365-294X.2011.05239.x
Pushkin, A. F. (1975). Revision of the Pycnogonida (Pantopoda) of the Pallenopsis patagonica group from Antarctica and adjacent waters. Byulleten Sovietskoi Antarkticheskoi Ekspeditsii 90, 72–83.
Pushkin, A. F. (1993). The pycnogonid fauna of the South Ocean: biological results of the Soviet Antarctic expeditions [Explorations of the Fauna of the Seas]. Russ. Acad. Sci. 20, 1–397.
Rambaut, A., Suchard, M. A., Xie, D., and Drummond, A (2014). Tracer v1.6. Available online at: http://beast.bio.ed.ac.uk/Tracer
Raupach, M. J., Thatje, S., Dambach, J., Rehm, P., Misof, B., and Leese, F. (2010). Genetic homogeneity and circum-Antarctic distribution of two benthic shrimp species of the Southern Ocean, Chorismus antarcticus and Nematocarcinus lanceopes. Mar. Biol. 157, 1783–1797. doi: 10.1007/s00227-010-1451-3
Smith, M. A., Fisher, B. L., and Hebert, P. D. (2005). DNA barcoding for effective biodiversity assessment of a hyperdiverse arthropod group: the ants of Madagascar. Philos. Trans. R. Soc. B 360, 1825–1834. doi: 10.1098/rstb.2005.1714
Stamatakis, A. (2014). RAxML version 8: a tool for phylogenetic analysis and post-analysis of large phylogenies. Bioinformatics 30, 1312–1313. doi: 10.1093/bioinformatics/btu033
Staples, D. A. (2007). A new species of Colossendeis (Pycnogonida: Colossendeidae) together with records from Australian and New Zealand waters. Mem. Mus. Vic. 64, 79–94.
Sunnucks, P., and Hales, D. F. (1996). Numerous transposed sequences of mitochondrial cytochrome oxidase I-II in aphids of the genus Sitobion (Hemiptera: Aphididae). Mol. Biol. Evol. 13, 510–524. doi: 10.1093/oxfordjournals.molbev.a025612
Tamura, K., Peterson, D., Peterson, N., Stecher, G., Nei, M., and Kumar, S. (2011). MEGA5: molecular evolutionary genetics analysis using maximum likelihood, evolutionary distance, and maximum parsimony methods. Mol. Biol. Evol. 28, 2731–2739. doi: 10.1093/molbev/msr121
Thatje, S., Hillenbrand, C. D., and Larter, R. (2005). On the origin of Antarctic marine benthic community structure. Trends Ecol. Evol. 20, 534–540. doi: 10.1016/j.tree.2005.07.010
Thatje, S., Hillenbrand, C. D., Mackensen, A., and Larter, R. (2008). Life hung by a thread: endurance of Antarctic fauna in glacial periods. Ecology 89, 682–692. doi: 10.1890/07-0498.1
Thornhill, D. J., Mahon, A. R., Norenburg, J. L., and Halanych, K. M. (2008). Open-ocean barriers to dispersal: a test case with the Antarctic Polar Front and the ribbon worm Parborlasia corrugatus (Nemertea: Lineidae). Mol. Ecol. 17, 5104–5117. doi: 10.1111/j.1365-294X.2008.03970.x
Toews, D. P., and Brelsford, A. (2012). The biogeography of mitochondrial and nuclear discordance in animals. Mol. Ecol. 21, 3907–3930. doi: 10.1111/j.1365-294X.2012.05664.x
Villesen, P. (2007). FaBox: an online toolbox for fasta sequences. Mol. Ecol. Notes 7, 965–968. doi: 10.1111/j.1471-8286.2007.01821.x
Weis, A., Meyer, R., Dietz, L., Dömel, J. S., Leese, F., and Melzer, R. R. (2014). Pallenopsis patagonica (Hoek, 1881) – a species complex revealed by morphology and DNA barcoding, with description of a new species of Pallenopsis Wilson, 1881. Zool. J. Linn. Soc. 170, 110–131. doi: 10.1111/zoj.12097
Weiss, M., and Leese, F. (2016). Widely distributed and regionally isolated! Drivers of genetic structure in Gammarus fossarum in a human-impacted landscape. BMC Evol. Biol. 16:153. doi: 10.1186/s12862-016-0723-z
Weitemier, K., Straub, S. C. K., Fishbein, M., and Liston, A. (2015). Intragenomic polymorphisms among high-copy loci: a genus-wide study of nuclear ribosomal DNA in Asclepias (Apocynaceae). PeerJ 3:e718. doi: 10.7717/peerj.718
Wilson, N. G., Hunter, R. L., Lockhart, S. J., and Halanych, K. M. (2007). Multiple lineages and absence of panmixia in the “circumpolar” crinoid Promachocrinus kerguelensis from the Atlantic sector of Antarctica. Mar. Biol. 152, 895–904. doi: 10.1007/s00227-007-0742-9
Wilson, N. G., Schrödl, M., and Halanych, K. M. (2009). Ocean barriers and glaciation: evidence for explosive radiation of mitochondrial lineages in the Antarctic sea slug Doris kerguelenensis (Mollusca, Nudibranchia). Mol. Ecol. 18, 965–984. doi: 10.1111/j.1365-294X.2008.04071.x
Keywords: Southern Ocean, Chelicerata, Pycnogonida, DNA-barcoding, ITS, cryptic species
Citation: Dömel JS, Melzer RR, Harder AM, Mahon AR and Leese F (2017) Nuclear and Mitochondrial Gene Data Support Recent Radiation within the Sea Spider Species Complex Pallenopsis patagonica. Front. Ecol. Evol. 4:139. doi: 10.3389/fevo.2016.00139
Received: 10 August 2016; Accepted: 02 December 2016;
Published: 04 January 2017.
Edited by:
Tian Tang, Sun Yat-sen University, ChinaCopyright © 2017 Dömel, Melzer, Harder, Mahon and Leese. This is an open-access article distributed under the terms of the Creative Commons Attribution License (CC BY). The use, distribution or reproduction in other forums is permitted, provided the original author(s) or licensor are credited and that the original publication in this journal is cited, in accordance with accepted academic practice. No use, distribution or reproduction is permitted which does not comply with these terms.
*Correspondence: Jana S. Dömel, jana.doemel@uni-due.de