 Mithun Das1
 M. Ryan Irvin1
 Jin Sha1
 Stella Aslibekyan1
 Bertha Hidalgo1
 Rodney T. Perry1
 Degui Zhi2
 Hemant K. Tiwari2Devin Absher3
 Jose M. Ordovas4
 Donna K. Arnett1*
- 1Department of Epidemiology, School of Public Health, University of Alabama at Birmingham, Birmingham, AL, USA
- 2Department of Biostatistics, Section on Statistical Genetics, School of Public Health, University of Alabama at Birmingham, Birmingham, AL, USA
- 3Absher Laboratory, HudsonAlpha Institute of Biotechnology, Huntsville, AL, USA
- 4Nutrition and Genomics Laboratory, Jean Mayer USDA Human Nutrition Research Center on Aging, Tufts University, Boston, MA, USA
Fenofibrate lowers triglycerides (TG) and raises high density lipoprotein cholesterol (HDLc) in dyslipidemic individuals. Several studies have shown genetic variability in lipid responses to fenofibrate treatment. It is, however, not known whether epigenetic patterns are also correlated with the changes in lipids due to fenofibrate treatment. The present study was therefore undertaken to examine the changes in DNA methylation among the participants of Genetics of Lipid Lowering Drugs and Diet Network (GOLDN) study. A total of 443 individuals were studied for epigenome-wide changes in DNA methylation, assessed using the Illumina Infinium HumanMethylation450 array, before and after a 3-week daily treatment with 160 mg of fenofibrate. The association between the change in DNA methylation and changes in TG, HDLc, and low-density lipoprotein cholesterol (LDLc) were assessed using linear mixed models adjusted for age, sex, baseline lipids, and study center as fixed effects and family as a random effect. Changes in DNA methylation were not significantly associated with changes in TG, HDLc, or LDLc after 3 weeks of fenofibrate for any CpG. CpG changes in genes known to be involved in fenofibrate response, e.g., PPAR-α, APOA1, LPL, APOA5, APOC3, CETP, and APOB, also did not show evidence of association. In conclusion, changes in lipids in response to 3-week treatment with fenofibrate were not associated with changes in DNA methylation. Studies of longer duration may be required to detect treatment-induced changes in methylation.
Introduction
Fenofibrate is a peroxisome proliferator-activated receptor-α (PPAR-α) agonist which improves lipid profiles, particularly by reducing triglycerides (TG) and increasing high density lipoprotein cholesterol (HDLc) (Schoonjans et al., 1996; Staels et al., 1998). The effect of fenofibrate on the metabolism of TG-rich lipoproteins is due to PPAR-α-dependent stimulation of the lipoprotein lipase (LPL), apolipoprotein A-I (APOA1), and apolipoprotein A-V (APOA5) genes, and inhibition of the apolipoprotein C-III gene (APOC3) to decrease TG. The increase in plasma HDLc depends on overexpression of APOA1 as well as down regulation of the apolipoprotein B (APOB) (Auwerx et al., 1996; Staels et al., 1997; Fruchart and Duriez, 2006; Aslibekyan et al., 2015) and cholesteryl ester transfer protein, plasma (CETP) genes (van der Hoogt et al., 2007).
The effect of pharmacologic treatment on lipids shows considerable inter-individual differences, making studies of genetic predictors of fenofibrate response worthwhile. In previous GOLDN (Genetics of Lipid Lowering Drug and Diet Network) publications, common genetic polymorphisms were found to be associated with variation in fenofibrate response. Findings included genes encoding the scavenger receptor class B, member 1 (SCARB1), a key component in the reverse cholesterol transport (Liu et al., 2008); APOA5, an important player in lipid metabolism and homeostasis (Lai et al., 2007); ATP-binding cassette, sub-family A (ABC1), member 1 (ABCA1), involved in cellular lipid efflux and HDL metabolism (Tsai et al., 2010); APOB, essential for transfer of TG and cholesteryl esters during lipoprotein metabolism (Wojczynski et al., 2010); and peroxisome proliferator-activated receptor alpha (PPARA), involved in the pharmacodynamic pathway (Frazier-Wood et al., 2013).
Though there have been multiple genetic studies, there are biochemical reasons to suspect that DNA methylation may be an important factor in TG response to fenofibrate. PPARA is known to regulate homocysteine production (Foucher et al., 2010). In fact, one of the side effects of fenofibrate treatment (which targets PPARα) is elevated homocysteine (Foucher et al., 2010). Homocysteine is a component of the methionine biosynthetic pathway, which is responsible for the production of S-adenosylmethionine, the source of methyl groups for DNA methylation. Furthermore, folate, which has been shown to influence DNA methylation levels, is a coenzyme in this pathway, and dietary folate is effective in abrogating the hyperhomocysteinemia induced by fenofibrate (Foucher et al., 2010). We propose that lipid metabolic pathways and DNA methylation pathways are linked and perturbations in one may directly influence the other. For these reasons, we hypothesized that fenofibrate could induce epigenetic alterations.
Our research is also motivated by other studies which have suggested interventions targeting improvements in cardio-metabolic health are associated with changes in DNA methylation (Crujeiras et al., 2013; Rönn et al., 2013; Deiuliis et al., 2014; Jacobsen et al., 2014; Martin-Núñez et al., 2014; Milenkovic et al., 2014; Su et al., 2014; Benton et al., 2015). Many of these studies have been candidate gene studies and/or global DNA methylation studies, yet they support continued investigation of DNA methylation changes and metabolic response to diet and drug interventions. For example in a mediterranean diet intervention study, global DNA methylation as well as methylation in the promoter region of the stearoyl-CoA desaturase (delta-9-desaturase) (SCD) gene was similar at baseline but different between the control and intervention groups at study conclusion. The authors concluded DNA methylation is associated with weight change and diet adherence.
To address whether a 3-week fenofibrate intervention is associated with changes in DNA methylation during that time period, we conducted a genome-wide study of DNA methylation changes using data collected before and after fenofibrate on lipids and from the Illumina Infinium HumanMethylation450 Beadchip set within the Genetics of Lipid Lowering Drugs and diet network (GOLDN) study. We also conducted secondary analysis focused on candidate genes belonging to the fenofibrate response pathway, specifically PPARA, APOA1, LPL, APOA5, APOC3, CETP, and APOA.
Methods
Study Population
The GOLDN study comprises families of European descent recruited from two field centers in Minneapolis, MN and Salt Lake City, UT. As part of the NHLBI Family Heart Study, GOLDN was designed to identify genetic determinants of lipid response to two interventions: (1) a high-fat meal challenge and (2) treatment with fenofibrate (160 mg) for 3 weeks. Families with at least two siblings were recruited (n = 1327 individuals) and were required to withhold lipid-lowering medications for at least 4 weeks prior to the initial visit. A total of 1053 individuals met all eligibility requirements. Validated questionnaires were used to collect demographic, lifestyle (smoking and alcohol), and dietary data [Diet History Questionnaire (DHQ)] as described in previous publications (Smith et al., 2009; Wood et al., 2011). Written consent was obtained from each participant during the screening visit. This protocol was approved by Institutional Review Boards of University of Minnesota, University of Utah, Tufts University/New England Medical Center, and the University of Alabama at Birmingham. Details of the GOLDN study are available in previous publications (Feitosa et al., 2011; Aslibekyan et al., 2012; Frazier-Wood et al., 2014; Hidalgo et al., 2014; Irvin et al., 2014). Baseline and post-intervention epigenetic data were available for 443 (215 men and 228 women) participants from 139 families.
Lipid Profiles
Lipids were measured both before and after 3 weeks of fenofibrate intervention. TG levels were measured by glycerol blanked enzymatic method (Trig/GB, Roche Diagnostics Corporation, Indianapolis, IN). Low-density lipoprotein cholesterol (LDLc) was measured by a homogenous direct method (LDL Direct Liquid Select Cholesterol Reagent, Equal Diagnostics, Exton, PA). HDLc was calculated after precipitation of non-HDLc with magnesium/dextran.
DNA Methylation
For methylation assays, CD4+ T cells were harvested from stored buffy coats using antigen-specific magnetic beads (Invitrogen, Carlsbad, CA). DNA was extracted using DNeasy kits (Qiagen, Venlo, Netherlands). We used the Illumina Infinium HumanMethylation450 Beadchip (Illumina Inc., San Diego, CA) to quantify genome-wide DNA methylation described in detail in a previous publication (Absher et al., 2013). For each assay, 500 ng of DNA was treated with sodium bisulfite (EZ DNA, Zymo Research, Irvine, CA) before standard Illumina amplification, hybridization, and imaging steps. We used Illumina Genome Studio to estimate β scores (the proportion of total signal from methylation-specific probe or color channel) and detection P-values [probability that the total intensity for a given probe falls within the background signal intensity (Illumina GenomeStudio)]. In the quality control (QC) stage, β-scores with an associated detection P>0.01 were removed and samples with >1.5% missing data points were eliminated from further analysis. Moreover, any CpG probes for which >10% of samples failed to yield adequate intensity were removed. These methods are described extensively in Absher et al. (2013). Due to observed batch effects the filtered β scores were normalized using the ComBat package for R software (Chen et al., 2011). We performed the normalization on random subsets of 10,000 CpGs per run, in which each array of 12 samples was used as batch. To correct for differing probe chemistry on Illumina Infinium HumanMethylation450 Beadchip, we separately normalized probes form the Infinuim I and II as mentioned in our previous publications (Hidalgo et al., 2014; Irvin et al., 2014) with the detailed description in Absher et al. (2013). We further eliminated any CpGs in which the probe sequence mapped either to a location that did not match the annotation file or to >1 locus. We identified such markers by realigning all probes (with unconverted Cs) to the human reference genome. After QC procedures, there were methylation data from 461,281 CpGs. Principal components (PCs) based on the β-scores of all autosomal CpGs passing QC were generated using the prcomp function in R (v2.12.1). The methylation assay for the 443 samples collected after fenofibrate intervention was performed in a similar way.
Statistical Methods
Differences in lipid profiles pre- and post-fenofibrate intervention were analyzed using paired t-tests. To remove the confounding due to T-cell impurity and batch effects in DNA methylation profiles, we obtained residuals of methylation by first modeling the four PCs (to account for T-cell purity) derived from whole-genome methylation as fixed effects and batch as random effect in linear mixed models for both pre- and post-intervention measurements. Previous work in GOLDN has demonstrated the usefulness of adjusting for four PCs to account for T-cell purity (Irvin et al., 2014). The change in methylation after the 3 week intervention was assessed as the change in methylation residual (described above) which was calculated as the difference between the residuals computed from methylation data obtained before and after fenofibrate. Linear mixed models were used to investigate association between change in methylation residual and changes in TG, HDLc, and LDLc. The primary models adjusted for age, sex, and center as fixed effects and family as a random effect using the lmekin function of the kinship package in R (Atkinson and Therneau, 2003). In sensitivity analysis, we additionally adjusted for lifestyle factors that may modify DNA methylation including smoking (current smoking yes or no), alcohol consumption (in grams per day), and fat intake (in grams per day). We used the Bonferroni correction to adjust for multiple comparisons, with the genome-wide significance level of 0.05/(3*461281) = 3.6 × 10⁻⁸. We constructed Manhattan plots to visualize the results. To evaluate deviations from the expected test statistic distributions we constructed quantile-quantile (Q-Q) plots. Finally, for the seven known candidate genes associated with fenofibrate response, we identified and tested 104 CpGs in secondary analysis. The adjusted significance level was determined to be 0.05/(3 × 104) = 1.6 × 10⁻⁴. To estimate the effect size of the methylation change variable on lipid response for our top findings we selected the maximum number of unrelated individuals from our data (N = 158) and report the difference in the R2 estimate from a linear model with and without the CpG methylation change variable term (adjusted for the same terms described for the primary model) as the variance explained by that term. Finally, we conducted a pathway analysis of our top 100 findings from the genome-wide analysis using the Ingenuity Pathway analysis tool (IPA®, QIAGEN Redwood City, www.qiagen.com/ingenuity).
Results
The characteristics of the GOLDN study population are summarized in Table 1. The present study comprises 443 participants with the mean age of 48 years. The paired t-test showed significant differences in participant lipid profiles following the fenofibrate intervention. On average, we observed significant decreases in TG and LDLc (p < 0.001) as well as a significant increase (p < 0.001) in HDLc.
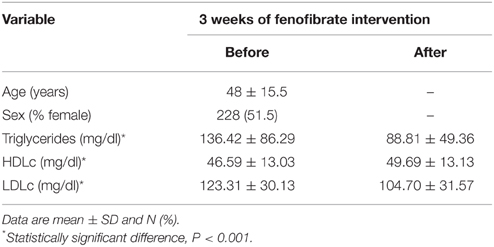
Table 1. Characteristics of the GOLDN participants (n = 433).
The top five results for the association between change in methylation and each individual lipid response to fenofibrate are given in Table 2. None of the associations reached the Bonferroni corrected p-value; however, some were close to statistical significance at that threshold after correction for multiple testing. The Manhattan plots for the genome wide analysis for each lipid response are given in Figures 1–3. The Q-Q plots for each analysis are in Supplementary Figures 1–3. Finally, results did not appreciably change upon sensitivity analysis with additional adjustment for alcohol, smoking, and dietary fat intake (see Supplemental Table 1). The variation explained by the methylation change term for results presented in Table 2 are presented in Supplemental Table 2 and range from ~3–6%. Pathway analysis of the 100 most significant CpG sites for highlighted “Triacylglycerol Biosynthesis” (p = 1.1*10−2) HDL-C response, “Aryl Hydrocarbon Receptor Signaling” (p = 3.47*10−4) for TG response, and “Sperm Motility” (p = 1.63*10−3) for LDL-C response.
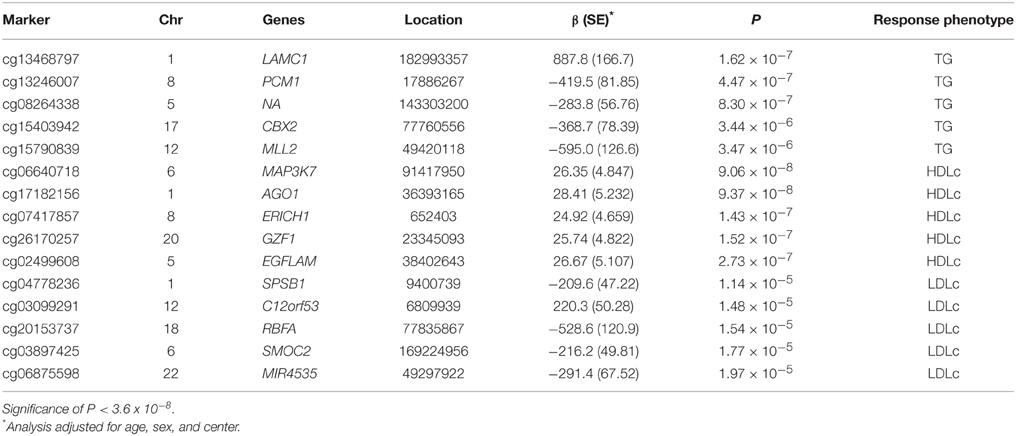
Table 2. Top five CpGs for each lipid showing change in DNA methylation for change in TG, HDLc, and LDLc profiles in the GOLDN study (n = 443) after 3 weeks of daily fenofibrate (160 mg).
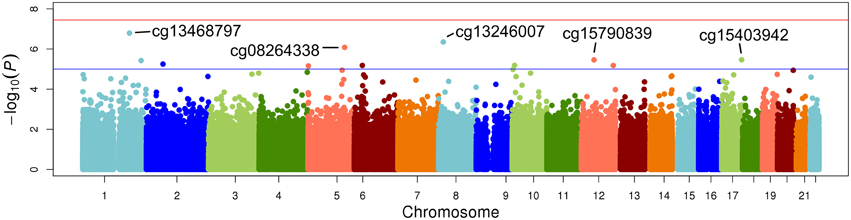
Figure 1. Epigenome-wide Manhattan plot for change in DNA methylation by change in triglycerides after 3 weeks of daily fenofibrate (160 mg).
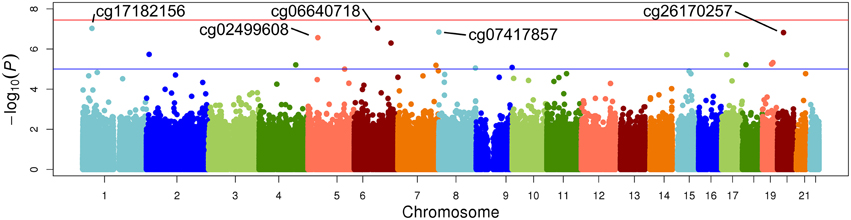
Figure 2. Epigenome-wide Manhattan plot for change in DNA methylation by change in HDL after 3 weeks of daily fenofibrate (160 mg).
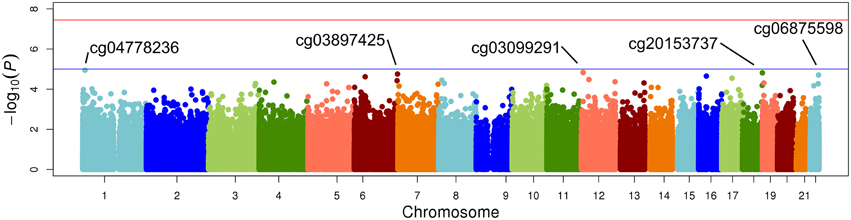
Figure 3. Epigenome-wide Manhattan plot for change in DNA methylation by change in LDL after 3 weeks of daily fenofibrate (160 mg).
The secondary data analysis results for 104 CpGs belonging to fenofibrate pathway genes are shown in Supplementary Data Sheet 1. Methylation changes at CpGs belonging to those genes (PPARA, APOA1, LPL, APOA5, APOC3, CETP, and APOB) were also not associated with lipid response to fenofibrate in our study sample after correction for multiple testing.
Discussion
In the current study we investigated whether changes in DNA methylation are associated with changes in lipid concentration following 3 weeks of fenofibrate treatment among 443 participants from the GOLDN study. We also considered methylation changes in known genes belonging to the pharmacodynamic pathway of fenofibrate for association lipid response in secondary analysis. Overall, our results do not support concomitant changes in DNA methylation upon a 3-week fenofibrate intervention. Nonetheless, given the strong biological plausibility of an effect of fenofibrate on DNA methylation and biological plausibility for some of our highlighted CpGs, future research is needed to expand these findings.
Despite the fact that methylation changes at top CpGs were not statistically significantly associated with lipid response to fenofibrate, a handful of markers approached genome-wide significance. Our results yielded novel genomic findings for fenofibrate response. Our most significant CpG was nearest mitogen-activated protein kinase kinase kinase 7 (MAP3K7) on chromosome 6 for HDL-C response (cg06640718, p = 9.0*10−8). The protein encoded by MAP3K7 is a member of the serine/threonine protein kinase family and mediates signaling transduction induced by TGF beta and morphogenetic protein (BMP), and controls a variety of cell functions including transcription regulation and apoptosis. The gene has been linked to cardiovascular disease in a mouse model (Li et al., 2014). The second top finding was near argonaute RISC catalytic component 1 (AGO1) which plays a role in RNA interference (Hutvagner and Simard, 2008). The top finding for TG response, laminin, gamma 1 (LAMC1), belongs to a family of extracellular matrix glycoproteins that encode laminins. Laminins are involved in a large number of biological functions from cell adhesion, differentiation, migration, and metastasis. SplA/ryanodine receptor domain and SOCS box containing 1 (SPSB1), the top finding for LDL-C response, mediates the degradation of target proteins. The gene has been linked to cancer and inflammation in previous research (Liu et al., 2015). Findings related to cardiovascular disease and inflammation (MAP3K7 and SPSB1) could be tied to fenofibrate response, other findings are more difficult to link to the drug's mechanism (e.g., AGO1). Despite the lack of significance of our findings we hope to further investigate these genes as more data becomes available as part of electronic medical records linked biorepositories, other observational studies, and publically available open data repositories such as dbGaP.
There have only been a handful of drug intervention studies that have considered methylation in the response pathway. A recent 12-week intervention of aliskiren in atherosclerotic patients showed significant down regulation of miRNA in peripheral blood mononuclear cells, indicating a pathway-specific adaptation to renin inhibition (Deiuliis et al., 2014). Likewise, an 8-week intervention with flavonols among male smokers modulated the expression of genes associated with CVD. However, no major changes in DNA methylation (from leukocytes) took place (Milenkovic et al., 2014). Finally, lower methylation of two CpGs of the purinergic receptor P2Y, G-protein coupled, 12 gene (P2Y12) gene in leukocytes was associated with clopidogrel response in alcohol abusers suggesting that epigenetic mechanism could underlie the pathogenesis of clopidogrel resistance (Su et al., 2014). Overall, our study contributes to this growing body of literature on DNA methylation and drug response, despite the fact that we are unable to confirm whether short term changes in DNA methylation mediate response to the lipid lowering medication fenofibrate.
Our study has several limitations, which include smaller sample size and short duration of intervention where its possible that 3 weeks of fenofibrate is insufficient to observe a significant changes in DNA methylation due to drug exposure. We know from previous work in GOLDN that lipid levels associate strongly with methylation levels in the promoter regions of biologically plausible genes (Irvin et al., 2014). Therefore, we cannot exclude the possibility that changes in lipid levels with fenofibrate treatment effect changes in DNA methylation rather than the drug itself. Future studies should consider investigating the epigenetic effects of fenofibrate simultaneously for DNA methylation and histone modifications, and for a longer period of time.
Conclusion
In the present study, no significant change in DNA methylation was found to be associated with lipid response to fenofibrate over 3 weeks. Further studies with larger sample size and longer duration of intervention will be required give further insight into possible relationships between fenofibrate treatment, lipid levels, and changes in DNA methylation.
Author Contributions
HT, DA, JO, and DKA made substantial contributions to the design of the study and the acquisition of data. MD, MI, JS, and DZ made substantial contributions to the analysis of the data. MD, MI, JS, SA, BH, DZ, HT, DA, JO, and DKA made substantial contributions to the interpretation of the data. MD drafted the manuscript and MI, JS, SA, BH, DZ, HT, DA, JO, and DKA reviewed and revised for important intellectual content. All authors reviewed and approved the submitted version of the manuscript and are accountable for the accuracy and integrity of the study.
Funding
This study was funded by the US National Institutes of Health, National Heart, Lung and Blood Institutes grants R01 HL104135 and U01 HL72524.
Conflict of Interest Statement
The authors declare that the research was conducted in the absence of any commercial or financial relationships that could be construed as a potential conflict of interest.
Supplementary Material
The Supplementary Material for this article can be found online at: http://journal.frontiersin.org/article/10.3389/fgene.2015.00304
Supplementary Figure 1. Q-Q Plot of change in methylation by change in Triglycerides after 3 weeks of daily fenofibrate (160 mg).
Supplementary Figure 2. Q-Q Plot of change in methylation by change in HDL cholesterol after 3 weeks of daily fenofibrate (160 mg).
Supplementary Figure 3. Q-Q Plot of change in methylation by change in LDL cholesterol after 3 weeks of daily fenofibrate (160 mg).
Supplemental Table 1. Top five CpGs for each lipid showing change in DNA methylation for change in TG, HDLc, and LDLc profiles in the GOLDN study (n = 443) after 3 weeks of daily fenofibrate (160 mg) with models additionally adjusted for alcohol, smoking and fat intake.
Supplemental Table 2. Variability in lipid response to fenofibrate explained by the methylation change variable for results presented in Table 2 in the manuscript.
Supplementary Data Sheet 1. Secondary data analysis results for 104 CpGs belonging to fenofibrate pathway genes.
References
Absher, D. M., Li, X., Waite, L. L., Gibson, A., Roberts, K., Edberg, J., et al. (2013). Genome-wide DNA methylation analysis of systemic lupus erythematosus reveals persistent hypomethylation of interferon genes and compositional changes to CD4+ T-cell populations. PLoS Genet. 9:e1003678. doi: 10.1371/journal.pgen.1003678
Aslibekyan, S., Demerath, E. W., Mendelson, M., Zhi, D., Guan, W., Liang, L., et al. (2015). Epigenome-wide study identifies novel methylation loci associated with body mass index and waist circumference. Obesity (Silver Spring) 23, 1493–1501. doi: 10.1002/oby.21111
Aslibekyan, S., Kabagambe, E. K., Irvin, M. R., Straka, R. J., Borecki, I. B., Tiwari, H. K., et al. (2012). A genome-wide association study of inflammatory biomarker changes in response to fenofibrate treatment in the Genetics of Lipid Lowering Drug and Diet Network. Pharmacogenet. Genomics 22, 191–197. doi: 10.1097/FPC.0b013e32834fdd41
Atkinson, B., and Therneau, T. (2003). The kinship package (for R). Software copyright Mayo Foundation for Medical Education and Research. Available online at: http://ftp.uni-bayreuth.de/math/statlib/R/CRAN/doc/packages/kinship.pdf
Auwerx, J., Schoonjans, K., Fruchart, J. C., and Staels, B. (1996). Transcriptional control of triglyceride metabolism: fibrates and fatty acids change the expression of the LPL and apo C-III genes by activating the nuclear receptor PPAR. Atherosclerosis 124(Suppl.), S29–S37. doi: 10.1016/0021-9150(96)05854-6
Benton, M. C., Johnstone, A., Eccles, D., Harmon, B., Hayes, M. T., Lea, R. A., et al. (2015). An analysis of DNA methylation in human adipose tissue reveals differential modification of obesity genes before and after gastric bypass and weight loss. Genome Biol. 16:8. doi: 10.1186/s13059-014-0569-x
Chen, C., Grennan, K., Badner, J., Zhang, D., Gershon, E., Jin, L., et al. (2011). Removing batch effects in analysis of expression microarray data: an evaluation of six batch adjustment methods. PLoS ONE 6:e17238. doi: 10.1371/journal.pone.0017238
Crujeiras, A. B., Campion, J., Díaz-Lagares, A., Milagro, F. I., Goyenechea, E., Abete, I., et al. (2013). Association of weight regain with specific methylation levels in the NPY and POMC promoters in leukocytes of obese men: a translational study. Regul. Pept. 186, 1–6. doi: 10.1016/j.regpep.2013.06.012
Deiuliis, J., Mihai, G., Zhang, J., Taslim, C., Varghese, J. J., Maiseyeu, A., et al. (2014). Renin-sensitive microRNAs correlate with atherosclerosis plaque progression. J. Hum. Hypertens. 28, 251–258. doi: 10.1038/jhh.2013.97
Feitosa, M. F., An, P., Ordovas, J. M., Ketkar, S., Hopkins, P. N., Straka, R. J., et al. (2011). Association of gene variants with lipid levels in response to fenofibrate is influenced by metabolic syndrome status. Atherosclerosis 215, 435–439. doi: 10.1016/j.atherosclerosis.2011.01.011
Foucher, C., Brugére, L., and Ansquer, J. C. (2010). Fenofibrate, homocysteine and renal function. Curr. Vasc. Pharmacol. 8, 589–603. doi: 10.2174/157016110792006987
Frazier-Wood, A. C., Aslibekyan, S., Absher, D. M., Hopkins, P. N., Sha, J., Tsai, M. Y., et al. (2014). Methylation at CPT1A locus is associated with lipoprotein subfraction profiles. J. Lipid Res. 55, 1324–1330. doi: 10.1194/jlr.M048504
Frazier-Wood, A. C., Ordovas, J. M., Straka, R. J., Hixson, J. E., Borecki, I. B., Tiwari, H. K., et al. (2013). The PPAR alpha gene is associated with triglyceride, low-density cholesterol and inflammation marker response to fenofibrate intervention: the GOLDN study. Pharmacogenomics J. 13, 312–317. doi: 10.1038/tpj.2012.9
Fruchart, J. C., and Duriez, P. (2006). Mode of action of fibrates in the regulation of triglyceride and HDL-cholesterol metabolism. Drugs Today (Barc). 42, 39–64. doi: 10.1358/dot.2006.42.1.963528
Hidalgo, B., Irvin, M. R., Sha, J., Zhi, D., Aslibekyan, S., Absher, D., et al. (2014). Epigenome-wide association study of fasting measures of glucose, insulin, and HOMA-IR in the genetics of lipid lowering drugs and diet network study. Diabetes 63, 801–807. doi: 10.2337/db13-1100
Hutvagner, G., and Simard, M. J. (2008). Argonaute proteins: key players in RNA silencing. Nat. Rev. Mol. Cell Biol. 9, 22–32. doi: 10.1038/nrm2321
Irvin, M. R., Zhi, D., Joehanes, R., Mendelson, M., Aslibekyan, S., Claas, S. A., et al. (2014). Epigenome-wide association study of fasting blood lipids in the Genetics of Lipid-lowering Drugs and Diet Network study. Circulation 130, 565–572. doi: 10.1161/CIRCULATIONAHA.114.009158
Jacobsen, S. C., Gillberg, L., Bork-Jensen, J., Ribel-Madsen, R., Lara, E., Calvanese, V., et al. (2014). Young men with low birthweight exhibit decreased plasticity of genome-wide muscle DNA methylation by high-fat overfeeding. Diabetologia 57, 1154–1158. doi: 10.1007/s00125-014-3198-8
Lai, C. Q., Arnett, D. K., Corella, D., Straka, R. J., Tsai, M. Y., Peacock, J. M., et al. (2007). Fenofibrate effect on triglyceride and postprandial response of apolipoprotein A5 variants: the GOLDN study. Arterioscler. Thromb. Vasc. Biol. 27, 1417–1425. doi: 10.1161/ATVBAHA.107.140103
Li, L., Chen, Y., Doan, J., Murray, J., Molkentin, J. D., and Liu, Q. (2014). Transforming growth factor beta-activated kinase 1 signaling pathway critically regulates myocardial survival and remodeling. Circulation 130, 2162–2172. doi: 10.1161/CIRCULATIONAHA.114.011195
Liu, S., Nheu, T., Luwor, R., Nicholson, S. E., and Zhu, H. J. (2015). SPSB1, a novel negative regulator of the transforming growth factor-beta signaling pathway targeting the type II receptor. J. Biol. Chem. 290, 17894–17908. doi: 10.1074/jbc.M114.607184
Liu, Y., Ordovas, J. M., Gao, G., Province, M., Straka, R. J., Tsai, M. Y., et al. (2008). The SCARB1 gene is associated with lipid response to dietary and pharmacological interventions. J. Hum. Genet. 53, 709–717. doi: 10.1007/s10038-008-0302-2
Martín-Núñez, G. M., Cabrera-Mulero, R., Rubio-Martín, E., Rojo-Martínez, G., Olveira, G., Valdés, S., et al. (2014). Methylation levels of the SCD1 gene promoter and LINE-1 repeat region are associated with weight change: an intervention study. Mol. Nutr. Food Res. 58, 1528–1536. doi: 10.1002/mnfr.201400079
Milenkovic, D., Vanden Berghe, W., Boby, C., Leroux, C., Declerck, K., Szarc Vel Szic, K., et al. (2014). Dietary flavanols modulate the transcription of genes associated with cardiovascular pathology without changes in their DNA methylation state. PLoS ONE 9:e95527. doi: 10.1371/journal.pone.0095527
Rönn, T., Volkov, P., Davegårdh, C., Dayeh, T., Hall, E., Olsson, A. H., et al. (2013). A six months exercise intervention influences the genome-wide DNA methylation pattern in human adipose tissue. PLoS Genet. 9:e1003572. doi: 10.1371/journal.pgen.1003572
Schoonjans, K., Staels, B., and Auwerx, J. (1996). The peroxisome proliferator activated receptors (PPARS) and their effects on lipid metabolism and adipocyte differentiation. Biochim. Biophys. Acta 1302, 93–109. doi: 10.1016/0005-2760(96)00066-5
Smith, C. E., Arnett, D. K., Tsai, M. Y., Lai, C. Q., Parnell, L. D., Shen, J., et al. (2009). Physical inactivity interacts with an endothelial lipase polymorphism to modulate high density lipoprotein cholesterol in the GOLDN study. Atherosclerosis 206, 500–504. doi: 10.1016/j.atherosclerosis.2009.03.012
Staels, B., Dallongeville, J., Auwerx, J., Schoonjans, K., Leitersdorf, E., and Fruchart, J. C. (1998). Mechanism of action of fibrates on lipid and lipoprotein metabolism. Circulation 98, 2088–2093. doi: 10.1161/01.CIR.98.19.2088
Staels, B., Schoonjans, K., Fruchart, J. C., and Auwerx, J. (1997). The effects of fibrates and thiazolidinediones on plasma triglyceride metabolism are mediated by distinct peroxisome proliferator activated receptors (PPARs). Biochimie 79, 95–99. doi: 10.1016/S0300-9084(97)81497-6
Su, J., Li, X., Yu, Q., Liu, Y., Wang, Y., Song, H., et al. (2014). Association of P2Y12 gene promoter DNA methylation with the risk of clopidogrel resistance in coronary artery disease patients. Biomed Res. Int. 2014:450814. doi: 10.1155/2014/450814
Tsai, M. Y., Ordovas, J. M., Li, N., Straka, R. J., Hanson, N. Q., Arends, V. L., et al. (2010). Effect of fenofibrate therapy and ABCA1 polymorphisms on high-density lipoprotein subclasses in the Genetics of Lipid Lowering Drugs and Diet Network. Mol. Genet. Metab. 100, 118–122. doi: 10.1016/j.ymgme.2010.03.001
van der Hoogt, C. C., de Haan, W., Westerterp, M., Hoekstra, M., Dallinga-Thie, G. M., Romijn, J. A., et al. (2007). Fenofibrate increases HDL-cholesterol by reducing cholesteryl ester transfer protein expression. J. Lipid Res. 48, 1763–1771. doi: 10.1194/jlr.M700108-JLR200
Wojczynski, M. K., Gao, G., Borecki, I., Hopkins, P. N., Parnell, L., Lai, C. Q., et al. (2010). Apolipoprotein B genetic variants modify the response to fenofibrate: a GOLDN study. J. Lipid Res. 51, 3316–3323. doi: 10.1194/jlr.P001834
Keywords: fenofibrate, lipid lowering drug, epigenetic changes, DNA methylation, dyslipidemia, cardiovascular disease
Citation: Das M, Irvin MR, Sha J, Aslibekyan S, Hidalgo B, Perry RT, Zhi D, Tiwari HK, Absher D, Ordovas JM and Arnett DK (2015) Lipid changes due to fenofibrate treatment are not associated with changes in DNA methylation patterns in the GOLDN study. Front. Genet. 6:304. doi: 10.3389/fgene.2015.00304
Received: 30 June 2015; Accepted: 12 September 2015;
Published: 29 September 2015.
Edited by:
Valeria Cristina Sandrim, Universidade Estadual Paulista, BrazilReviewed by:
Maria J. Prata, Instituto de Patologia e Imunologia Molecular da Universidade do Porto, PortugalJohn Frederick Pearson, University of Otago Christchurch, New Zealand
Copyright © 2015 Das, Irvin, Sha, Aslibekyan, Hidalgo, Perry, Zhi, Tiwari, Absher, Ordovas and Arnett. This is an open-access article distributed under the terms of the Creative Commons Attribution License (CC BY). The use, distribution or reproduction in other forums is permitted, provided the original author(s) or licensor are credited and that the original publication in this journal is cited, in accordance with accepted academic practice. No use, distribution or reproduction is permitted which does not comply with these terms.
*Correspondence: Donna K. Arnett, Department of Epidemiology, University of Alabama at Birmingham, Ryals Public Health Building, 1530 3rd Avenue South, Birmingham, AL 35294, USA, arnett@uab.edu