 Qi Zhao
 Yue Zhang1
 Hongsheng Liu
- 1School of Mathematics, Liaoning University, Shenyang, China
- 2Research Center for Computer Simulating and Information Processing of Bio-Macromolecules of Liaoning Province, Shenyang, China
- 3School of Life Science, Liaoning University, Shenyang, China
- 4School of Information, Liaoning University, Shenyang, China
- 5School of Computer, Wuhan University, Wuhan, China
- 6Engineering Laboratory for Molecular Simulation and Designing of Drug Molecules of Liaoning, Shenyang, China
Long non-coding RNA (lncRNA) plays an important role in many important biological processes and has attracted widespread attention. Although the precise functions and mechanisms for most lncRNAs are still unknown, we are certain that lncRNAs usually perform their functions by interacting with the corresponding RNA- binding proteins. For example, lncRNA-protein interactions play an important role in post transcriptional gene regulation, such as splicing, translation, signaling, and advances in complex diseases. However, experimental verification of lncRNA-protein interactions prediction is time-consuming and laborious. In this work, we propose a computational method, named IRWNRLPI, to find the potential associations between lncRNAs and proteins. IRWNRLPI integrates two algorithms, random walk and neighborhood regularized logistic matrix factorization, which can optimize a lot more than using an algorithm alone. Moreover, the method is semi-supervised and does not require negative samples. Based on the leave-one-out cross validation, we obtain the AUC of 0.9150 and the AUPR of 0.7138, demonstrating its reliable performance. In addition, by means of case study in the “Mus musculus,” many lncRNA-protein interactions which are predicted by our method can be successfully confirmed by experiments. This suggests that IRWNRLPI will be a useful bioinformatics resource in biomedical research.
Introduction
A great quantity of studies has indicated that more than 90% of DNA is transcribed into RNA in human organism, the vast majority of which are non-coding RNA. Non-coding RNA (ncRNA) is a RNA that does not encode a protein, and plays a very broad regulatory role in many organisms' life activities. Abundant and functionally important types of non-coding RNAs include transfer RNA (tRNA) and ribosomal RNA (rRNA), and small RNAs such as microRNAs, siRNAs, piRNAs, snoRNAs, snRNAs, exRNAs, scaRNAs, and the long non-coding RNAs. Long non-coding RNA (lncRNA) refers to ncRNA longer than 200 nucleotides. LncRNA was originally considered a “noise” of genomic transcription, a byproduct of RNA polymerase II transcription, without biological function. But recent studies indicate lncRNA involves in a variety of important regulatory procedures, such as chromatin modification (Guttman et al., 2009), cell differentiation and proliferation (Wapinski and Chang, 2011), RNA progressing (Wilusz et al., 2009), and cellular apoptosis (Yu et al., 2015) and so on. These lncRNA regulation effects begin to attract widespread attention from the abnormal convey of biological cell genes. In addition, more and more experiments demonstrate that lncRNAs involve in the regulation of a variety of physiological and pathological processes, as well as the development processes of a variety of diseases including tumors (Wilusz et al., 2009; Harries, 2012; Chen and Yan, 2013; Morlando et al., 2014; Chen et al., 2015, 2016c, 2017d, 2018a,b; Yu et al., 2015; Chen and Huang, 2017b; Li et al., 2017; You et al., 2017). For instance, Gupta et al. issued an increase in the expression of lncRNA HOTAIR in primary breast tumors (Gupta et al., 2010). Along with the growth of bioinformatics, many lncRNAs have been discovered, some of which have been studied or are being studied. However, the functionality of most lncRNAs remains unknown. Usually, most lncRNAs exert their function through the interaction with the corresponding RNA-binding proteins. Although we have succeeded in identifying some RNA-binding proteins in the human genome and this number is growing steadily (Cook et al., 2011; Ray et al., 2013), we are not fully aware of the association between lncRNA and protein and its function in the post-transcriptional regulating network (Mittal et al., 2009; Kishore et al., 2010). Moreover, the experimental identification of lncRNA-protein associations is time-consuming, laborious and costly, so it is necessary to develop effective computational prediction methods.
At present, computational models have been broadly utilized in bioinformatics such as lncRNA-disease interactions prediction (Zeng et al., 2015; Chen et al., 2016b,d,e, 2017c,d; Huang et al., 2016; Li et al., 2016; Liu et al., 2016; Zhao et al., 2016a; Zou et al., 2016; Zhang et al., 2017a,b; Hu et al., 2018; Tang et al., 2018). However, only a few models can be used to forecast lncRNA-protein associations. For example, Bellucci et al. (2011) proposed catRAPID, which encoded the lncRNA-protein as a characteristic vector, and combined two value structures between lncRNA and protein forces, hydrogen bonding and Fan Dehua force. Later, Muppirala et al. (Muppirala et al., 2011) developed RPISeq, which utilized merely lncRNA and protein sequences, and used support vector machine (SVM) classifier (Hearst, 1998) and random forest (RF) (Liaw and Wiener, 2002) to predict the interactions between lncRNAs and proteins. Wang et al. presented a model, it utilized the same dataset of a paper by Muppirala et al. and similar data characteristics. Its theoretical basis was Naive Bias (NB) and Extended NB (ENB) classifier. In 2015, Suresh et al. proposed RPI-Pred (Suresh et al., 2015), a method on account of SVM, the sequences and structures of lncRNAs and proteins, and the high-order 3D structure characteristics of proteins are used in this method. In the same year, a method based on heterogeneous networks, called LPIHN, was proposed by Li et al. (2015). They predicted new lncRNA-protein associations by implementing a random walk with restart (RWR) on a constructed heterogeneous network. In a recent study, Ge et al. (2016) introduced a network bisection approach, named LPBNI. They carried out the resource allocation procedure in the lncRNA-protein dichotomous network to evaluate candidate proteins for each lncRNA to achieve the goal of predicting the absence of the interaction. Lately, Hu et al. (2017) advanced a semi-supervised method called LPI-ETSLP that revealed the lncRNA-protein associations. In particular, LPI-ETSLP did not require negative samples.
There are several problems with these methods, as follows: (1) Most of the models mentioned above don't use lncRNA-protein interactions data, but are trained using RNA-protein interactions data. This leads to a limitation on the ability to forecast the lncRNA-protein associations. (2) Some of the models utilize the NPInter (Yuan et al., 2014; Hao et al., 2016) database to predict the interactions between lncRNAs and proteins. Although NPInter is by far the best lncRNA-protein database, it only provides lncRNA's gene-protein interactions entries, and dose not directly provide the entries of lncRNA-protein interactions. If these models are directly investigated using lncRNA's gene-protein interactions, it will certainly affect the prediction results. (3) Finally, although the current researches and understanding of lncRNA-protein interactions are increasing, there isn't enough negative samples data yet, and it is hard to choose lncRNA and protein features. In order to solve these problems, we integrate the two methods of random walk and neighborhood regularized logistic matrix factorization to develop a new model called IRWNRLPI. The model utilizes known lncRNA-protein associations, protein similarity network and lncRNA similarity network to forecast possible lncRNA-protein associations. And unlike the traditional machine learning methods, IRWNRLPI uses semi-supervised learning to derive unknown information primarily through known associations and their similarities, so it does not need negative samples. In addition, our model provides a high level of importance for the nearest neighbors, thus avoiding noise information. We implement leave-one-out cross validation (LOOCV) on IRWNRLPI to evaluate its performance, resulting in the AUC of 0.9150, which indicates that the model has reliable performance. And the AUPR value of 0.7138 demonstrates the reliability of our model. Moreover, in the case study, we predict the lncRNA-protein associations of “Mus musculus” in view of the predicted score level, demonstrating that our method is generally effective.
Materials and Methods
Dataset
Along with the development of bioinformatics, there are a number of public databases available for scientists to study lncRNA-protein interactions. The database NPInter includes experimental verification interactions between non-coding RNAs and other biomolecules (proteins, RNA and genomic DNA). NONCODE (Xie et al., 2014; Zhao et al., 2016b), a comprehensive annotation database, covers all types of non-coding RNA (not including tRNA and rRNA). And the database Uniprot (Consortium, 2015; Pundir et al., 2016) can provide us with protein sequences. With these databases, we can acquire the datasets we need for lncRNAs and proteins, which will help us to carry out our research better.
According to NPInter V2.0, we chiefly extract species for human lncRNA relevant items. We obtain 4870 items which are experimentally identified lncRNA-protein associations, covering 1114 lncRNAs and 96 proteins. From NONCODE 4.0, we can obtain lncRNA sequence information. From Uniprot, we can get the protein sequence information. Further, we remove proteins and lncRNAs that can't obtain sequences information. Besides, we delete those lncRNAs associated with only one protein, and those proteins that are associated with only one lncRNA. These data are low-similarity pairs and potential noise. Removing these data helps improve the performance of the model. Finally, we construct a dataset containing 4158 lncRNA-protein correlations, including 990 lncRNAs and 27 proteins.
LncRNA-Protein Interaction Matrix
To facilitate the description of lncRNA-protein interactions and the algorithmic model, matrix Y is denoted as the adjacency matrix of lncRNA-protein interactions, if lncRNA l(i) is connected with the protein p(j), Y(l(i), p(j)) is 1, otherwise 0. According to sequence similarity matrix, the interactions between lncRNAs and proteins are measured. We screen the lncRNAs and proteins sequences which are inferior quality or cannot find their corresponding proteins and lncRNAs. The inferior quality refers to incomplete sequence information and repeated lncRNA and protein sequences. Finally, 4158 high quality lncRNA-protein associations are obtained.
LncRNA Sequence Similarity Matrix
In our work, we calculate the similarity of the lncRNA sequence according to the lncRNA sequence information. These lncRNAs sequences information is acquired from the NONCODE 4.0 database. As a result of filtering, we gain 990 credible lncRNAs sequences. The regularized Smith-Waterman algorithm (Pearson, 1991) is used to compute lncRNAs sequence similarity. Thus, the lncRNA sequence similarity matrix LS is built, where the empty LS(l(i), l(j)) indicates the sequence similarity between lncRNA l(i) and l(j). LS is normalized as below:
Where sw(l(i), l(j)) is the sequence similarity between lncRNA l(i) and l(j) calculated according to the Smith-Waterman algorithm.
Protein Sequence Similarity Matrix
We screen 27 dependable protein sequences on the basis of the lncRNA-protein network, they come from Uniprot (Consortium, 2015; Pundir et al., 2016) entirely. Similarly, protein sequence similarity can also be calculated by utilizing a regularized Smith-Waterman algorithm. Then, we can construct a protein sequence similarity matrix PS, in which the entity PS(p(i), p(j)) expresses the sequence similarity between protein p(i) and p(j). The PS is normalized as below:
Where sw(p(i), p(j)) is the sequence similarity between protein p(i) and p(j) calculated according to the Smith-Waterman algorithm.
Work Flow
The workflow of our IRWNRLPI model is given in Figure 1. The procedure for predicting the lncRNA-protein interactions consists of four steps. (1) Firstly, abstract gene-protein pairs information in NPInter v2.0, and we can obtain the interaction matrix between lncRNAs and proteins. (2) The second step is to extract lncRNA sequences and protein sequences from NONCODE and UniProt on account of gene-protein pairs, separately. (3) Next, we screen and remove the lncRNAs in NONCODE that fail to discovery the relevant information, as well as the protein in Uniprot that cannot seek out the corresponding information. Then, we employ the regularized Smith-Waterman algorithm to compute the similarity of lncRNA sequences and protein sequences, respectively, and generate corresponding lncRNA and protein similarity matrix. (4) Last, we will apply the three matrixes obtained above to random walk algorithm and neighborhood regularized logistic matrix factorization algorithm, respectively, to gain a potential lncRNA-protein interactions score matrix, and then enter these two score matrixes to IRWNRLPI integration model. Eventually, we gain final lncRNA-protein associations score matrix. The above is the whole prediction process to obtain new lncRNA-protein associations.
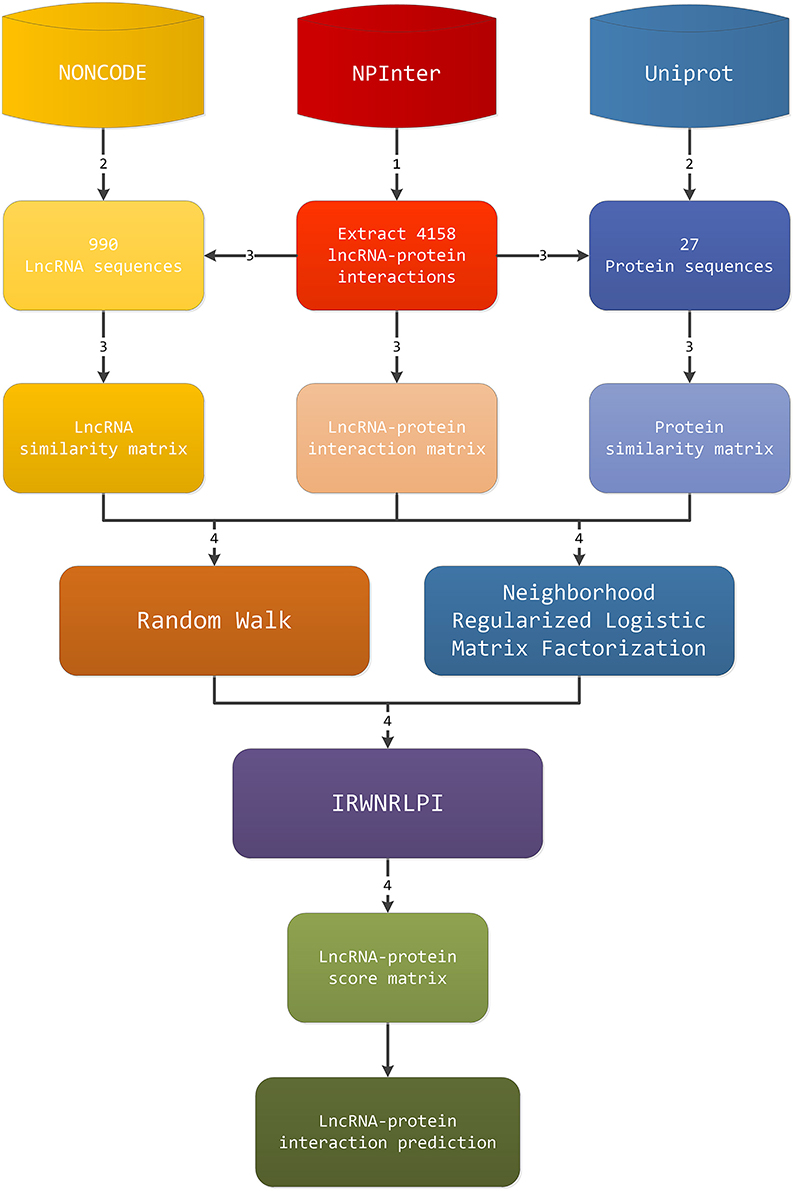
Figure 1. The work flow of the IRWNRLPI model.
IRWNRLPI
The flowchart of this section is given in the Figure 2. The upper two parts in Figure 2 are the main flow of the random walk method and the neighborhood regularized logistic matrix factorization method, respectively. The left box is the four steps of random walk, and the lncRNA-protein score matrix SR is finally obtained. The right box is the process of adjacency regularization, and finally the lncRNA-protein score matrix SN is obtained. The bottom of Figure 2 is the process of obtaining the final lncRNA-protein score matrix S by integrating the above two methods.
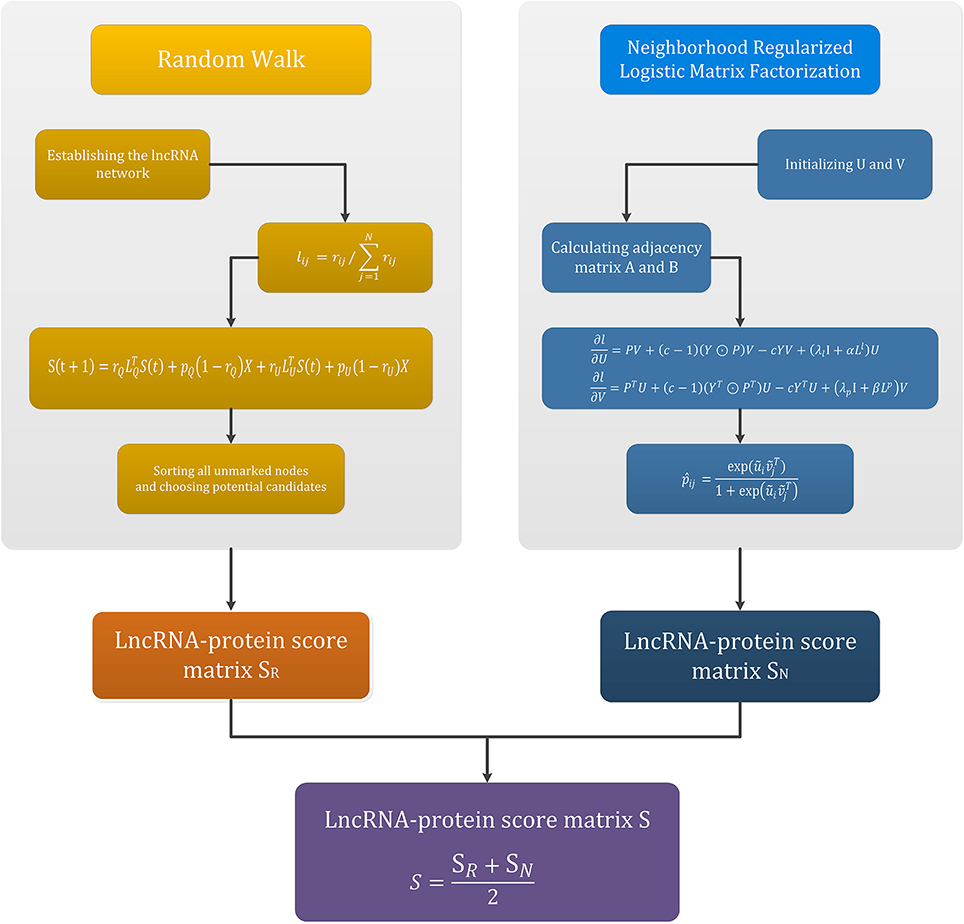
Figure 2. The process of constructing the integrating model.
Random Walk
In random walk model, given a protein p, the process of predicting the lncRNAs associated with p is modeled as a random walk on the weighted graph G. The process can be roughly divided into four steps.
In the first step, the lncRNA network is established based on the sequence similarity between lncRNAs. For a given protein p, the known lncRNAs associated with p and the candidate lncRNAs associated with p and their relations form a network, expressed as a weighted graph G (V, E, W). Each vertex (v ∈ V) represents the lncRNA or candidate lncRNA associated with p. Each edge (e ∈ E) denotes the relationship between the two vertices connected by edge e. We denote sequence similarity between vx and vy as Sim (vx, vy), and the weight w of edge e is Sim (vx, vy). The greater the w, the more likely that the two vertices are correlated with a set of similar proteins. In this network, the known lncRNA associated with p is called a labeled node. The remaining lncRNAs have so far, no evidence that they are related to p, which are unlabeled nodes.
In the second step, constructing the correlation matrix R to establish two one-step transition matrices LQ and LU. First of all, we construct the correlation matrix R. For vi, we evaluate the extent of relevance between neighbors vj and p, which is denoted by rij. Firstly, suppose that the set of all the labeled nodes is denoted as Q, vi ∈ Q. If vi is relevant to protein p, its neighbors may also be relevant to p. In addition, when vi is a labled node, the association probability is greater than the association probability when vi is an unlabeled node. Thus, the former and the latter are multiplied by wQ ∈ (0,1) and wU ∈ (0,1) separately. Evidently, wQ is higher than wU. Secondly, suppose U is the set of all unmarked nodes, which may be associated with lncRNAs, and vi ∈ U. If vi is related to p, its neighbors may also be associated with p. The weight of the associated information from the unmarked node is wU. Thirdly, if the two lncRNAs are not connected, such as vi and vj, rij is set to 0. Finally, an lncRNA to a value of itself is set to 0.
R (rij) M×M is constructed on the basis of the above rules, rij is formally defined as follows:
In which vi is the vertex and vj is one of its neighbors.
Then, we construct the transfer matrix L (lij) M×M. We proportionate the transfer probability lij to rij. The matrix R is normalized by the next type, and the one step transfer probability array L (lij) M×M is obtained:
lij indicates the transition possibility from vi to vj. Nevertheless, after the row of R is normalized, the weights (wQ and wU) for distinguishing between the labeled node and the unlabeled node associated information are lost, thus ignoring the effect of the previous information about whether the vertex is relevant to p. In order to settle the difficulty, we divide the matrix L into two arrays of LQ and LU. LQ expresses the transformation array of the marked node, and LU indicates the transfer matrix of the unmarked node. All lines of the marked (unmarked) node in LQ (LU) are in accordance with the relevant rows in L, the rest of rows of LQ (LU) are set to 0.
In the third step, a new forecast method on account of random walk is established to evaluate the correlation scores between each unmarked node and p, that is, estimate the correlation score of the candidate lncRNAs. In view of the transfer matrix LQ and LU, the prediction method is further established as below:
First, S(t + 1) represents a probability vector, indicating the probability that the walker reaches the ith vertex at time t + 1 is Si(t+1). The walker begins with the marked node, the components in S(0) represent the original probability, which means the walker begins at the same probability at time 0 from a marked node. And Si(0) calculates according to the following formula:
Second, to use priori information, we assign weights rQ and rU (0 < rQ, rU < 1, rQ > rU) to the labeled node and the unlabeled node, respectively. In fact, rQ and rU replace the ignored function of wQ and wU. Finally, when the walker finds a marked node, at time t+1 it will go back the initial vertex (marked node) at probability pQ(1-rQ) and start walking again. The probability total of the walkers arriving at each marked node at time t is expressed as pQ. The formula is as follows:
Likewise, when the walker finds an unmarked node, at the next time it will return to the beginning vertex with possibility pU(1-rU). The probability total of the walkers arriving at each unmarked node at time t is expressed as pU, it is equal to 1-pQ. X defines the nodes at which the walker returns and restarts. Since walker begins with a marked node, X is equal to S(0).
The fourth step is to sort all unmarked nodes and choose potential candidates. The walker begins with the marked node and starts iterating. When the iteration satisfies the condition of convergence, the iteration procedure suspends. The convergence condition is L1-norm between S(t) and S(t + 1) less than 10−10. The definition of the correlation fraction of unmarked nodes is the steady state probability of the pedestrians staying at that vertex. In this way, all unmarked nodes get a correlation score, and we sort them according to their fractions. The greater the fraction, the more likely that the unlabeled node is associated with the given protein p. The score matrix obtain by this part is denoted by SR, in which SR(l(i), p(j)) is the possibility of association between lncRNA l(i) and protein p(j).
Neighborhood Regularized Logistic Matrix Factorization
Here we explain the neighborhood regularized logistic matrix factorization method. First, lncRNAs and proteins are mapped to shared potential spaces with dimension r, and r < < min (m, n). and represents the characters of lncRNA li and protein pj, separately. The following formula is used to calculate the probability of association pij of the lncRNA-protein pair (li, pj):
In order to simplify, we utilize U ∈ ℝm×r and V ∈ ℝn×r to represent the set of potential vectors for all lncRNAs and all proteins.
In order to make our modeling more efficient and more accurate for lncRNA-protein interactions prediction, we recommend giving positive samples a higher level of importance than negative samples (Johnson, 2014; Liu et al., 2014), the weight of the positive sample given above is c, the weight of the negative sample is 1.
Suppose all samples are trained independently, and the probability as follows:
Note that when yij = 1, c(1−yij) = 1−yij, when yij = 0, cyij = yij. So, we rewrite the formula (7) as follows:
In addition, we will carry out zero mean spherical Gaussian priori on the potential vector of lncRNA and protein:
Among them, and are to regulate the variance of the Gaussian distribution, I is the unitary array. So, through Bayesian inference, we have:
Thus, the posterior distribution logarithm is as below:
Where C is an absolute term. Maximizing the posterior distribution is same as minimizing the below object functions:
Where, and and ||•||F show the Frobenius norm of the array. Alternating gradient descent method (Johnson, 2014) can resolve the difficulty in Equation (12).
By mapping lncRNAs and proteins to shared potential space, the logistic matrix factorization method can effectually evaluate the monolithic structure of lncRNA-protein interactions information. In addition, we use lncRNAs and proteins neighbors to further advance the forecast veracity. For lncRNA li, we denote the nearest neighbor set with N(li) ∈ L\li, where N(li) makes up selecting the K1 most similar lncRNAs of li. After that, we structure the set N(pj) ∈ P\pj, which is made up of the K1 most similar proteins of pj. In the experiment, we set K1 to 5 according to experience.
Here, the lncRNA neighborhood information can be represented by the adjacency array A, and aiμ is defined as below:
The protein neighborhood information is described by the adjacency matrix B, and bjv is defined as below:
It should be noted that matrix A and B are asymmetric.
The main idea of predicting lncRNA-protein interactions with lncRNAs neighborhoods information is to minimize the distance between li and its nearest neighbor N(li) in the potential space, which can be gained by minimizing the below object functions:
Among them, tr(•) is matrix trace, . Dl and are two diagonal arrays, where diagonal elements are and separately. We also minimize the following objective functions to use the neighborhood information of the protein for lncRNA-protein interactions prediction:
Wherein, and are two diagonal arrays, where diagonal elements are and respectively.
By taking into account lncRNA-protein associations and lncRNAs and proteins K1 the nearest neighborhoods, the final prediction model can be derived. By substituting Equations (15, 16) into Equation (12), the resulting model is as follows:
An alternating gradient rise process can resolve the optimization problem in Equation (17), which is represented as L, the gradient relative to U and V as below:
P ∈ Rm×n, and pij (see Equation 1) represents the Hadamard product of the two arrays. In order to quicken the constriction of the gradient decline optimization method, we utilize the AdaGrad algorithm to adaptively select the grad step length.
If potential carriers U and V are known, the association probability of any unknown lncRNA-protein pair (li, pj) can be forecasted by formula (6). The negative dataset L− and P− of lncRNAs and proteins might influence on lncRNA−protein interactions. The set of K2 nearest neighbors in L+ and P+ are denoted as N+(li) and N+(pj) for lncRNA and protein . N+(li) and N+(pj) are structured utilizing the same standard as utilized to structure neighborhoods during the training procedure. Then, the interaction probability between lncRNA ui and protein vj is modified to:
where
Note that Equation (21) shows a general case of smooth learning lncRNA specificity and target-specific potential carriers. In our experiment, K2 is set to 5 based on experience. The score matrix obtained by this part is denoted by SN, and SN(l(i), p(j)) is the possibility of association between lncRNA l(i) and protein p(j).
Integrating Model
At last, to avoid the unsatisfactory result of using one of the two methods alone, we adopt an integration strategy and propose the integration model IRWNRLPI. Here we combine the two algorithms of random walk and neighborhood regularized logistic matrix factorization, and obtain a desired result. The specific approach is that we use these two algorithms obtain two score matrix SR and SN, and then take the average. The final fraction array is denoted as S, and S(l(i), p(j)) is the possibility of association between lncRNA l(i) and protein p(j). The formula is as follows:
Results
Performance Evaluation
In this work, to measure the capability of our IRWNRLP model, we perform LOOCV on lncRNA-protein interactions that have been experimentally verified. In the LOOCV experiment, it is assumed that a total of N samples, one of them is selected as a test sample, and the rest of the samples are selected as training samples. So, we result in N classifiers, N test results, and we will utilize the average of the N results to evaluate the capability of our method. Use the LOOCV to obtain the receiver operator characteristics (ROC) curve and calculate the area under ROC curve (AUC). AUC is an important popular metric for evaluating the classification model. If AUC = 1, IRWNRLPI has perfect performance; if AUC = 0.5, it represents random performance. There is also a popular indicator the area under prediction recall curve (AUPR), it is more adaptive for category unbalanced datasets because it penalizes false positives more in the assessment. Because of the presence of massive unknown labeled data in the dataset, AUPR is used to lessen the impact of misinformation for false positives on the function of the prediction model. The larger the value of AUPR, the better the capability of the method.
For adequately examining the capability of the method, we introduce the following indicators to evaluate our method: ACC (overall accuracy), SEN (sensibility), PRE (precision), and F1 (F1-scores), these indices are extensively utilized in bioinformatics, remarked as (Chen et al., 2016a, 2017a):
Where TP represents true positive, TN is true negative, FP is false positive, FN is false negative. ACC is the index of systematic error, up to 100% of ACC indicates that the prediction is perfect, and in the random prediction ACC can only get 50%. Other metrics in the binary classification can also measure the capability of the method. PRE indicates the quantity of true positive predictions in the positive prediction, and SEN is also called recall, indicating the positive predictions amount of the positive samples that are properly forecasted. Considering the accuracy and sensibility of the test, the fractional value obtained by calculating the F1-score (F-score or F degree measure) can reflect if the classification model is robust. F1 is 1 for perfect method, while the worst model of F1 is 0.
Comparison With Other Methods on NPInter V2.0
In this part, we compare IRWNRLPI with other four models on NPInter v2.0, which are LPI-ETSLP, RWR, LPBNI, and RPISeq. Among them, RPISeq is compared with IRWNRLPI as an example of the machine learning model, in view of RF and SVM classifiers. The other three methods, LPI-ETSLP, RWR, and LPBNI, forecast potential correlations with IRWNRLPI using identical type of lncRNA and protein sequences information. The results of IRWNRLPI and the other four models are displayed in Figure 3 and Table 1, and indicate that IRWNRLPI is more ideal than the others by comparison.
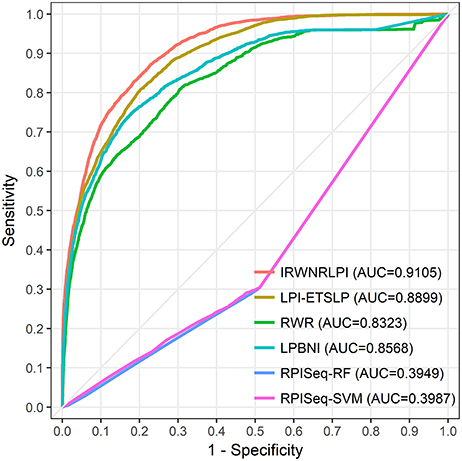
Figure 3. The ROC curves of IRWNRLPI, LPI-ETSLP, RWR, LPBNI, RPISeq-RF, and RPISeq-SVM are expressed in red, brown, green, blue, purple and pink, respectively. The light gray line represents the ROC curve of the interaction between IRWNRLPI and the randomized lncRNA-protein pairs.
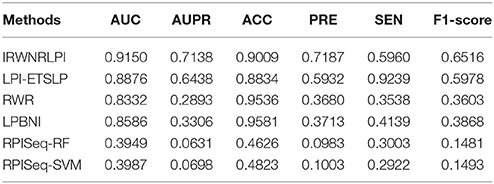
Table 1. Comparison of IRWNRLPI with LPI-ETSLP, RWR, LPBNI, and RPISeq models.
We perform all of these models on the same dataset, and implement LOOCV experiments to compare their performance. As shown in Figure 3, our IRWNRLPI method has a AUC value of 0.9150, well above 0.5 (random), indicating that this model is feasible to predict lncRNA-protein associations. And we can see that the AUC of IRWNRLPI is higher than those of LPI-ETSLP (0.8876), RWR (0.8332), LPBNI (0.8586), RPISeq-RF (0.3949), and RPISeq-SVM (0.3987). Obviously, RPISeq is much worse than other models, even less than 0.5 (random). There are two reasons for this result: First, RPISeq is a machine learning method and depends on data, and our model does not have negative sample set; Second, RPISeq utilizes RNA-protein associations to train rather than lncRNA-protein associations, whereas the biological function of lncRNA differs from the biological function of common RNA, thus affecting the final outcome. In contrast, IRWNRLPI can avoid the problem of feature selection, thereby avoiding reliance on negative sample datasets.
From the indicators in Table 1, we can see that the prediction ability of IRWNRLPI is obviously superior to the other four methods. First, we compare the values of AUPR, which are 0.6438 (LPI-ETSLP), 0.2893 (RWR), 0.3306 (LPBNI), 0.0631 (RPISeq-RF), and 0.0698 (RPISeq-SVM) respectively. The above values are lower than 0.7138 (IRWNRLPI), indicating that the prediction result of IRWNRLPI is more dependable. Next, we further analyze the ACC, PRE, SEN, and F1-score of these models. As we can see the ACC of IRWNRLPI is less than RWR and LPBNI, owing that IRWNRLPI predicts potential lncRNA-protein associations based on known lncRNA-protein correlations, but for now, experimentally verified lncRNA-protein interactions are still less. Consequently, it is not difficult to forecast, with the lncRNA-protein associations data continuing increasing, IRWNRLPI prediction accuracy will greatly improve. In addition, it is more reasonable for this unbalanced dataset to evaluate the F1-score than using the ACC evaluation. From Table 1, it is easy to find, the F1-score of IRWNRLPI is higher than those of other methods, especially RWR and LPBNI. Our IRWNRLPI results show prediction accuracy (PRE) of 0.7187, which is approximately 21, 95, and 94% higher than LPI-ETSLP, RWR and LPBNI, separately, much higher than RPISeq-RF and RPISeq-SVM results. The sensibility (SEN) is 0.5960, it is 68, 44, 98, and 104% higher than RWR, LPBNI, RPISeq-RF, and RPISeq-SVM, separately. This results further demonstrate that IRWNRLPI performs better in forecasting lncRNA-protein associations.
Case Study
To evaluate the capability of the prediction method more comprehensively, we use IRWNRLPI to forecast potential lncRNA-protein interactions in view of the known associations of “Mus musculus” in the NPInter v3.0 dataset. The top 10 lncRNA-protein interactions are displayed in Table 2, and finally the data is centrally checked and fully verified in the “Mus musculus”. Moreover, we describe their ranking of in other methods, and it is not difficult to see from Table 2 that some of them do not get a high rank in the prediction of other models, which can lead that some new discoveries may be neglected by corresponding models. On the contrary, our model can find and confirm the interactions of these lncRNAs with proteins, and the corresponding genes are displayed in Table 2. The loss function of massive lncRNAs expressed in mouse embryonic cells is studied to show the influence on gene expression. Studies have indicated lncRNA regulates the impact of tumor cells on blood vessels, which can affect the mechanism of tumorous growth. In our forecast outcomes, NONMMUG002214-Q13185, NONMMUG013483-A2AC19 and NONMMUG015351-Q88974 are forecasted to have associations in the top 10 results of these methods, which are studied by Guttman et al. (2009). In terms of outcomes, IRWNRLPI is obviously superior in forecasting potential lncRNA-protein associations to other methods.
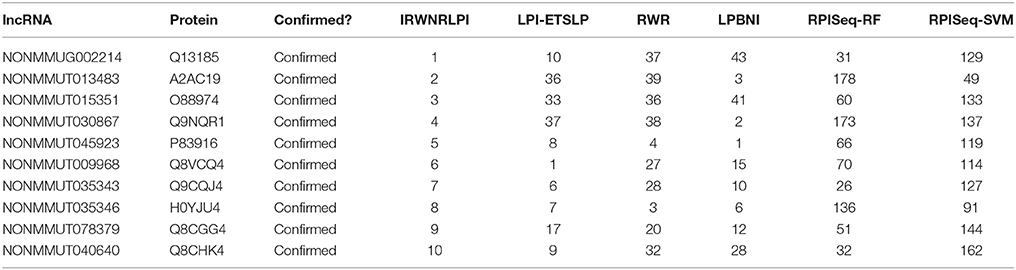
Table 2. Top 10 novel interactions predicted by IRWNRLPI and their ranks in the prediction of other methods.
Discussion
LncRNA involves a variety of important cellular regulatory processes and many disease progression processes, particularly in the development of various cancers. In general, most lncRNAs play their function by interacting with the corresponding RNA-binding proteins. Therefore, predicting the new lncRNA-protein associations is conducive to the research of lncRNA. Nevertheless, lncRNA-protein interactions experiments will cost a lot of materials, human and financial resources. Therefore, the utilization of computational methods to forecast lncRNA-protein associations arouses widespread concern. In our work, to obtain better prediction results, we introduce the idea of integrating algorithm and present the IRWNRLPI method, which integrates two prediction methods, random walk and neighborhood regularized logistic matrix factorization, to forecast lncRNA-protein interactions. IRWNRLPI bases only on experimentally validated lncRNA-protein associations, which avoids dependence on negative sample datasets. We conduct a more comprehensive evaluation of IRWNRLPI, test our model in the NPInter v2.0 dataset, and compare it with other four methods. In the LOOCV experiment, the AUC value of IRWNRLPI is 0.9150, indicating that IRWNRLPI performs well in the forecast of lncRNA-protein correlations. And IRWNRLPI obtains the AUPR value of 0.7138, which states clearly the responsibility of this method. In addition, we use the “Mus musculus” dataset as a case study to test IRWNRLPI and investigate the practical capability of this method in forecasting unknown lncRNA-protein associations. Case study shows that IRWNRLPI is able to forecast other new lncRNA-protein interactions. With the continuous progress of science and technology, more and more lncRNA-protein interactions will be found, and then the accuracy of IRWNRLPI prediction will also increase. In conclusion, IRWNRLPI is an efficient model of predicting potential lncRNA-protein associations, and we also hope that IRWNRLPI can be used in a wider range of studies.
The excellent and reliable predictive performance of IRWNRLPI is mainly attributable to the following factors. Firstly, unlike the traditional machine learning methods, IRWNRLPI uses semi-supervised learning to derive unknown information primarily through known associations and their similarities, so it does not need negative samples. Secondly, our model provides a high level of importance for the nearest neighbors, thus avoiding noise information. Thirdly, IRWNRLPI is a model based on an integrated idea, and the integration model gets better results than a single model.
Of course, IRWNRLPI also needs to be improved for the following reasons. First of all, the proposed model relies heavily on the known correlation data, but the number of current known lncRNA-protein associations is still very limited. As the number of experimentally validated associations increasing in future, the prediction accuracy of our method will improve. Furthermore, when the training sample changes, the prediction effect will be unstable. In addition, further consideration should be given on how to choose the value of the model parameters more properly.
Author Contributions
QZ and HL conceived the project, developed the prediction method, designed and implemented the experiments, analyzed the result, and wrote the paper. YZ implemented the experiments, analyzed the result, and wrote the paper. HH, GR, and WZ analyzed the result. All authors read and approved the final manuscript.
Funding
This work was supported by the National Natural Science Foundation of China (No: 31570160, 61772381 and 61772531), Innovation Team Project of Education Department of Liaoning Province under Grant No. LT2015011, the Doctor Startup Foundation from Liaoning Province under Grant No. 20170520217, Important Scientific and Technical Achievements Transformation Project under Grant No. Z17-5-078, Large-scale Equipment Shared Services Project under Grant No. F15165400 and Applied Basic Research Project under Grant No. F16205151.
Conflict of Interest Statement
The authors declare that the research was conducted in the absence of any commercial or financial relationships that could be construed as a potential conflict of interest.
References
Bellucci, M., Agostini, F., Masin, M., and Tartaglia, G. G. (2011). Predicting protein associations with long noncoding RNAs. Nat. Methods 8:444. doi: 10.1038/nmeth.1611
Chen, W., Ding, H., Feng, P., Lin, H., and Chou, K. C. (2016a). iACP: a sequence-based tool for identifying anticancer peptides. Oncotarget 7, 16895–16909. doi: 10.18632/oncotarget.7815
Chen, W., Feng, P., Yang, H., Ding, H., Lin, H., and Chou, K. C. (2017a). iRNA-AI: identifying the adenosine to inosine editing sites in RNA sequences. Oncotarget 8:4208. doi: 10.18632/oncotarget.13758
Chen, X., and Huang, L. (2017b). LRSSLMDA: laplacian regularized sparse subspace learning for mirna-disease association prediction. PLoS Comput. Biol. 13:e1005912. doi: 10.1371/journal.pcbi.1005912
Chen, X., Huang, L., Xie, D., and Zhao, Q. (2018a). EGBMMDA: extreme gradient boosting machine for mirna-disease association prediction. Cell Death Dis. 9:3. doi: 10.1038/s41419-017-0003-x
Chen, X., Huang, Y. A., You, Z. H., Yan, G. Y., and Wang, X. S. (2016b). A novel approach based on katz measure to predict associations of human microbiota with non-infectious diseases. Bioinformatics 33, 733–739. doi: 10.1093/bioinformatics/btw715
Chen, X., Ren, B., Chen, M., Wang, Q., Zhang, L., and Yan, G. (2016c). NLLSS: predicting synergistic drug combinations based on semi-supervised learning. PLoS Comput. Biol. 12:e1004975. doi: 10.1371/journal.pcbi.1004975
Chen, X., Sun, Y. Z., Liu, H., Zhang, L., Li, J. Q., and Meng, J. (2017c). RNA methylation and diseases: experimental results, databases, web servers and computational models. Brief. Bioinformatics bbx142. doi: 10.1093/bib/bbx142
Chen, X., Xie, D., Wang, L., Zhao, Q., You, Z.-H., and Liu, H. (2018b). BNPMDA: bipartite network projection for mirna-disease association prediction. Bioinformatics bty333. doi: 10.1093/bioinformatics/bty333
Chen, X., Xie, D., Zhao, Q., and You, Z. H. (2017d). MicroRNAs and complex diseases: from experimental results to computational models. Brief. Bioinformatics bbx130. doi: 10.1093/bib/bbx130
Chen, X., Yan, C. C., Zhang, X., and You, Z. H. (2016d). Long non-coding RNAs and complex diseases: from experimental results to computational models. Brief. Bioinformatics 18:558. doi: 10.1093/bib/bbw060
Chen, X., Yan, C. C., Zhang, X., Zhang, X., Dai, F., Yin, J., et al. (2015). Drug–target interaction prediction: databases, web servers and computational models. Brief. Bioinformatics 17:696. doi: 10.1093/bib/bbv066
Chen, X., and Yan, G. Y. (2013). Novel human lncRNA–disease association inference based on lncRNA expression profiles. Bioinformatics 29, 2617–2624. doi: 10.1093/bioinformatics/btt426
Chen, X., You, Z. H., Yan, G. Y., and Gong, D. W. (2016e). IRWRLDA: improved random walk with restart for lncRNA-disease association prediction. Oncotarget 7, 57919–57931. doi: 10.18632/oncotarget.11141
Consortium, U. P. (2015). UniProt: a hub for protein information. Nucleic Acids Res. 43, 204–212. doi: 10.1093/nar/gku989
Cook, K. B., Kazan, H., Zuberi, K., Morris, Q., and Hughes, T. R. (2011). RBPDB: a database of RNA-binding specificities. Nucleic Acids Res. 39, 301–308. doi: 10.1093/nar/gkq1069
Ge, M., Li, A., and Wang, M. (2016). A Bipartite Network-based Method for Prediction of Long Non-coding RNA-protein Interactions. Genomics Proteomics Bioinform. 14, 62–71. doi: 10.1016/j.gpb.2016.01.004
Gupta, R. A., Shah, N., Shah, N., Wang, K. C., Kim, J., Horlings, H. M., et al. (2010). Long non-coding RNA hotair reprograms chromatin state to promote cancer metastasis. Nature 464:1071. doi: 10.1038/nature08975
Guttman, M., Amit, I., Garber, M., French, C., Lin, M. F., Feldser, D., et al. (2009). Chromatin signature reveals over a thousand highly conserved large non-coding RNAs in mammals. Nature 458, 223–227. doi: 10.1038/nature07672
Hao, Y., Wei, W., Hui, L., Jiao, Y., Luo, J., Yi, Z., et al. (2016). NPInter v3.0: an upgraded database of noncoding RNA-associated interactions. database the J. Biol. Datab. Curat. 2016:baw057. doi: 10.1093/database/baw057
Harries, L. W. (2012). Long non-coding RNAs and human disease. Biochem. Soc. Trans. 40:902. doi: 10.1042/BST20120020
Hearst, M. A. (1998). “Support vector machines,” in IEEE Educational Activities Department (Piscataway, NJ), 18–28.
Hu, H., Zhang, L., Ai, H., Zhang, H., Fan, Y., Zhao, Q., et al. (2018). HLPI-Ensemble: prediction of human lncRna-protein interactions based on ensemble strategy. RNA Biol. doi: 10.1080/15476286.2018.1457935. [Epub ahead of print].
Hu, H., Zhu, C., Ai, H., Zhang, L., Zhao, J., Zhao, Q., et al. (2017). LPI-ETSLP: lncRna-protein interaction prediction using eigenvalue transformation-based semi-supervised link prediction. Mol. Biosyst. 13, 1781–1787. doi: 10.1039/C7MB00290D
Huang, Y. A., You, Z. H., Chen, X., Chan, K., and Luo, X. (2016). Sequence-based prediction of protein-protein interactions using weighted sparse representation model combined with global encoding. BMC Bioinformatics 17, 1–11. doi: 10.1186/s12859-016-1035-4
Johnson, C. C. (2014). Logistic Matrix Factorization for Implicit Feedback Data. Montreal, QC: NIPS 2014 Workshop Distributed Machine Learning and Matrix Computations.
Kishore, S., Luber, S., and Zavolan, M. (2010). Deciphering the role of RNA-binding proteins in the post-transcriptional control of gene expression. Brief. Funct. Genomics 9:391. doi: 10.1093/bfgp/elq028
Li, A., Ge, M., Zhang, Y., Peng, C., and Wang, M. (2015). Predicting long noncoding rna and protein interactions using heterogeneous network model. Biomed. Res. Int. 2015:671950. doi: 10.1155/2015/671950
Li, J. Q., You, Z. H., Li, X., Ming, Z., and Chen, X. (2017). PSPEL: in silico prediction of self-interacting proteins from amino acids sequences using ensemble learning. IEEE/ACM Trans. Comput. Biol. Bioinform. 14, 1165–1172. doi: 10.1109/TCBB.2017.2649529
Li, ZW., You, ZH., Chen, X., Gui, J., and Nie, R. (2016). Highly accurate prediction of protein-protein interactions via incorporating evolutionary information and physicochemical characteristics. Int. J. Mol. Sci. 17:1396. doi: 10.3390/ijms17091396
Liu, Y., Wei, W., Sun, A., and Miao, C. (2014). “Exploiting geographical neighborhood characteristics for location recommendation,” in Proceedings of the 23rd ACM International Conference on Information and Knowledge Management (Turin), 739–748.
Liu, Y., Zeng, X., He, Z., and Zou, Q. (2016). Inferring microRNA-disease associations by random walk on a heterogeneous network with multiple data sources. IEEE/ACM Trans. Comput. Biol. Bioinform. 14, 905–915. doi: 10.1109/TCBB.2016.2550432
Mittal, N., Roy, N., Babu, M. M., and Janga, S. C. (2009). Dissecting the expression dynamics of RNA-binding proteins in posttranscriptional regulatory networks. Proc. Natl. Acad. Sci. U.S.A. 106:20300. doi: 10.1073/pnas.0906940106
Morlando, M., Ballarino, M., Fatica, A., and Bozzoni, I. (2014). The role of long noncoding RNAs in the epigenetic control of gene expression. ChemMedChem 9, 505–510. doi: 10.1002/cmdc.201300569
Muppirala, U. K., Honavar, V. G., and Dobbs, D. (2011). Predicting RNA-protein interactions using only sequence information. BMC Bioinform. 12:489. doi: 10.1186/1471-2105-12-489
Pearson, W. R. (1991). Searching protein sequence libraries: comparison of the sensitivity and selectivity of the Smith-Waterman and FASTA algorithms. Genomics 11, 635–650. doi: 10.1016/0888-7543(91)90071-L
Pundir, S., Martin, M. J., O'Donovan, C., and Consortium, U. P. (2016). UniProt Tools. Curr. Protocols Bioinform. 53:21. doi: 10.1002/0471250953.bi0129s53
Ray, D., Kazan, H., Cook, K. B., Weirauch, M. T., Najafabadi, H. S., Li, X., et al. (2013). A compendium of RNA-binding motifs for decoding gene regulation. Nature 499, 172–177. doi: 10.1038/nature12311
Suresh, V., Liu, L., Adjeroh, D., and Zhou, X. (2015). RPI-Pred: predicting ncRNA-protein interaction using sequence and structural information. Nucleic Acids Res. 43:1370. doi: 10.1093/nar/gkv020
Tang, W., Wan, S., Yang, Z., Teschendorff, A. E., and Zou, Q. (2018). Tumor origin detection with tissue-specific miRNA and DNA methylation markers. Bioinformatics 34, 398–406. doi: 10.1093/bioinformatics/btx622
Wapinski, O., and Chang, H. Y. (2011). Corrigendum: long noncoding RNAs and human disease. Trends Cell Biol. 21:354. doi: 10.1016/j.tcb.2011.08.004
Wilusz, J. E., Sunwoo, H., and Spector, D. L. (2009). Long noncoding RNAs: functional surprises from the RNA world. Genes Dev. 23:1494. doi: 10.1101/gad.1800909
Xie, C., Yuan, J., Li, H., Li, M., Zhao, G., Bu, D., et al. (2014). NONCODEv4: exploring the world of long non-coding RNA genes. Nucleic Acids Res. 42, 98–103. doi: 10.1093/nar/gkt1222
You, Z., Huang, Z., Zhu, Z., Yan, G., Li, Z., Wen, Z., et al. (2017). PBMDA: a novel and effective path-based computational model for miRNA-disease association prediction. PLoS Comput. Biol. 13:e1005455. doi: 10.1371/journal.pcbi.1005455
Yu, F., Zheng, J., Mao, Y., Dong, P., Li, G., Lu, Z., et al. (2015). Long non-coding RNA APTR promotes the activation of hepatic stellate cells and the progression of liver fibrosis. Biochem. Biophys. Res. Commun. 463, 679–685. doi: 10.1016/j.bbrc.2015.05.124
Yuan, J., Wu, W., Xie, C., Zhao, G., Zhao, Y., and Chen, R. (2014). NPInter v2.0: an updated database of ncRNA interactions. Nucleic Acids Res. 42, 104–108. doi: 10.1093/nar/gkt1057
Zeng, X., Zhang, X., and Zou, Q. (2015). Integrative approaches for predicting microRNA function and prioritizing disease-related microRNA using biological interaction networks. Brief. Bioinformatics 17:193. doi: 10.1093/bib/bbv033
Zhang, L., Ai, H., Chen, W., Yin, Z., Hu, H., Zhu, J., et al. (2017a). CarcinoPred-EL: novel models for predicting the carcinogenicity of chemicals using molecular fingerprints and ensemble learning methods. Sci. Rep. 7:2118. doi: 10.1038/s41598-017-02365-0
Zhang, W., Qu, Q., Zhang, Y., Wang, W., Zhang, W., Qu, Q., et al. (2017b). The linear neighborhood propagation method for predicting long non-coding RNA–protein interactions. Neurocomput. 273, 526–534. doi: 10.1016/j.neucom.2017.07.065
Zhao, Q., Yao, C. G., Tang, J., and Liu, L. W. (2016a). Study of spatial signal transduction in bistable switches. Front. Phys. 11:110501. doi: 10.1007/s11467-016-0571-8
Zhao, Y., Yuan, J., and Chen, R. (2016b). NONCODEv4: annotation of noncoding rnas with emphasis on long noncoding RNAs. Methods Mol. Biol. (Clifton, N.J.) 1402:243. doi: 10.1007/978-1-4939-3378-5_19
Keywords: lncRNA, protein, interaction prediction, random walk, neighborhood regularized logistic matrix factorization, integration method
Citation: Zhao Q, Zhang Y, Hu H, Ren G, Zhang W and Liu H (2018) IRWNRLPI: Integrating Random Walk and Neighborhood Regularized Logistic Matrix Factorization for lncRNA-Protein Interaction Prediction. Front. Genet. 9:239. doi: 10.3389/fgene.2018.00239
Received: 14 May 2018; Accepted: 15 June 2018;
Published: 04 July 2018.
Edited by:
Quan Zou, Tianjin University, ChinaReviewed by:
Yi Xiong, Shanghai Jiao Tong University, ChinaYongqiang Xing, Inner Mongolia University of Science and Technology, China
Copyright © 2018 Zhao, Zhang, Hu, Ren, Zhang and Liu. This is an open-access article distributed under the terms of the Creative Commons Attribution License (CC BY). The use, distribution or reproduction in other forums is permitted, provided the original author(s) and the copyright owner(s) are credited and that the original publication in this journal is cited, in accordance with accepted academic practice. No use, distribution or reproduction is permitted which does not comply with these terms.
*Correspondence: Hongsheng Liu, liuhongsheng@lnu.edu.cn