 Lin Ma1
 Sarantsetseg Erdenee
 Xianyong Lan
- 1Shaanxi Key Laboratory of Molecular Biology for Agriculture, College of Animal Science and Technology, Northwest A&F University, Yangling, China
- 2Key Laboratory of Adaptation and Evolution of Plateau Biota, Northwest Institute of Plateau Biology, Chinese Academy of Sciences, Xining, China
- 3Science Experimental Center, Northwest University for Nationalities, Lanzhou, China
- 4College of Life Science and Engineering, Northwest University for Nationalities, Lanzhou, China
The Lanzhou Fat-Tail sheep (LFTS, long fat-tailed sheep) is an endangered sheep breed in China with a fat tail compared to the traditional local varieties, Small Tail Han sheep (STHS, thin-tailed sheep) with a small tail, and Tibetan sheep (TS, short thin-tailed sheep) with a little tail. However, little is known regarding how tail fat deposition is regulated by long noncoding RNA (lncRNA). To evaluate the lncRNA and mRNA associated with tail fat deposition and development among these breeds, high-throughput RNA sequencing of three individuals each of LFTS, STHS, and TS were performed and analyzed in this study. RNA sequencing data from these three groups revealed 10 differentially expressed genes (DEGs) and 37 differentially expressed lncRNAs between the LFTS and STHS groups, 390 DEGs and 59 differentially expressed lncRNAs between the LFTS and TS groups, and 80 DEGs and 16 differentially expressed lncRNAs between the STHS and TS groups (p-value < 0.05 and fold change ≥ 2), respectively. Gene Ontology and pathway analysis of DEGs and target genes of differentially expressed lncRNAs revealed enrichment in fatty acid metabolism and fatty acid elongation-related pathways that contribute to fat deposition. Subsequently, the expression of 14 DEGs and 6 differentially expressed lncRNAs was validated by quantitative real-time PCR. Finally, two co-expression networks of differentially expressed mRNA and lncRNAs were constructed. The results suggested that some differentially expressed lncRNAs (TCONS_00372767, TCONS_00171926, TCONS_00054953, and TCONS_00373007) may play crucial roles as core lncRNAs in tail fat deposition processes. In summary, the present study extends the sheep tail fat lncRNA database and these differentially expressed mRNA and lncRNAs may provide novel candidate regulators for future genetic and molecular studies on tail fat deposition of sheep.
Introduction
Lanzhou Fat-Tailed sheep (LFTS), Small Tailed Han sheep (STHS), and Tibetan sheep (TS) are famous and special sheep breeds in China. LFTS are one of the four Chinese sheep breeds majorly raised in Northwestern China where the terrain is dry and the region is at high altitude. However, the famous phenotype of LFTS is their fat tail, which can sag to the hock and accumulate a lot of fat (Shelton, 1990; Almeida, 2011; Edea et al., 2017; Li et al., 2018a). Currently, the number of fat-tailed sheep are in sharp decline, especially LFTS. LFTS is an endangered breed that needs protection. Compared with LFTS, STHS have smaller tails and fat accumulation (Xu et al., 2017; Ma et al., 2018). STHS have a high reproductive capacity and show polyembryony; they grow fast and could be in oestrum at all seasons (Kashan et al., 2005). TS are raised in the mountainous region of the Qingzang plateau, where the average elevation is 3,500 m. Compared with LFTS and STHS, TS are relatively stronger and their tails are the smallest with less fat accumulation (Zhu et al., 2016; Zhou et al., 2017).
Adipose tissue is one of the vital tissues involved in the regulation of fat development and lipid metabolism in domestic animals. The “fat-tail” can provide energy during migration and in seasons when the pasture is dormant or when low amounts of dry matter are available (Atti et al., 2004). The fat-tail phenotype is a trait necessary for survival in harsh environments (Pourlis, 2011). In addition, the tail fat of sheep can be used by humans as an important source of dietary fat (Kashan et al., 2005; Moradi et al., 2012). Thus, the mechanism of tail fat deposition is worth studying.
In recent years, deep sequencing of transcriptomes is increasingly being utilized with promises of higher sensitivity in identification of differential expression (Jäger et al., 2011; Miao and Luo, 2013; Zhang C. et al., 2013). A few comparative transcriptome studies and whole genome studies were performed to survey gene expression profiles between different sheep breeds and different tissues in the same sheep breed (Wang et al., 2014; Miao et al., 2015b; Kang et al., 2017; Zhi et al., 2017). There are some studies on miRNA or CNV in the adipose in sheep (Miao et al., 2015a; Zhu et al., 2016; Zhou et al., 2017). In 2014, transcriptome sequencing was used to compare transcriptome profiles of fat between a fat-tailed sheep (Kazak sheep) and a short-tailed sheep (TS). 646 genes were differentially expressed between the two breeds, and the two top genes with the largest fold change (NELL1 and FMO3) may affect fat metabolism in adipose tissues of sheep (Wang et al., 2014). In 2015, 602 differentially expressed genes (DEGs) were identified in the fat of two breeds of sheep using RNA-Seq technology, and some of these genes were shown to be involved in fat metabolism process through GO enrichment and KEGG pathway analysis. These genes may be involved in fat deposition in sheep (Miao et al., 2015b). The miRNA were sequenced in fat of two breeds of sheep and 54 differentially expressed miRNA were identified. It was found that some miRNA and their target genes were involved in the tail lipid development of sheep. (Miao et al., 2015a). In 2017, deep sequencing methods were used to identify miRNA and their target genes involved in the fat of the fat-tailed sheep (Kazakhstan sheep) and thin-tailed sheep (TS). By comparing the HiSeq data of these two breeds, it was found that some miRNA were involved in the development of tail fat, and through the integration analysis of miRNA–mRNA, it is revealed that some miRNA and their target genes play a key role in fat deposition in sheep (Zhou et al., 2017). In the same year, 1,058 DEGs were identified by transcriptome sequencing of three different types of fat (subcutaneous fat, visceral fat, and tail fat) in Tan sheep, and it was suggested that HOXC11, HOXC12, HOXC13, HOTAIR_2, HOTAIR_3, and SP9 could be associated with tail fat deposition in sheep (Kang et al., 2017). Recently, transcriptome sequencing and miRNA sequencing were performed in three types of fat (subcutaneous fat, perirenal fat, and tail fat) of two sheep breeds (Guangling large-Tailed sheep and Small-Tailed Han sheep). Fat-related genes (FABP4, FABP5, ADIPOQ, and CD36) were highly expressed, and 14 genes (LOC101102230, PLTP, C1QTNF7, OLR1, SCD, UCP-1, ANGPTL4, FASD2, SLC27A6, LAMB3, LAMB4, RELN, TNXB, and ITGA8) and 9 miRNA (miR-10b, miR-29a, miR-30c, miR-155, miR-192, miR-206, novel-miR-102, novel-miR-36, and novel-miR-63) may be associated with fat deposition in sheep (Li et al., 2018b; Pan et al., 2018). However, up to now, there has been no report on long non-coding RNAs (lncRNAs) of the fat tail in sheep. Furthermore, more complex gene networks and molecular determinants related to tail fat development remain unclear and further studies exploring these aspects are required.
Here, in order to characterize the mRNA and lncRNA expression profiles in the tail fat of sheep, we explored the transcriptomic differences among LFTS, STHS, and TS sheep and elucidated the molecular mechanisms of tail fat deposition. Our study may provide more clues from coding and non-coding regions regarding the mechanism of fat deposition in fat-tailed sheep.
Materials and Methods
Ethics Statement
All experiments performed in this study were approved by the International Animal Care and Use Committee of the Northwest A&F University (IACUC–NWAFU). Furthermore, the care and use of animals complied with the local animal welfare laws, guidelines, and policies.
Experimentallicense on the basis of “Experimental Animal Management Measures in Shaanxi Province” (016000291szfbgt-2011-000001), all experiment procedures, were approved by the Review Committee for the Use of Animal Subjects of Northwest A&F University. Animal experimentation, including sample collection, was performed in agreement with the ethical commission’s guidelines. This license is for LM, etc., thesis on “Comparative transcriptome profiling of mRNA and lncRNA related to tail adipose tissues of sheep.” College of Animal Science and Technology, Northwest A&F University, Yangling, Shaanxi, China, January 26, 2018.
Animal and Tail Fat Tissue Collection
In this study, nine unrelated individuals of LFTS (n = 3), STHS (n = 3), and TS (n = 3) breeds that were castrated at the age of 6 months were randomly selected from a sheep farm located in Gansu province, China. The appearance and shape of the sheep completely conformed to their varietal characteristics. Their body conditions were healthy and their weights were moderate. The sheep were fed in stables under natural lighting. The animals were slaughtered and the tail fat tissues collected. The fresh tissues were immediately frozen in liquid nitrogen, and then stored at -80°C until use.
RNA Extraction and Quality Assessment
Total RNA was extracted from tail fat tissues using RNAiso Plus (Takara, Dalian, China) following the manufacturer’s specifications. The RNA was, respectively, solubilized in 30 μL DEPC-treated H2O. Aliquots of 1 μL RNA from each sample were used for evaluation by spectrophotometric analysis. Another aliquot of 1 μL RNA mixed in loading buffer was detected on 1.0% agarose gel electrophoresed for 20 min by staining with ethidium bromide and observing under UV transillumination. The RNA concentration and quality were assessed by the Agilent 2100 bioanalyzer (Agilent Technologies, Santa Clara, CA, United States). The A260/280 ratios, 28S/18S values, and the RNA Integrity Numbers (RIN) of all samples are shown in Supplementary Table S1. Subsequent sequencing experiments were performed on qualified RNA. The remaining RNA samples were immediately stored at -80°C.
cDNA Library Construction and Illumina Sequencing
Qualified total RNA was further purified by RNAClean XP Kit (Beckman Coulter, Inc., Kraemer Boulevard, Brea, CA, United States) and RNase-Free DNase Set (Qiagen, GmBH, Germany). After the purification and ribosomal RNA removal, the rRNA-depleted samples were sheared into small fragments using divalent cations under high temperature. These RNA fragments were copied into the first strand of cDNA using random primers and reverse transcriptase. The second strand of cDNA was then synthesized using DNA Polymerase I and RNase H. These final cDNA fragments were then subjected to an end repair process where a single “A” base was added followed by ligation of the adapters. The output was then purified and enriched using PCR to create the final cDNA library.
The nine strand-specific RNA-Seq libraries were sequenced with a HiSeq 2000 Desktop Sequencer from Illumina Sequencing Technologies (Biotechnology, Shanghai, China). Sequencing was optimized to generate 150 bp paired reads. All datasets have been submitted to NCBI Sequence Read Archive (SRA) database and the files can be found under the accession numbers SRR6666247, SRR6666246, SRR6666245, SRR6666244, SRR6666251, SRR66 66250, SRR6666249, SRR6666248, SRR6666243.
Sequencing Quality Assessment, Reads Mapping, and Transcriptome Assembly
Reads qualities of the RNA sequencing (RNA-Seq) were evaluated using FastQC (v0.10.1) (Andrews, 2012). Adaptor sequences and low quality sequences were removed from the original reads by Seqtk1. The clean reads for each sample were mapped to the sheep reference genome Ovis aries v3.1 with TopHat2 (v2.0.9) using the paired-end mapping method with two mismatches (Trapnell et al., 2009). Based on it, the transcripts were assembled using Cufflinks (v2.2.1) with default parameters (Trapnell et al., 2012).
Prediction of lncRNA
After annotation, the unknown transcripts were used to screen for lncRNA candidates. Transcripts smaller than 200 nucleotides or having single exons were discarded. Based on the length of the open reading frame, homology with known proteins and their coding potential, the Coding Potential Calculator (Kong et al., 2007), the Coding-Non-Coding Index (Sun et al., 2013), and the Protein Families Database (Finn et al., 2014), which have the power to sort lncRNAs from putative protein-coding RNAs were combined to screen the lncRNAs. The transcripts from the intersection of the three methods were predicted to be lncRNA transcripts.
Screening of DEGs and Differentially Expressed lncRNAs
DEGs were analyzed by edgeR package to calculate the p-value that was obtained by multiple hypothesis testing calibration (Robinson et al., 2010). The p-value was corrected using the false discovery rate (FDR) to obtain the q-value. Q-values were then used to calculate the differential expression among the three groups.
We also calculated fragments per kilobase of the exon model per million mapped reads (FPKM) value of each gene using Perl script, as follows:
FPKM were used to calculate the fold change of DEGs among the three groups. Differentially expressed lncRNAs were analyzed by Cuffdiff to calculate the q-value and fold change (Trapnell et al., 2012). Transcript abundance of lncRNAs was measured by FPKM using Cufflinks (v2.2.1) (Trapnell et al., 2012). DEGs or differentially expressed lncRNAs with a q-value < 0.05 and an absolute value of fold change ≥ 2 were assigned as differential expression. Based on the FPKM of all genes or lncRNAs from three groups of pairwise comparisons, the volcano were plotted by gglot2 packages to show the patterns of genes/lncRNAs expression.
Target Gene Prediction
Differentially expressed lncRNAs were selected for target prediction via cis- or trans-regulatory effects. For the cis pathway target gene prediction, the genes transcribed within a 10-kb window upstream or downstream of lncRNAs were considered as cis target gene. RNAplex software was then used to select trans-acting target genes (Tafer and Hofacker, 2008).
Gene Ontology (GO) and Kyoto Encyclopedia of Genes and Genomes (KEGG) Pathway Analyses of DEGs and Target Genes of Differentially Expressed lncRNAs
To analyze the main function of the genes and lncRNAs, DEGs and the target genes were annotated through the GO and KEGG. The GO database was used to predict and illuminate the function of the gene product with respect to the molecular and biological processes and cellular component (Ashburner et al., 2000). The genes were first mapped to the GO terms in the database2. The gene numbers in every GO term were then calculated to determine the significantly enriched GO terms using the corrected p-value < 0.05 as a threshold. KEGG3 was used to perform pathway enrichment analysis (Kanehisa et al., 2016) to confirm the main biochemical and signaling pathways in which the genes participate. The significantly enriched KEGG pathways were determined using the corrected p-value < 0.05 as a threshold. If the corrected p-value (q-value) < 0.05, significant enrichment of GO terms, or KEGG pathways was observed in the DEGs and target genes of differentially expressed lncRNAs.
Validation of RNA-Seq Results by Quantitative Real-Time PCR (qRT-PCR)
To quantitatively determine the reliability of our analyzed data, 14 significant DEGs and 6 differentially expressed lncRNAs were randomly selected to test their expression levels using qRT-PCR. Total RNA samples were reverse transcribed to cDNA using the PrimeSriptTM RT reagent Kit with gDNA Eraser (TaKaRa, Dalian, China) according to the manufacturer’s recommendations. qRT-PCR was performed using the SYBR® Premix Ex TaqTM kit (TaKaRa, Dalian, China) on the Bio-Rad CFX96 Real-Time PCR system (Hercules, CA, United States). All the primers of DEGs and differentially expressed lncRNAs used are presented in Tables 1, 2, respectively. Individual samples were run in triplicate. The qRT-PCR amplification program was as follows: pre-denaturation at 95°C for 30 s, followed by 39 cycles of 95°C for 5 s, 60°C for 30 s.
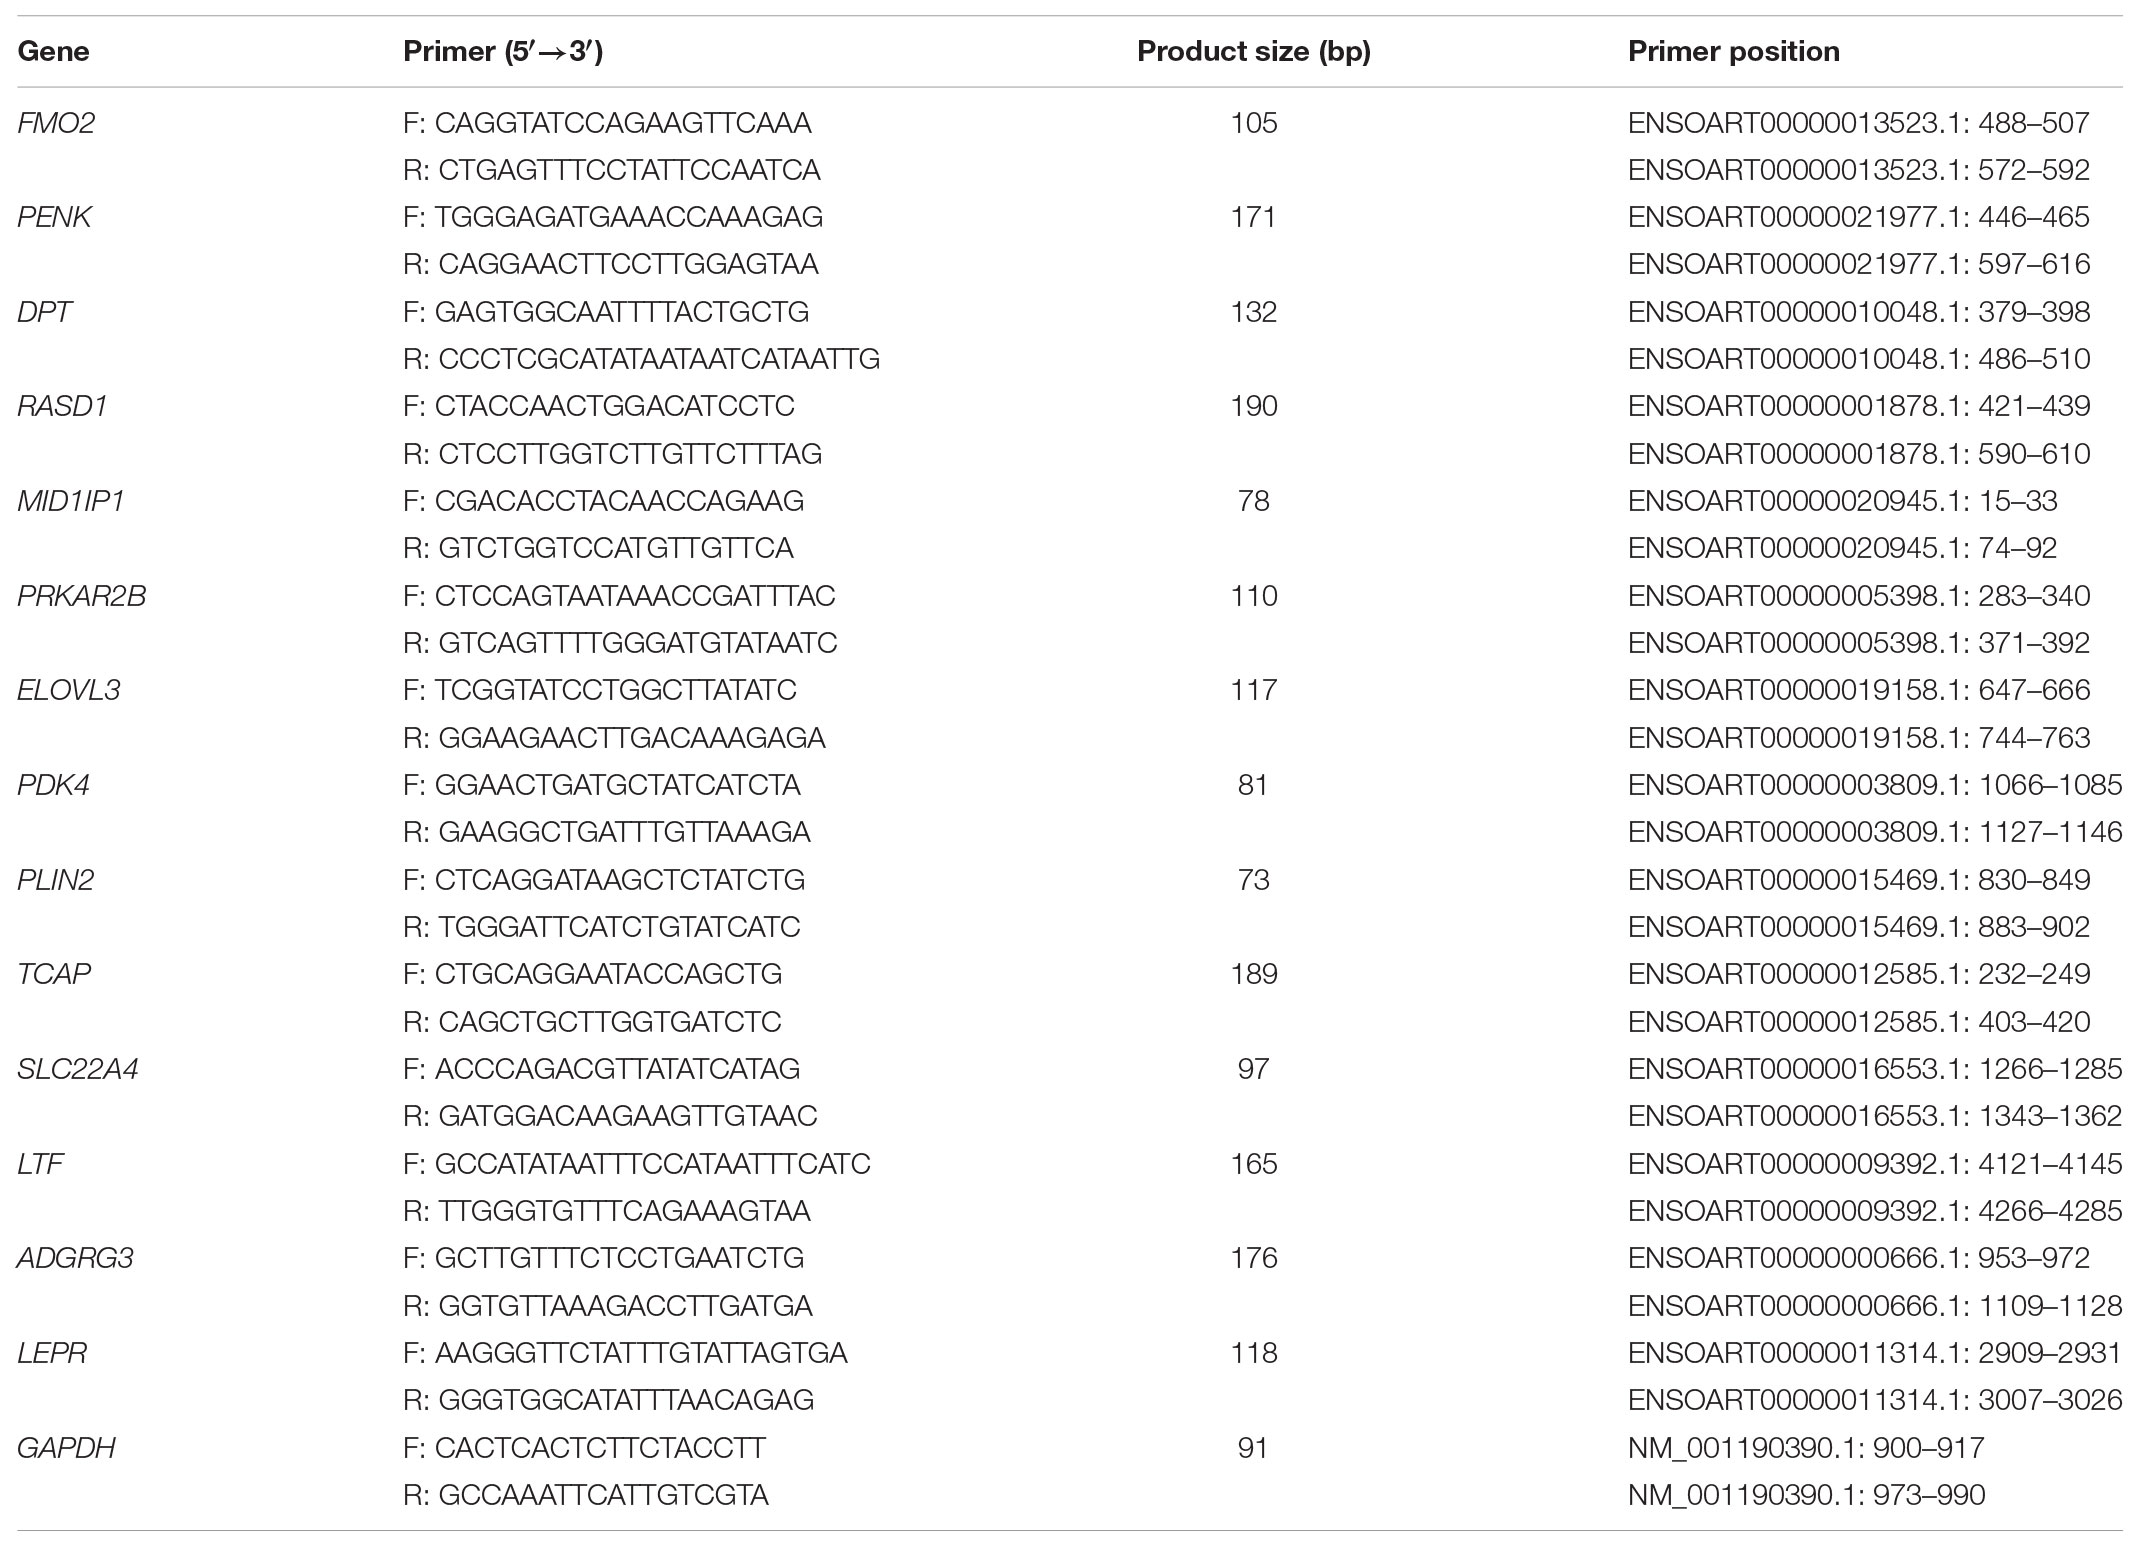
TABLE 1. Primer pairs of DEGs used for qRT-PCR validation.

TABLE 2. Primer pairs of differentially expressed lncRNAs used for qRT-PCR validation.
Relative expressions were calculated using the 2-ΔΔCt method with GAPDH as the internal control (Livak and Schmittgen, 2001). The data were compared by Student’s t-test using SPSS (version 23.0) (SPSS, Inc., Chicago, IL, United States), and the results were expressed as the mean ± standard deviation of triplicates values. P-value < 0.05 was considered statistically significant (Yang et al., 2017).
Construction of the lncRNA-Gene Co-expression Network
To further explore the interactions between the DEGs and differentially expressed lncRNAs, the co-expression was analyzed based on their FPKM. For each lncRNA, Pearson correlation coefficient (COR) of its expression value with that of each mRNA was calculated. The interaction network of the differentially expressed lncRNA–mRNA co-expression pairs (an absolute value of COR ≥ 0.7 and FDR < 0.01) was then constructed using Cytoscape (v3.6.0) (Shannon et al., 2003).
Results
Sequencing Data Summary
Herein, a total of 60 Gb raw data were generated. In detail, 75,592,986, 88,617,414, and 83,525,778 raw reads were obtained for LFTS (LFTS-1, 2, and 3, respectively); 100,297,264, 80,848,034, and 83,364,558 raw reads were obtained for STHS (STHS-1, 2, and 3, respectively); and 78,883,006, 70,533,752, and 57,254,426 raw reads were obtained for TS (TS-1, 2, and 3, respectively) (Table 3). The raw reads were filtered to obtain clean reads, which were mapped to the Ovis aries v3.1 version of the sheep genome sequence, with the mapping ratio ranging from 68.26 to 81.12%. Based on it, the transcripts were assembled using Cufflinks (v2.2.1) with default parameter. The results of the RNA-Seq reads mapped on the reference are shown in Table 3.
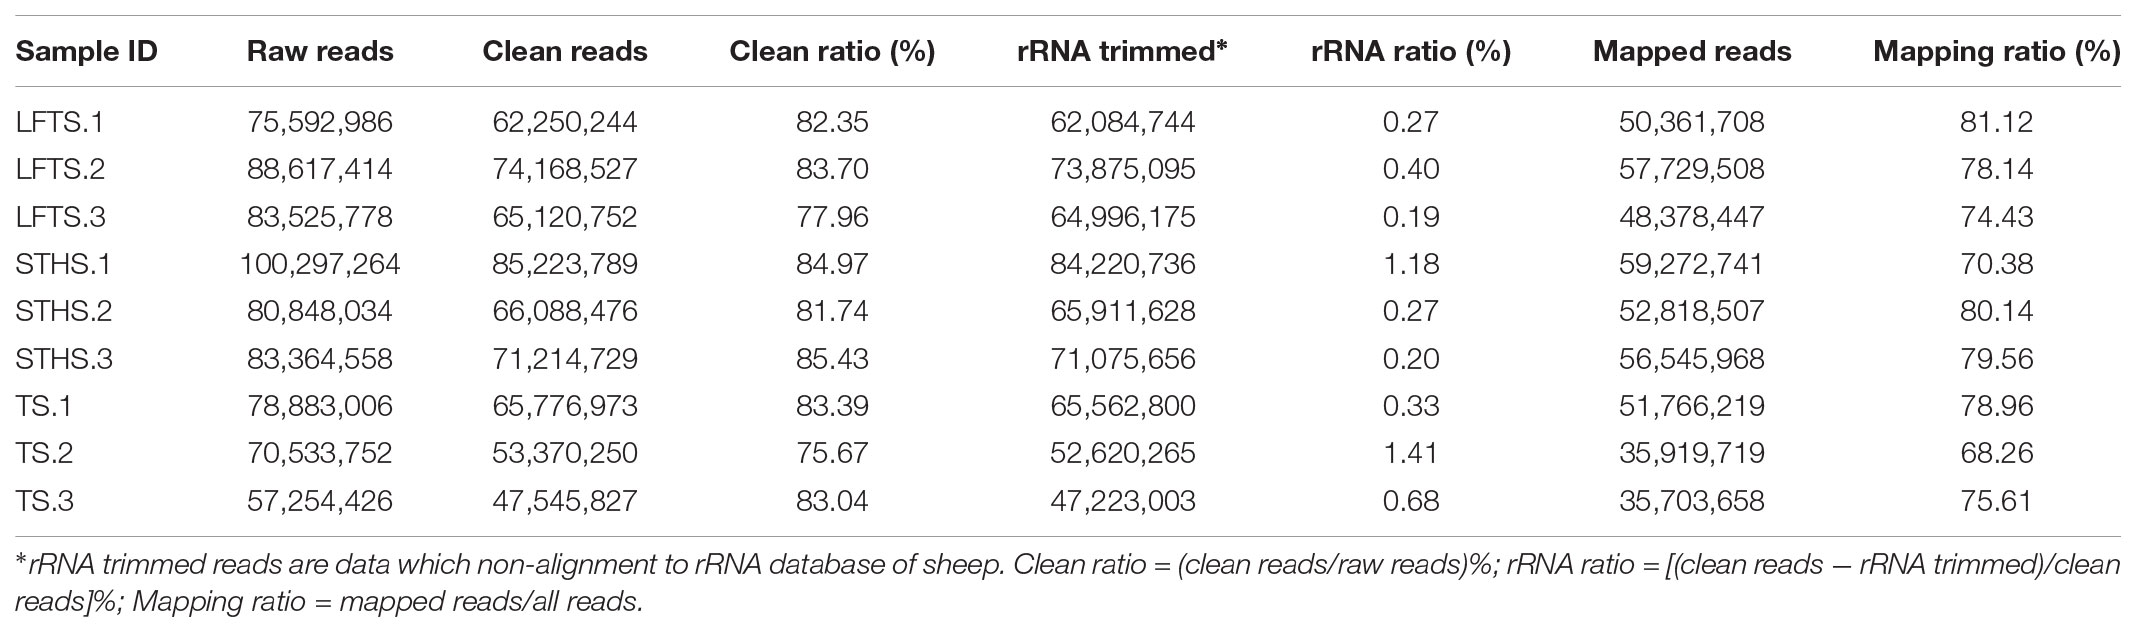
TABLE 3. Reads filter and mapping summary.
Identification and Characterization of lncRNA in Tail Fat of Sheep
To study the basic features of lncRNAs in tail fat of sheep, the lncRNAs were identified and compared with mRNA. The intersection of the Coding Potential Calculator, Coding-Non-Coding Index, and the Protein Families Database results finally yielded 9,082 lncRNA transcripts. The lncRNA transcripts were classified as 4,791 (52.8%) intergenic lncRNAs, 97 (1.1%) exonic sence lncRNAs, 1,398 (15.4%) exonic antisence lncRNAs, 1,167 (12.8%) intronic sence lncRNAs, 1,148 (12.6%) intronic antisence lncRNAs, and 481 (5.3%) bidirectional lncRNAs (Figure 1). Although the length of lncRNAs and mRNA transcripts is comparable, the expression levels between them are different. We found that lncRNAs exhibited lower expression levels compared to mRNA (Figure 2).
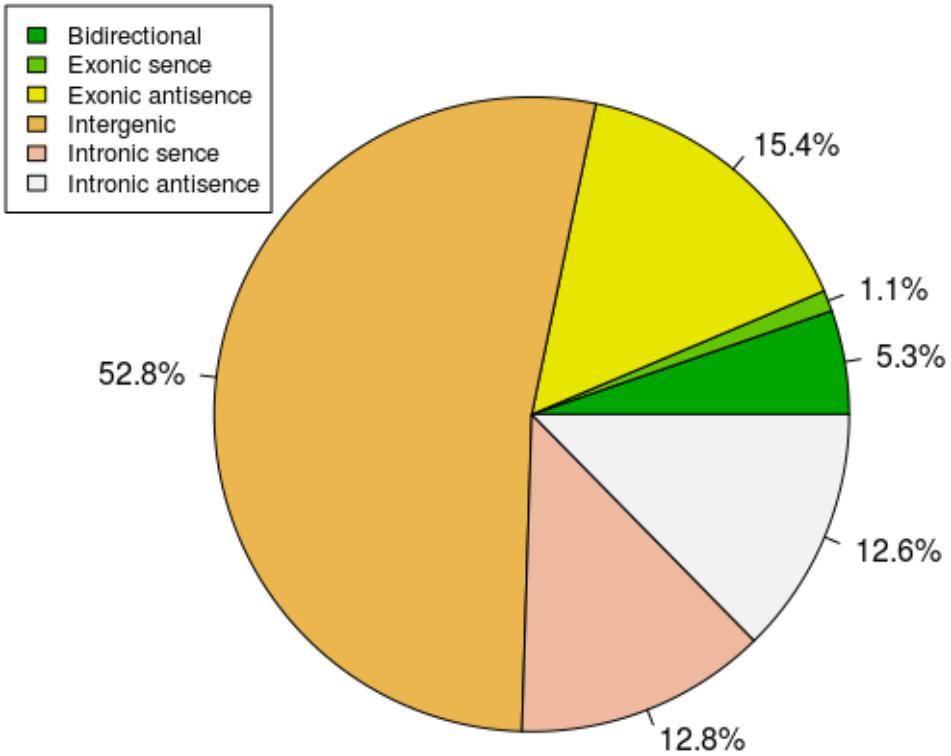
FIGURE 1. The classification of lncRNAs.
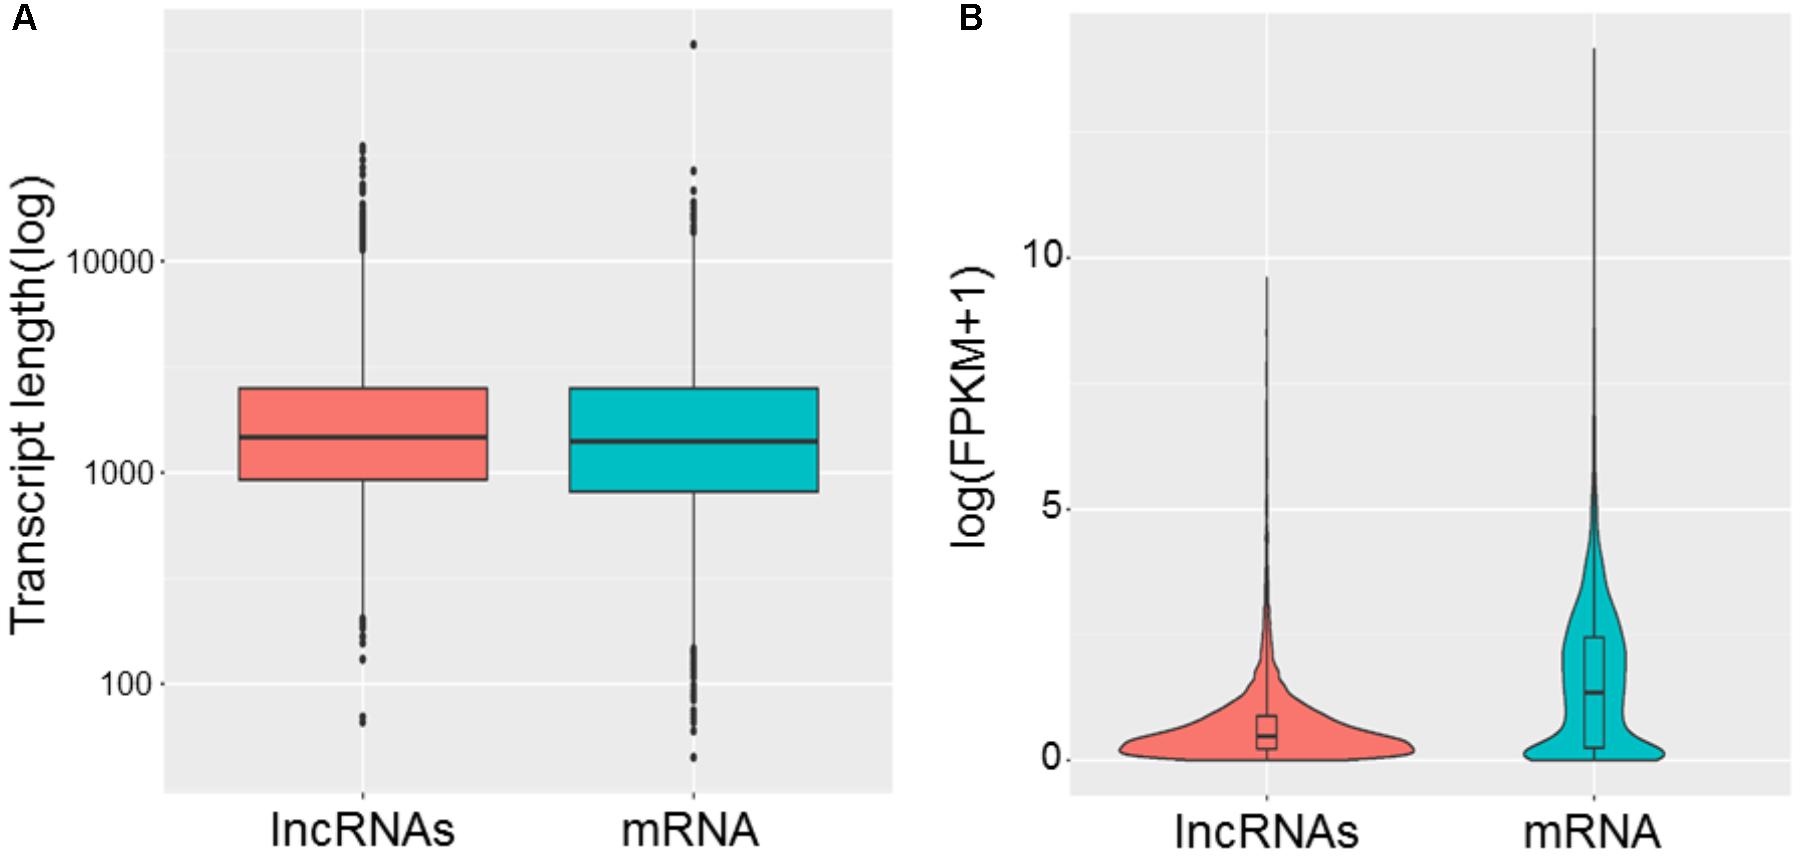
FIGURE 2. Comparison of length (A) and expression levels (B) between lncRNAs and mRNA.
Differential Expression Analysis and Target Gene Prediction
DEGs and differentially expressed lncRNAs were found through comparison between any two breeds. For the tail fat of LFTS vs. STHS, 10 genes were considered as DEGs, including 7 up-regulated and 3 down-regulated genes. For LFTS vs. TS, 390 genes were DEGs including 215 up-regulated and 175 down-regulated ones. For the comparison of STHS and TS, 40 DEGs were found of which 21 genes were up-regulated and 19 were down-regulated. The two common DEGs in LFTS vs. STHS and LFTS vs. TS were FMO2 and ENSOARG00000013777. In total, 17 common DEGs were found in both LFTS vs. TS and STHS vs. TS groups, such as C1RL, DHCR7, and IGF1. There were no common DEGs in the two comparisons of LFTS vs. STHS and STHS vs. TS. We used volcano plots to explore the relationship between the fold change and the significance (Figure 3). To determine the primary patterns of gene expression, hierarchical clustering analysis of all DEGs was further employed based on the FPKM value (Figure 4).
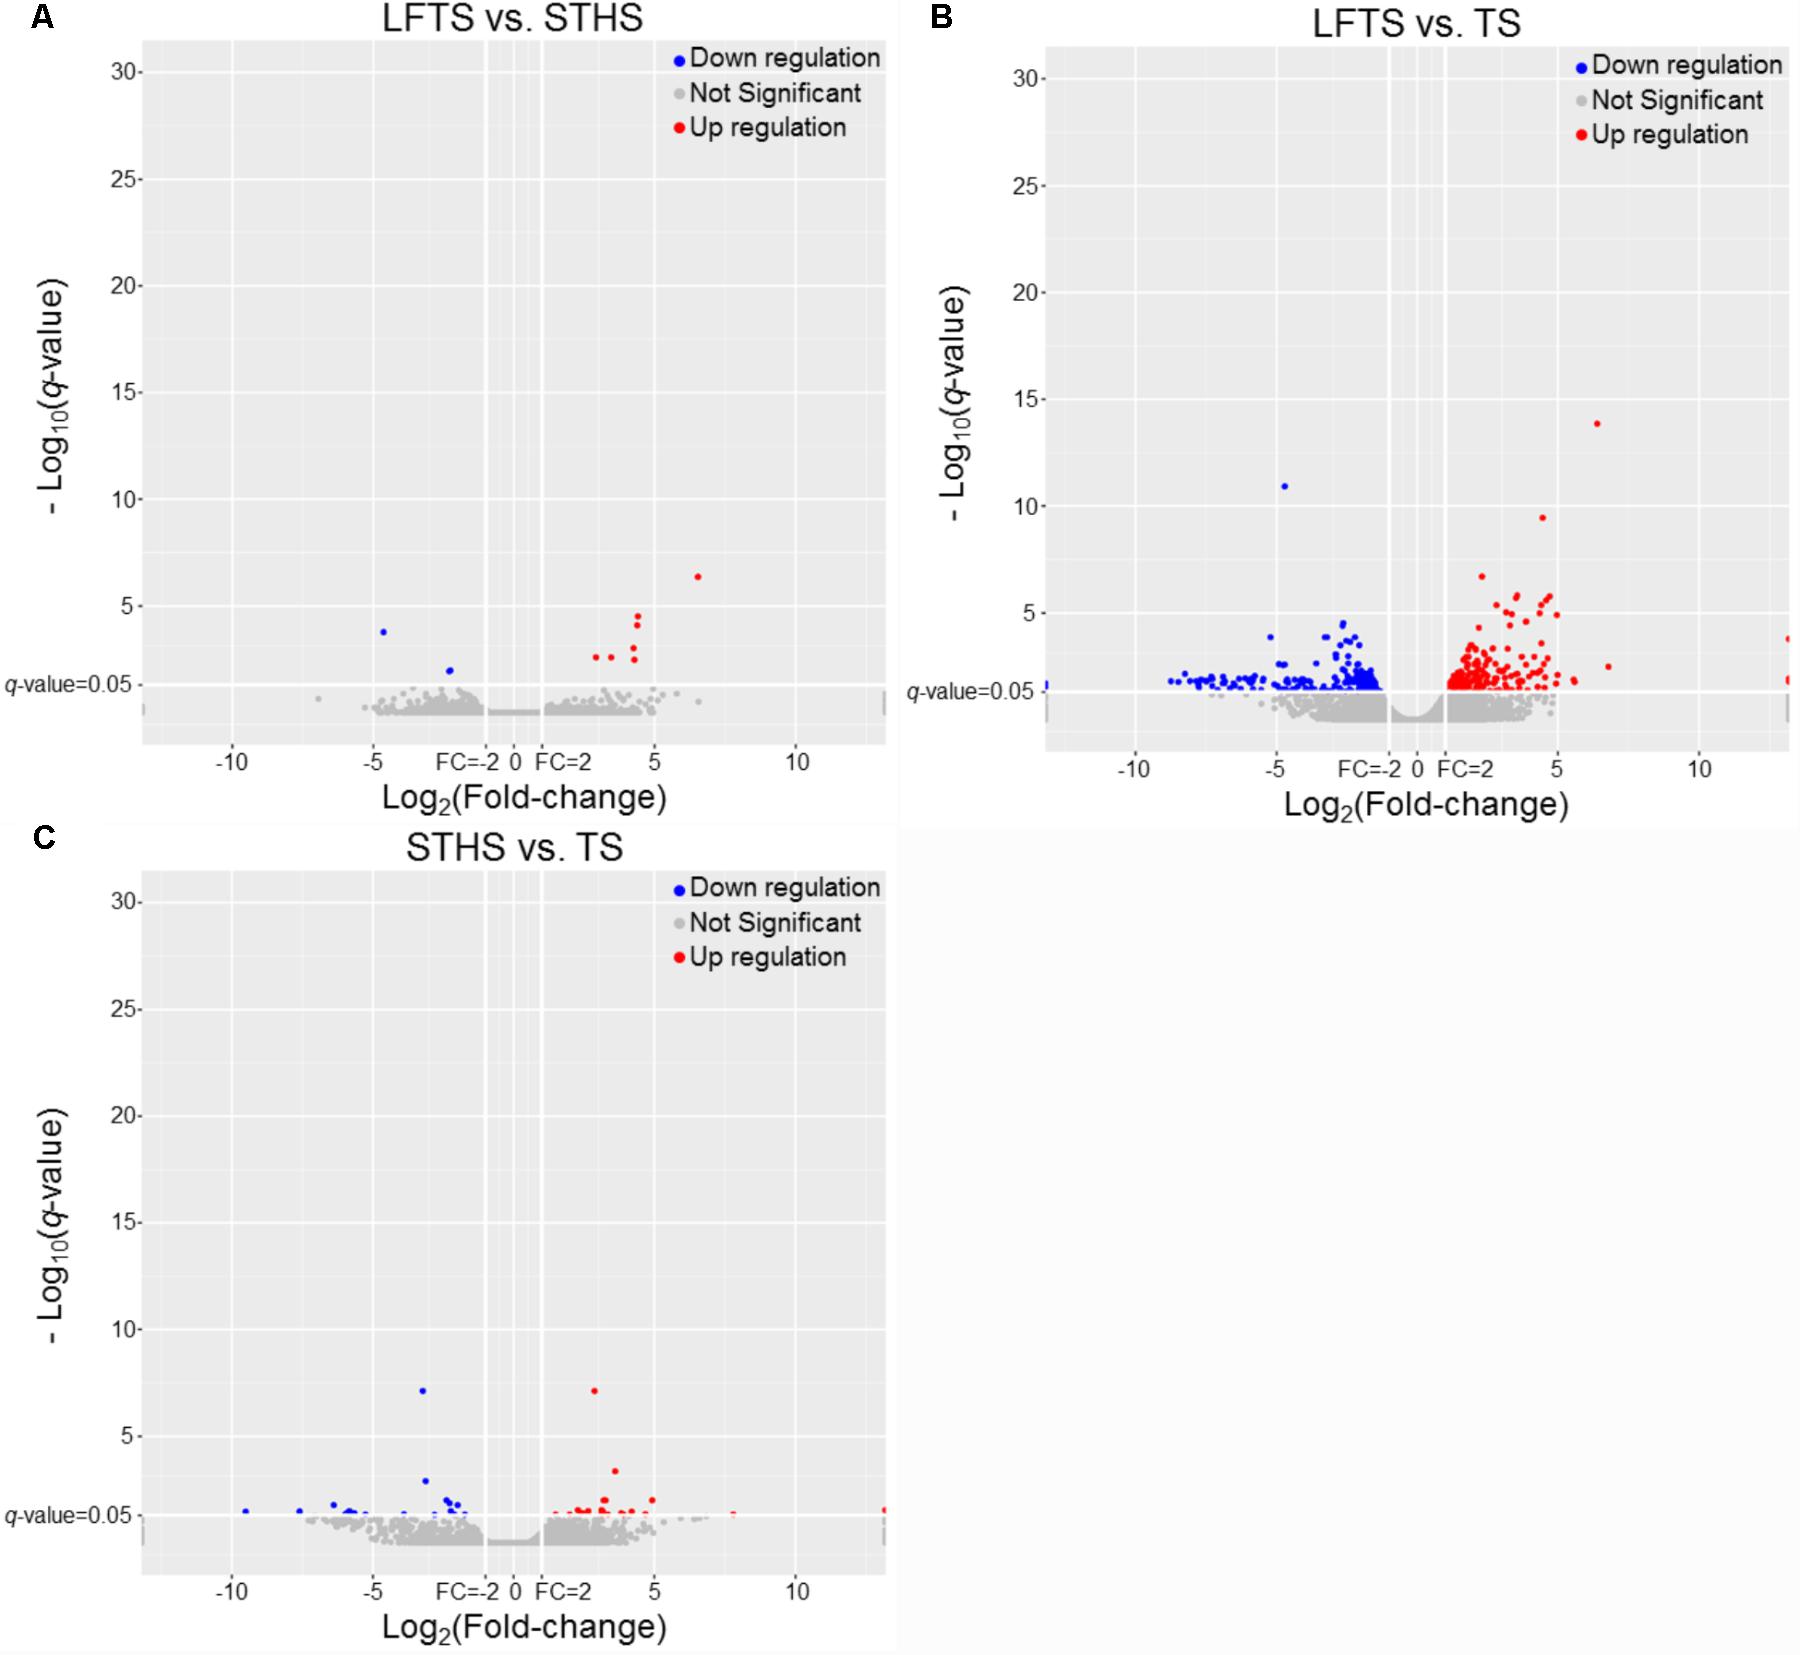
FIGURE 3. The volcano plot of gene expression levels in LFTS vs. STHS (A), LFTS vs. TS (B), and STHS vs. TS (C). The vertical lines correspond to twofold up and down and the horizontal line represents a q-value of 0.05. The red point represents up-regulated DEGs, the blue point represents down-regulated DEGs, the gray point for no significant genes.
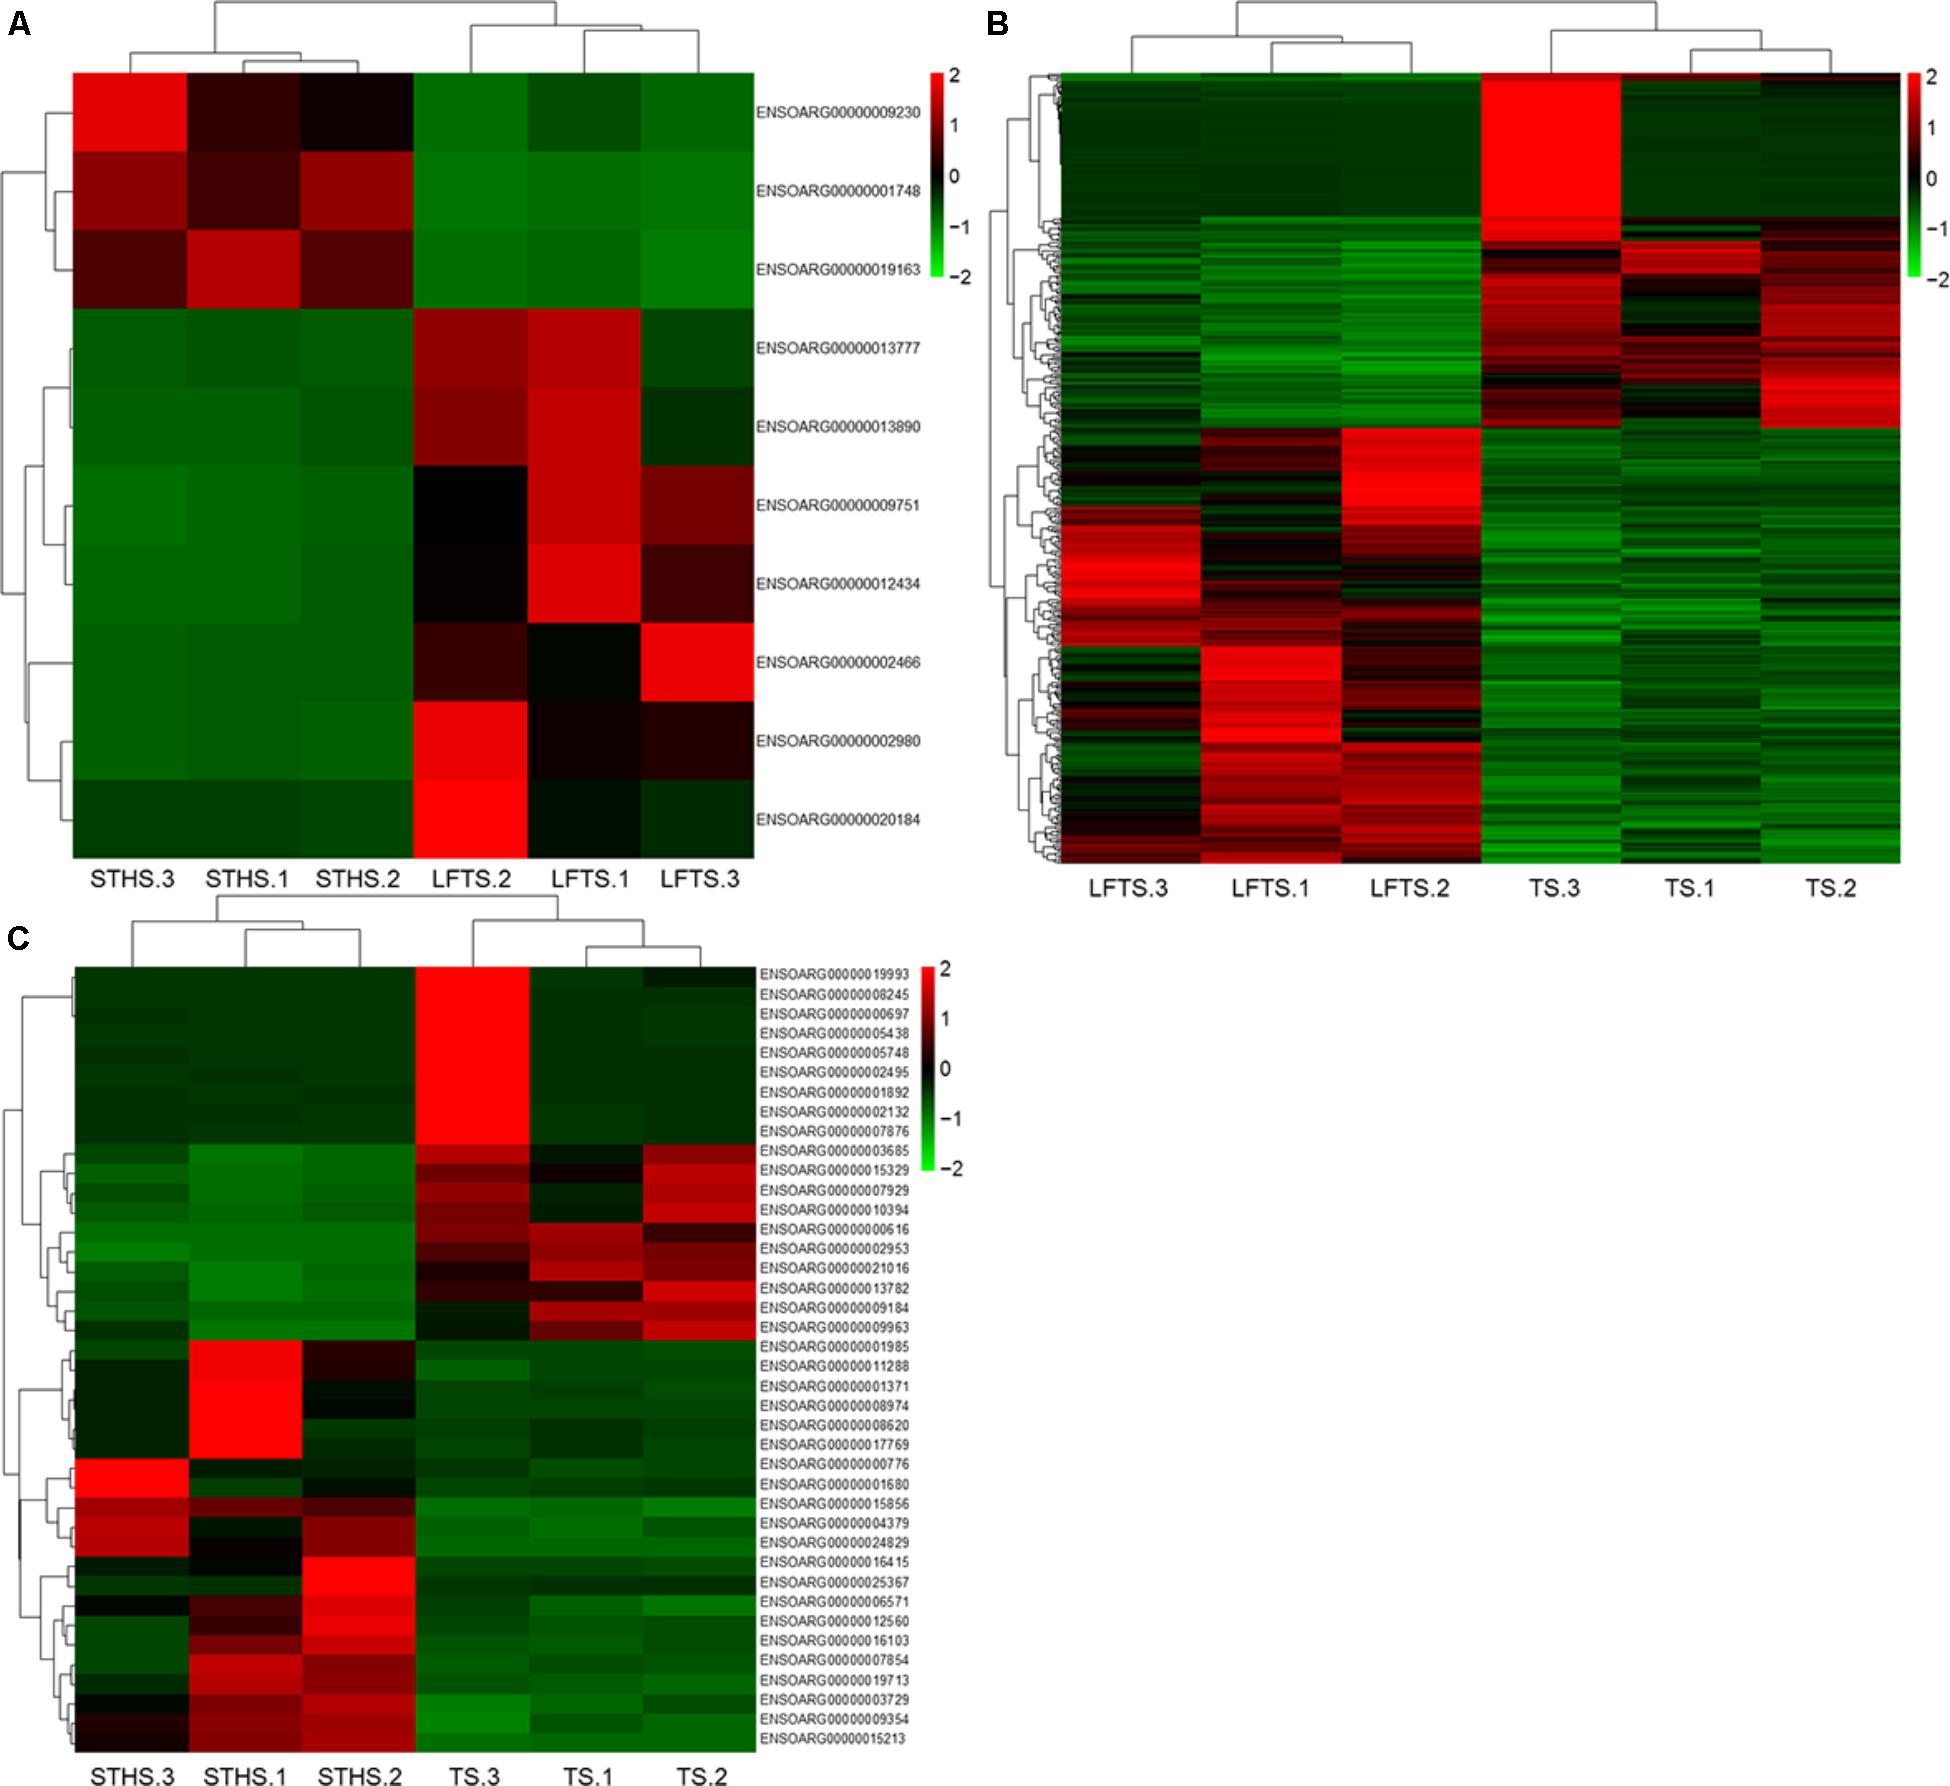
FIGURE 4. The hierarchical clustering of DEGs in LFTS vs. STHS (A), LFTS vs. TS (B), and STHS vs. TS (C).
By analysis, 68 differentially expressed lncRNAs were screened from the three comparisons. Among them, 37 differentially expressed lncRNAs (16 up-regulated and 21 down-regulated) were found between LFTS and STHS. Fifty-nine differentially expressed lncRNAs (31 up-regulated and 28 down-regulated) were found between LFTS and TS. There were 16 differentially expressed lncRNAs (eight up-regulated and eight down-regulated) between STHS and TS. The two common differentially expressed lncRNAs in the three comparisons were TCONS_00297891 and TCONS_00369087. Except for these two lncRNAs, there were 27 common differentially expressed lncRNAs in the LFTS vs. STHS and LFTS vs. TS, 11 common differentially expressed lncRNAs in LFTS vs. TS and STHS vs. TS, and 2 common differentially expressed lncRNAs in LFTS vs. TS and STHS vs. TS. Volcano plots were used to explore the relationship between the fold change and the significance (Figure 5). As lncRNAs could exert effects through cis- or trans-acting target genes, the neighboring (100 kb upstream or downstream) and/or complementary protein-coding genes of the differentially expressed lncRNAs from pairwise comparisons were predicted.
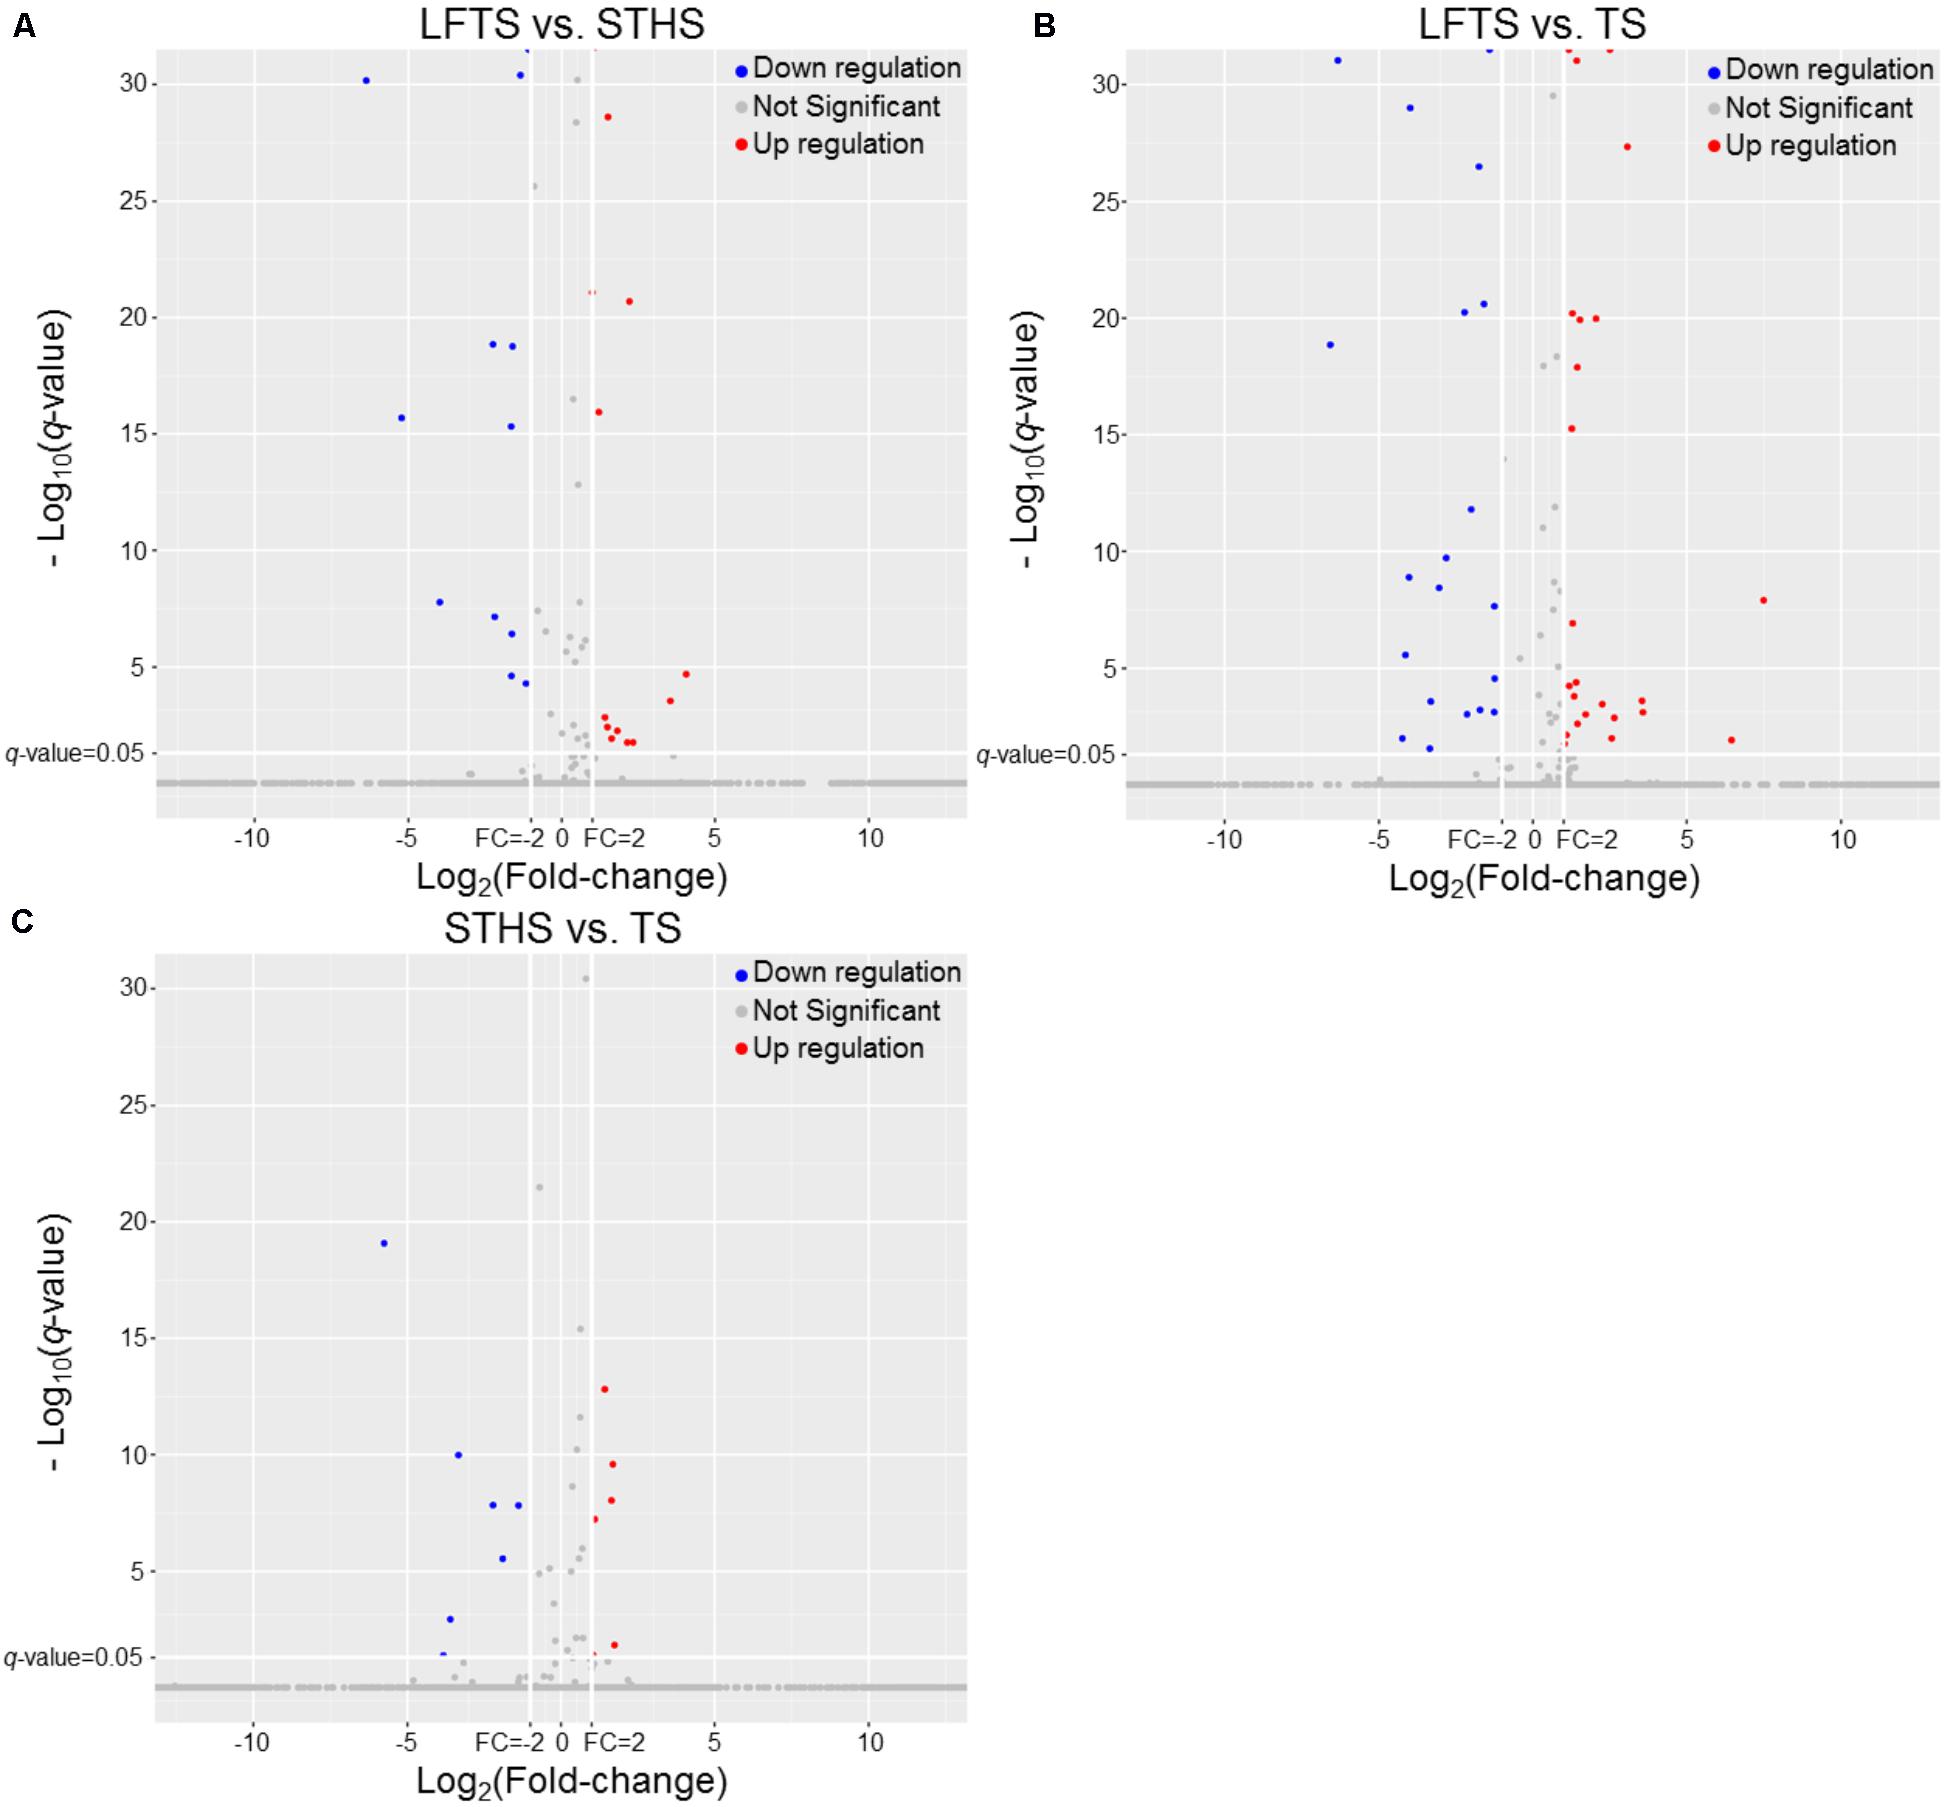
FIGURE 5. The volcano plot of lncRNAs expression levels in LFTS vs. STHS (A), LFTS vs. TS (B), and STHS vs. TS (C). The vertical lines correspond to twofold up and down and the horizontal line represents a q-value of 0.05. The red point represents up-regulated differentially expressed lncRNAs, the blue point represents down-regulated differentially expressed lncRNAs, and the gray point for no significant lncRNAs.
GO Analysis
The DEGs in the tail fat of LFTS vs. STHS, LFTS vs. TS, and STHS vs. TS were annotated (Supplementary Table S2). The top 30 GO terms (in descending order of the Richness factor) of the three groups are shown in Figure 6. The DEGs of LFTS vs. STHS were enriched in four GO terms, including organic cyclic compound binding, cell, catalytic activity, and cellular process. LFTS vs. TS DEGs were enriched in triglyceride biosynthetic process, sterol biosynthetic process, and cellular carbohydrate catabolic process. The DEGs of STHS vs. TS were majorly enriched in biological process including negative regulation of cell death and developmental growth.
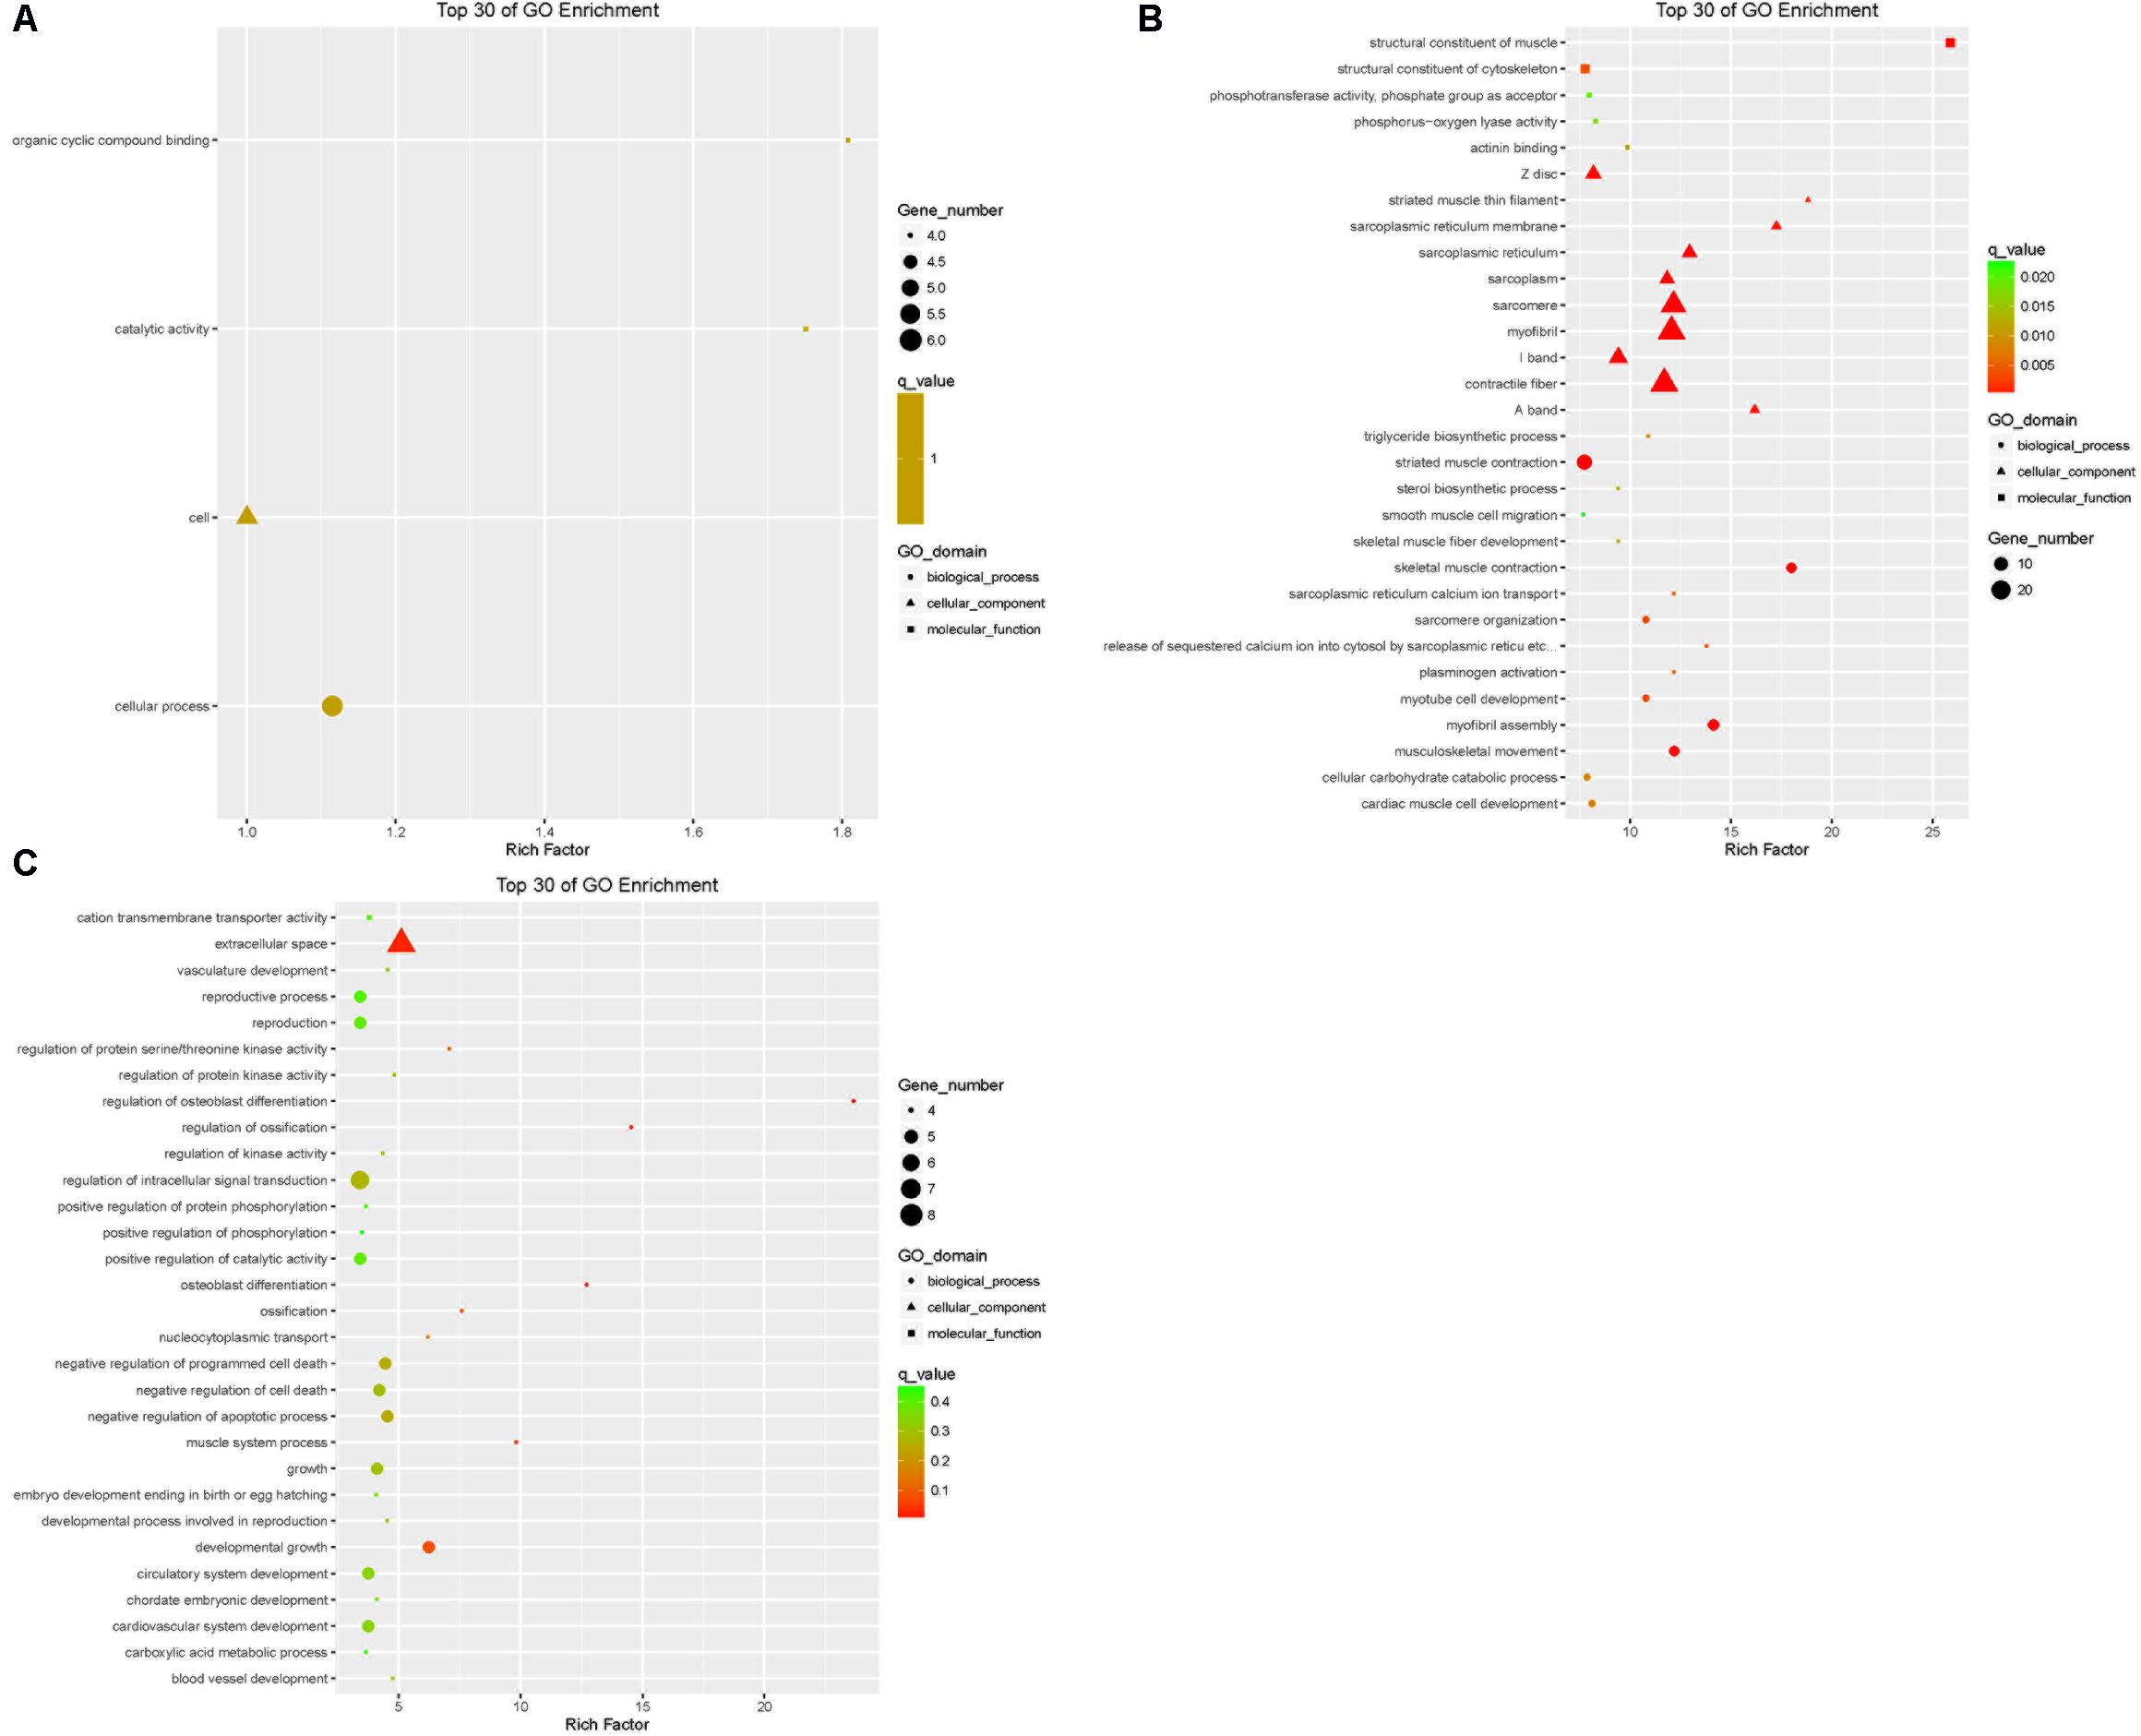
FIGURE 6. Top 30 of GO enrichment for DEGs from three groups of pairwise comparisons (A: LFTS vs. STHS, B: LFTS vs. TS, and C: STHS vs. TS). The x-axis presents rich factor of DEGs in a category. The y-axis shows the specific GO term.
The target genes of differentially expressed lncRNAs in the tail fat of LFTS vs. STHS, LFTS vs. TS, and STHS vs. TS were annotated and the top 30 GO terms (in descending order of the Richness factor) of the three groups are shown in Figure 7. The target genes of LFTS vs. STHS were significantly enriched in four GO terms, including nucleoside triphosphate biosynthetic process, apical part of cell, ATP biosynthetic process, and purine ribonucleoside monophosphate biosynthetic process. LFTS vs. TS target genes were significantly enriched in 33 GO terms, such as protein–DNA complex, protein dimerization activity, and transporter activity. The target genes of STHS vs. TS were significantly enriched in 23 GO terms which mainly related to transporter activity and protein activity.
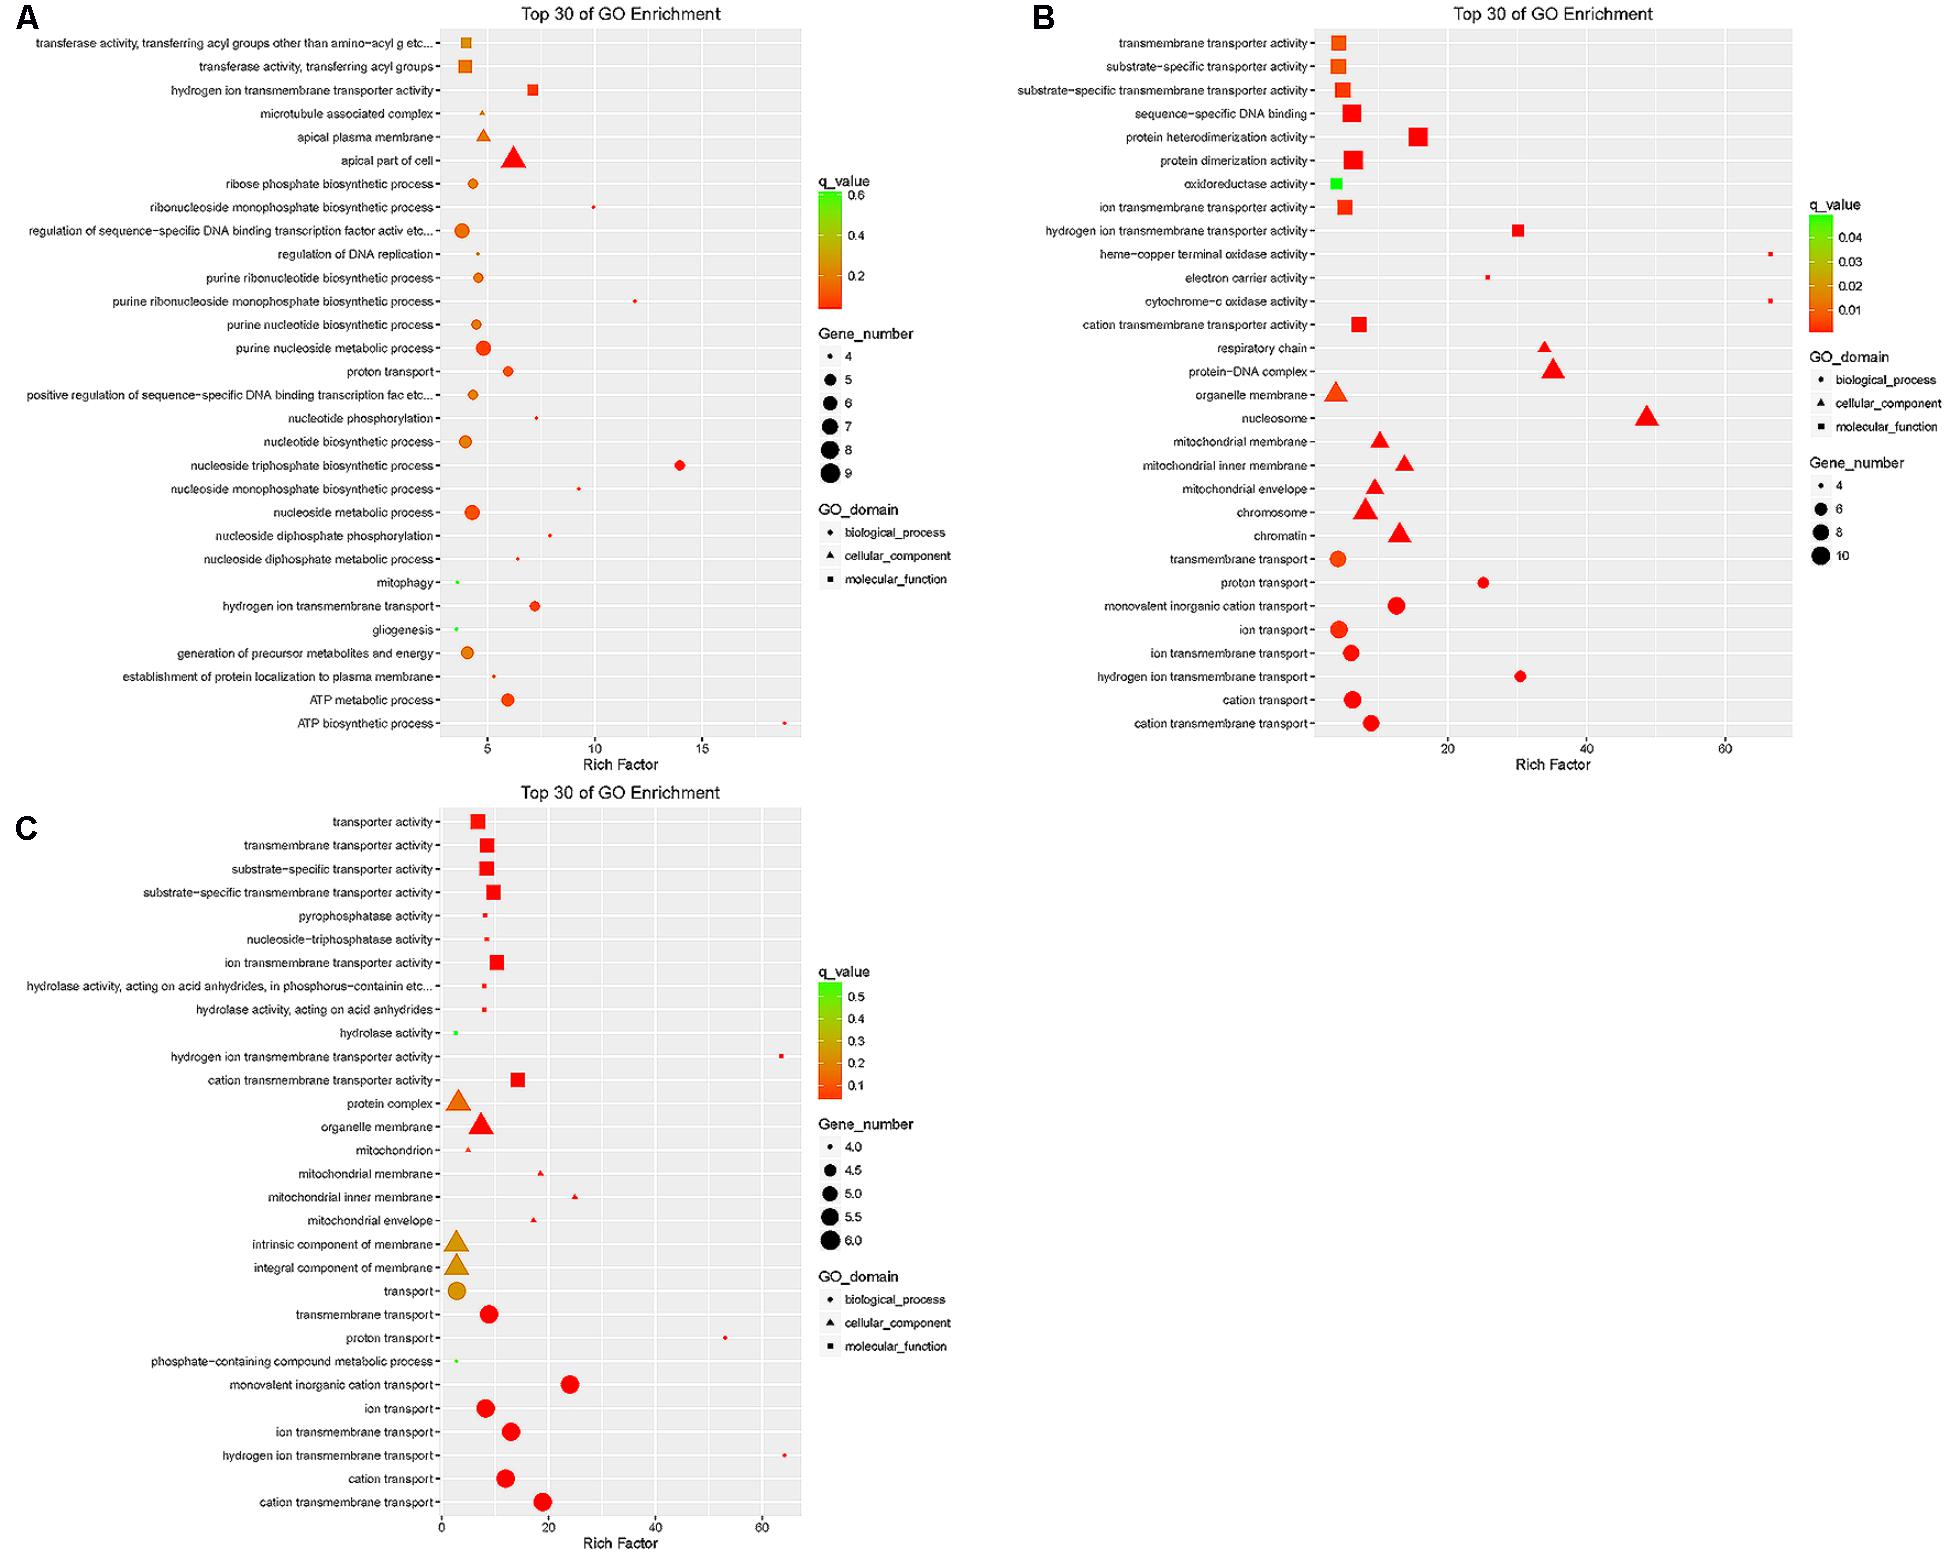
FIGURE 7. Top 30 of GO enrichment for target genes of differentially expressed lncRNAs from three groups of pairwise comparisons (A: LFTS vs. STHS, B: LFTS vs. TS, and C: STHS vs. TS). The x-axis presents rich factor of target genes in a category. The y-axis shows the specific GO term.
Pathway Analysis
Pathway annotation of DEGs was performed using the KEGG database (Supplementary Table S3). Pathway enrichment analysis showed that the DEGs of LFTS vs. STHS related mainly to metabolic processes such as arachidonic acid metabolism and metabolism of xenobiotics by cytochrome P450; the DEGs of LFTS vs. TS were enriched in pathways including regulation of lipolysis in adipocytes, steroid biosynthesis, fatty acid metabolism, fatty acid elongation, and biosynthesis of unsaturated fatty acids; the pathways related to fat which the STHS vs. TS DEGs were enriched in included the adipocytokine signaling pathway, cGMP-PKG signaling pathway, and Jak-STAT signaling pathway (Figure 8).
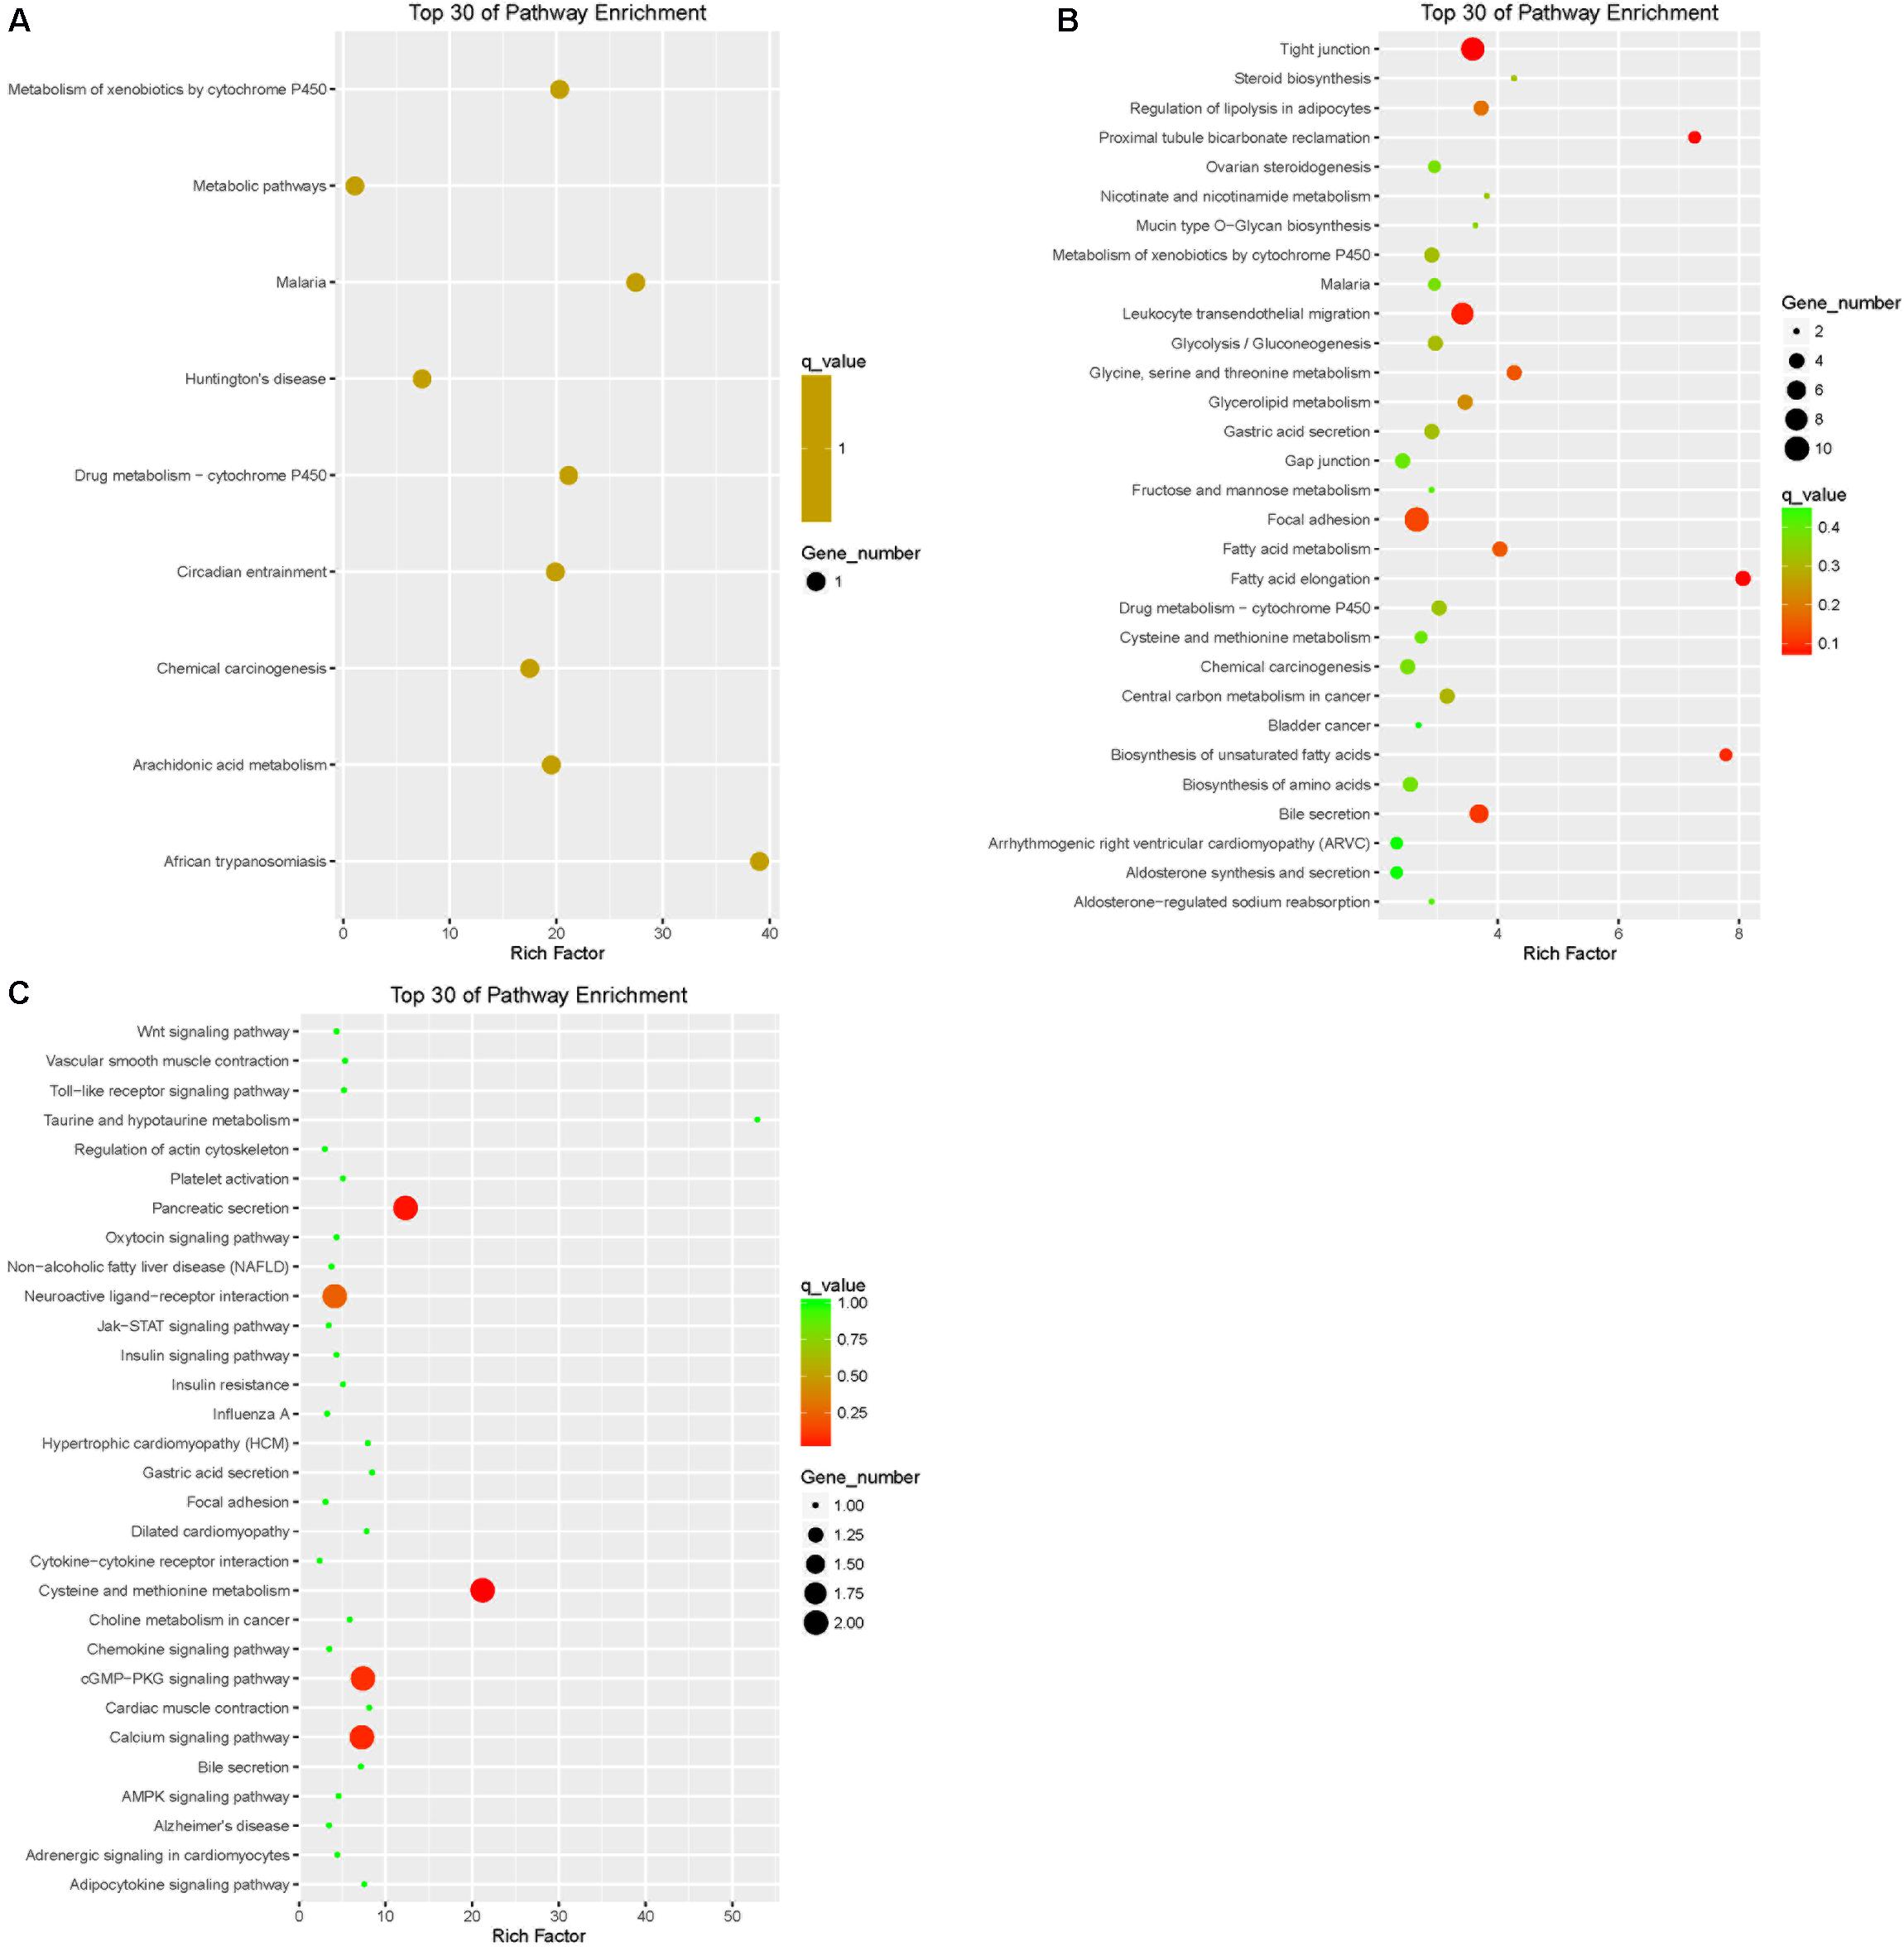
FIGURE 8. Top 30 of KEGG pathways enrichment for DEGs from three groups of pairwise comparisons (A: LFTS vs. STHS, B: LFTS vs. TS, and C: STHS vs. TS). The x-axis presents rich factor of DEGs in a category. The y-axis shows the specific pathway.
Pathway annotation and enrichment of target genes of differentially expressed lncRNAs were performed using the KEGG database. The results showed that the target genes of differentially expressed lncRNAs of LFTS vs. STHS were majorly related to oxidative phosphorylation; the target genes of LFTS vs. TS were abundant in pathways including fatty acid elongation and fatty acid metabolism; and the pathways which the STHS vs. TS target genes were mainly enriched were in fatty acid elongation (Figure 9).
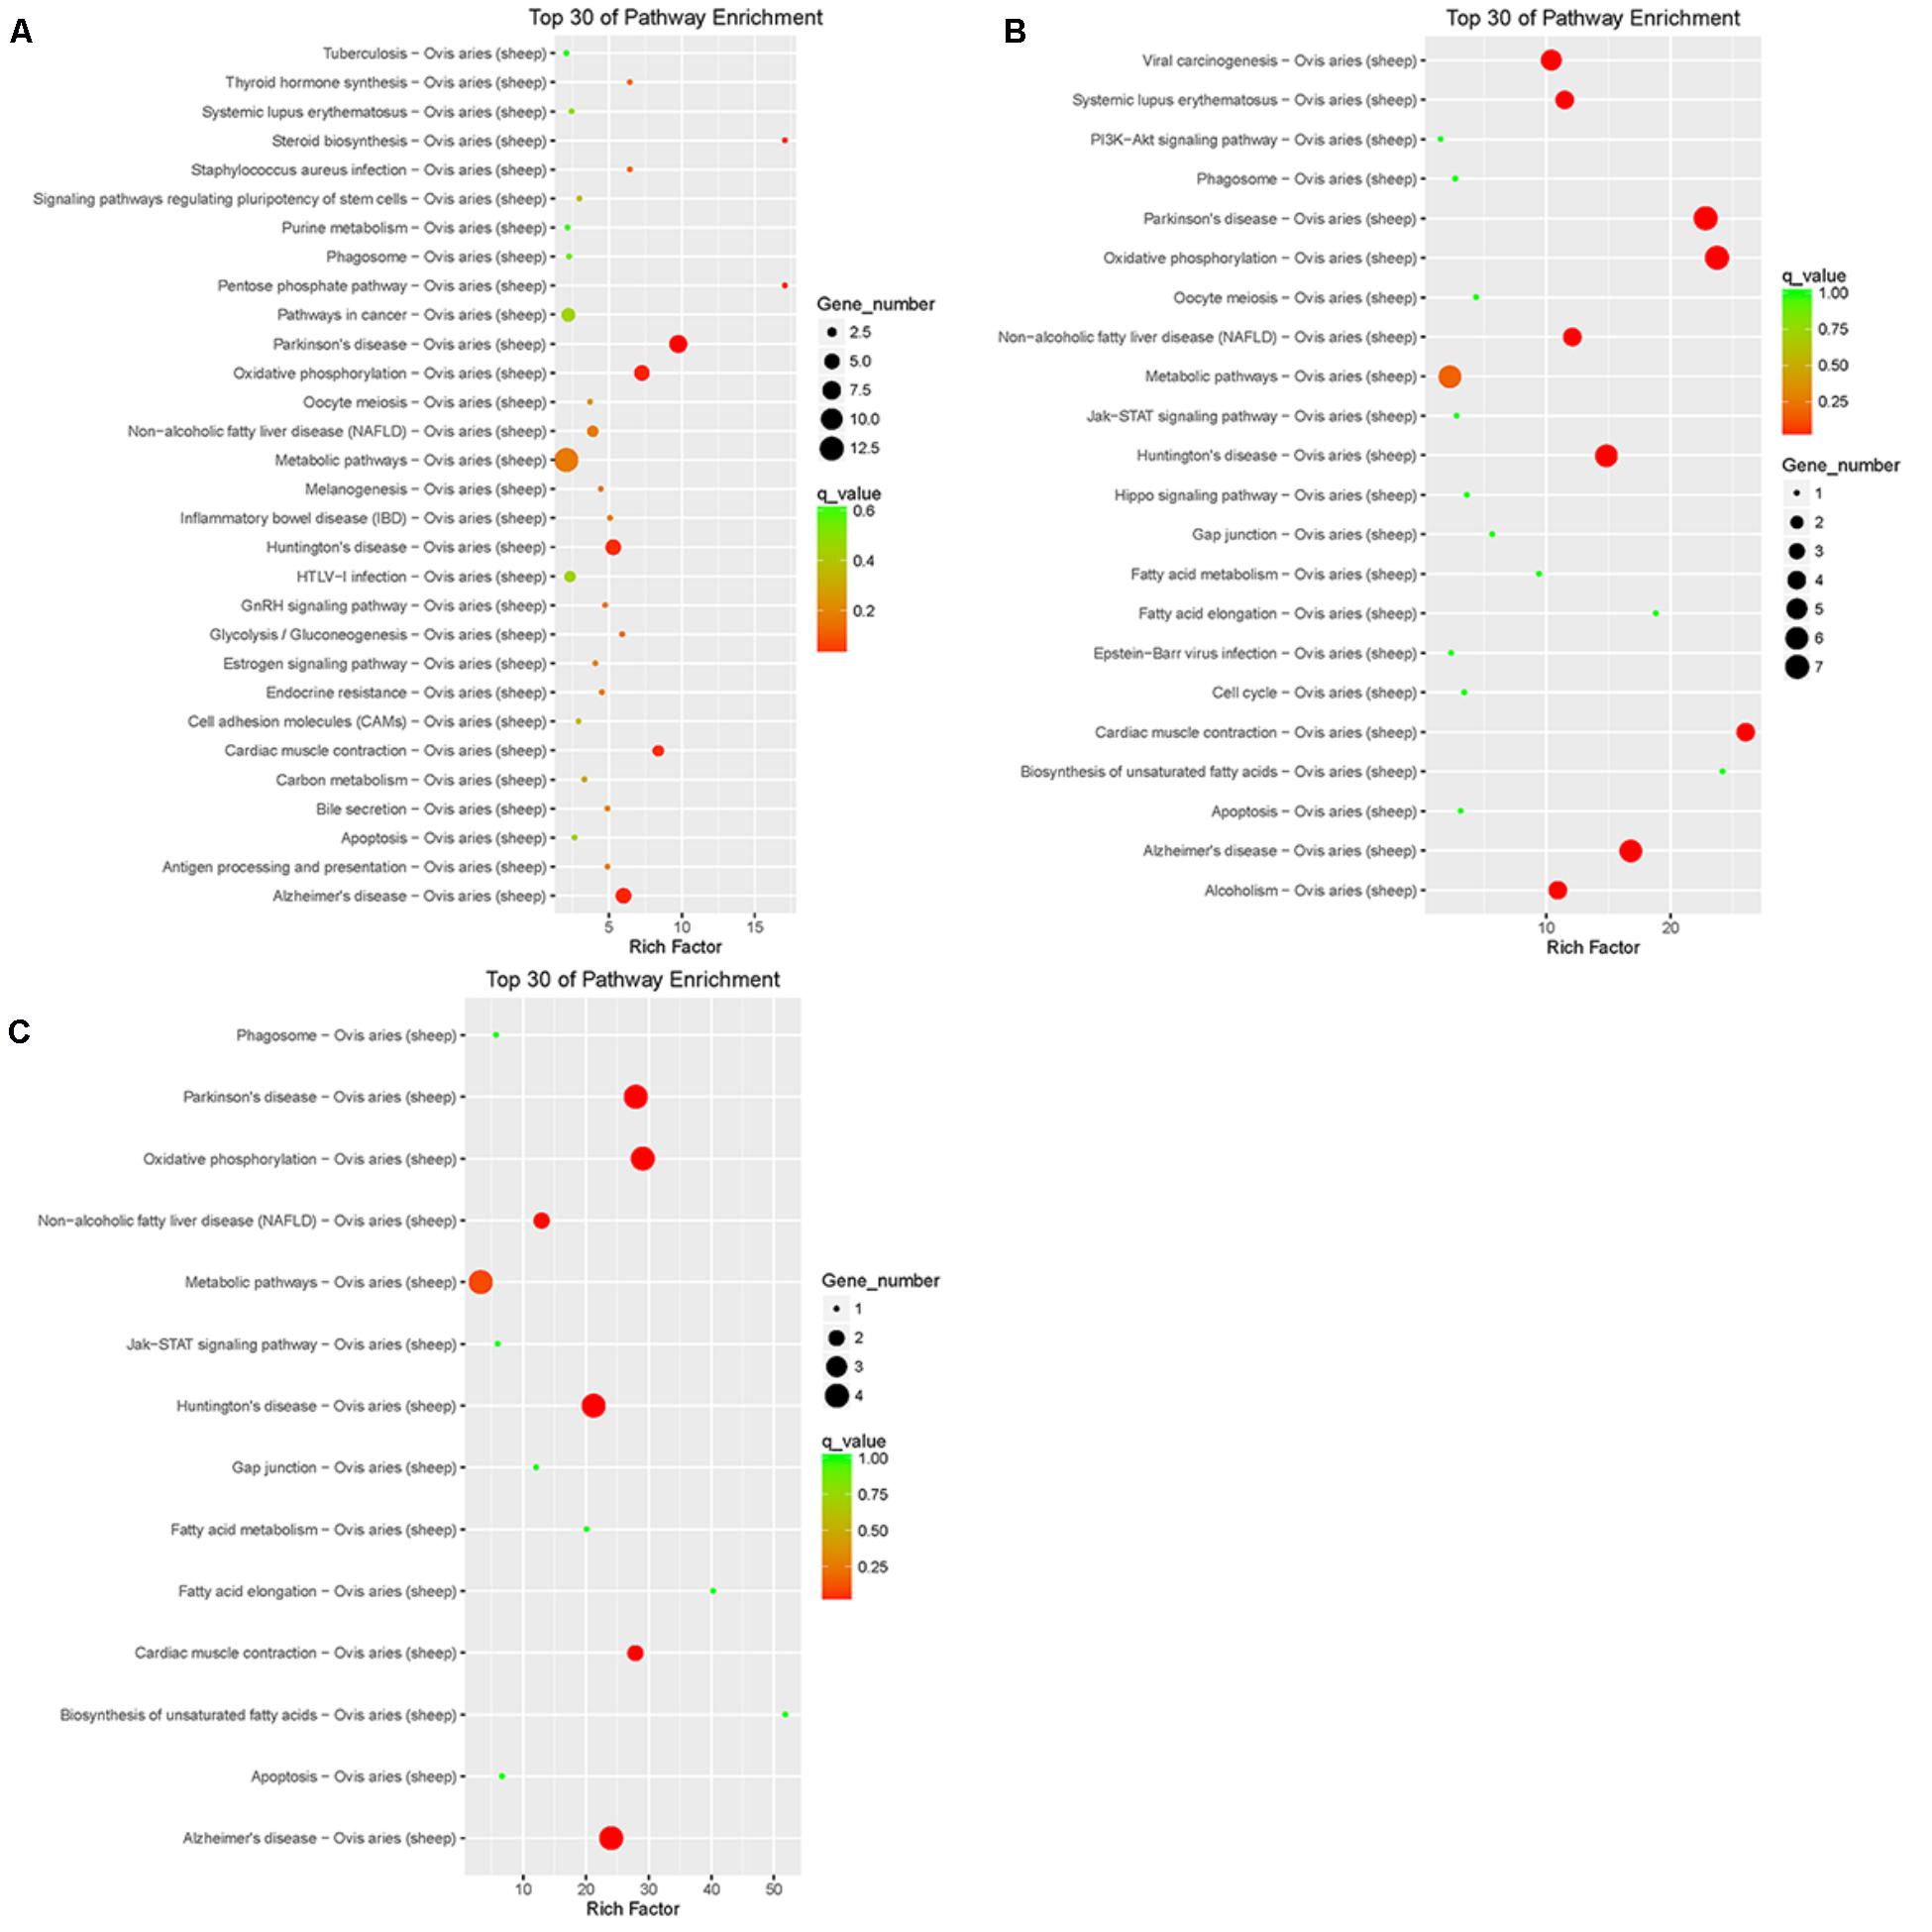
FIGURE 9. Top 30 of KEGG pathways enrichment for target genes of differentially expressed lncRNAs from three groups of pairwise comparisons (A: LFTS vs. STHS, B: LFTS vs. TS, and C: STHS vs. TS). The x-axis presents rich factor of target genes in a category. The y-axis shows the specific pathway.
Validation of RNA-Seq Data by qRT-PCR
To validate the RNA-Seq data, DEGs and differentially expressed lncRNAs related to adipocyte accumulation were, respectively, selected in LFTS vs. STHS, LFTS vs. TS, and STHS vs. TS. In total, 14 and 6 DEGs and lncRNAs, respectively, underwent qRT-PCR analysis. The qRT-PCR results of the DEGs and differentially expressed lncRNAs were in agreement with the RNA-Seq data, indicating that the two results validated each other (Figures 10, 11). Compared with STHS, the DEGs FMO2 and PENK were up-regulated, whereas DPT and RASD1 were down-regulated in the LFTS, where DPT showed significant differential expression (p-value < 0.05) and RASD1 showed very significant differential expression (p-value < 0.01). Compared with TS, the DEGs MID1IP1, PRKAR2B, and ELOVL3 were up-regulated, whereas PDK4, PLIN2, and TCAP were down-regulated in the LFTS, where PLIN2 showed significant differential expression (p-value < 0.05) and PDK4 showed very significant differential expression (p-value < 0.01). Compared with TS, the DEGs SLC22A4 and LTF were up-regulated, whereas ADGRG3 and LEPR were down-regulated in the STHS, where SLC22A4 showed significant differential expression (p-value < 0.05).
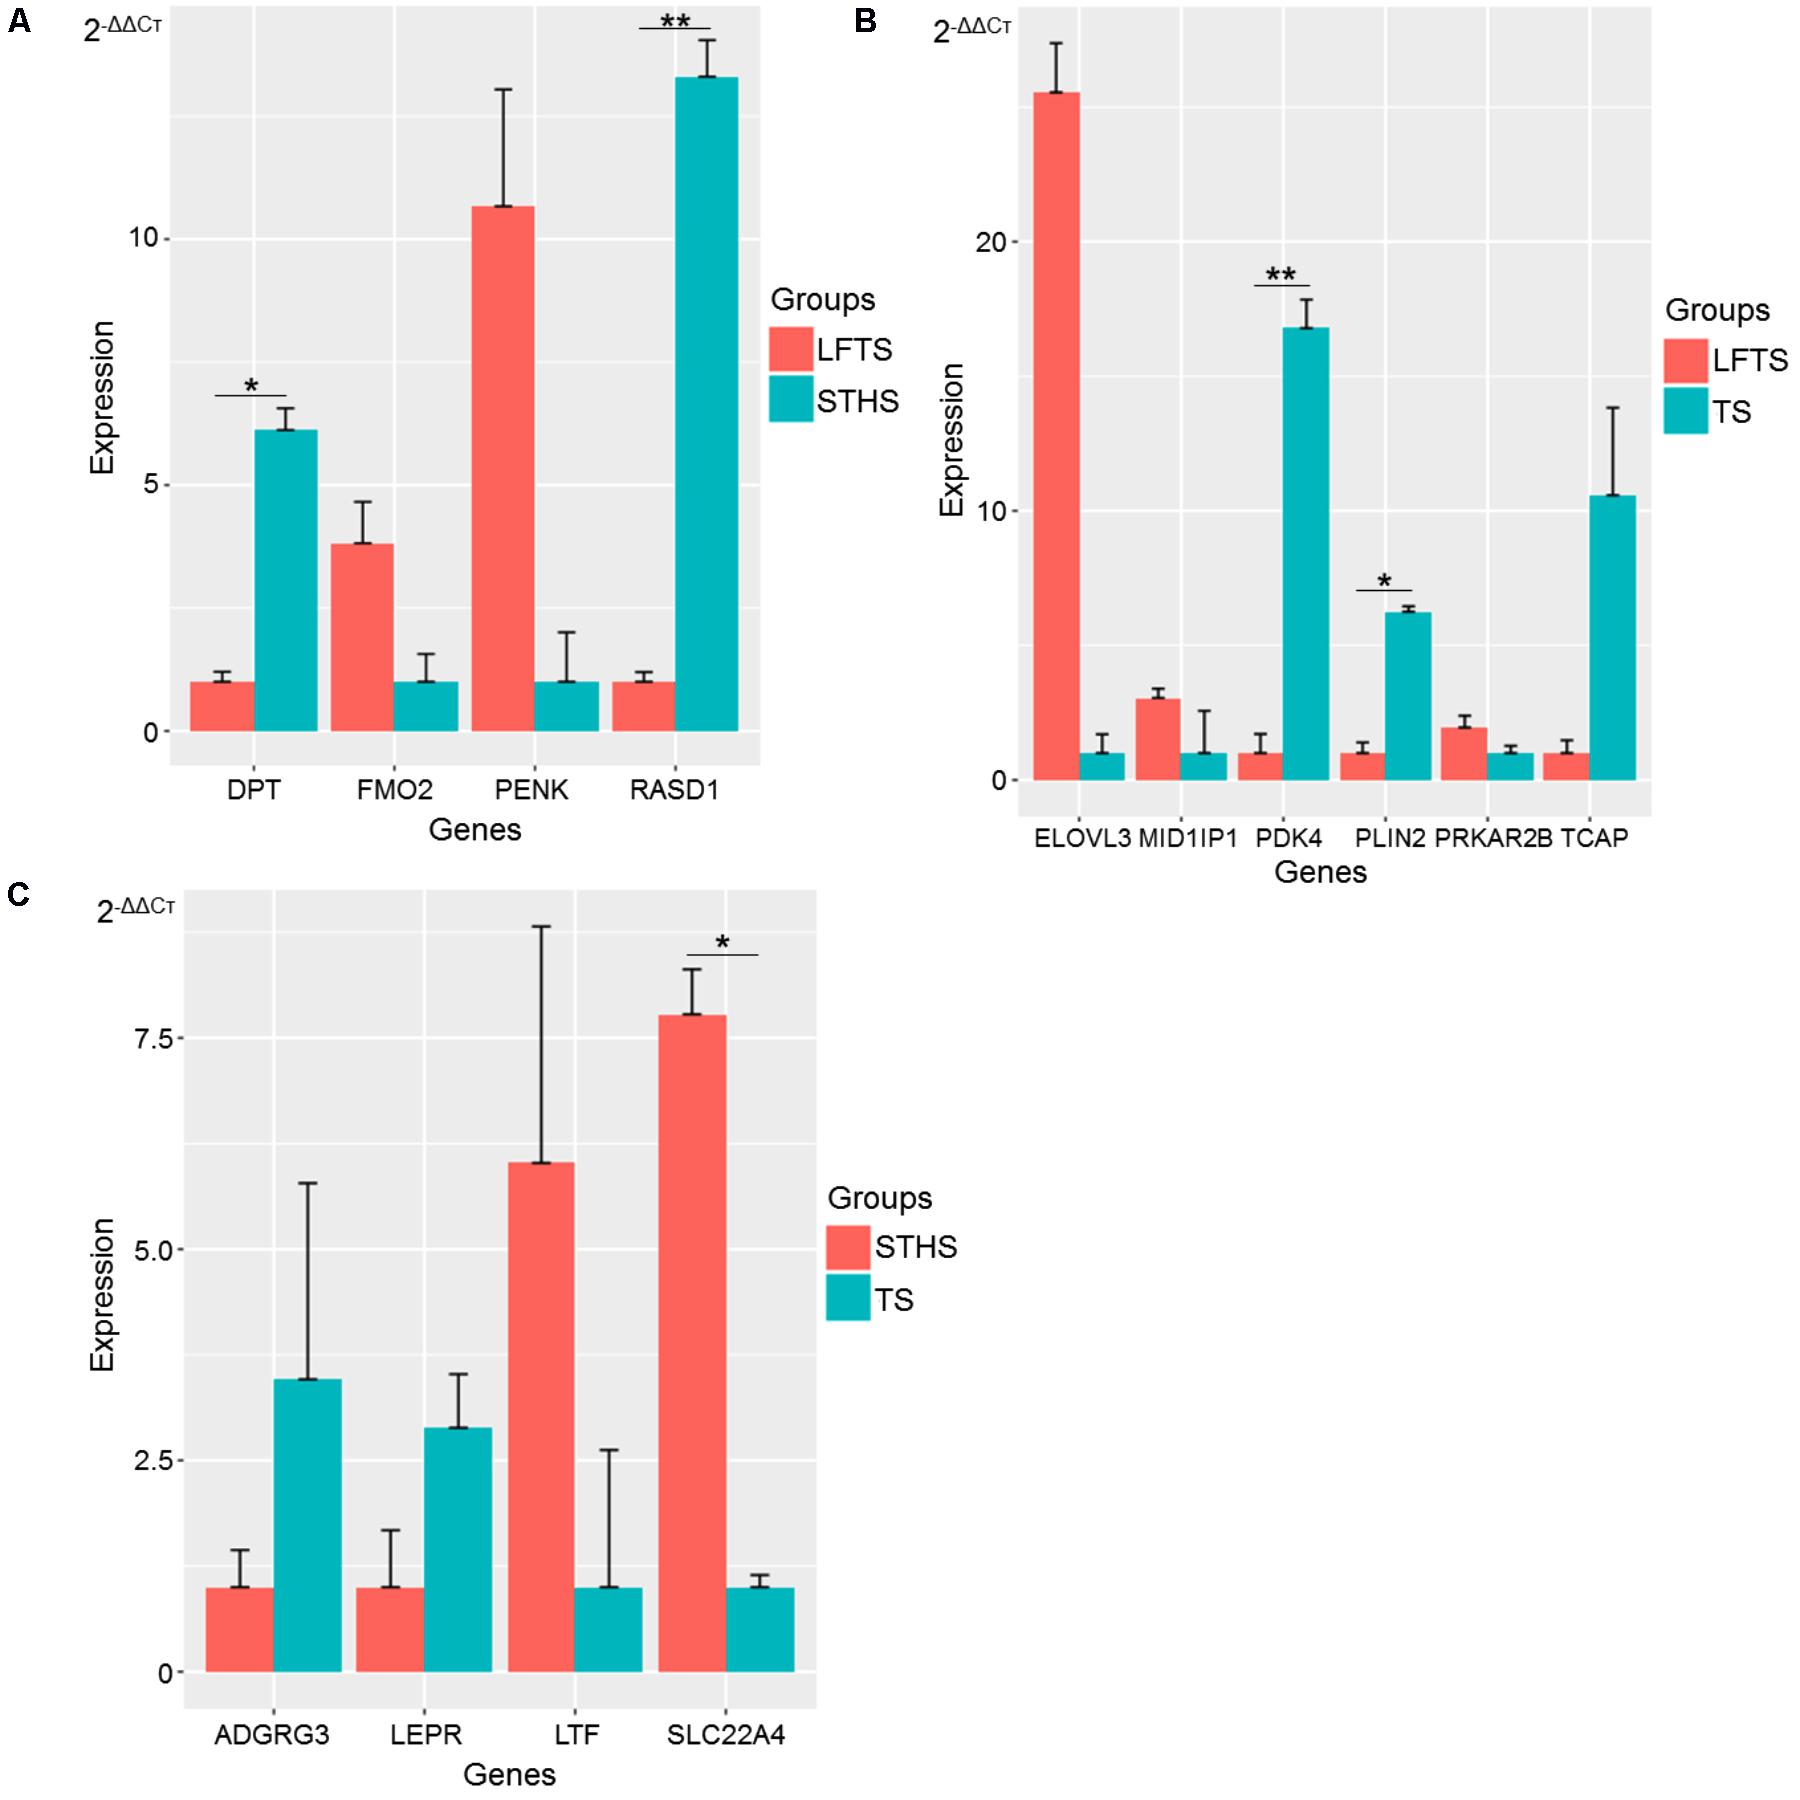
FIGURE 10. Validation of DEGs from three groups of pairwise comparisons by qRT-PCR (A: LFTS vs. STHS, B: LFTS vs. TS, and C: STHS vs. TS). The data presented in y-axis indicate genes expression as determined by qRT-PCR. ∗p-value < 0.05; ∗∗p-value < 0.01.
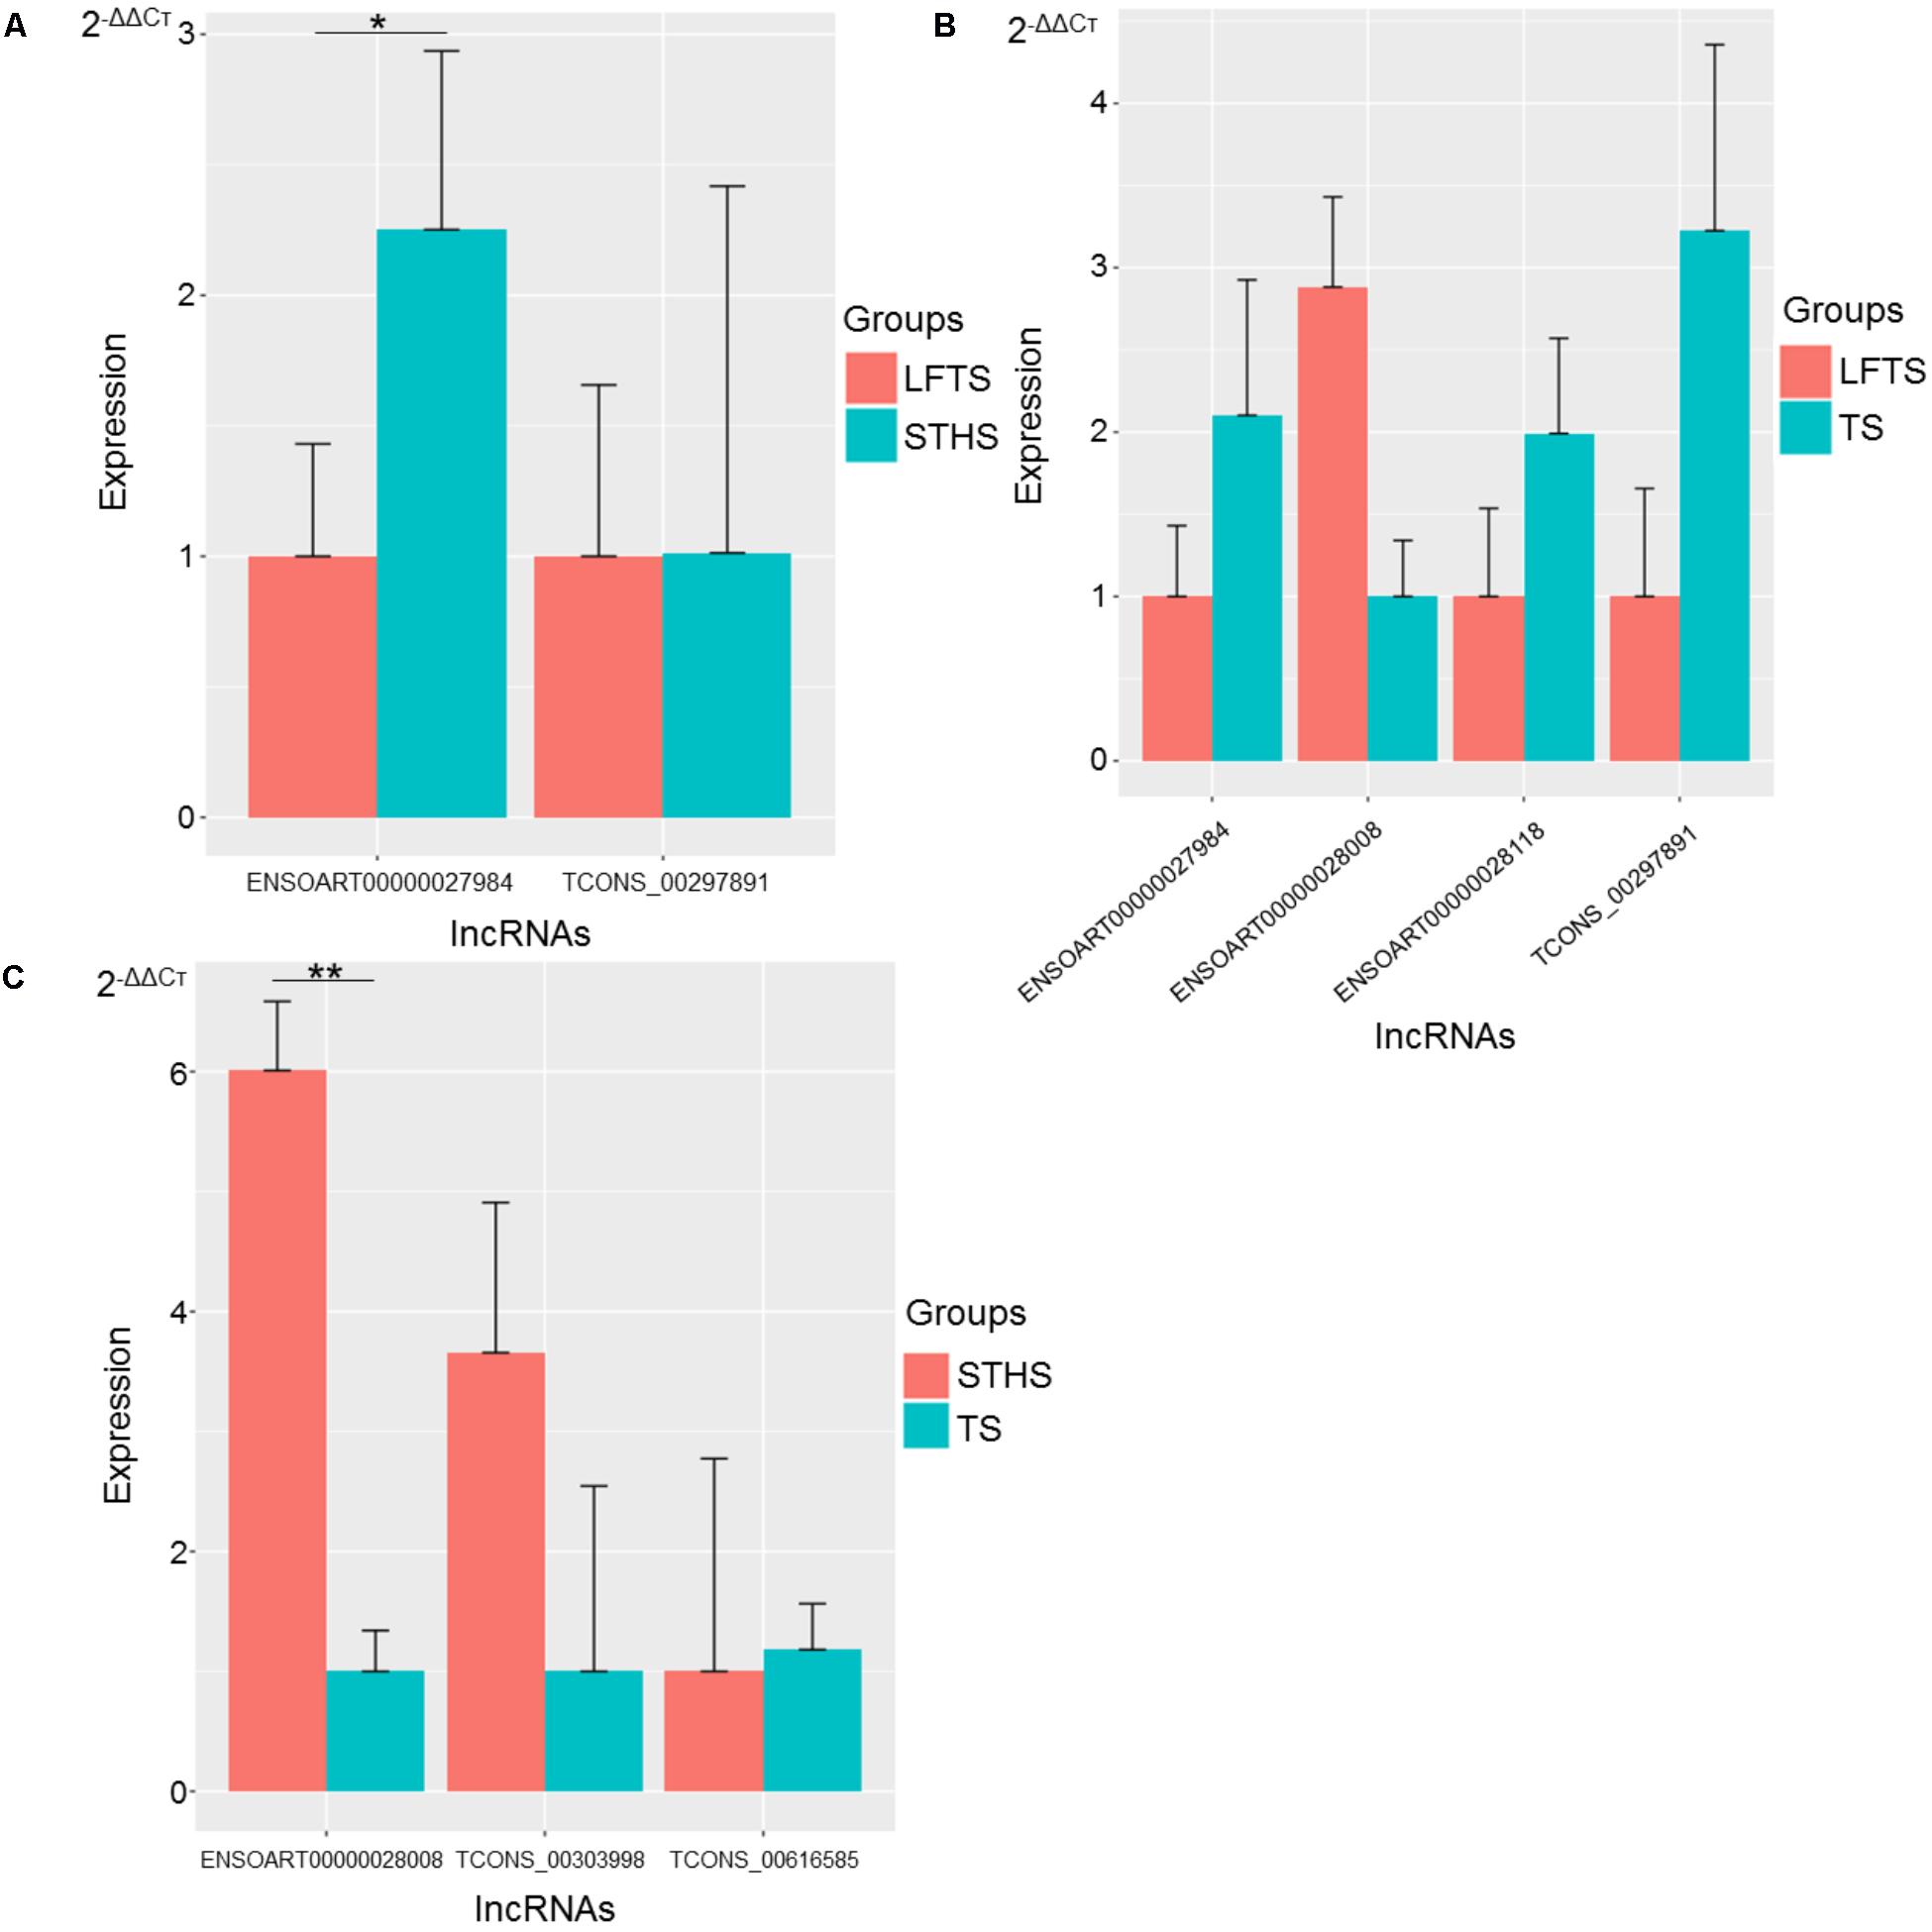
FIGURE 11. Validation of differentially expressed lncRNAs from three groups of pairwise comparisons by qRT-PCR (A: LFTS vs. STHS, B: LFTS vs. TS, and C: STHS vs. TS). The data presented in y-axis indicate lncRNAs expression as determined by qRT-PCR. ∗p-value < 0.05; ∗∗p-value < 0.01.
For lncRNAs, compared with STHS, the differentially expressed lncRNAs ENSOART00000027984 and TCONS_00297891 were down-regulated in the LFTS, where ENSOART00000027984 showed significant differential expression (p-value < 0.05). Compared with TS, the differentially expressed lncRNA ENSOART00000028008 was up-regulated, whereas ENSOART00000027984, ENSOART00000028118, and TCONS_00297891 were down-regulated in the LFTS. Compared with TS, the differentially expressed lncRNAs ENSOART0 0000028008 and TCONS_00303998 were up-regulated, whereas TCONS_00303998 was down-regulated in the STHS, where ENSOART00000028008 showed significant differential expression (p-value < 0.01).
The expression levels of these genes and lncRNAs as determined by qRT-PCR were consistent with the RNA-Seq data, which validated the accuracy of the RNA-Seq data.
Network Construction Based on DEGs and Differentially Expressed lncRNAs in Tail Fat of Sheep
Using the screened differential expression mRNA and lncRNA of tail fat of sheep for co-expression analysis, 493 pairs of significant co-expression pairs were obtained, and most were positively correlated (COR ≥ 0.7, 475 pairs) while a few were negatively correlated (COR ≤-0.7, 18 pairs). Using the screened mRNA–lncRNA pairs to construct a co-expression network, it was found that some lncRNAs interact with more than 50 mRNA, for example, 67 mRNA co-expressed with TCONS_00372767, TCONS_00171926, and TCONS_00054953, respectively, and 65 mRNA co-expressed with TCONS_00373007, indicating that these lncRNAs belong to the core lncRNAs and have important regulatory effects on tail fat deposition (Figure 12).
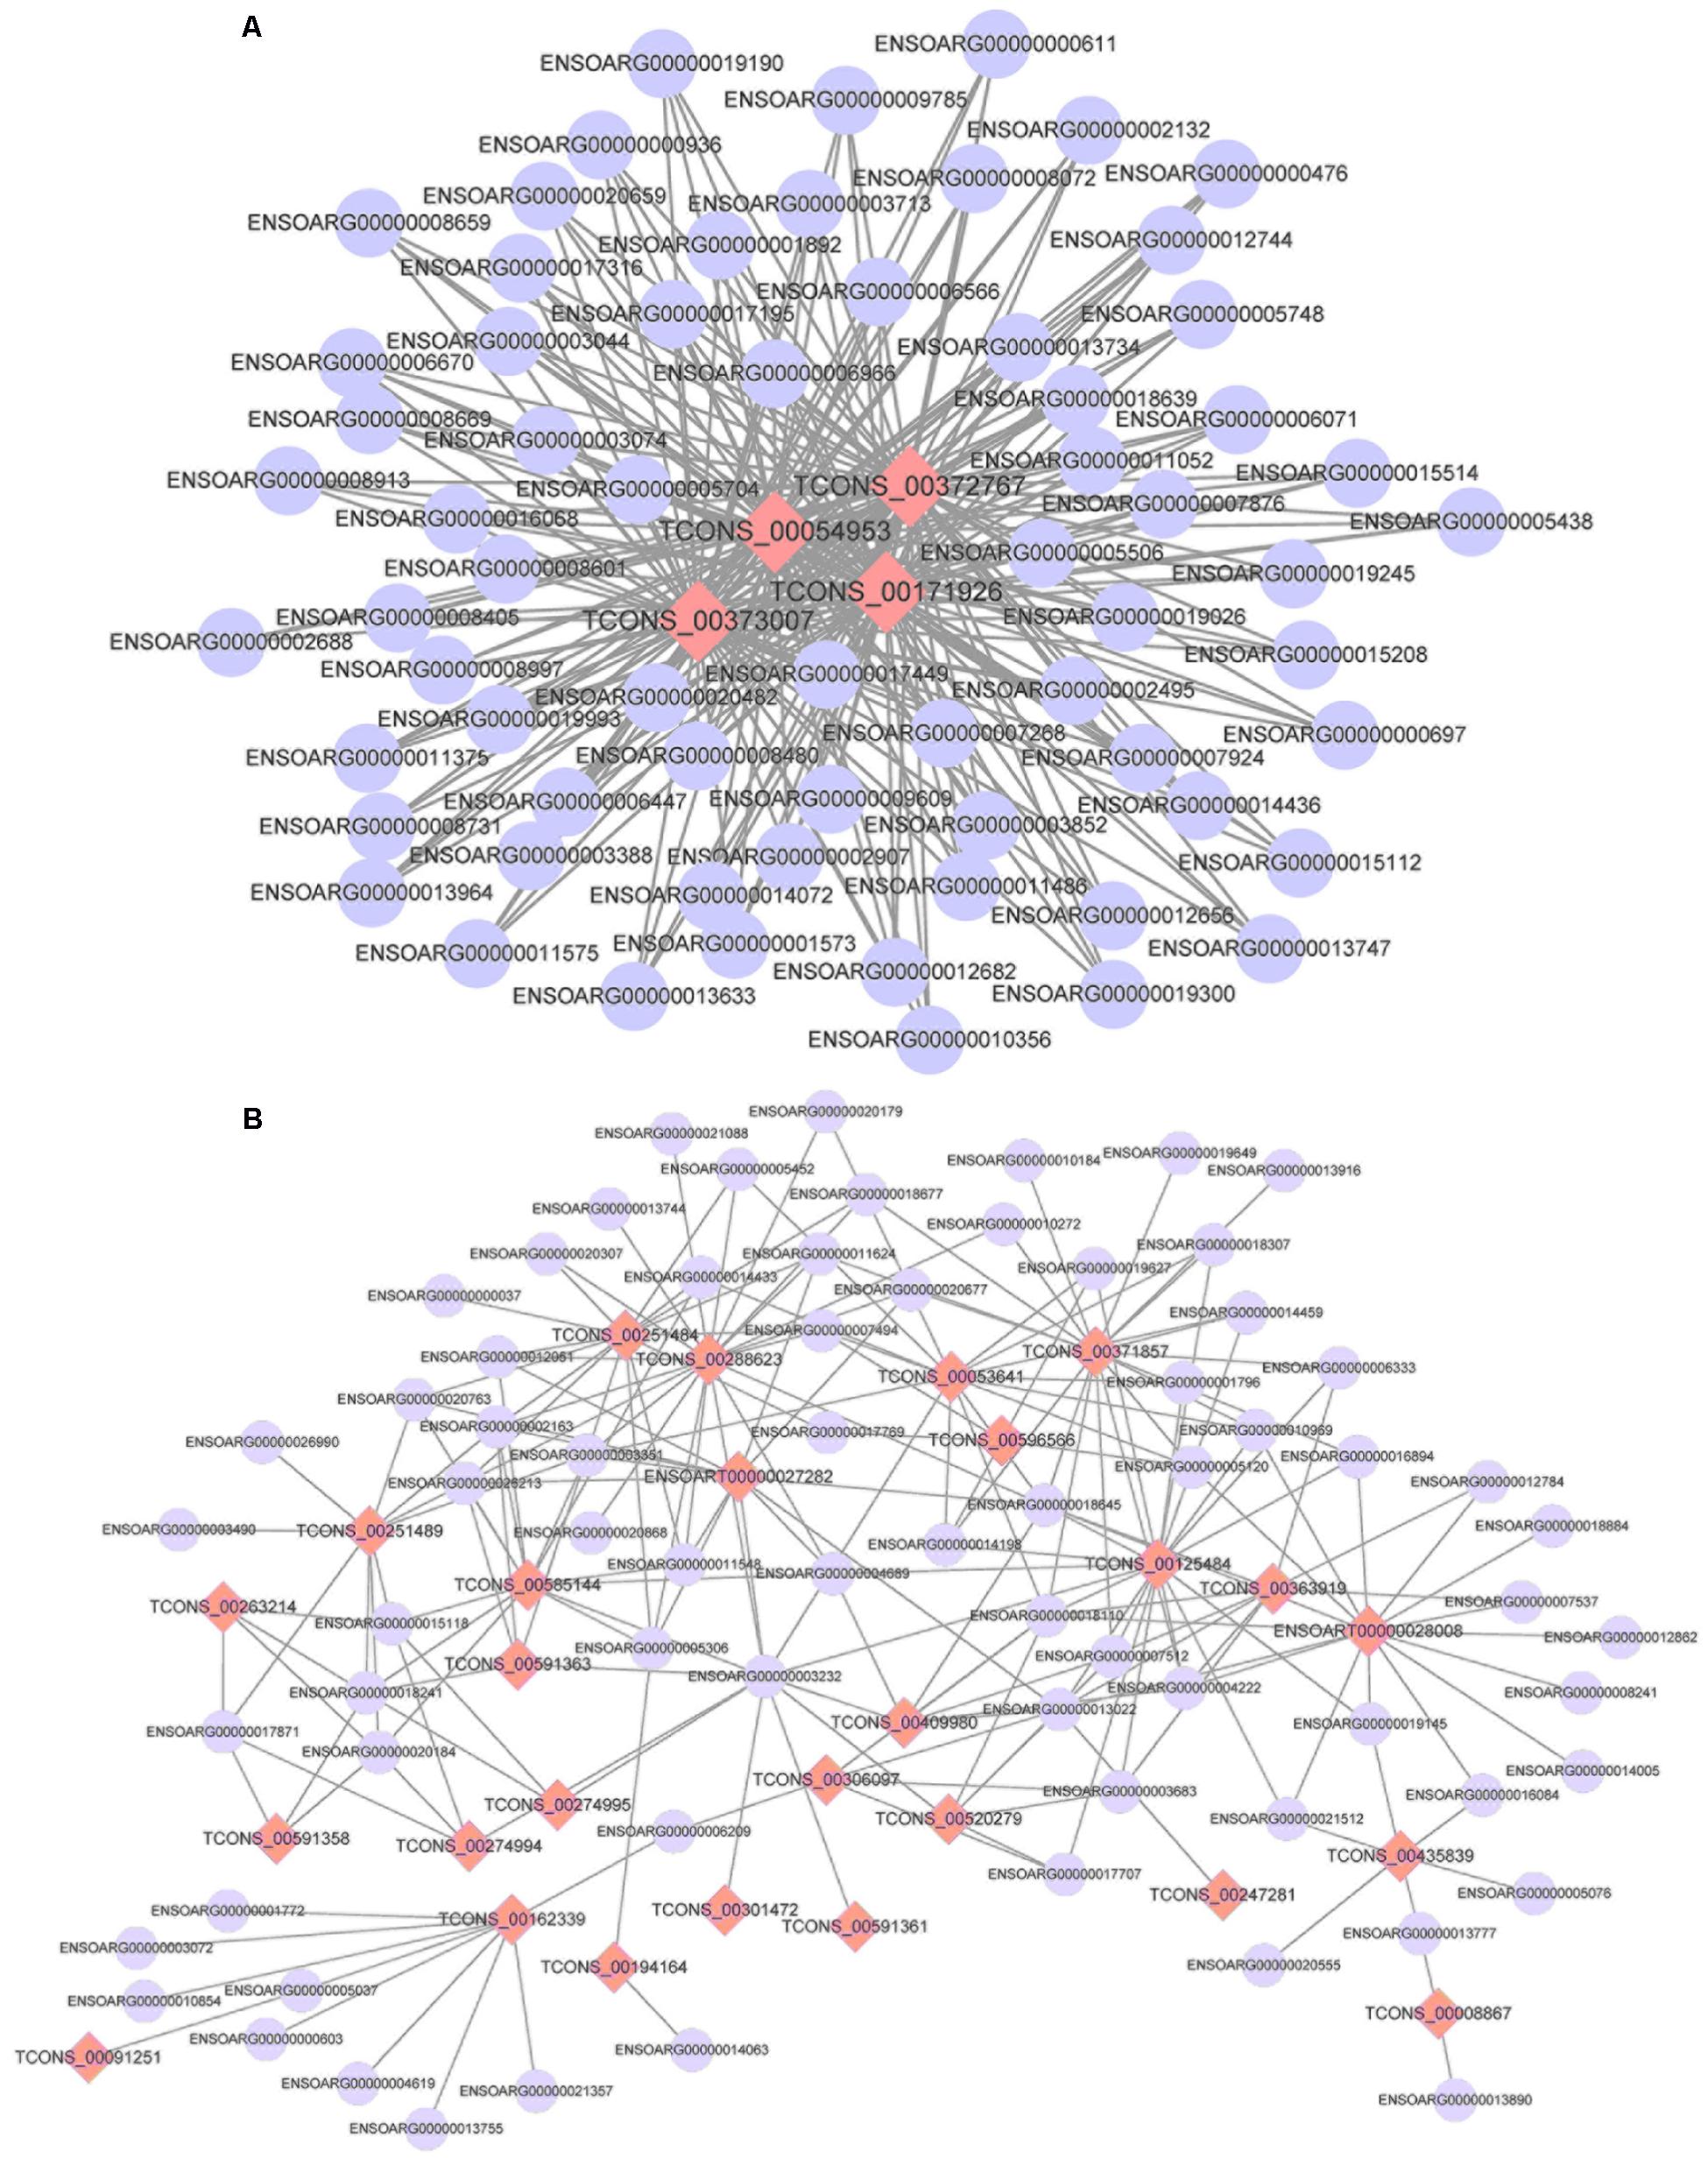
FIGURE 12. The co-expression networks of differentially expressed lncRNAs and DEGs (A: 4 lncRNAs and 67 mRNA and B: 27 lncRNAs and 71 mRNA).
Discussion
Transcriptome sequencing is the preferred biotechnique to analyze gene expression and reveal biological characteristics. Herein, we used tail fat from LFTS, STHS, and TS, which are unique Chinese sheep breeds, to explore the mechanism underlying the different tail phenotypes. Strand-specific RNA sequencing was performed to systematically identify mRNA and lncRNAs in different tail fat tissues. In this study, 407 DEGs were identified from the three comparison pairs and were significantly enriched in 120 GO terms and pathways. Furthermore, 68 differentially expressed lncRNAs were screened and the target genes of these lncRNAs were predicted. Further 493 significant co-expression pairs based on DEGs and differentially expressed lncRNAs were constructed to reveal their function.
We identified 9,082 lncRNAs from tail fat of LFTS, STHS, and TS, and most of them belong to intergenic lncRNAs. LncRNAs from tail fats are relatively abundant compared with these from other tissues, such as 6,924 and 5,602 lncRNAs from muscle and blood samples of Hu sheep, respectively (Zhang et al., 2017; Feng et al., 2018). The tail fat lncRNAs also share several typical characters with other mammalian lncRNAs. Compared with mRNA, the tail fat lncRNAs have relatively lower expression levels, while the length of lncRNAs was similar to that of mRNA. These similarities support that the lncRNAs identified in this study were reliable. To our knowledge, this study presents the first systematic genome-wide analysis of lncRNAs in tail fat of sheep, providing a valuable resource for functional lncRNAs associated with sheep tail fat deposition.
Of the 407 DEGs, a large proportion of key genes were involved in fat deposition, adipogenesis, and fatty acid biosynthesis, including FMO2, PLIN2, PLIN3, LEPR, PENK, ELOVL3, ELOVL5, PDK4, and SLC22A4.
Based on GO and pathway analyses of DEGs in LFTS and STHS, flavin-containing monooxygenases (FMOs) were enriched in four GO terms influencing fat metabolism. FMOs catalyze the NADPH-dependent oxidative metabolism of many structurally diverse foreign chemicals. Mice lacking FMOs 1, 2, and 4 exhibit a lean phenotype and despite similar food intake, weigh less and store less triglycerides in their white adipose tissue compared to wild-type mice (Veeravalli et al., 2014). FMO2 and FMO3 are members of the FMO gene family and FMO3 was identified by a recent comparative genomic study between fat- and thin-tail sheep using RNA-Seq data with respect to adipose tissues from Wang et al. (2014).
Through GO enrichment of LFTS vs. TS, DEGs enriched in fatty acid elongation, biosynthesis of unsaturated fatty acids, and fatty acid biosynthesis pathways were found to be up-regulated. Previous studies have shown that breed effect was significant on fatty acid composition of fat tail (Unsal and Aktas, 2003; Moharrery, 2007; Alipanah and Kashan, 2011). Four DEGs were enriched in the triglyceride biosynthetic process including three up-regulated genes (PCK1, GPAM, and LDLR). This could indicate that the fat accumulation of LFTS was more than that in TS, leading to rapid fat metabolism. Moreover, ELOVL3, ELOVL5, PLIN2, PLIN3, NR4A1, and KLF4 genes were differentially expressed between LFTS vs. TS. ELOVL, PLIN, and KLF gene families were identified to be possibly associated with tail fat deposition (Miao et al., 2015b). NR4A1 and KLF7 were reported to be associated with adipocyte differentiation (Duszka et al., 2012; Zhang Z. et al., 2013). This suggested that these DEGs are possibly related to fat deposition in the tails of sheep.
In the comparative analysis of STHS and TS, the GO enrichment term “negative regulation of cell death” was focused on. Among the DEGs, IGF1, SERP2, and CITED1 were up-regulated, whereas ALB and ACTC1 were down-regulated in STHS. The other GO term was related to growth and included up-regulated genes (NPK, SERP2, DHCR7, and IGF1) in STHS. IGF1 stimulates both the proliferation and differentiation of pre-adipocytes in cell culture (Duffield et al., 2008). Furthermore, CITED1 gene promotes cell proliferation and migration, and it is also a marker gene when browning of white adipocytes was induced (Choi et al., 2018; Xia et al., 2018). In addition, SLC22A4 was differentially expressed between STHS and TS, and SLC27A6 was identified as a candidate gene in tail fat development (Kang et al., 2017). SLC22A4 and SLC27A6 have similar functions. This suggests that SLC22A4 genes are possibly related to the fat-tail dimensions in sheep.
In this study, 68 differently expression lncRNAs were identified and the target genes of these lncRNAs were predicted. The results showed that the target genes were principally enriched in the GO term associated with mitochondria and transmembrane transport, such as mitochondrial inner membrane and transporter activity. The target genes also were mostly enriched in oxidative phosphorylation and non-alcoholic fatty liver disease (NAFLD). The most commonly enriched target genes were ATP6, ATP8, COIII, COXl, COX2, FHLl, SLC24A2, ALDOA, and ND1. ATP plays an important role in adipocyte. ATP could release energy to produce ADP and inorganic phosphate (Pi). AMP-activated protein kinase (AMPK) controls a constant high ratio of ATP to ADP (Hardie, 2011). The fatty acids produced by lipolysis are not usually oxidized within the adipocyte, but are released for use elsewhere. If the fatty acids generated by lipolysis are not rapidly removed from adipocytes either through export or by oxidative metabolism, they are recycled into triglycerides, an energy intensive process in which two molecules of ATP are consumed per fatty acid (Hardie, 2012). Thus, AMPK could inhibit lipolysis and maintain the rate of ATP to ADP. However, the different tail fat were used according to the condition of different sheep and the amount of fat deposition. Another special target is ELOVL6, which is found between the LFTS vs. TS comparison and is associated with fatty acids. Interestingly, the DEGs of LFTS vs. TS included ELOVL3 and ELOVL5. It could indicate that the ELOVL genes are differently expressed and regulated between tail fats of LFTS and TS that the characters are relatively different.
A total of 493 pairs of co-expression pairs were obtained by network construction based on DEGs and differentially expressed lncRNAs in tail fat of sheep. Among these co-expressed pairs, most of them were significantly and positively correlated, and only a small pairs are negatively correlated. These results indicate that these mRNA and lncRNAs may play a role mainly through positive regulation. That is high expression or low expression of both. It was also found that some lncRNAs can be co-expressed with many mRNA, suggesting that may be the lncRNAs were regulated by many mRNA.
The regulation of lipogenesis is a very complex biological process, and the tail fat of sheep is no exception. Previous studies have reported that tail fat development in sheep is associated with mRNA and miRNA (Wang et al., 2014; Miao et al., 2015a,b; Kang et al., 2017; Li et al., 2018b; Pan et al., 2018). These studies also show that tail fat deposition in sheep is not only regulated by a gene or miRNA, more likely by many coding and non-coding RNA. Some researchers integrated the miRNA and mRNA from Kazakhstan sheep and TS and found that the miRNA can participate in the regulation of sheep fat deposition by target mRNA (Zhou et al., 2017). As a type of non-coding RNA, lncRNA can also participate in the regulation of fat as part of a competing endogenous RNA network. From the perspective of lncRNAs, this study speculated that it regulates the tail fat deposition of sheep based on the lncRNA–mRNA regulated network.
In addition, there are some shortcomings in this study. For example, the DEGs and differentially expressed lncRNAs were to some extent caused by breed effect. Moreover, three animals per group are statistically not powerful enough. Regardless of the technology used to measure expression levels and the size of samples, the true gene expression levels will vary among individuals because expression is inherently a stochastic process (Hansen et al., 2011). In that case, the analysis results may not be powerful enough. However, the biological variability decreases with the increase of the number of samples. Hence, we hope to go on the further study with a larger sample size in the near future.
Conclusion
A total of 407 DEGs and 68 differentially expressed lncRNAs were identified between LFTS, STHS, and TS tail fat tissues (q-value < 0.05), among which were potentially associated with tail adipose tissue enlargement. These findings contribute to a better understanding of adipose deposits in regulating the regional fat distribution and the diverse tail types in fat-tailed sheep breeds.
Author Contributions
XL and YC conceived the project and designed the experiments. HC provided suggestions for the project. LM analyzed the data as well as he drafted the manuscript under the supervision of XL. YC and LH collected sheep tail fat tissue samples. YJ and SE performed the RNA extraction. LM and MZ performed qRT-PCR.
Funding
This work was funded by the National Natural Science Foundation of China (Nos. 31660642, 31760649, and 31360529), Natural Science Foundation of Gansu Province (No. 1610RJZA103), and Central Special Funds for Basic Research in Universities Operating Expenses of “An Excellent and Three Special” Discipline Construction (No. 31920170170).
Conflict of Interest Statement
The authors declare that the research was conducted in the absence of any commercial or financial relationships that could be construed as a potential conflict of interest.
Acknowledgments
We greatly thank the staff of Lanzhou Fat-Tail sheep, Small Tail Han sheep, and TS elite reservation farm (Gansu) for collecting samples.
Supplementary Material
The Supplementary Material for this article can be found online at: https://www.frontiersin.org/articles/10.3389/fgene.2018.00365/full#supplementary-material
TABLE S1 | Quality assessment reports of all RNA samples.
TABLE S2 | The GO annotation of DEGs from three groups of pairwise comparisons.
TABLE S3 | The KEGG annotation of DEGs from three groups of pairwise comparisons.
Footnotes
References
Alipanah, M., and Kashan, N. E. (2011). Fatty acid composition of fat tail, visceral and meat fat of three Iranian sheep breeds. J. Food Agric. Environ. 9, 416–418.
Almeida, A. M. (2011). ”By endurance we conquer”: fat tailed sheep in the twenty-first century. Trop. Anim. Health Prod. 43, 1233–1235. doi: 10.1007/s11250-011-9855-8
Andrews, S. (2012). FastQC: A Quality Control tool for High Throughput Sequence Data. Babraham Bioinformatics. Available at: http://www.bioinformatics.babraham.ac.uk/projects/fastqc
Ashburner, M., Ball, C. A., Blake, J. A., Botstein, D., Butler, H., Cherry, J. M., et al. (2000). Gene ontology: tool for the unification of biology. Gene Ontol. Consort. Nat Genet 25, 25–29. doi: 10.1038/75556
Atti, N., Bocquier, F., and Khaldi, G. (2004). Performance of the fat-tailed Barbarine sheep in its environment: adaptive capacity to alternation of underfeeding and re-feeding periods. Rev. Anim. Res. 53, 165–176. doi: 10.1051/animres:2004012
Choi, M., Mukherjee, S., Kang, N. H., Barkat, J. L., Parray, H. A., and Yun, J. W. (2018). L-rhamnose induces browning in 3T3-L1 white adipocytes and activates HIB1B brown adipocytes. IUBMB Life 70, 563–573. doi: 10.1002/iub.1750
Duffield, J. A., Vuocolo, T., Tellam, R., Yuen, B. S., Muhlhausler, B. S., and McMillen, I. C. (2008). Placental restriction of fetal growth decreases IGF1 and leptin mRNA expression in the perirenal adipose tissue of late gestation fetal sheep. Am. J. Physiol. Regul. Integr. Comp. Physiol. 294, R1413–R1419. doi: 10.1152/ajpregu.00787.2007
Duszka, K., Bogner-Strauss, J. G., Hack, H., Rieder, D., Neuhold, C., Prokesch, A., et al. (2012). Nr4a1 is required for fasting-induced down-regulation of pparγ2 in white adipose tissue. Mol. Endocrinol. 27, 135–149. doi: 10.1210/me.2012-1248
Edea, Z., Dessie, T., Dadi, H., Do, K. T., and Kim, K. S. (2017). Genetic diversity and population structure of Ethiopian sheep populations revealed by high-density SNP markers. Front. Genet. 8:218. doi: 10.3389/fgene.2017.00218
Feng, X., Li, F., Wang, F., Zhang, G., Pang, J., Ren, C., et al. (2018). Genome-wide differential expression profiling of mRNAs and lncRNAs associated with prolificacy in Hu sheep. Biosci. Rep. 38:BSR20171350. doi: 10.1042/BSR20171350
Finn, R. D., Bateman, A., Clements, J., Coggill, P., Eberhardt, R. Y., Eddy, S. R., et al. (2014). Pfam: the protein families database. Nucl. Acids Res. 42, D222–D230. doi: 10.1093/nar/gkt1223
Hansen, K. D., Wu, Z., Irizarry, R. A., and Leek, J. T. (2011). Sequencing technology does not eliminate biological variability. Nat. Biotechnol. 29, 572–573. doi: 10.1038/nbt.1910
Hardie, D. G. (2011). AMP-activated protein kinase: an energy sensor that regulates all aspects of cell function. Genes Dev. 25, 1895–1908. doi: 10.1101/gad.17420111
Hardie, D. G. (2012). Organismal carbohydrate and lipid homeostasis. Cold Spring Harb. Perspect. Biol. 4, a006031. doi: 10.1101/cshperspect.a006031
Jäger, M., Ott, C. E., Grünhagen, J., Hecht, J., Schell, H., and Mundlos, S. (2011). Composite transcriptome assembly of RNA-seq data in a sheep model for delayed bone healing. BMC Genomics 12:158. doi: 10.1186/1471-2164-12-158
Kanehisa, M., Sato, Y., Kawashima, M., Furumichi, M., and Tanabe, M. (2016). KEGG as a reference resource for gene and protein annotation. Nucl. Acids Res. 44, D457–D462. doi: 10.1093/nar/gkv1070
Kang, D. J., Zhou, G. X., Zhou, S. W., Zeng, J., Wang, X. L., Jiang, Y., et al. (2017). Comparative transcriptome analysis reveals potentially novel roles of Homeobox genes in adipose deposition in fat-tailed sheep. Sci. Rep. 7:14491. doi: 10.1038/s41598-017-14967-9
Kashan, N. E. J., Azar, G. H. M., Afzalzadeh, A., and Salehi, A. (2005). Growth performance and carcass quality of fattening lambs from fat-tailed and tailed sheep breeds. Small Rumin. Res. 60, 267–271. doi: 10.1016/j.smallrumres.2005.01.001
Kong, L., Zhang, Y., Ye, Z. Q., Liu, X. Q., Zhao, S. Q., Wei, L., et al. (2007). Cpc: assess the protein-coding potential of transcripts using sequence features and support vector machine. Nucl. Acids Res. 35, W345–W349. doi: 10.1093/nar/gkm391
Li, J., Erdenee, S., Zhang, S., Wei, Z., Zhang, M., Jin, Y., et al. (2018a). Genetic effects of PRNP gene insertion/deletion (indel) on phenotypic traits in sheep. Prion 12, 42–53. doi: 10.1080/19336896.2017.1405886
Li, B. J., Qiao, L. Y., An, L. X., Wang, W. W., Liu, J. H., Ren, Y. S., et al. (2018b). Transcriptome analysis of adipose tissues from two fat-tailed sheep breeds reveals key genes involved in fat deposition. BMC Genomics 19:338. doi: 10.1186/s12864-018-4747-1
Livak, K. J., and Schmittgen, T. D. (2001). Analysis of relative gene expression data using real-time quantitative PCR and the 2-ΔΔCT method. Methods 25, 402–408. doi: 10.1006/meth.2001.1262
Ma, L., Li, Z., Cai, Y., Xu, H., Yang, R., and Lan, X. (2018). Genetic variants in fat- and short-tailed sheep from high-throughput RNA-sequencing data. Anim. Genet. doi: 10.1111/age.12699 [Epub ahead of print].
Miao, X., Luo, Q., Qin, X., and Guo, Y. (2015a). Genome-wide analysis of microRNAs identifies the lipid metabolism pathway to be a defining factor in adipose tissue from different sheep. Sci. Rep. 5:18470. doi: 10.1038/srep18470
Miao, X., Luo, Q., Qin, X., Guo, Y., and Zhao, H. (2015b). Genome-wide mRNA-seq profiling reveals predominant down-regulation of lipid metabolic processes in adipose tissues of Small Tail Han than Dorset sheep. Biochem. Biophys. Res. Commun. 467, 413–420. doi: 10.1016/j.bbrc.2015.09.129
Miao, X. Y., and Luo, Q. M. (2013). Genome-wide transcriptome analysis between Small-tail Han sheep and the Surabaya fur sheep using high-throughput RNA sequencing. Reproduction 145, 587–596. doi: 10.1530/REP-12-0507
Moharrery, A. (2007). Effect of docking and energy of diet on carcass fat characteristics in fat-tailed Badghisian sheep. Small Rumin. Res. 69, 208–216. doi: 10.1016/j.smallrumres.2005.12.021
Moradi, M. H., Nejati-Javaremi, A., Moradi-Shahrbabak, M., Dodds, K. G., and McEwan, J. C. (2012). Genomic scan of selective sweeps in thin and fat tail sheep breeds for identifying of candidate regions associated with fat deposition. BMC Genet. 13:10. doi: 10.1186/1471-2156-13-10
Pan, Y. Y., Jing, J. J., Zhao, J. X., Jia, X. L., Qiao, L. Y., An, L. X., et al. (2018). MicroRNA expression patterns in tail fat of different breeds of sheep. Livestock Sci. 207, 7–14. doi: 10.1016/j.livsci.2017.11.007
Pourlis, A. F. (2011). A review of morphological characteristics relating to the production and reproduction of fat-tailed sheep breeds. Trop. Anim. Health Prod. 43, 1267–1287. doi: 10.1007/s11250-011-9853-x
Robinson, M. D., McCarthy, D. J., and Smyth, G. K. (2010). edgeR: a Bioconductor package for differential expression analysis of digital gene expression data. Bioinformatics 26, 139–140. doi: 10.1093/bioinformatics/btp616
Shannon, P., Markiel, A., Ozier, O., Baliga, N. S., Wang, J. T., Ramage, D., et al. (2003). Cytoscape: a software environment for integrated models of biomolecular interaction networks. Genome Res. 13, 2498–2504. doi: 10.1101/gr.1239303
Shelton, M. (1990). Influence of docking fat-tail (Karakul) sheep on lamb production. Small Rumin. Res. 3, 73–76. doi: 10.1016/0921-4488(90)90033-3
Sun, L., Luo, H., Bu, D., Zhao, G., Yu, K., Zhang, C., et al. (2013). Utilizing sequence intrinsic composition to classify protein-coding and long non-coding transcripts. Nucl. Acids Res. 41:e166. doi: 10.1093/nar/gkt646
Tafer, H., and Hofacker, I. L. (2008). RNAplex: a fast tool for RNA-RNA interaction search. Bioinformatics 24, 2657–2663. doi: 10.1093/bioinformatics/btn193
Trapnell, C., Pachter, L., and Salzberg, S. T. (2009). TopHat: discovering splice junctions with RNA-Seq. Bioinformatics 25, 1105–1111. doi: 10.1093/bioinformatics/btp120
Trapnell, C., Roberts, A., Goff, L., Pertea, G., Kim, D., Kelley, D. R., et al. (2012). Differential gene and transcript expression analysis of rna-seq experiments with tophat and cufflinks. Nat. Protoc. 7, 562–578. doi: 10.1038/nprot.2012.016
Unsal, M., and Aktas, N. (2003). Fractionation and characterization of edible sheep tail fat. Meat Sci. 63, 235–239. doi: 10.1016/S0309-1740(02)00074-8
Veeravalli, S., Omar, B. A., Houseman, L., Hancock, M., Gonzalez Malagon, S. G., Scott, F., et al. (2014). The phenotype of a flavin-containing monooyxgenase knockout mouse implicates the drug-metabolizing enzyme FMO1 as a novel regulator of energy balance. Biochem. Pharmacol. 90, 88–95. doi: 10.1016/j.bcp.2014.04.007
Wang, X., Zhou, G., Xu, X., Geng, R., Zhou, J., Yang, Y., et al. (2014). Transcriptome profile analysis of adipose tissues from fat and short-tailed sheep. Gene 549, 252–257. doi: 10.1016/j.gene.2014.07.072
Xia, E., Wang, Y., Bhandari, A., Niu, J., Yang, F., Yao, Z., et al. (2018). CITED1 gene promotes proliferation, migration and invasion in papillary thyroid cancer. Oncol. Lett. 16, 105–112. doi: 10.3892/ol.2018.8653
Xu, S. S., Ren, X., Yang, G. L., Xie, X. L., Zhao, Y. X., Zhang, M., et al. (2017). Genome-wide association analysis identifies the genetic basis of fat deposition in the tails of sheep (Ovis aries). Anim. Genet. 48, 560–569. doi: 10.1111/age.12572
Yang, Q., Yan, H. L., Li, J., Xu, H., Wang, K., Zhu, H. J., et al. (2017). A novel 14-bp duplicated deletion within goat GHR gene is significantly associated with growth traits and litter size. Anim. Genet. 48, 499–500. doi: 10.1111/age.12551
Zhang, Y., Yang, H., Han, L., Li, F., Zhang, T., Pang, J., et al. (2017). Long noncoding RNA expression profile changes associated with dietary energy in the sheep testis during sexual maturation. Sci. Rep. 7:5180. doi: 10.1038/s41598-017-05443-5
Zhang, Z., Wang, H., Sun, Y., Li, H., and Wang, N. (2013). Klf7 modulates the differentiation and proliferation of chicken preadipocyte. Acta Biochim. Biophys. Sin. 45, 280–288. doi: 10.1093/abbs/gmt010
Zhang, C., Wang, G., Wang, J., Ji, Z., Liu, Z., Pi, X., et al. (2013). Characterization and comparative analyses of muscle transcriptomes in Dorper and small-tailed Han sheep using RNA-Seq technique. PLoS One 8:e72686. doi: 10.1371/journal.pone.0072686
Zhi, D., Da, L., Liu, M., Cheng, C., Zhang, Y., Wang, X., et al. (2017). Whole genome sequencing of Hulunbuir Short-Tailed Sheep for identifying candidate genes related to the short-tail phenotype. G3 8, 377–383. doi: 10.1534/g3.117.300307
Zhou, G., Wang, X., Yuan, C., Kang, D., Xu, X., Zhou, J., et al. (2017). Integrating miRNA and mRNA expression profiling uncovers miRNAs underlying fat deposition in sheep. Biomed. Res. Int. 2017:1857580. doi: 10.1155/2017/1857580
Keywords: sheep, transcriptome, fat deposition, long non-coding RNA (lncRNA), fat tail
Citation: Ma L, Zhang M, Jin Y, Erdenee S, Hu L, Chen H, Cai Y and Lan X (2018) Comparative Transcriptome Profiling of mRNA and lncRNA Related to Tail Adipose Tissues of Sheep. Front. Genet. 9:365. doi: 10.3389/fgene.2018.00365
Received: 26 January 2018; Accepted: 21 August 2018;
Published: 10 September 2018.
Edited by:
Joram Mwashigadi Mwacharo, International Center for Agriculture Research in the Dry Areas (ICARDA), EthiopiaReviewed by:
Alessandra Crisà, Consiglio per la Ricerca in Agricoltura e l’Analisi dell’Economia Agraria (CREA), ItalyFuyong Li, University of Alberta, Canada
Copyright © 2018 Ma, Zhang, Jin, Erdenee, Hu, Chen, Cai and Lan. This is an open-access article distributed under the terms of the Creative Commons Attribution License (CC BY). The use, distribution or reproduction in other forums is permitted, provided the original author(s) and the copyright owner(s) are credited and that the original publication in this journal is cited, in accordance with accepted academic practice. No use, distribution or reproduction is permitted which does not comply with these terms.
*Correspondence: Yong Cai, caiyong1979@163.com Xianyong Lan, lan342@126.com