Corrigendum: Functional Urate-Associated Genetic Variants Influence Expression of lincRNAs LINC01229 and MAFTRR
 Megan Leask1,2
 Amy Dowdle1
 Hamish Salvesen1
 Ruth Topless3
 Tayaza Fadason4
 Wenhua Wei5
 William Schierding2,4
 Judith Marsman1,2
 Jisha Antony1
 Justin M. O’Sullivan2,4
 Tony R. Merriman2,3*
 Julia A. Horsfield1,2*
- 1Department of Pathology, Dunedin School of Medicine, University of Otago, Dunedin, New Zealand
- 2Maurice Wilkins Centre for Molecular Biodiscovery, The University of Auckland, Auckland, New Zealand
- 3Department of Biochemistry, School of Biomedical Sciences, University of Otago, Dunedin, New Zealand
- 4Liggins Institute, The University of Auckland, Auckland, New Zealand
- 5Department of Women’s and Children’s Health, Dunedin School of Medicine, University of Otago, Dunedin, New Zealand
Genetic variation in the genomic regulatory landscape likely plays a crucial role in the pathology of disease. Non-coding variants associated with disease can influence the expression of long intergenic non-coding RNAs (lincRNAs), which in turn function in the control of protein-coding gene expression. Here, we investigate the function of two independent serum urate-associated signals (SUA1 and SUA2) in close proximity to lincRNAs and an enhancer that reside ∼60 kb and ∼300 kb upstream of MAF, respectively. Variants within SUA1 are expression quantitative trait loci (eQTL) for LINC01229 and MAFTRR, both co-expressed with MAF. We have also identified that variants within SUA1 are trans-eQTL for genes that are active in kidney- and serum urate-relevant pathways. Serum urate-associated variants rs4077450 and rs4077451 within SUA2 lie within an enhancer that recruits the transcription factor HNF4α and forms long range interactions with LINC01229 and MAFTRR. The urate-raising alleles of rs4077450 and rs4077451 increase enhancer activity and associate with increased expression of LINC01229. We show that the SUA2 enhancer region drives expression in the zebrafish pronephros, recapitulating endogenous MAF expression. Depletion of MAFTRR and LINC01229 in HEK293 cells in turn lead to increased MAF expression. Collectively, our results are consistent with serum urate variants mediating long-range transcriptional regulation of the lincRNAs LINC01229 and MAFTRR and urate relevant genes (e.g., SLC5A8 and EHHADH) in trans.
Introduction
High levels of serum urate are necessary but not sufficient for gout, a debilitating form of inflammatory arthritis (Dalbeth et al., 2016). Hyperuricemia is a predictor of renal disease, cardiovascular disease and components of metabolic disease including obesity, fatty liver, diabetes, and hypertension (Sharaf El Din et al., 2017). Serum urate homeostasis is normally maintained by balancing urate production and excretion, predominantly by the liver and renal system, respectively (Maiuolo et al., 2016). Increased reabsorption of urate in the renal tubules (Hyndman et al., 2016) can cause high serum urate levels. Understanding the molecular mechanisms that control urate homeostasis is critical to improving the prevention, management, and treatment for individuals affected with gout and possibly other associated metabolic diseases.
Genome wide association studies (GWAS) have identified single nucleotide polymorphisms (SNPs) associated with serum urate levels (Tin et al., 2011; Okada et al., 2012; Köttgen et al., 2013; Kanai et al., 2018). However, the majority of these associated genetic variants lie outside of coding regions and the molecular mechanisms through which they alter urate levels are unknown. Nevertheless, association with serum urate levels indicates that these variants must be linked to or lie within regions of the genome that have biological consequences for serum urate control. To understand how genetic variants might influence disease traits it is important to: (1) identify the function of the DNA regions to which the disease-associated variants map; and (2) identify which gene(s) and pathways are under their control (if the function is regulatory). Previously, we used this approach to assign function to serum urate-associated variants within a conserved non-coding region that regulates expression of PDZK1 (Ketharnathan et al., 2018).
The MAF bZIP transcription factor (MAF) is a strong candidate gene for involvement in serum urate control and gout. MAF is highly expressed in the human and mouse kidney, including the podocytes (Daassi et al., 2016) and proximal tubules (Imaki et al., 2004; Ponten et al., 2008). MAF function is important for the development and differentiation of the proximal tubule cells (Imaki et al., 2004). Additionally MAF has been shown to regulate antioxidant (Dhakshinamoorthy and Jaiswal, 2002; Kikuchi et al., 2018) and apoptotic pathways (Peng et al., 2007) that are required for NLRP3 inflammasome activation implicated in chronic kidney disease and gout (Jhang and Yen, 2017; So and Martinon, 2017). Although there are multiple genetically independent signals associated with serum urate levels in a ∼500 kb region upstream of the MAF gene (Figure 1), it is not known if these influence the expression of MAF.
FIGURE 1
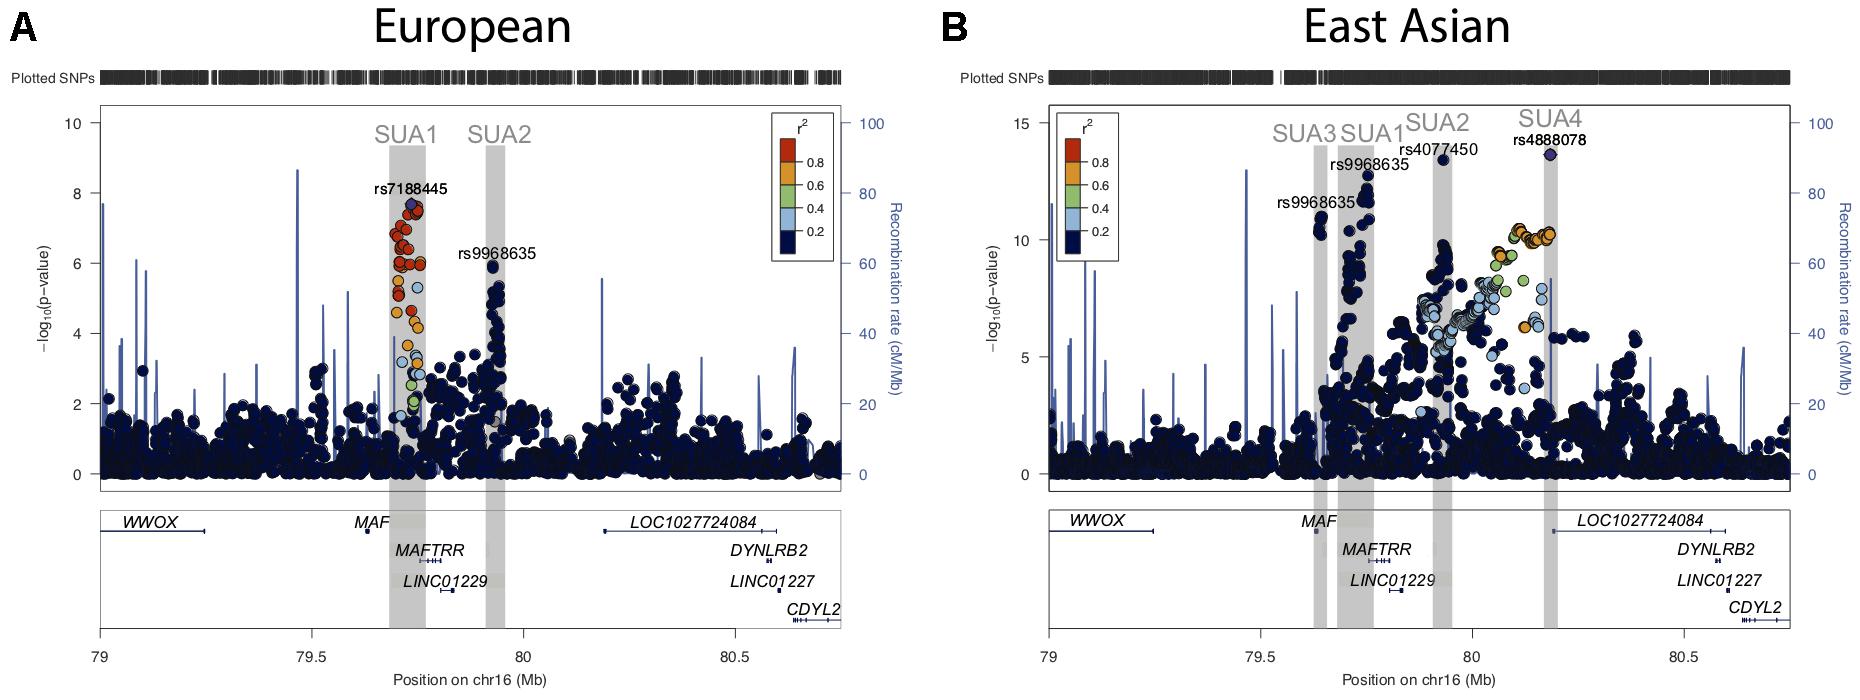
Figure 1. Serum urate associated regions upstream of the MAF gene. (A) Regional association plots for serum urate associated SNPs upstream of the MAF TSS and in proximity to the lincRNA region encompassing MAFTRR, LINC01229, and LOC1027724084 from (A) Köttgen et al. (2013) and (B) Kanai et al. (2018). Surrounding genes include WWOX, DYNLRB2 and CDYL2. Dots indicate individual SNPs while their position relative to the left Y-axis indicates the significance (-log10P) of association with serum urate levels. The blue line indicates the recombination rate across the locus. The SUA1, SUA2, SUA3, and SUA4 regions upstream of MAF are indicated by gray boxes and were defined by SNPs with p < 10-6 and LD with the lead SNP at the SUA region R2 > 0.8. The lead SNPs (A) rs7188445 (SUA1) in Europeans and (B) rs4888078 (SUA4) in East Asians are indicated by a purple dot. The color of the surrounding SNPs indicates the strength of LD with the lead SNP according to the key in the left top hand corner, measured as r2 found in the HapMap data (hg19/1000 genomes Nov 2014) for Europeans (A) and East Asian (B). The lead SNP of each SUA region is indicated above the signal in Europeans (A) and East Asians (B). The plot was generated using LocusZoom (Pruim et al., 2010).
The urate association signals that are located upstream of MAF are in close proximity to multiple long intergenic non-coding (linc) RNAs. Recent evidence has shown that non-coding disease-associated SNPs can regulate the expression of lincRNAs (Kumar et al., 2013; Mirza et al., 2014). As a direct result of changing lincRNA expression, disease-associated SNPs could have indirect tissue-specific effects on protein-coding genes (Tan et al., 2017) that are involved in disease. Here, we investigate how serum urate-associated variants in two prominent urate-association signals (SUA1 and SUA2) that are conserved between GWAS in European and Japanese sample sets could contribute to the regulation of serum urate levels.
Results
In people of European ancestry, two loci located upstream of MAF [Chr16: 79637239–79645062 (build 37.7)] were identified as being associated with serum urate levels (p < 10-6, hereafter referred to as serum urate association regions 1 (SUA1) and 2 (SUA2) (Figure 1A and Table 1) (Köttgen et al., 2013). SUA1 is located ∼60 kb upstream of the MAF transcriptional start site (TSS) and extends through to the 3′ region of MAF transcriptional regulator RNA (MAFTRR). The lead SUA1 SNP (rs7188445) is associated with gout (Phipps-Green et al., 2016). SUA2 is ∼300 kb upstream of the MAF locus and ∼120 kb upstream of the TSS of long intergenic non-protein coding RNA 1229 (LINC01229) (Figure 1A). SUA1 and SUA2 have also been associated with serum urate levels in East Asian datasets (Okada et al., 2012; Kanai et al., 2018) [Table 1 and Figure 1B (data from Kanai et al., 2018)]. A third serum urate association signal (SUA3) (Table 1 and Figure 1B) located immediately upstream of MAF has currently only been identified in East Asian serum urate datasets (Okada et al., 2012; Kanai et al., 2018). The lead Okada et al. (2012) SUA3 SNP (rs889472) is associated with gout (Higashino et al., 2018) and is in nearly perfect linkage disequilibrium (LD) (R2 = 0.97) with the lead SUA3 SNP (rs8050348) in the Kanai et al. (2018) dataset (Figure 1B). A fourth serum urate association signal (SUA4) (Table 1 and Figure 1B) is only evident in the Kanai et al. (2018) Japanese data and is located immediately upstream of LOC1027724084 (Kanai et al., 2018). The maximally associated variants (p = 2.3 × 10⁻¹⁴) at SUA4 in the Kanai et al. (2018) data (rs4888080, rs4888078, and rs12325508) are in LD (R2 = 1). The urate-raising alleles for these SNPs have allele frequencies of 0.03 in East Asian individuals from the 1000 Genomes Project and these SNPs are monomorphic in Europeans which explains the absence of the SUA4 signal from the European serum urate datasets. The region upstream of MAF has also been associated with other phenotypic traits (Table 1 and Supplementary Figure S1A). It is unknown whether variants in SUA1-4 affect the expression of MAF, or regulate other genes, including the lincRNAs at this region. In this study, we focussed on assigning function to the two independent regions SUA1 and SUA2 (determined by conditional analysis, Supplementary Figure S1B) that have been identified within both European and East Asian populations and are therefore conserved between population groups. SUA3 and SUA4 were excluded from our study due to their absence in the European population.
TABLE 1

Table 1. Serum urate associated regions upstream of MAF.
SUA1 and SUA2 Colocalize With eQTL for MAFTRR and LINC01229
We used COLOC (Giambartolomei et al., 2014) and expression data from The Genotype Tissue Expression (GTEx) project (Carithers and Moore, 2015) to identify cis-eQTL that colocalize with SUA1 and SUA2. eQTL for the genes MAFTRR and LINC01229 (Figure 2, gene body depicted in black) colocalize with the SUA1 urate signal (Table 2) although the lead eQTL variants are not the lead urate variants at SUA1 (Supplementary Figure S2). SUA1 urate-raising alleles associate with increased expression of MAFTRR but with lowered expression of LINC01229 (e.g., rs7188445_G Supplementary Figure S3 and Supplementary Table S1). An eQTL for LINC01229 in the GTEx tissue Skin – Exposed (Lower leg) (Supplementary Figure S2) colocalises with the SUA2 urate signal (Table 2). Urate-raising variants within SUA2 increase LINC01229 expression (Supplementary Table S2). Colocalization of the SUA1 and SUA2 urate signals with MAFTRR and LINC01229 eQTL suggests that the causal variant(s) at these regions for serum urate and lincRNA expression are shared. Collectively these results are consistent with expression of MAFTRR and LINC01229 being functionally important in serum urate control.
FIGURE 2
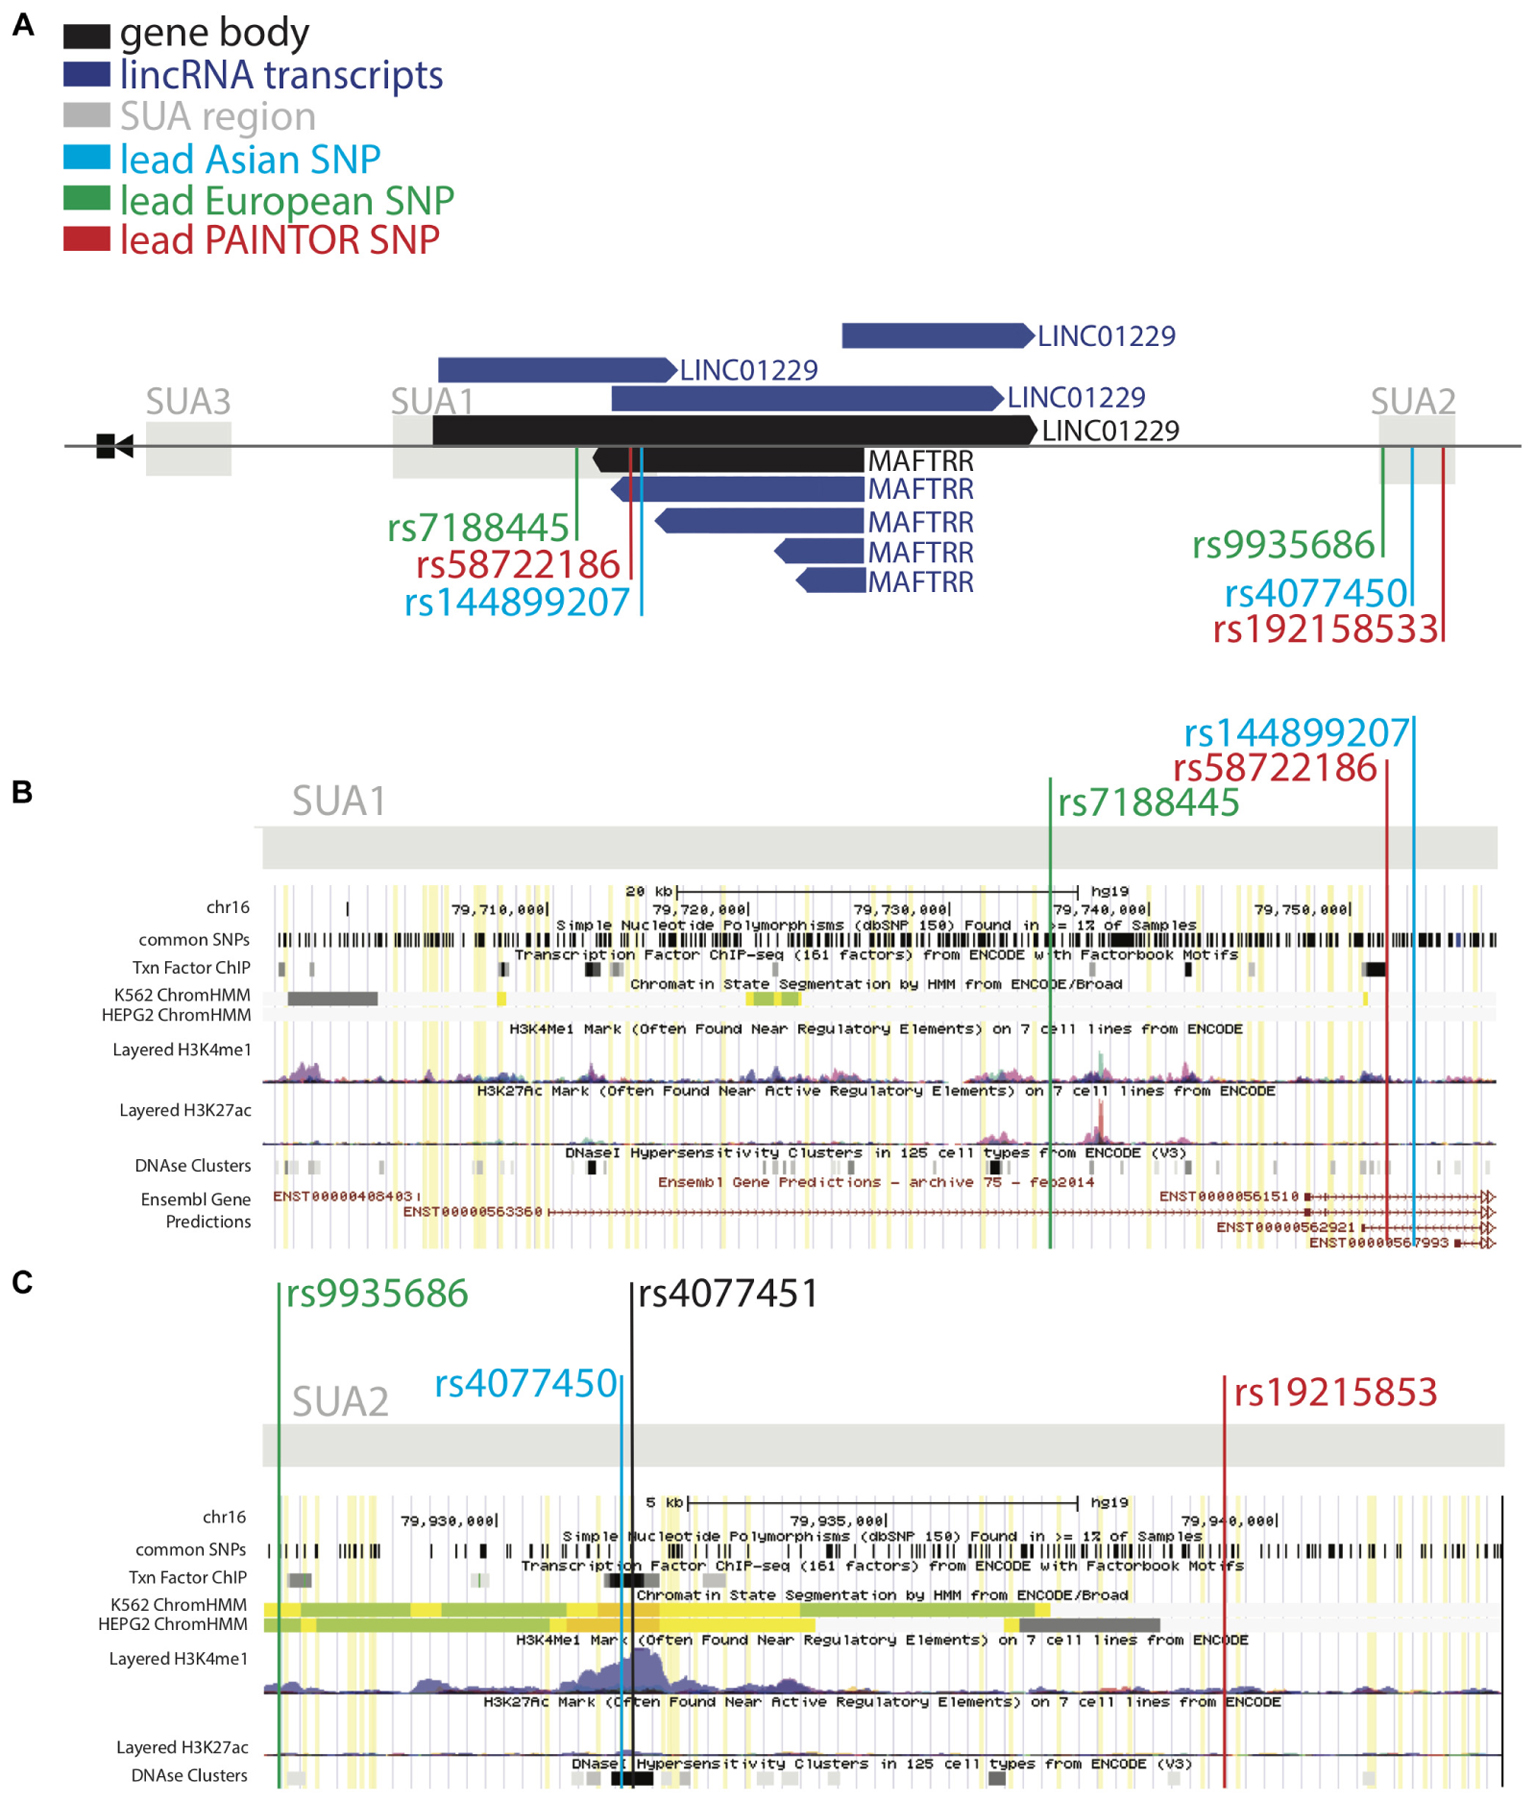
Figure 2. SUA2 has hallmarks of enhancer function. (A) The MAF upstream region marked by SUA variants in Köttgen et al. (2013) and Kanai et al. (2018). LincRNA gene bodies (black) and transcripts (dark blue) are depicted. (B,C) ENCODE screenshots of the SUA1 and SUA2 regions. The presence of enhancer elements; DNaseI hypersensitivity regions (DHS) (Thurman et al., 2012), H3K27ac and H3K4me1 chromatin modifications (Heintzman et al., 2009), transcription factor binding sites (Wang et al., 2012) and predicted ChromHMM enhancers (Ernst and Kellis, 2017) are shown. Yellow lines indicate Köttgen SUA variants (p < 10-5) (B) A schematic of the ENCODE annotation of the SUA1 region, which includes the lead SUA1 PAINTOR SNP rs58722186 (red) lead European urate SNP rs7188445 (green) and lead Japanese urate SNP rs144899207 (blue). (C) A schematic of the ENCODE annotation of the SUA2 region, which includes the lead SUA2 PAINTOR SNP rs192158533 (red) lead European urate SNP rs9935686 (green) and lead Japanese urate SNP rs4077450 (blue).
TABLE 2
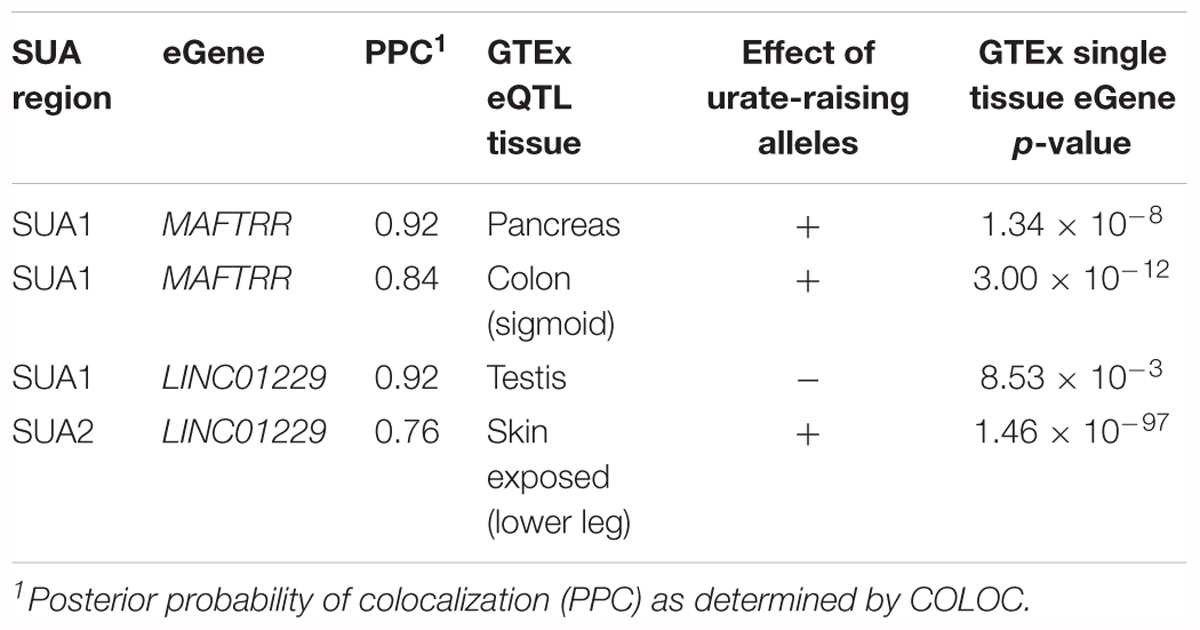
Table 2. Colocalized GTEx eQTL and SUA upstream of MAF.
MAFTRR eQTL variants (all GTEx tissues) that have the greatest effect on MAFTRR expression lie immediately 3′, or within the 3′ region of the MAFTRR transcript (Supplementary Figure S2). By contrast, the locations of eQTL for LINC01229 differ in genomic location between tissues (Supplementary Figure S2). eQTL for MAF are not found within SUA1 or SUA2 and instead lie within the WWOX transcript (+375 kb of MAF), downstream and within the MAF transcript, and within the promoter of DYNLRB2 (-1 Mb of MAF) (Supplementary Figure S4).
GTEx currently has no renal eQTL data, therefore we queried the NepheQTL database (Gillies et al., 2018) to assess whether the SUA1 and SUA2 MAFTRR and LINC01229 eQTL exist in the kidney tubule. MAFTRR has a very strong eQTL signal (FDR adjusted p = 8.12 × 10⁻¹⁸) in the tubulointerstitium (Supplementary Figure S2) that coincides with SUA1. Four maximally associated variants (R2> 0.98) lie immediately 3′ to the MAFTRR transcript consistent with the GTEx data. COLOC indicates that the eQTL signal for MAFTRR and the SUA1 serum urate signal are different (H3 posterior probability = 0.976). Nonetheless, SUA1 urate-raising variants associate with increased expression of MAFTRR in kidney tubule (Supplementary Table S1). No SUA2 variants were eQTL for MAFTRR in the kidney tubules within the NepheQTL database (Gillies et al., 2018) (Supplementary Table S2). Furthermore, there were no significant gene eQTL signals for MAF or LINC01229 within NepheQTL.
An additional whole kidney-derived eQTL dataset (Ko et al., 2017) and Japanese blood eQTL sample set1 [monocytes, CD4+, CD8+, natural killer and B cells (Kanai et al., 2018)] were queried. eQTL for MAF were located downstream of MAF (consistent with the GTEx data), however, there were no eQTL data for MAFTRR and LINC01229 and no SUA (SUA1-4) variants were significant eQTL in these tissues (Supplementary Figure S5).
SUA1 Serum Urate Variants Are Unlikely to Regulate Transcription
Intergenic disease-associated variants could influence disease traits by regulating gene expression. We used PAINTOR (Kichaev et al., 2014) in conjunction with ENCODE (Encyclopedia of DNA Elements) (ENCODE Project Consortium, 2012) to identify functional variants with regulatory activity at the SUA regions upstream of MAF. Fine mapping with PAINTOR using kidney cell type annotations (Finucane et al., 2015) as a prior identified the most likely causal variants within SUA1 and SUA2 (Table 3). We interrogated ENCODE to identify putative regulatory elements that overlap the SNPs identified by PAINTOR (Figure 2, Supplementary Tables S1, S2, and Supplementary Figures S6, S7). Functional annotations of the human genome were scanned to identify DNaseI hypersensitivity regions [DHS; characteristic of enhanced chromatin accessibility (Thurman et al., 2012)], the coexistence of histone H3 monomethylated on lysine 4 and histone H3 acetylated on lysine 27 (H3K4me1, H3K27ac; hallmarks of active cis-regulatory elements) (Heintzman et al., 2009) and transcription factor binding sites (Wang et al., 2012, 2013). We also looked for hyper-accelerated regions (HARs), which represent conserved genomic loci with elevated divergence in humans (Doan et al., 2016) and can therefore indicate potential human-specific enhancers.
TABLE 3
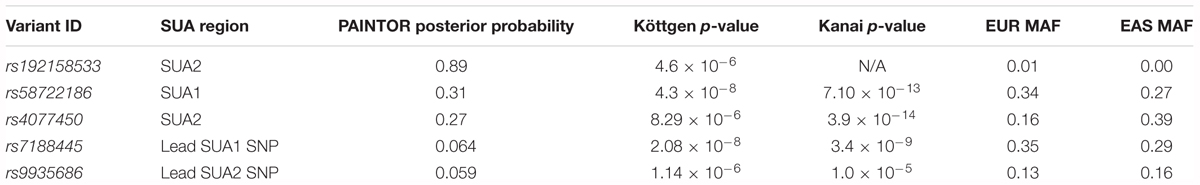
Table 3. PAINTOR analysis of SUA1 and SUA2.
Our ENCODE analyses indicate that rs58722186 within SUA1 identified by PAINTOR (Table 3, Figures 2A,B, PAINTOR posterior probability = 0.31) is in close proximity to regulatory elements. rs58722186 is adjacent to five predicted transcription factor binding sites based on chromatin immunoprecipitation (ChIP) studies from HEPG2 and K652 cells, falls within a GATA2 and GATA3 binding site and is bound by GATA2 in SH-SY5Y cells (ENCODE; Figure 2B and Supplementary Figure S6). rs58722186 is also flanked by DHS peaks and enriched for histone 3 monomethylation on lysine 4 (H3K4me1) (Figure 2B and Supplementary Figure S6). rs58722186 is one of the maximally associated serum urate variants (p = 7.10 × 10⁻¹³) in the Kanai et al. (2018) dataset. rs58722186 is an eQTL for MAFTRR in multiple tissues with a similar effect on expression as the lead SUA1 urate SNP rs7188445 (p = 1.3 × 10-36 and p = 9.6 × 10-37, respectively). Chromatin state segmentation by hidden Markov model (ChromHMM) (Ernst and Kellis, 2017) indicates that rs58722186 is within heterochromatin (Figure 2B and Supplementary Figure S6) but is in proximity to a weak enhancer in K652 cells. We find minimal evidence for regulatory elements that overlap urate-associated SNPs identified in the European dataset in SUA1 (Supplementary Figure S2B and Supplementary Table S1) consistent with our PAINTOR analyses (Supplementary Table S3).
The SUA2 Region Has Hallmarks of Enhancer Function
At SUA2 the lead PAINTOR SNP rs192158533 (Table 3, Figures 2A,C, PAINTOR posterior probability = 0.89) does not mark any significant regulatory elements. rs192158533 is monomorphic in East Asian populations yet there is a strong urate association at SUA2 signal in Kanai et al. (2018) data. The second most likely SUA2 PAINTOR SNP (Table 3, Figures 2A,C, PAINTOR posterior probability = 0.27) is rs4077450 and the maximally associated urate SNP in the Kanai et al. (2018) Japanese data (p = 3.9 × 10⁻¹⁴).
ENCODE identifies that rs4077450 along with SUA2 variant rs4077451 encompass a region that is enriched for H3K4me1 and H3K27ac (Figure 2C and Supplementary Figure S7) (Heintzman et al., 2009). DHS peaks overlap this region in 33 cell lines, including HRCEpiC renal cortex cells (Figure 2C, Supplementary Figure S7, and Supplementary Table S4) (Thurman et al., 2012). The ENCODE data identifies ∼30 predicted transcription factor binding sites within the rs4077450_rs4077451 SNP region in chromatin immunoprecipitation (ChIP) studies in HEPG2 and K652 cells (Figure 2C and Supplementary Figure S7) (Gerstein et al., 2012; Wang et al., 2012, 2013).
ChromHMM (Ernst and Kellis, 2017) predicts that the rs4077450_rs4077451 SNP region marks a strong enhancer in liver carcinoma HEPG2 and leukemia K562 cells (Figure 2C and Supplementary Figure S7). In these cells there is also evidence for strong active transcription signatures at the MAFTRR/LINC01229 TSS but the MAF TSS is marked by repressed chromatin signatures. Our eQTL analyses indicate that SUA2 SNPs rs4077450 and rs4077451 are within the colocalized LINC01229 eQTL (p = 1.2 × 10⁻⁵ and p = 2.0 × 10⁻⁵, respectively, Supplementary Figures S8A,B) and the urate lowering alleles associate with lowered LINC01229 expression (Table 2 and Supplementary Table S2).
Conserved non-coding regions of the genome might indicate developmental enhancers (Polychronopoulos et al., 2017). LINSIGHT (Huang et al., 2017) indicates that the SUA2 SNP region is under sequence constraint (Supplementary Figure S9). SUA2 also encompasses a HAR (Bird et al., 2007) which is located ∼2 kb upstream of the rs4077450 SNP region at Chr16: 79934248–79934397 (Supplementary Figure S9). In combination, our in silico analyses indicate that the SUA2 SNP region is a strong candidate for enhancer function and follow up in functional assays.
The SUA2 Region Functions as a Kidney-Specific Enhancer in Zebrafish
We performed transient enhancer assays in zebrafish embryos to investigate the ability of the SUA2 region to act as an enhancer in vivo. The region encompassing the DHS and TFBS hotspot and spanning rs4077450 and rs4077451 was amplified from 1000 Genome DNA samples heterozygous for each of the allele variants (Figure 2C). Allele fragments containing rs4077450_T-rs4077451_A and rs4077450_G-rs4077451_T are herein named major and minor allele fragments, respectively. The minor alleles associate with increased urate levels and increased LINC01229 expression.
The major and minor allele fragments of the SUA2 region are both capable of driving kidney-specific GFP expression in zebrafish larvae (Figure 3). Cells that are destined to form the zebrafish pronephric duct arise from the ventral mesoderm and then populate the intermediate mesoderm where the differentiation of the pronephric duct into the glomerulus, proximal tubule and distal tubule begins (Horsfield et al., 2002; Drummond, 2003). GFP was initially observed in the zebrafish kidney proximal tubule at 24 h post-fertilization (hpf) (Supplementary Figure S10). By 3 days post-fertilization (dpf), the pronephric duct can be clearly divided into four sections; the glomerulus, the proximal convoluted tubule (PCT), the proximal straight tubule (PST) and the distal tubule (DT) (Figure 3A) (Wingert et al., 2007). At 3 dpf, the presence of mosaic GFP showed that the enhancer is active in the PCT, PST and DT (Figure 3B). By 5 dpf GFP kidney expression was confined to the PCT (Figure 3C).
FIGURE 3
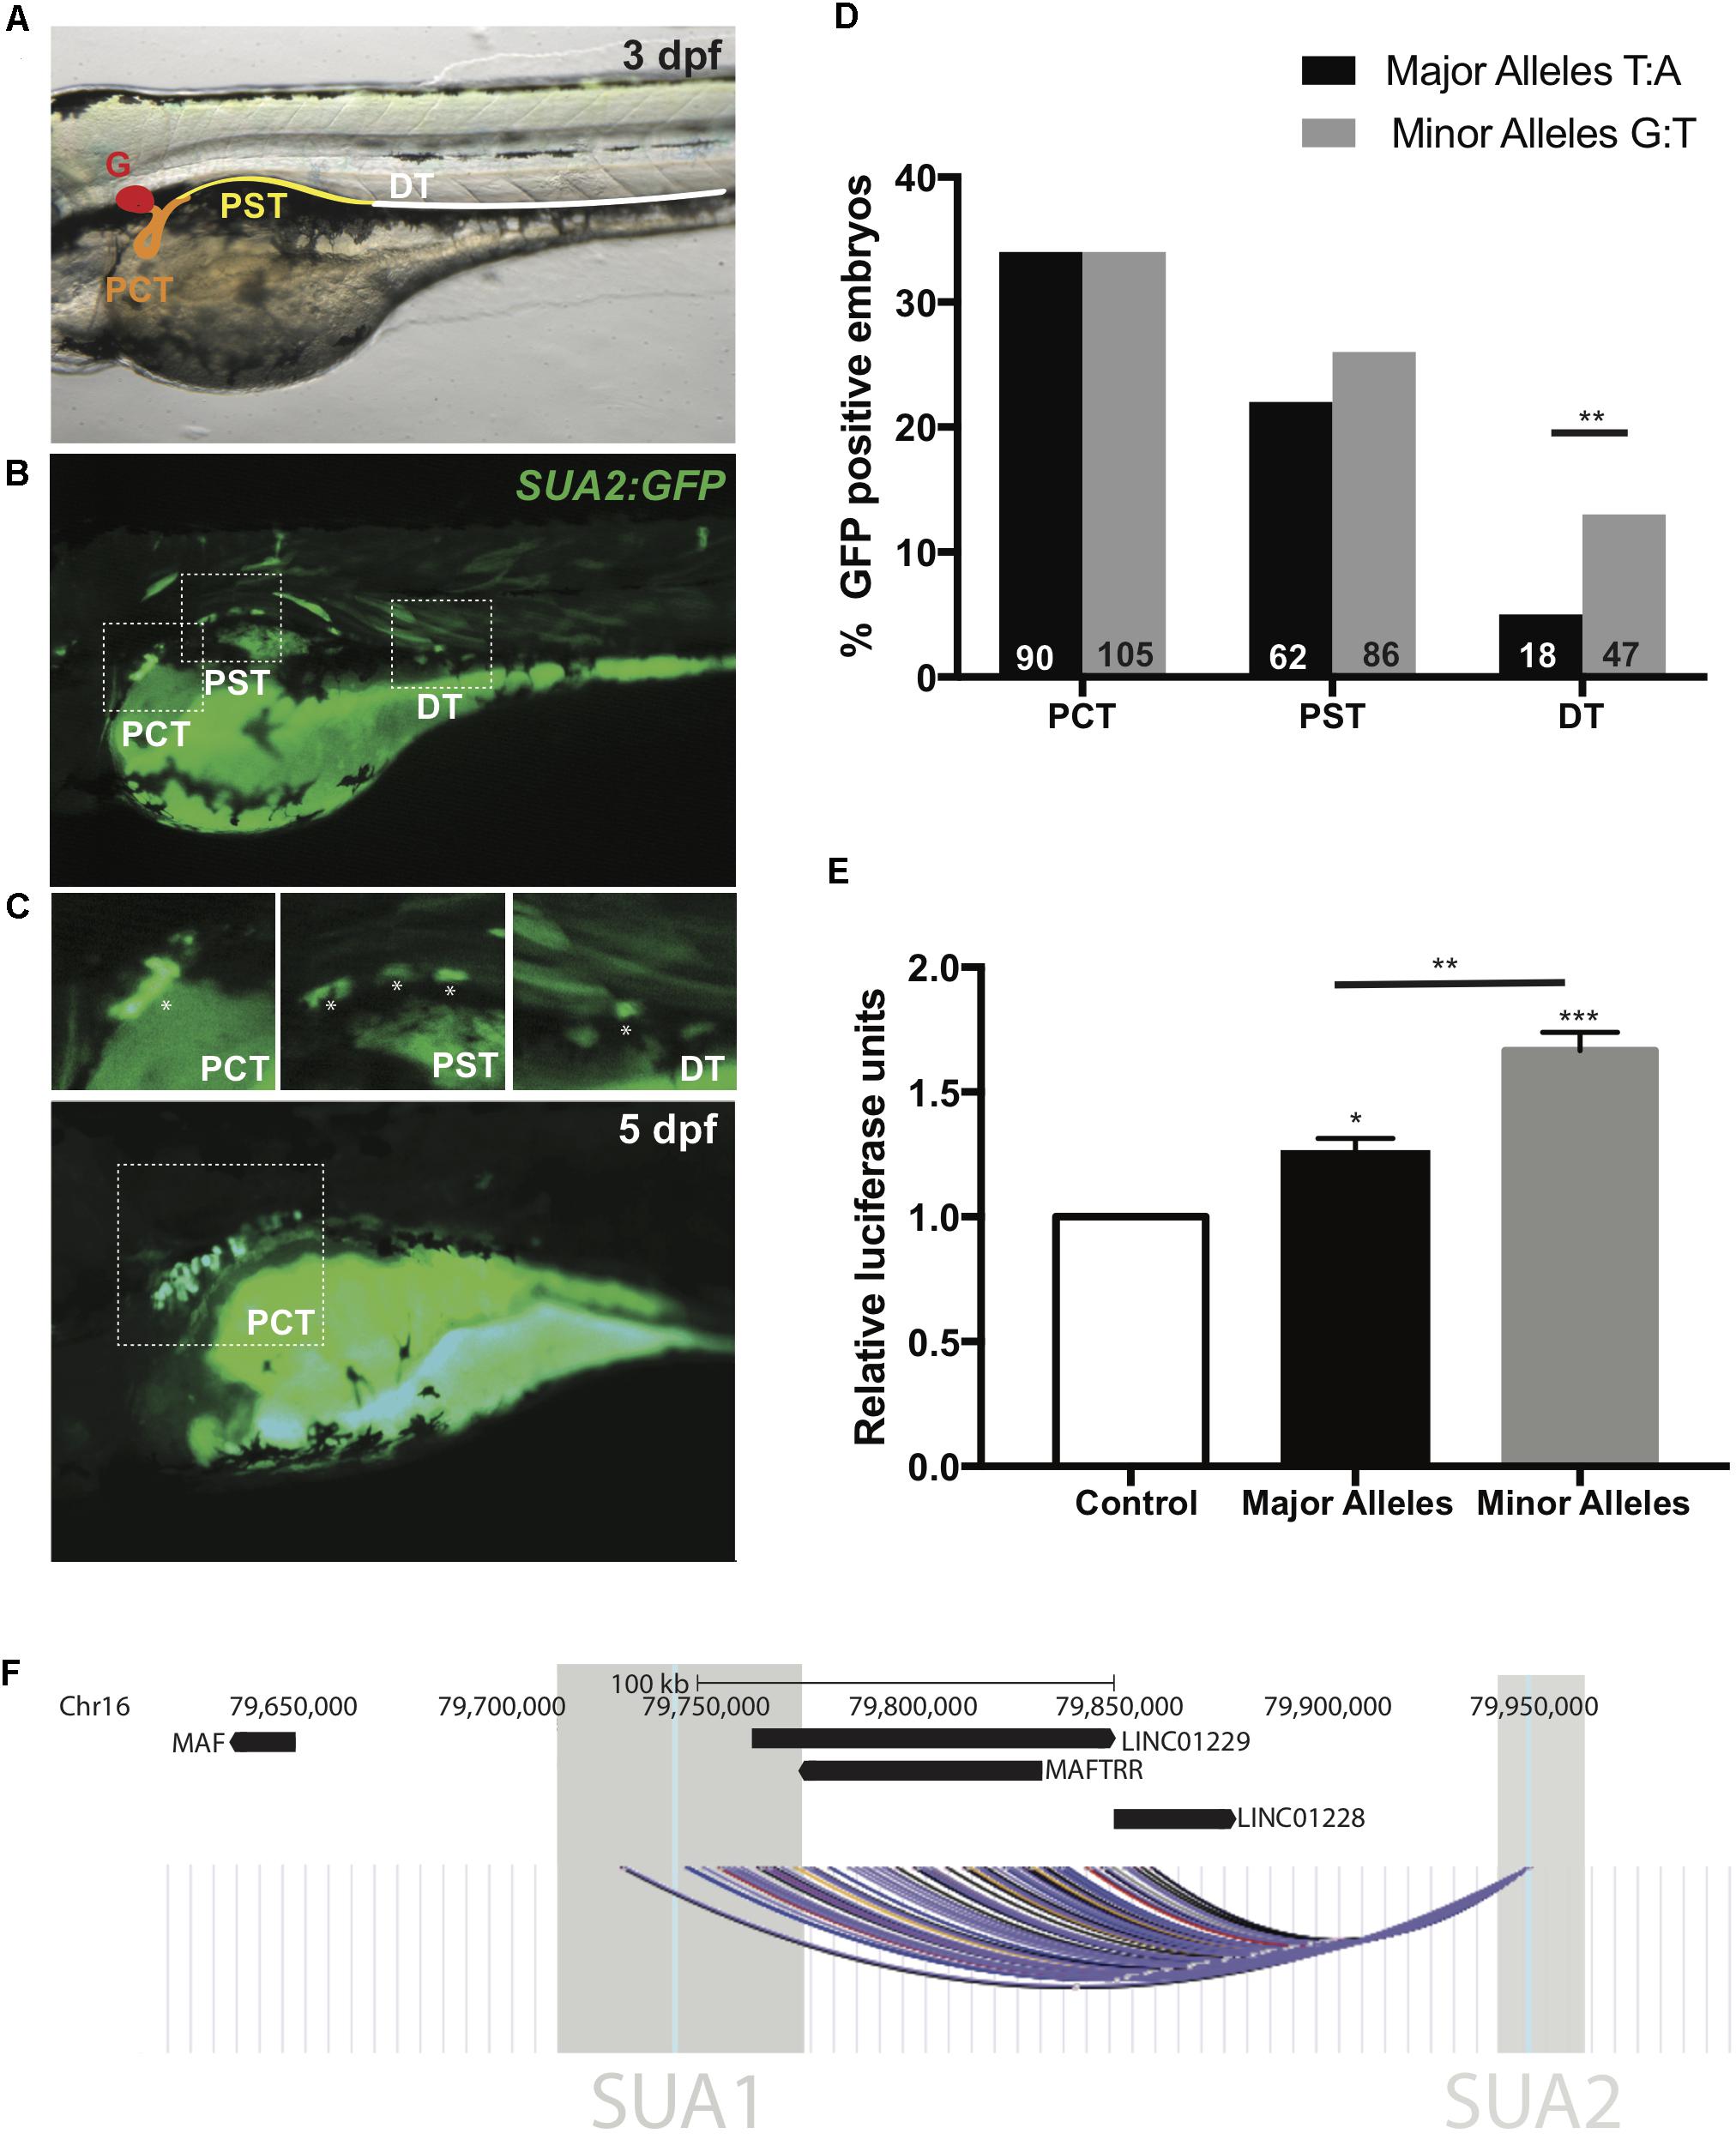
Figure 3. SUA2 is a functional enhancer that physically connects to the lincRNA region. An enhancer construct containing the SNP region (e.g., major alleles) injected at the one-cell stage in developing zebrafish embryos drives transient GFP reporter expression in the proximal tubules of 24 hpf, 48 hpf, and 3 dpf embryos. (A) 48 hpf embryo with schematic depicting the zebrafish pronephros: glomerulus (G, red); proximal convoluted tubule (PCT, orange); proximal straight tubule (PST, yellow); distal tubule (DT, green). (B) Representative image from a 3 dpf embryo with mosaic GFP expression in the PCT, PST and DT. Insets of the PCT, PST and DT are below. Asterisks indicate GFP positive cells. (C) Representative image from a 5 dpf embryo with mosaic GFP expression found exclusively in the PCT. (D) Percentage of transgene positive embryos that present with GFP-positive cells in the PCT, PST, and DT in enhancer constructs containing the SNP region with either the major or minor alleles for SNPs rs4077450 and rs4077451 at 3 dpf. The total number of embryos that were transgene-positive for the major allele fragment was 349. The total number of embryos that were transgene-positive for the minor allele fragment was 413. Numbers in each group are represented at the bottom of each bar in the graph. (E) Luciferase reporter assay in HEK293 cells with an empty pGL4.23 vector (control), or a pGL4.23 vector containing the SNP region with either the major (urate-lowering) or minor (urate-raising) alleles of the SNP. Luciferase expression is plotted relative to the expression of Renilla and normalized to the expression from the empty vector. A one-way ANOVA test resulted in a significant difference between the means of the control and the SNP region containing both the minor and major allele and a significant difference between the means of the major and minor alleles. Asterisks indicate the set of values that were significantly different from the control; ∗p < 0.05, ∗∗p < 0.005 and ∗∗∗p < 0.0005. (F) The intergenic region upstream of MAF that encompasses the lincRNAs MAFTRR, LINC01229 and LINC01228. Also shown are the locations of SUA1 and SUA2. The region of interaction for the interaction fragment that encompasses the rs4077450_rs4077451 SNP region is indicated, data are from Rao et al. (2014) using K562 (black), NHEK (blue), IMR90 (yellow), HMEC (red), GM12878 (purple) and KBM7 (gray) cells. The interaction region is the combination of 45 interactions with the rs4077450_rs4077451 SNP region.
The extent of GFP localization in the PCT, PST, and DT was quantified in 3 dpf embryos. The minor allele fragment drove GFP expression in the cells of the PCT in 34% of embryos, the PST in 26% of embryos and the DT in 13% of embryos at 3 dpf. The major allele fragment drove GFP expression in the PCT in 34% of embryos, PST in 22% of embryos and DT in 5% of embryos at 3 dpf (Figure 3D). The percentage of embryos with GFP in the DT between the major and minor allele fragments was significantly different (Fishers exact test, p = 0.0025) indicating that minor (urate-raising) allele fragment has subtly greater spatial enhancer activity during development.
The Amplitude of SUA2 Enhancer Activity in HEK293 Cells Depends on Allele Identity
The SUA2 major and minor allele fragments were cloned into luciferase reporter constructs and evaluated for differential enhancer activity in the human embryonic kidney cell line HEK293. The major and minor allele fragments both exhibited significant (p = 0.0216 and p = 0.0002, respectively) enhancer activity in HEK293 cells when compared to the vector only control (Figure 3E). Notably, the minor urate-raising allele fragment had elevated enhancer activity when compared to the major allele (p = 0.0032).
Collectively, our results indicate that the genomic region containing the rs4077450_rs4077451 SNPs is a kidney-specific regulatory element (henceforth called the SUA2 enhancer) that shows allele-specific enhancer activity. The minor (urate-raising) alleles increased the range of tissue expression in zebrafish, and also increased the amplitude of expression in HEK293 cells, providing the first indication of a mechanism for influence of SUA2-specific genetic variation on serum urate levels.
The SUA2 Region Physically and Functionally Connects With MAFTRR/LINC01229 and SUA1
CoDeS3D which leverages genome connectivity (Hi-C datasets) and gene expression associations [eQTL data from the GTEx catalog (Carithers and Moore, 2015)] provides evidence that variants within the SUA2 enhancer regulate the LINC01229 locus via long-range interactions. Genome connectivity data from Hi-C datasets for K562, NHEK, IMR90, HMEC, GM12878, and KBM7 cells (Rao et al., 2014) shows that an interaction fragment containing rs4077450 and rs4077451 within SUA2 physically interacts with 45 restriction fragments that fall within a ∼130 kb interaction region [Figure 3F, Chr16: 79712175–79841647 (build 37.7) FDR < 0.02, Supplementary Table S5]. This interaction region includes the transcripts for the lincRNA genes LINC01229, LINC01228, and MAFTRR and a large part of SUA1 (Figure 3F). Hi-C data from renal cells (Caki-2) (Yang et al., 2018) provides further confirmation that a restriction fragment containing rs4077450 interacts with restriction fragments containing rs7188445 (SUA1) and rs889472 (SUA3) (Supplementary Figure S11A). Hi-C data also shows that topologically associated domains (TADs) at the MAF locus shift in location depending on cell/tissue type. In NHEK cells MAF is found on the TAD boundary (Supplementary Figure S11B) and in HUVEC, IMR90 and KBM7 cells MAF shares a TAD with SUA1, MAFTRR, LINC01229, and SUA2 (Supplementary Figure S11B).
The SUA2 Enhancer Binds HNF4α and Its Expression Coincides With maf and HNF4A Expression in Zebrafish Kidney
We used in situ hybridization to examine the spatial location of Danio rerio maf transcripts in zebrafish embryos and assess whether maf expression overlaps with the activity of the kidney specific enhancer. We found that maf is expressed in the developing kidney and proximal tubules at 12 hpf, 24 hpf, and 48 hpf (Figures 4A–C). GFP expression driven by the SUA2 enhancer in the proximal tubules coincides with the developmental expression of zebrafish maf at 48 hpf (Figure 4D).
FIGURE 4
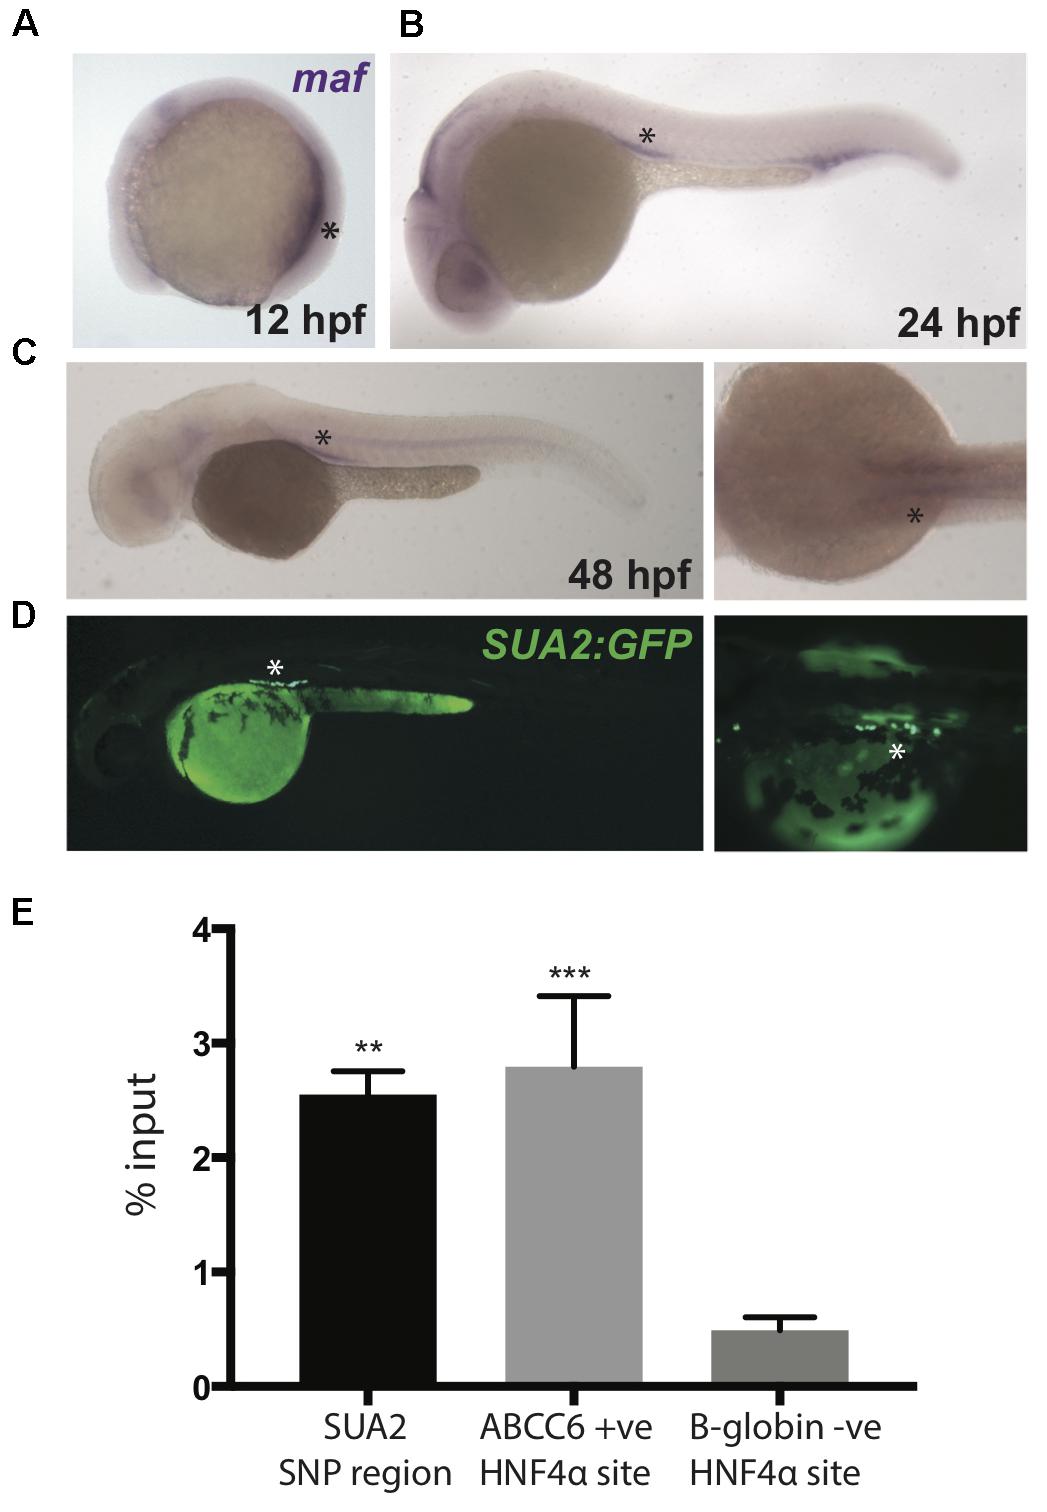
Figure 4. Zebrafish maf coincides with SUA2 enhancer activity. (A–C) Whole mount in situ hybridization with a riboprobe detecting zebrafish maf was performed on wild type embryos at 12, 24, and 48 hpf. maf expression is present in the pronephros at 12 hpf and the proximal tubules at 24 and 48 hpf. (D) The SUA2 SNP region drives expression of GFP in the proximal tubules at 48 hpf. (E) ChIP analysis of the HNF4α binding site at the SUA2 SNP region, a positive HNF4α site at ABCC6 and a negative HNF4α site at B-globin. Binding is shown relative to input chromatin. Bar graphs represent mean from three independent experiments. A one-way ANOVA test indicates a significant difference between the means of the SUA2 SNP region and the negative binding site in B-globin. There is no difference between the positive ABCC6 site and the SUA2 SNP region. Error bars denote standard error of the mean and asterisks indicate significance: ∗p < 0.005; ∗∗p < 0.005, ∗∗∗p < 0.0005.
The HNF4α transcription factor is robustly expressed in the human kidney proximal tubule2 (Ponten et al., 2008) and regulates the expression of genes encoding proteins that control serum urate (Prestin et al., 2014), including PDZK1 (Ketharnathan et al., 2018). Furthermore, variation at the HNF4A locus is associated with serum urate levels (P∼10-6) (Köttgen et al., 2013). SUA2 variants rs4077450 and rs4077451 flank a core HNF4α consensus motif (Supplementary Figure S7) (Wang et al., 2012; Huang et al., 2017) and fall inside an HNF4α ChIP-seq peak in HEPG2 cells (Supplementary Figure S7) (Gerstein et al., 2012; Wang et al., 2012, 2013). We conducted ChIP-qPCR using an anti-HNF4α antibody and confirmed that the SUA2 enhancer is physically bound by HNF4α in HEPG2 cells (Figure 4E). HNF4α binding was not assessed in HEK293 cells because HNF4A is not expressed in this cell line (Ketharnathan et al., 2018). GFP expression driven by the SUA2 enhancer also coincides with hnf4a expression in the zebrafish pronephric duct at these stages (Wingert and Davidson, 2011). Combined, our analyses of the SUA2 kidney enhancer indicate that it functionally and physically connects with the MAFTRR/LINC01229 lincRNA region, is likely responsive to HNF4α, and could contribute to MAF expression. However, several other transcription factor consensus motifs, including those for TFAP2A and HNF4G, are also in close proximity to SUA2 variants rs4077450 and rs4077451, therefore it is possible that the variants could influence the binding of one or more transcription factors.
SUA1 Variants in MAFTRR and LINC01229 Have Targets Independent of MAF That Influence Serum Urate Levels
CoDeS3D and Hi-C data for K562, NHEK, IMR90, HMEC, GM12878 and KBM7 cells provides spatial data supporting the rs7188445 MAFTRR cis-eQTL (Supplementary Table S6). Hi-C data also provide evidence that the lead MAFTRR eQTL SNPs which lie within the MAFTRR and LINC01229 transcripts physically connect with MAF, however, there are no significant MAF eQTLs associated with these connections (Supplementary Table S7).
We also tested whether genes in trans have functional genomic regulatory connections at SUA1 (Rinn and Chang, 2012). CoDeS3D identified 12 spatially supported trans-eQTL with SUA1 variants located within the MAFTRR and LINC01229 transcripts (FDR < 0.05, Supplementary Table S8) and also with the lead SUA1 SNP rs7188445 (Supplementary Table S6). The lead SNPs for these trans-eQTL at SUA1 are different than the lead cis-eQTL SNPs for MAFTRR (Supplementary Figures S2, S12 and Figure 5). Importantly COLOC analysis (Giambartolomei et al., 2014) indicates that these trans-eQTL signals colocalize with the SUA1 serum urate signal (Table 4) indicating that SUA1 could control serum urate levels via trans-eQTL connections. Of the 12 trans-eQTL, only 2 did not colocalize (H4 < 0.5) with the SUA1 signal (CCDC79 and TBC1D10B). Of the 10 remaining trans-eQTL, four genes (i.e., SLC5A8, CCDC6, EHHADH, and DLGAP1) are potentially involved in urate metabolism based on our Gene Ontology (GO) analyses3 and previous urate associations (Köttgen et al., 2013; Kanai et al., 2018) (Figure 5).
FIGURE 5
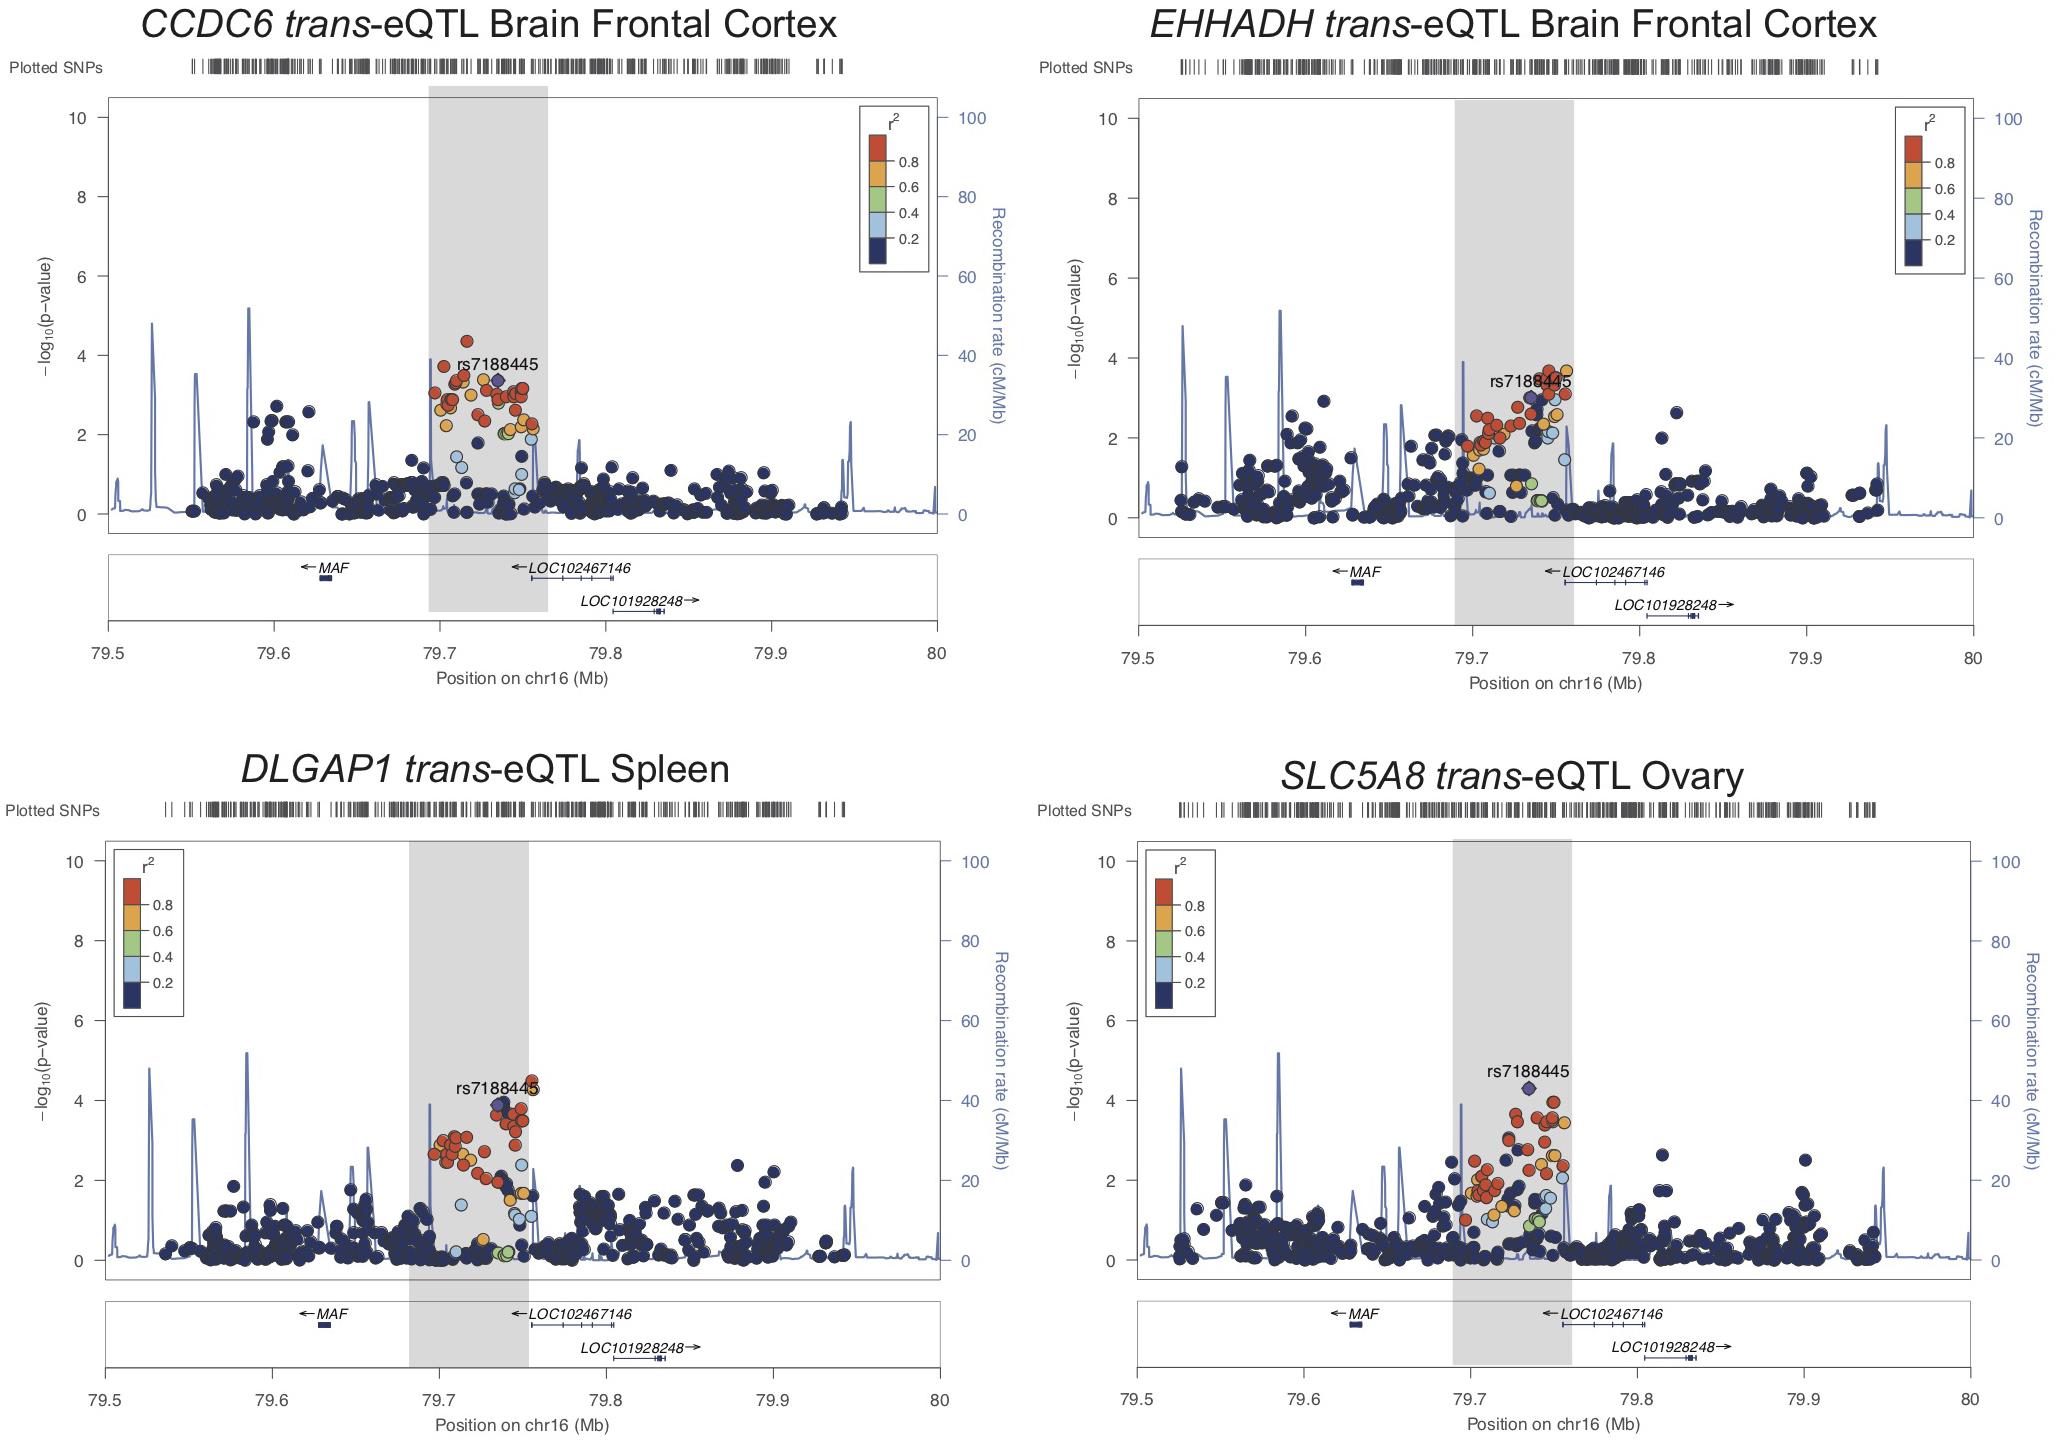
Figure 5. SUA1 connects with and associates with expression of genes in trans. Regional association plots for four trans-eQTL at SUA1 implicated in serum urate and kidney relevant pathways. Dots indicate individual SNPs while their position relative to the left Y-axis indicates significance [-log10(p-value)] of association to serum urate levels. The blue line indicates the recombination rate across the locus. The SUA1 region upstream of MAF is indicated by a gray box. rs7188445 (the lead SUA1 urate SNP) is indicated by a purple dot. The color of the surrounding SNPs indicates the strength of LD with rs7188445 according to the key in the left top hand corner, measured as r2 found in the HapMap data (hg19/1000 genomes Nov 2014) for Europeans. The plot was generated using LocusZoom (Pruim et al., 2010).
TABLE 4
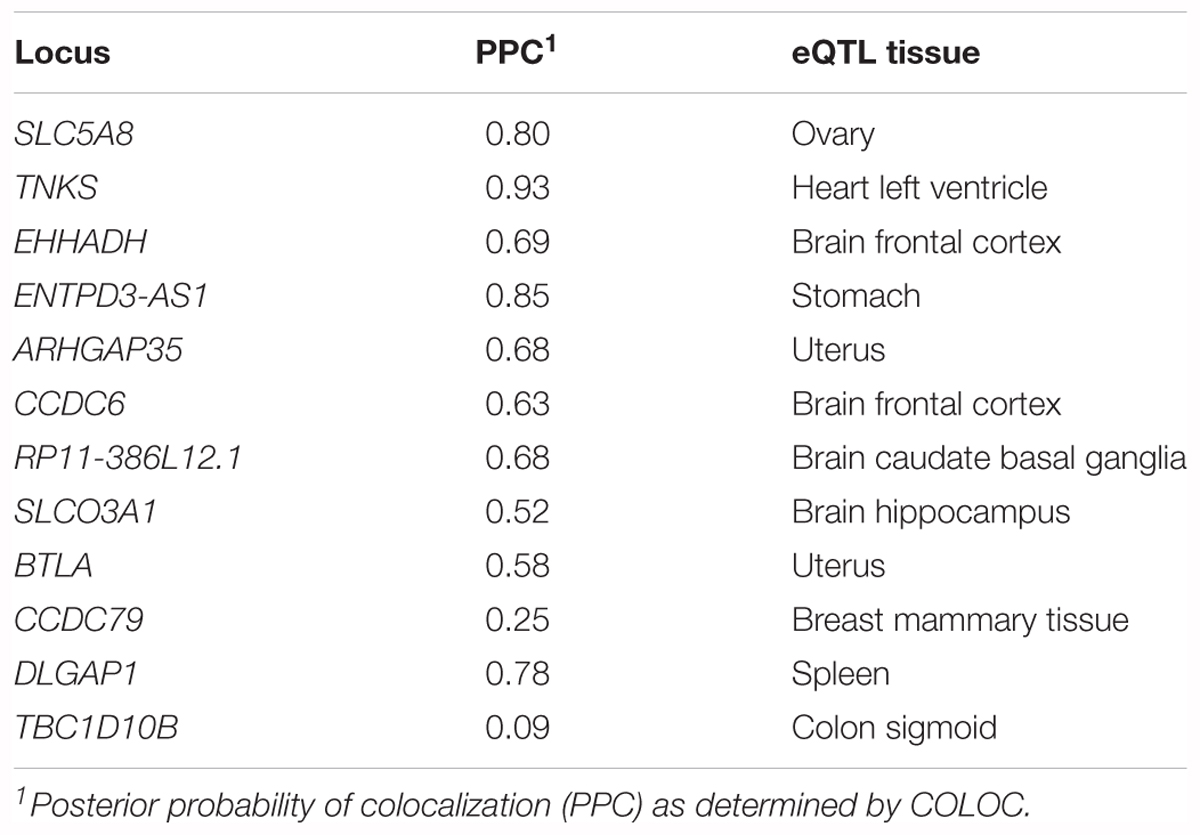
Table 4. Colocalization of Köttgen SUA1 signal and SUA1 trans-eQTL signals.
CCDC6 is in very close proximity to a urate GWAS signal that sits in the intergenic region between CCDC6 and SLC16A9 (Supplementary Figure S13A). CCDC6 and SLC16A9 are strongly co-regulated (p = 6.9 × 10⁻⁹, GeneNetwork.nl) and the lead Köttgen SNP at CCDC6/SLC16A9 (rs1171614) is an eQTL for both SLC16A9 and CCDC6 [GTEx (Carithers and Moore, 2015)]. SUA1 lead urate-raising variant rs7188445_G associates with lowered expression of CCDC6 (Supplementary Figure S13B). At SLC5A8 there is a weak urate GWAS signal in the Japanese population (Kanai et al., 2018) (Supplementary Figure S13A). SLC5A8 is a monocarboxylate transporter that has been strongly implicated in urate transport in the kidney (Merriman, 2015) and associates with the GO biological function term urate transport (p = 6.3 × 10⁻³) (Supplementary Table S9). The urate-raising allele of rs7188445 associates with increased expression of SLC5A8 (Supplementary Figure S13B). The only other genes with a trans-eQTL at SUA1 with evidence for a urate signal was DLGAP1 in the Japanese population (Supplementary Figure S13A). The serum urate-raising and gout risk allele rs7188445_G associates with increased expression of DLGAP1 (Supplementary Figure S13B). The proteins encoded by both DLGAP1 and SLC5A8 contain PDZ3 domains and interact with PDZK1 (Hu et al., 2009), a scaffold protein involved in urate reabsorption within the kidney tubule (Merriman, 2015).
Of the 10 genes with colocalized SUA1 trans-eQTL, EHHADH has the strongest signal in kidney tubule (gene level FDR = 0.078) (Gillies et al., 2018). Expression of EHHADH is enriched in the proximal tubule (Habuka et al., 2014) and associates with the GO biological function term urate transport (p = 7.7 × 10⁻³) in the GeneNetwork database (Supplementary Table S9). The serum urate-raising and gout risk allele rs7188445_G associates with increased MAFTRR expression and lowered EHHADH expression (Supplementary Figure S13B). These analyses collectively indicate that SUA1 variants associate with the expression of serum urate and kidney relevant genes in trans.
LINC01229, MAFTRR, and Trans-eQTL Are Coexpressed With MAF
Our analyses indicate that LINC01229 and MAFTRR, along with genes in trans, likely have functions in serum urate regulation. In addition, the SUA2 enhancer recruits HNF4α and coincides with the expression of zebrafish hnf4a and maf, implicating MAF in serum urate regulation. Supporting this co-expression analysis the GeneNetwork database (Kumar et al., 2013) indicates that MAFTRR and LINC01229 are strongly co-expressed with MAF (p = 5.0 × 10⁻²⁷ and p = 2.4 × 10⁻²⁶, respectively). However, MAFTRR and LINC01229 are not co-expressed (Supplementary Tables S10, S11). Interestingly, HNF4A is co-expressed with LINC01229 (p = 0.011) but not with MAFTRR (Supplementary Tables S10, S11) consistent with the SUA2 variant effect on LINC01229 expression. We also assessed whether the SUA1 trans-eQTL genes are co-expressed with MAFTRR, MAF and/or LINC01229. SLCO3A1, TNKS and ENTPD3 (the likely target of ENTPD3-AS1) are co-regulated with MAF (p = 0.0088, p = 0.011, and p = 0.022, respectively) (Supplementary Table S12) and rs7188445_G associates with increased SLCO3A1, TNKS, and ENTPD3 expression (Supplementary Figure S13B).
MAFTRR and LINC01229 Regulate MAF and Function in Kidney and Urate Relevant Pathways
To test if MAFTRR and LINC01229 can contribute to the regulation of MAF transcription, we depleted MAFTRR and LINC01229 using siRNA in HEK293 cells. Reduction of MAFTRR RNA levels (Figure 6A) resulted in upregulation of endogenous MAF mRNA (Figure 6B). Reduction of LINC01229 RNA levels (Figure 6D) also led to upregulation of endogenous MAF mRNA (Figure 6E). Our results indicate that LINC01229 and MAFTRR normally repress MAF expression in kidney HEK293 cells.
FIGURE 6
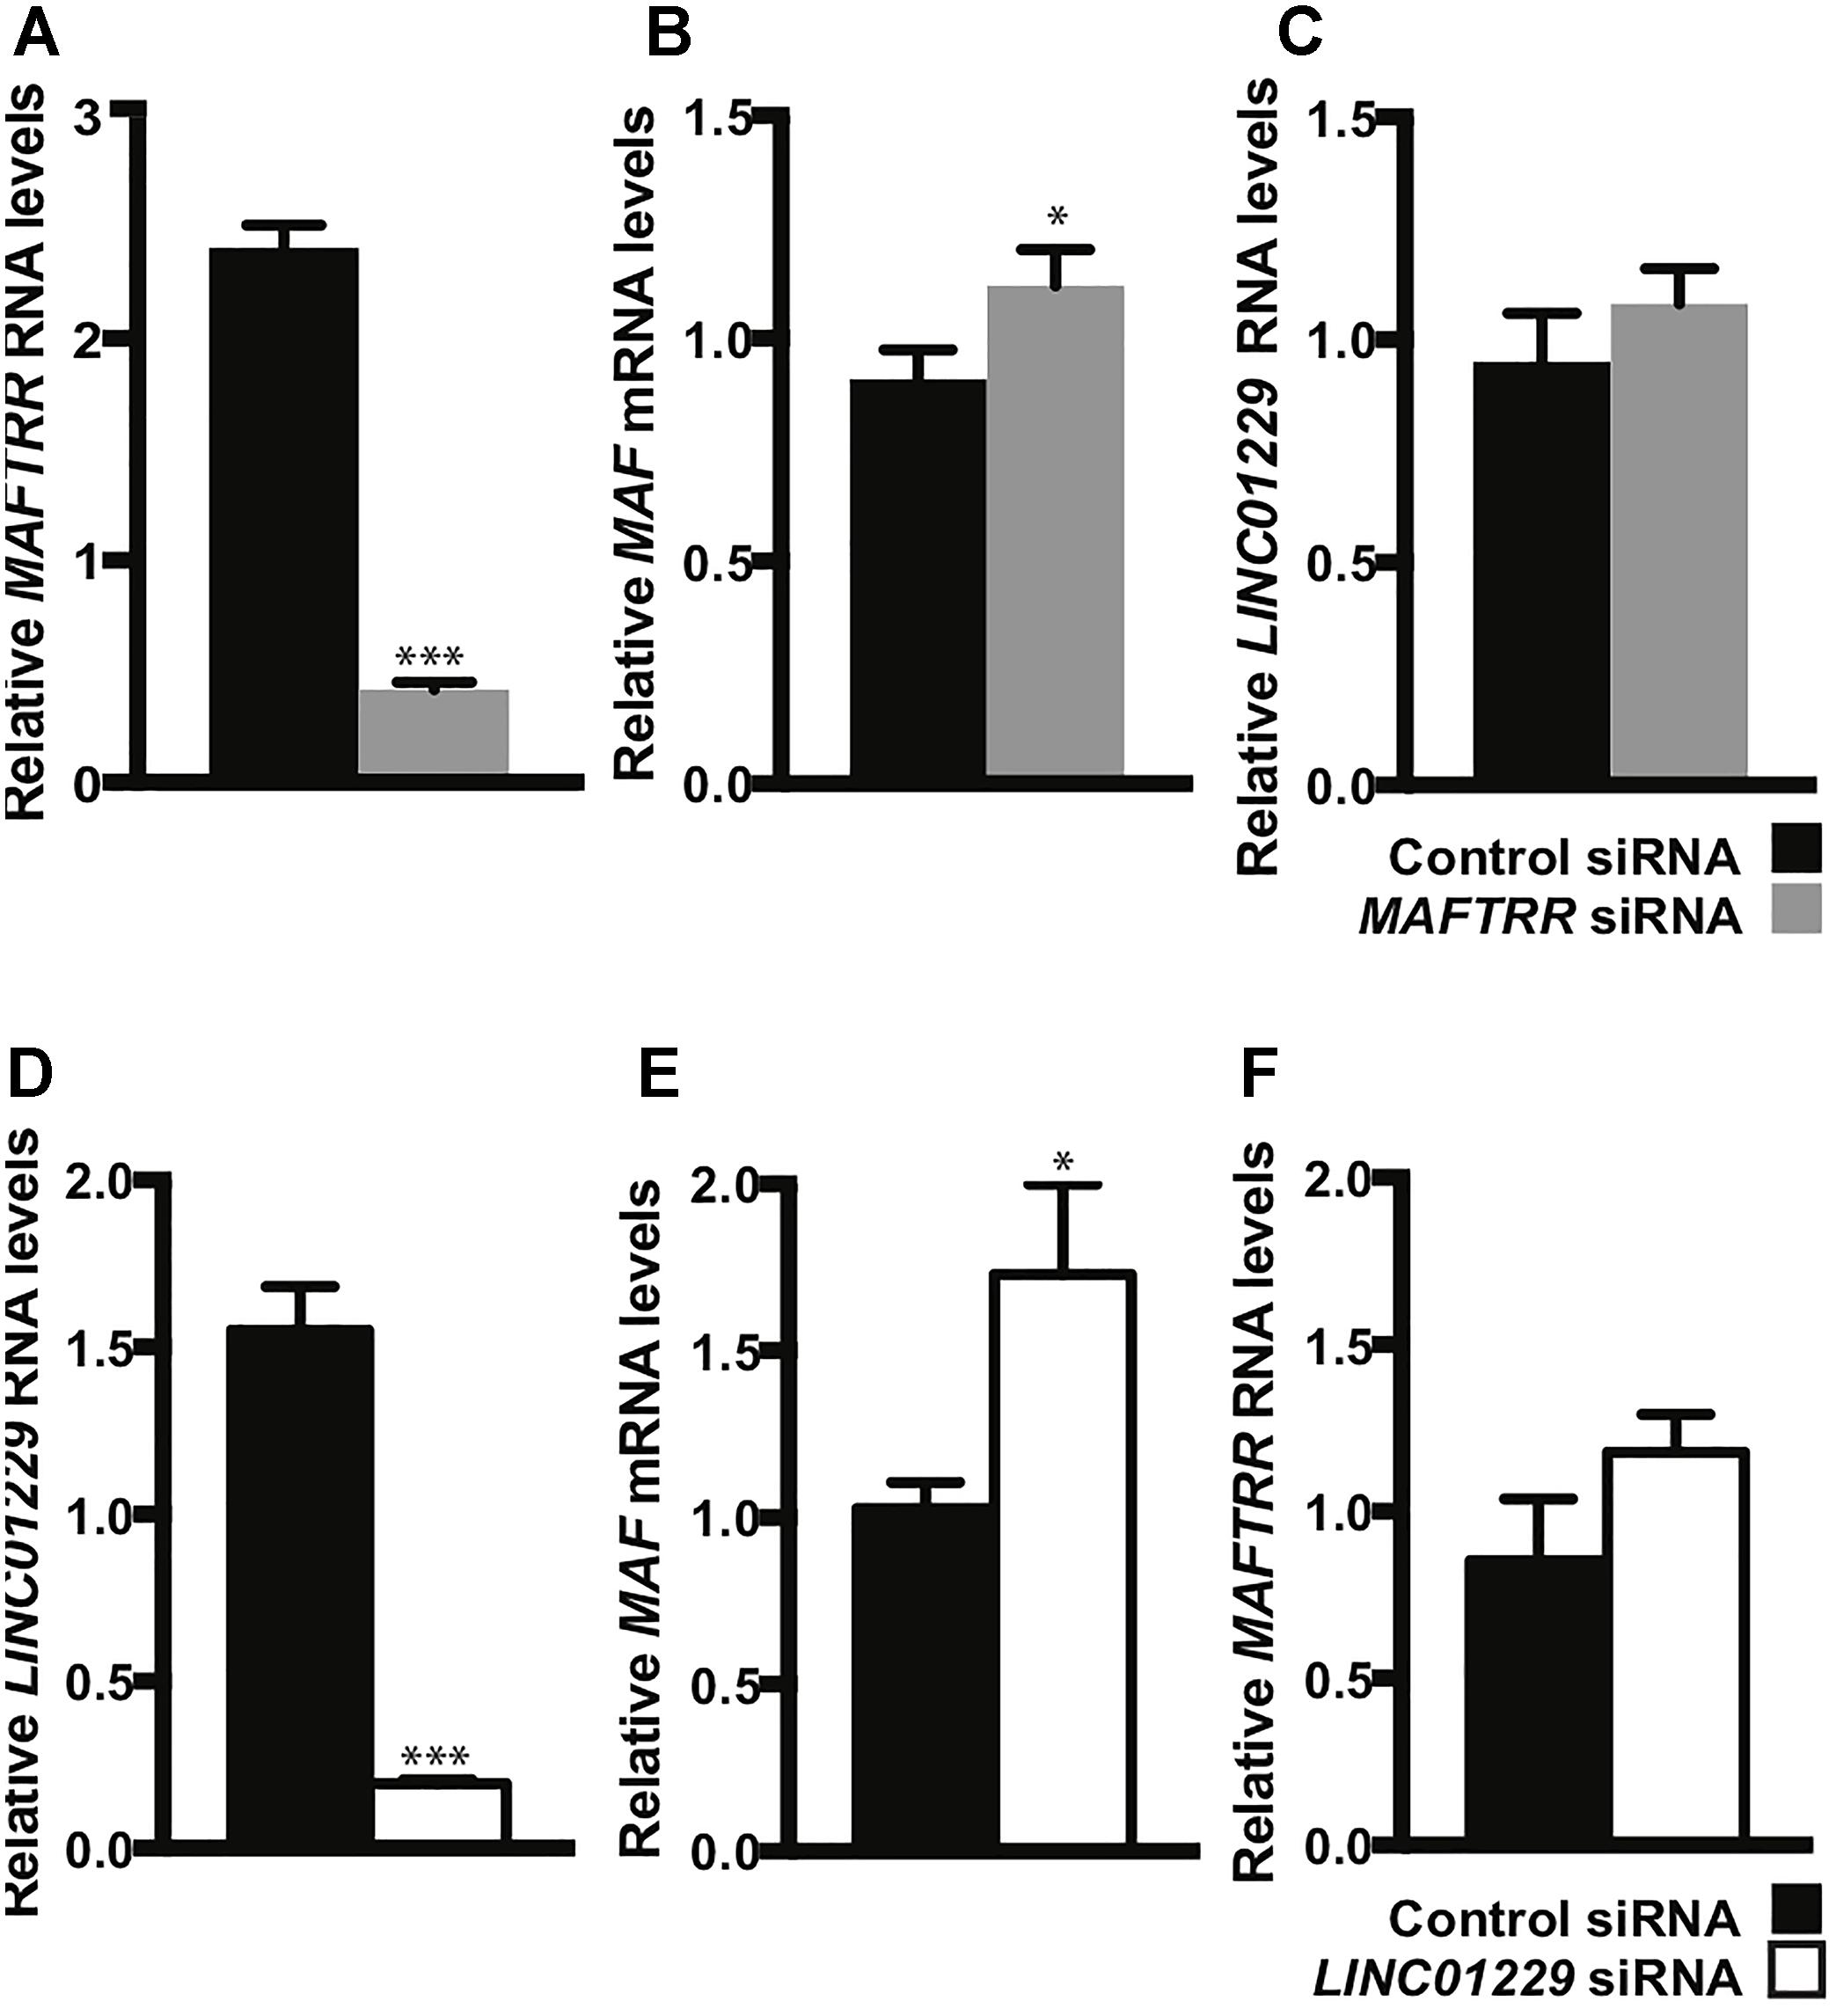
Figure 6. Depletion of lincRNAs increases MAF mRNA levels in HEK293 cells. HEK293 cells were reverse-transfected with a control siRNA, 5 nM MAFTRR siRNA (A–C) or 5 nM LINC01229 siRNA (D–F), and quantitative PCR was performed on RNA collected at 48 h post-transfection. (A) MAFTRR RNA transcript levels. (B) MAF transcript levels. (C) LINC01229 RNA transcript levels. (D) LINC01229 RNA transcript levels. (E) MAF RNA transcript levels. (F) MAFTRR transcript levels. Data represent four biological replicates; statistical significance was determined using unpaired t-test with one tail. Error bars denote standard error of the mean and asterisks indicate significance: ∗p < 0.05; ∗∗∗p < 0.005.
Our analyses indicate that LINC01229 and MAFTRR have the ability to regulate MAF in kidney cells. We assigned putative phenotypes and biological processes to LINC01229 and MAFTRR using GeneNetwork (Kumar et al., 2013), which infers functional enrichment from co-expressed genes4. The top enriched human phenotype ontology terms for MAFTRR and LINC01229 are ‘tubulointerstitial abnormality’ (p = 3.9 × 10⁻⁴) and ‘accelerated skeletal maturation’ (p = 4.3 × 10⁻⁵), respectively. The top GO biological process term for MAFTRR is ‘chondroitin sulfate catabolic process’ (p = 8.4 × 10⁻³). The top GO biological process term for LINC01229 ‘cell development’ (p = 7.9 × 10⁻⁵) implicates LINC01229 in a pathway with MAF and three other serum urate-associated loci, INHBB, INHBC and INHBE, detected by GWAS (Köttgen et al., 2013) (Supplementary Figures S14A,B). Additionally, HNF4A and LINC01229 share GO enrichment in lipid-related pathways including ‘chylomicron assembly,’ ‘phospholipid efflux,’ and ‘high-density lipoprotein assembly’ (Supplementary Figure S14A). LINC01229 also associates with inflammation- and gout-relevant GO terms including ‘interleukin β secretion,’ ‘T-cell differentiation,’ and ‘interleukin 2 biosynthetic process’ (Supplementary Figure S14A).
The MAF Upstream Intergenic Region Is Conserved
The intergenic region upstream of MAF encompassing the lincRNAs is conserved in mammals. Two non-coding RNA loci upstream of MAF in mouse (i.e., Gm30925 and Gm31037) are positionally conserved with respect to MAF, expressed in kidney and homologous with the human lincRNA region (BLAST E-value = 3 × 10-59 and 2 × 10-16, respectively) (Supplementary Figure S15). Moreover, sequence homologous (E-value = 6 × 10-20) to the SUA2 enhancer in mouse is located 276,670 bp upstream of Maf. Our analyses suggest that the ∼300 kb MAF upstream intergenic region marked by SUA1 and SUA2 represents an evolutionarily conserved regulatory network active in kidney and serum urate regulation.
Discussion
Identifying and assigning function to genomic regions encompassing disease-associated variants is crucial for identifying their biological role in disease (Edwards et al., 2013). Here, we provide evidence that the conserved syntenic block encompassing MAF, the lincRNA eQTL SUA1 region, and the enhancer SUA2 region constitute a functional genomic regulatory domain that contributes to serum urate regulation (Figure 7). SUA1 and SUA2 are independent and functionally distinct serum urate-associated regions that physically connect with the lincRNA region and the MAF promoter region (SUA3) (Figure 7). Genetic variation within SUA1 and SUA2 is associated with alterations in the expression of the lincRNAs contained in this genomic block. SUA1 variants physically connect with, and alter the expression of, MAFTRR, LINC01229 and urate-relevant genes in trans. SUA2 marks an enhancer element that physically and functionally connects with LINC01229 expression, recruits HNF4α, and coincides with the developmental expression of zebrafish maf and hnf4a. Finally, we show that the lincRNAs regulate the expression of MAF in cis. By teasing out the molecular mechanisms that underlie this regulatory network, we have assigned serum urate-associated variants to a distinct biological pathway that is active in the kidney and involved in serum urate control.
FIGURE 7
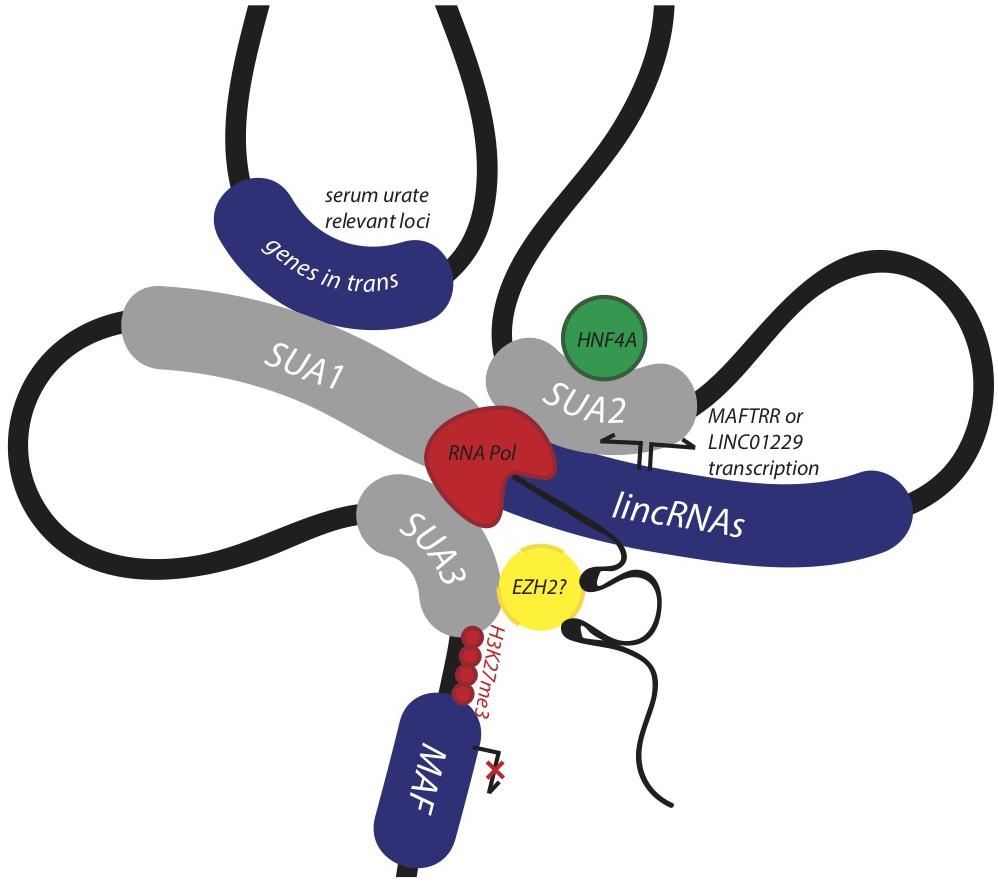
Figure 7. Non-coding urate-associated variants in SUA1 and SUA2 function in a conserved genomic regulatory domain with kidney and serum urate relevant functions. The schematic depicts the proposed 3D structure at the MAF locus and upstream region encompassing SUA1, SUA2, and SUA3 as determined by Hi-C interaction data from the kidney cell line Caki2. The lincRNAs MAFTRR and LINC01229 influence expression of MAF in kidney, while serum urate-associated variants within the SUA2 kidney tubule enhancer physically connect with the lincRNA region, SUA1 and SUA3. SUA2 is bound by HNF4α and SUA2 urate-raising variants increase the expression of LINC01229. SUA1 is a spatially supported eQTL for MAFTRR which functions in the kidney tubule and genes in trans with serum urate relevant functions.
Serum urate excretion is predominantly carried out in the kidney tubules with the remainder managed by the intestine (Merriman, 2015). We observed a colocalization of the SUA1 urate signal and the MAFTRR colon cis-eQTL (Table 2 and Supplementary Figure S2) and the partial overlap with the MAFTRR kidney tubule eQTL signal (Supplementary Figure S2). This is consistent with our co-expression analyses which indicate that MAFTRR associates with the kidney-relevant human phenotype ontology term ‘tubulointerstitial abnormality.’ Collectively these data support a biological role for MAFTRR in serum urate regulation in these tissues.
An inverse relationship between MAFTRR levels and MAF expression has previously been identified in patients with multiple sclerosis, whereby higher levels of MAFTRR in CD4+ T lymphocyte cells lowers expression of MAF (Zhang et al., 2017). This relationship shows a strong correlation with annual relapse rates (Zhang et al., 2017). In our study, the urate-raising alleles in SUA1 increase MAFTRR expression (Table 2 and Supplementary Table S1). Chromosome conformation capture data in T-lymphocytes has identified genomic contacts in the region 3′ to MAFTRR that overlap SUA1 and physically connect with the MAF promoter marked by SUA3. In this genomic conformation the MAFTRR transcripts act as a scaffold for regulatory elements including EZH2 that recruit the repressive histone mark, H3K27me3 (Ranzani et al., 2015) which in turn represses MAF transcription. Our analyses of Hi-C data support this physical connection between SUA1 variants and MAF (Supplementary Table S7). We also observed that depleting MAFTRR or LINC01229 increases MAF transcription in kidney cells (Figure 6), consistent with this chromatin interaction data from T-cells. We propose that the SUA1 variant effect on MAFTRR and/or LINC01229 expression may also contribute to the 3D structure at this locus in a tissue-dependent manner, altering the expression of MAF in cis (Figure 7).
We also observed that SUA1 variants form functional trans chromatin contacts that colocalize with the SUA1 urate signal (Table 4 and Figures 5, 7). We identified SLC5A8 which encodes sodium-coupled monocarboxylate transporter 1 (SMCT1). SLC5A8/SMCT1 transports monocarboxylates into the kidney tubule, which are exchanged for urate by urate reuptake transporters such as SLC22A12/URAT1 (Merriman, 2015). The urate-raising allele of rs7188445 is associated with increased expression of SLC5A8, which would be predicted to increase the monocarboxylate pool for reabsorption of urate. Any serum urate signal at the SLC5A8 locus, if real, is weak (Supplementary Figure S13); nevertheless, our data suggest that the expression of SLC5A8 is controlled from the MAF SUA1 locus. EHHADH (associated with the GO term ‘urate transport’) is involved in fatty acid oxidation, the main energy source for kidney tubule cells (Balaban and Mandel, 1988) and EHHADH mutations have been implicated in Fanconi’s syndrome which is characterized by renal proximal tubule dysfunction (Klootwijk et al., 2014). Furthermore Fanconi’s syndrome can result in hypouricemia due to high urate clearance (Meisel and Diamond, 1977). A reduction in EHHADH expression has been observed in mouse models for chronic kidney disease (Trudu et al., 2017), hyperlipidemia (Mirzoyan et al., 2017), obesity and fatty liver disease (Vandanmagsar et al., 2011). This is consistent with the effect seen for serum urate-raising variant rs7188445_G at SUA1, which associates with lowered EHHADH expression.
We also find that a subset of genes with spatial trans-eQTL at SUA1 are co-regulated with MAF. TNKS and SLCO3A1 are co-regulated with MAF, and expressed in kidney (Tamai et al., 2000; Karner et al., 2010). SLCO3A1 mediates the transport of prostaglandins, thyroxin and vasopressin (Huber et al., 2007) and TNKS is essential for kidney development (Karner et al., 2010). ENTPD3-AS1, likely regulates ENTPD3 (co-regulated with MAF), which is involved in purine metabolism (Kanehisa et al., 2017) of which urate is a by-product.
SUA2, the second independent region of association upstream of MAF, has previously been validated as a functional enhancer by high-throughput massively parallel reporter assays in HEPG2 cells (Kheradpour et al., 2013). Our study confirms that this region represents a conserved enhancer for tissue specific expression in the kidney tubule (Figure 3). A 562-bp DNA fragment containing the rs4077450_rs4077451 SNP region within SUA2 is sufficient to confer kidney tubule expression that coincides with expression of zebrafish maf (Figure 4), matches the tissue expression profile of MAF in human and is consistent with the role MAF plays in kidney tubule development (Imaki et al., 2004). We show that the urate-raising minor alleles also increase enhancer activity in kidney cell lines (Figure 3). Our results indicate that the serum urate-associated SNPs at this region are functional and alter the function of the SUA2 enhancer, consistent with our PAINTOR analyses (Table 3).
The underlying mechanism for enhancer function has been suggested to involve the formation of long-range chromatin loops (Denker and de Laat, 2016) that bring enhancers and promoters into spatial proximity (Dixon et al., 2012). Our analysis of publicly available Hi-C data (Rao et al., 2014) indicates that the SUA2 kidney enhancer element physically interacts with the neighboring lincRNA region, including LINC01229, MAFTRR and part of SUA1 (Figure 3). Hi-C data from renal cells supports this interaction, in addition to a further connection between SUA2 and the MAF promoter (SUA3) (Supplementary Figure S11). Our eQTL analyses indicate that the SUA2 genomic contacts with LINC01229 are functional (Fadason et al., 2017), colocalize with the SUA2 urate signal (Table 2) and that the serum urate-raising alleles of rs4077450 and rs4077451 increase the expression of LINC01229 but not of MAFTRR (Supplementary Figure S8).
Because the SUA2 human enhancer element can drive gene expression in zebrafish kidney, this genomic region must contain highly conserved kidney-responsive regulatory elements. rs4077450 and rs4077451 flank an HNF4α site which has previously been shown to be required for the enhancer activity of the region (Kheradpour et al., 2013). We confirmed that HNF4α binds to this locus in HEPG2 cells (Figure 4E). Previous observations in zebrafish found that hnfa is expressed in the zebrafish proximal tubule in the same cell types and stages in which the SUA2 enhancer is active (Wingert and Davidson, 2011). Therefore, HNF4α is a likely candidate for driving kidney-specific activity of this enhancer. This is consistent with our understanding of (1) the role HNF4α plays in the development of the human kidney tubule (Martovetsky et al., 2013); and (2) the association of HNF4A with serum urate (Köttgen et al., 2013; Ketharnathan et al., 2018). Our co-expression analysis also indicates that HNF4A, is co-expressed with LINC01229 but not MAFTRR, consistent with the SUA2 LINC01229 eQTL and the coincidental expression of the SUA2 enhancer and hnf4a. LINC01229 and HNF4A also share enriched GO terms in lipid relevant pathways that involve genes with (albeit unreplicated) reports of association with urate (e.g., ApoE) (Sun et al., 2015) and gout (e.g., ABCG1 and ABCA1) (Lai et al., 2012) (Supplementary Figure S14).
While the eQTL signals for MAFTRR in all GTEx tissues are confined to the same region that generally overlaps SUA1, the genomic locations of the eQTL signals for LINC01229 are diverse and tissue dependent (Supplementary Figure S2). We propose that while MAFTRR expression is controlled in a similar manner in a range of tissues, LINC01229 expression is under the control of tissue-specific and perhaps development-specific regulatory elements that are distributed throughout the lincRNA locus. The SUA2 region is evidence of one such region: (1) it contains an enhancer element that drives expression exclusively in the developing zebrafish kidney tubule; and (2) it contains SUA genetic variants that have the ability to alter LINC01229 expression. We propose that in kidney, long-range chromatin interactions bring the HNF4α-responsive SUA2 enhancer into close spatial proximity with the SUA1 lincRNA region and the SUA3 MAF promoter region, implicating LINC01229 as a likely regulatory target of the SUA2 enhancer. We predict that this chromosome conformation (Figure 7) would have consequences for MAF expression, as evidenced by the loss of MAF repression following siRNA knockdown of LINC01229 in kidney cells (Figure 6), and consistent with the upregulation of maf observed in hnf4a mutant zebrafish (Davison et al., 2017). Our GO analyses indicate that LINC01229 could function in a cell development pathway with MAF and the inhibin genes INHBC, INHBA and INHBB previously associated with urate (Köttgen et al., 2013). LINC01229 and MAF could mediate serum urate homeostasis through known inhibin pathways such as apoptosis (Denkova et al., 2004) and inflammation (Okuma et al., 2005) consistent with our GO analyses, which identified ‘negative regulation of cell apoptotic process’ and ‘interleukin 1 β secretion’ as enriched terms for LINC01229. In addition to this ‘interleukin 1 β secretion’ is strongly implicated in gout (So and Martinon, 2017).
The multiplicity of phenotype associations at the lincRNA locus suggests that variants at this region and their effect on MAFTRR, MAF and/or LINC01229 could also be biologically important in other disease pathways (Table 1 and Supplementary Figure S1). Serum urate levels have previously been correlated with multiple sclerosis (Wang et al., 2016), hyperthyroidism (Giordano et al., 2001; See et al., 2014), obesity (Tanaka et al., 2015), fatty liver disease and chronic kidney disease and the SUA regions upstream of MAF coincide with GWAS signals of these conditions. SUA1 coincides with liver- and thyroid-related traits whereas SUA2 coincides with kidney related traits (Supplementary Figure S1). MAF expression has also been associated with multiple sclerosis (Zhang et al., 2017), a range of cancers including renal cancer (Ponten et al., 2008), glucagon expression and biosynthesis (Planque et al., 2001; Kataoka et al., 2004; Gosmain et al., 2007) and autoimmune diabetes (Pauza et al., 2001). Thus, the shared association of these diseases at the lincRNA region may provide a causal link to serum urate and/or the expression of the lincRNAs and MAF.
In our analyses, we have identified a program of genes that can be modulated by variants within SUA1 and SUA2 and are likely important in kidney tubule development and function and serum urate regulation. We conclude that tissue-specific and developmental control of the lincRNA region appears to be important for the modulation of MAF and other urate relevant gene pathways in trans.
Materials and Methods
Genetic Analyses
Publicly available summary level statistics from the Köttgen et al. (2013) GWAS for serum urate were used. Conditional association analysis on rs7188445 was performed using the Genome-Wide Complex Trait Analysis (GCTA) software (Yang et al., 2011). 6,654 HapMap2 imputed genotypes from European participants of the Atherosclerosis Risk in Communities study were used as a reference. LD R2 values were calculated using LDlink (Machiela and Chanock, 2015) with the 1000 Genomes European and East Asian reference panels.
PAINTOR Analysis
ImpG (v1.0) (Pasaniuc et al., 2014) was used to impute Z-scores into the European urate GWAS (Köttgen et al., 2013) summary statistics. For the reference haplotypes, the latest release of the 1000 Genomes project was used, and only bi-allelic SNP markers having a minor allele frequency greater than 0.01 in the relevant population were included. All imputed markers with a predicted LD R2 of less than 0.8 were removed. PAINTOR leverages functional genomic annotation data, in addition to genetic association strength, to prioritize functional variants. The LD matrix used for fine mapping of the Köttgen GWAS data in PAINTOR was calculated based on European data from the 1000 Genomes Project Phase 1. The annotation matrix used in PAINTOR was kidney cell-type DHS (Finucane et al., 2015). PAINTOR (v3.0) (Kichaev et al., 2014) was carried out using a LD matrix matched locus file for SUA1 and SUA2.
COLOC Analysis
We used COLOC (Giambartolomei et al., 2014) to assess the similarity between the urate-associated loci SUA1 and SUA2 and publicly available eQTL data from the Genotype Tissue Expression Project (GTEx). COLOC is a Bayesian method that compares four different statistical models at a locus and gives a posterior probability for each test. The four tests are: H0: no causal variant in the GWAS or an eQTL region H1: a casual variant in either the GWAS or the eQTL region but not both, H3: a causal variant in the GWAS and the eQTL region that is different, H4: a causal variant in the GWAS and the eQTL region that is shared.
Integration of GWAS and eQTL Results With CoDeS3D
The Contextualize Developmental SNPs using 3D Information (CoDeS3D) algorithm (GitHub5) (Fadason et al., 2017) was used to identify long-distance regulatory relationships for rs4077450 and rs4077451 (SUA2), rs7188445 (SUA1) and SUA1 SNPs that overlap the MAFTRR transcript. This analysis leverages known spatial associations from Hi-C databases (Rao et al., 2014) and gene expression associations [eQTL data from the GTEx catalog (GTEx 2013)] to assess regulatory connections. Briefly, SNPs were mapped onto Hi-C restriction fragments, the genes that physically interact with these restriction fragments identified and collated (SNP-gene spatial pairs). SNP-gene pairs were screened through GTEx to identify eQTLs. The false discovery rate (FDR) was calculated using a stepwise Benjamini-Hochberg correction procedure and incorporated the number of tests and eQTL value list. A FDR value of <0.05 was accepted as statistically significant (Fadason et al., 2017).
Vectors and Constructs
A DNA fragment (562 bp) harboring rs4077450_rs4077451 (Chr16: 79931421–79931980) was amplified from the genomic DNA of individuals who were heterozygous for the major alleles (rs4077450_T-rs4077451_A) and the minor alleles (rs4077450_G-rs4077451_T), respectively. Primers F: 5′-CCTCCATACAGTGTCCAGCA-3′ and R: 5′-TGGACCGTTTTGGCTTTTAC-3′ were used for amplification. Amplicons were cloned into the pCR®8/GW/TOPO (Invitrogen) entry vector and gateway-cloned into the destination vectors pGL4.23 (addgene 60323) and ZED (Bessa et al., 2009) using LR Clonase® enzyme (Invitrogen) for the enhancer assays in human cell lines and zebrafish, respectively.
Cell Culture and Transfections
Human embryonic kidney HEK293 cells (ATCC) and human hepatocellular carcinoma HEPG2 cells (ATCC) were grown (37°C in a 5% CO2) and maintained in Dulbecco’s Modified Eagle’s Medium (DMEM) and Eagle’s Minimum Essential Media (EMEM), respectively, (Life Technologies), supplemented with 10% fetal bovine serum.
For luciferase assays, HEK293 cells were transiently transfected with pGL4.23 constructs and Renilla, using Lipofectamine 3000 (Invitrogen). Luminescence was measured 48 h post-transfection using the Dual Glo Luciferase Assay (Promega), on the Perkin Elmer Victor X4 plate reader. Values were normalized to the expression of Renilla luciferase.
For the siRNA knockdown experiments, HEK293 cells were reverse-transfected with ON-TARGETplus Non-targeting Control Pool siRNA (5 nM) (Dharmacon Cat# D-001810-10), Lincode SMARTpool LINC01229 siRNA (5 nM) (Dharmacon Cat# R-191862-00-0005), and Lincode SMARTpool MAFTRR (5 nM) (Dharmacon Cat# R-192817-00-0005) using RNAiMax (Invitrogen) for gene expression analysis.
Quantitative PCR
Total RNA was isolated from control and siRNA-treated HEK293 cells at 48 h post-treatment using the NucleoSpin RNA kit (Macherey-Nagel). cDNA was synthesized with qScript cDNA SuperMix (Quanta Biosciences). MAF, MAFTRR and LINC01229 expression were measured using TaKaRa SYBR Premix Ex TaqTM (Clontech) on a LightCycler400 (Roche Diagnostics). Primers MAF F: 5′-AGCAAGTCGACCTCAAG-3′ and R: 5′-CGAGTGGGCTCAGTTATGAAA-3′, MAFTRR F: 5′-CCTGGACAATGCTGGTTTTT-3′ and R: 5′-CACGTCCTTCCATTTTGCTT-3′ and LINC01229 F: 5′-ATGGGAGCTCCACACAGGT-3′ and R: 5′-TGGGTGCCTTTAAACAAGAGA-3′ were used for amplification. Gene expression analyses were carried out on qBase Plus (Biogazelle) and were normalized relative to the mean of reference genes encoding glyceraldehyde 3-phosphate dehydrogenase (GAPDH) and ribosomal protein L13a (RPL13A).
Quantitative Chromatin Immunoprecipitation
Chromatin was extracted from 10-7 HEPG2 cells, sonicated (Vibra Cell VCX130 Sonicator, Sonics) to approximately 500 bp (determined experimentally) and diluted 10 times with immunoprecipitation (IP) buffer as described previously (Veto et al., 2017). Chromatin immunoprecipitation (ChIP) was carried out according to Vaisanen et al. (2005) with minor adjustments. Equal amounts of diluted chromatin in 2 ml IP buffer were pre-cleared (to reduce background) overnight with Dynabeads protein G (Thermo Fisher). Immunoprecipitations were performed overnight at 4°C with 10 μl of a ChIP grade HNF4α (ab41898, Abcam) antibody conjugated to 50 μl of Dynabeads G. The immunocomplexes were then pelleted by centrifugation at 4°C for 1 min at 100 × g and washed sequentially for 5 min by rotation with 1 ml of the following buffers: low-salt wash buffer [20 mM Tris–HCl (pH 8.1), 0.1% SDS, 1% Triton X-100, 2 mM EDTA, 150 mM NaCl], high-salt wash buffer [20 mM Tris–HCl (pH 8.1), 0.1% SDS, 1% Triton X-100, 2 mM EDTA, 500 mM NaCl] and LiCl wash buffer [10 mM Tris–HCl (pH 8.1), 0.25 mM LiCl, 1% (v/v) Nonidet P-40, 1% (w/v) sodium deoxycholate, 1 mM EDTA]. Finally, the beads were washed twice with 1 ml of TE buffer [10 mM Tris–HCl (pH 8.0), 1 mM EDTA] and eluted in ChIP elution buffer (50 mM Tris, pH 8, 10 mM EDTA, 1% SDS) at room temperature for 30 min with rotation. Crosslinking was reversed with Proteinase K (final concentration 40 μg/ml) at 50°C for 2 h, DNA was recovered using phenol:chloroform:isoamyl alcohol (Invitrogen) and precipitated with 0.1 volume of NaCl and 2.5 volumes of ethanol using Ambion® Linear Acrylamide (5 mg/mL) as a carrier. For qPCR analyses, 1 μl of pre-cleared or immunoprecipitated chromatin was used for each reaction. HNF4α binding at the SNP region, negative binding site B-globin and positive binding site ABCC6 (Veto et al., 2017) was expressed relative to the pre-cleared input chromatin after subtraction from no antibody control. Primers SNP region F: 5′-CCTCCATACAGTGTCCAGCA-3′ and R: 5′-TGGACCGTTTTGGCTTTTAC-3′, B-globin F: 5′-AGGACAGGTACGGCTGTCATC-3′ and R: 5′-TTTATGCCCAGCCCTGGCTC-3′ and ABCC6 F: 5′-AGCCCATTGCATAATCTTCTAAGT-3′ and R: 5′-ATGGAGACCGCGTCACAG-3′ were used for amplification.
Zebrafish Enhancer Assays
Wild type (WIK) fish lines were maintained according to established protocols (Westerfield, 2000). The University of Otago Animal Ethics Committee approved all zebrafish research.
An enhancer test vector ZED (Bessa et al., 2009) was used to investigate the enhancer capacity of the genomic region (Chr16: 79931421–79931980) marked by rs4077450 and rs4077451. Single-cell WIK embryos were injected with 1 nl of 30 ng/μl ZED (Bessa et al., 2009) DNA construct containing either of the minor and major fragments for the rs4077450_rs4077451 SNP region and 90 ng/μl Tol2 transposase mRNA (Kawakami, 2005). Injected embryos were screened for Green Fluorescent Protein (GFP) expression 24–120 h post-fertilization (hpf) using a Leica M205 FA fluorescence microscope.
Whole Mount in situ Hybridization
Full length maf riboprobe synthesis and whole mount in situ hybridization was performed as described previously (Monnich et al., 2009). The cDNA of MAF on a pCMV SPORT 6.1 plasmid was acquired from Life Biosciences as the Danio rerio maf cDNA DR.81288. The plasmid was linearized with ApaI and the antisense DIG-labeled riboprobe was generated by in vitro transcription using SP6 RNA polymerase (Roche).
Statistical Analysis
GraphPad PRISM 7 (GraphPad software, San Diego, CA, United States) was used for performing all statistical analysis. One-way ANOVA, (Tukey’s multiple comparisons tests), Fisher exact tests and unpaired t-tests were used for estimating the statistical significance of the luciferase, enhancer assays and quantitative PCR data, respectively. All data are presented as mean and error bars represent standard error of the mean (SEM).
Author Contributions
ML, JH, JO, and TM designed the study. ML performed the functional annotations, the eQTL analyses, the enhancer assays, the in situ hybridization, and the siRNA assays. HS isolated and cloned the rs4077450_rs4077451 minor and major allele fragments into the plasmid constructs and was supervised by JM. AD carried out the luciferase assay and was supervised by JA. RT carried out the conditional analysis. WS and TF carried out the CoDeS3D analyses. ML, JH, and TM wrote the manuscript with input from JO and WW.
Funding
This research was supported by Health Research Council of New Zealand grant #15/623 to TM, JO, and JH. TF was supported by a scholarship from a High Value Nutrition National grant (MBIE/HVN grant #3710040). ML was supported by a Lotteries Health Research Postdoctoral Fellowship.
Conflict of Interest Statement
The authors declare that the research was conducted in the absence of any commercial or financial relationships that could be construed as a potential conflict of interest.
Acknowledgments
We thank Noel Jhinku for management of the Otago Zebrafish Facility.
Supplementary Material
The Supplementary Material for this article can be found online at: https://www.frontiersin.org/articles/10.3389/fgene.2018.00733/full#supplementary-material
Footnotes
- ^ http://jenger.riken.jp:8080
- ^ https://www.proteinatlas.org/
- ^ www.GeneNetwork.nl
- ^ www.genenetwork.nl/genenetwork
- ^ https://github.com/Genome3d/codes3d-v1
References
Balaban, R. S., and Mandel, L. J. (1988). Metabolic substrate utilization by rabbit proximal tubule. An NADH fluorescence study. Am. J. Physiol. 254(3 Pt 2), F407–F416.
Bessa, J., Tena, J. J., de la Calle-Mustienes, E., Fernandez-Minan, A., Naranjo, S., Fernandez, A., et al. (2009). Zebrafish enhancer detection (ZED) vector: a new tool to facilitate transgenesis and the functional analysis of cis-regulatory regions in zebrafish. Dev. Dyn. 238, 2409–2417. doi: 10.1002/dvdy.22051
Bird, C. P., Stranger, B. E., Liu, M., Thomas, D. J., Ingle, C. E., Beazley, C., et al. (2007). Fast-evolving noncoding sequences in the human genome. Genome Biol. 8:R118. doi: 10.1186/gb-2007-8-6-r118
Carithers, L. J., and Moore, H. M. (2015). The genotype-tissue expression (GTEx) project. Biopreserv. Biobank. 13, 307–308. doi: 10.1089/bio.2015.29031.hmm
ENCODE Project Consortium (2012). An integrated encyclopedia of DNA elements in the human genome. Nature 489, 57–74. doi: 10.1038/nature11247
Daassi, D., Hamada, M., Jeon, H., Imamura, Y., NhuTran, M. T., and Takahashi, S. (2016). Differential expression patterns of MafB and c-Maf in macrophages in vivo and in vitro. Biochem. Biophys. Res. Commun. 473, 118–124. doi: 10.1016/j.bbrc.2016.03.063
Dalbeth, N., Merriman, T. R., and Stamp, L. K. (2016). Gout. Lancet 388, 2039–2052. doi: 10.1016/S0140-6736(16)00346-9
Davison, J. M., Lickwar, C. R., Song, L., Breton, G., Crawford, G. E., and Rawls, J. F. (2017). Microbiota regulate intestinal epithelial gene expression by suppressing the transcription factor Hepatocyte nuclear factor 4 alpha. Genome Res. 27, 1195–1206. doi: 10.1101/gr.220111.116
Denker, A., and de Laat, W. (2016). The second decade of 3C technologies: detailed insights into nuclear organization. Genes Dev. 30, 1357–1382. doi: 10.1101/gad.281964.116
Denkova, R., Bourneva, V., Staneva-Dobrovski, L., Zvetkova, E., Baleva, K., Yaneva, E., et al. (2004). In vitro effects of inhibin on apoptosis and apoptosis related proteins in human ovarian granulosa cells. Endocr. Regul. 38, 51–55.
Dhakshinamoorthy, S., and Jaiswal, A. K. (2002). c-Maf negatively regulates ARE-mediated detoxifying enzyme genes expression and anti-oxidant induction. Oncogene 21, 5301–5312. doi: 10.1038/sj.onc.1205642
Dixon, J. R., Selvaraj, S., Yue, F., Kim, A., Li, Y., Shen, Y., et al. (2012). Topological domains in mammalian genomes identified by analysis of chromatin interactions. Nature 485, 376–380. doi: 10.1038/nature11082
Doan, R. N., Bae, B. I., Cubelos, B., Chang, C., Hossain, A. A., Al-Saad, S., et al. (2016). Mutations in human accelerated regions disrupt cognition and social behavior. Cell 167, 341–354.e12. doi: 10.1016/j.cell.2016.08.071
Drummond, I. (2003). Making a zebrafish kidney: a tale of two tubes. Trends Cell Biol. 13, 357–365. doi: 10.1016/S0962-8924(03)00124-7
Edwards, S. L., Beesley, J., French, J. D., and Dunning, A. M. (2013). Beyond GWASs: illuminating the dark road from association to function. Am. J. Hum. Genet. 93, 779–797. doi: 10.1016/j.ajhg.2013.10.012
Ernst, J., and Kellis, M. (2017). Chromatin-state discovery and genome annotation with ChromHMM. Nat. Protoc. 12, 2478–2492. doi: 10.1038/nprot.2017.124
Fadason, T., Ekblad, C., Ingram, J. R., Schierding, W. S., and O’Sullivan, J. M. (2017). Physical interactions and expression quantitative traits loci identify regulatory connections for obesity and type 2 diabetes associated SNPs. Front. Genet. 8:150. doi: 10.3389/fgene.2017.00150
Finucane, H. K., Bulik-Sullivan, B., Gusev, A., Trynka, G., Reshef, Y., Loh, P. R., et al. (2015). Partitioning heritability by functional annotation using genome-wide association summary statistics. Nat. Genet. 47, 1228–1235. doi: 10.1038/ng.3404
Gerstein, M. B., Kundaje, A., Hariharan, M., Landt, S. G., Yan, K. K., Cheng, C., et al. (2012). Architecture of the human regulatory network derived from ENCODE data. Nature 489, 91–100. doi: 10.1038/nature11245
Giambartolomei, C., Vukcevic, D., Schadt, E. E., Franke, L., Hingorani, A. D., Wallace, C., et al. (2014). Bayesian test for colocalisation between pairs of genetic association studies using summary statistics. PLoS Genet. 10:e1004383. doi: 10.1371/journal.pgen.1004383
Gillies, C. E., Putler, R., Menon, R., Otto, E., Yasutake, K., Nair, V., et al. (2018). An eQTL landscape of kidney tissue in human nephrotic syndrome. Am. J. Hum. Genet. 103, 232–244. doi: 10.1016/j.ajhg.2018.07.004
Giordano, N., Santacroce, C., Mattii, G., Geraci, S., Amendola, A., and Gennari, C. (2001). Hyperuricemia and gout in thyroid endocrine disorders. Clin. Exp. Rheumatol. 19, 661–665.
Gosmain, Y., Avril, I., Mamin, A., and Philippe, J. (2007). Pax-6 and c-Maf functionally interact with the alpha-cell-specific DNA element G1 in vivo to promote glucagon gene expression. J. Biol. Chem. 282, 35024–35034. doi: 10.1074/jbc.M702795200
Habuka, M., Fagerberg, L., Hallstrom, B. M., Kampf, C., Edlund, K., Sivertsson, A., et al. (2014). The kidney transcriptome and proteome defined by transcriptomics and antibody-based profiling. PLoS One 9:e116125. doi: 10.1371/journal.pone.0116125
Heintzman, N. D., Hon, G. C., Hawkins, R. D., Kheradpour, P., Stark, A., Harp, L. F., et al. (2009). Histone modifications at human enhancers reflect global cell-type-specific gene expression. Nature 459, 108–112. doi: 10.1038/nature07829
Higashino, T., Matsuo, H., Okada, Y., Nakashima, H., Shimizu, S., Sakiyama, M., et al. (2018). A common variant of MAF/c-MAF, transcriptional factor gene in the kidney, is associated with gout susceptibility. Hum. Cell 31, 10–13. doi: 10.1007/s13577-017-0186-6
Horsfield, J., Ramachandran, A., Reuter, K., LaVallie, E., Collins-Racie, L., Crosier, K., et al. (2002). Cadherin-17 is required to maintain pronephric duct integrity during zebrafish development. Mech. Dev. 115, 15–26. doi: 10.1016/S0925-4773(02)00094-1
Hu, S., Song, E., Tian, R., Ma, S., Yang, T., Mu, Y., et al. (2009). Systematic analysis of a simple adaptor protein PDZK1: ligand identification, interaction and functional prediction of complex. Cell Physiol. Biochem. 24, 231–242. doi: 10.1159/000233258
Huang, Y. F., Gulko, B., and Siepel, A. (2017). Fast, scalable prediction of deleterious noncoding variants from functional and population genomic data. Nat. Genet. 49, 618–624. doi: 10.1038/ng.3810
Huber, R. D., Gao, B., Sidler Pfandler, M. A., Zhang-Fu, W., Leuthold, S., Hagenbuch, B., et al. (2007). Characterization of two splice variants of human organic anion transporting polypeptide 3A1 isolated from human brain. Am. J. Physiol. Cell Physiol. 292, C795–C806. doi: 10.1152/ajpcell.00597.2005
Hyndman, D., Liu, S., and Miner, J. N. (2016). Urate handling in the human body. Curr. Rheumatol. Rep. 18:34. doi: 10.1007/s11926-016-0587-7
Imaki, J., Tsuchiya, K., Mishima, T., Onodera, H., Kim, J. I., Yoshida, K., et al. (2004). Developmental contribution of c-maf in the kidney: distribution and developmental study of c-maf mRNA in normal mice kidney and histological study of c-maf knockout mice kidney and liver. Biochem. Biophys. Res. Commun. 320, 1323–1327. doi: 10.1016/j.bbrc.2004.05.222
Jhang, J. J., and Yen, G. C. (2017). The role of Nrf2 in NLRP3 inflammasome activation. Cell. Mol. Immunol. 14, 1011–1012. doi: 10.1038/cmi.2017.114
Kanai, M., Akiyama, M., Takahashi, A., Matoba, N., Momozawa, Y., Ikeda, M., et al. (2018). Genetic analysis of quantitative traits in the Japanese population links cell types to complex human diseases. Nat. Genet. 50, 390–400. doi: 10.1038/s41588-018-0047-6
Kanehisa, M., Furumichi, M., Tanabe, M., Sato, Y., and Morishima, K. (2017). KEGG: new perspectives on genomes, pathways, diseases and drugs. Nucleic Acids Res. 45, D353–D361. doi: 10.1093/nar/gkw1092
Karner, C. M., Merkel, C. E., Dodge, M., Ma, Z., Lu, J., Chen, C., et al. (2010). Tankyrase is necessary for canonical Wnt signaling during kidney development. Dev. Dyn. 239, 2014–2023. doi: 10.1002/dvdy.22340
Kataoka, K., Shioda, S., Ando, K., Sakagami, K., Handa, H., and Yasuda, K. (2004). Differentially expressed Maf family transcription factors, c-Maf and MafA, activate glucagon and insulin gene expression in pancreatic islet alpha- and beta-cells. J. Mol. Endocrinol. 32, 9–20. doi: 10.1677/jme.0.0320009
Kawakami, K. (2005). Transposon tools and methods in zebrafish. Dev. Dyn. 234, 244–254. doi: 10.1002/dvdy.20516
Ketharnathan, S., Leask, M., Boocock, J., Phipps-Green, A. J., Antony, J., O’Sullivan, J. M., et al. (2018). A non-coding genetic variant maximally associated with serum urate levels is functionally linked to HNF4A-dependent PDZK1 expression. Hum. Mol. Genet. 27, 3964–3973. doi: 10.1093/hmg/ddy295
Kheradpour, P., Ernst, J., Melnikov, A., Rogov, P., Wang, L., Zhang, X., et al. (2013). Systematic dissection of regulatory motifs in 2000 predicted human enhancers using a massively parallel reporter assay. Genome Res. 23, 800–811. doi: 10.1101/gr.144899.112
Kichaev, G., Yang, W. Y., Lindstrom, S., Hormozdiari, F., Eskin, E., Price, A. L., et al. (2014). Integrating functional data to prioritize causal variants in statistical fine-mapping studies. PLoS Genet. 10:e1004722. doi: 10.1371/journal.pgen.1004722
Kikuchi, K., Iida, M., Ikeda, N., Moriyama, S., Hamada, M., Takahashi, S., et al. (2018). Macrophages switch their phenotype by regulating Maf expression during different phases of inflammation. J. Immunol. 201, 635–651. doi: 10.4049/jimmunol.1800040
Klootwijk, E. D., Reichold, M., Helip-Wooley, A., Tolaymat, A., Broeker, C., Robinette, S. L., et al. (2014). Mistargeting of peroxisomal EHHADH and inherited renal Fanconi’s syndrome. N. Engl. J. Med. 370, 129–138. doi: 10.1056/NEJMoa1307581
Ko, Y. A., Yi, H., Qiu, C., Huang, S., Park, J., Ledo, N., et al. (2017). Genetic-variation-driven gene-expression changes highlight genes with important functions for kidney disease. Am. J. Hum. Genet. 100, 940–953. doi: 10.1016/j.ajhg.2017.05.004
Köttgen, A., Albrecht, E., Teumer, A., Vitart, V., Krumsiek, J., Hundertmark, C., et al. (2013). Genome-wide association analyses identify 18 new loci associated with serum urate concentrations. Nat. Genet. 45, 145–154. doi: 10.1038/ng.2500
Kumar, V., Westra, H. J., Karjalainen, J., Zhernakova, D. V., Esko, T., Hrdlickova, B., et al. (2013). Human disease-associated genetic variation impacts large intergenic non-coding RNA expression. PLoS Genet. 9:e1003201. doi: 10.1371/journal.pgen.1003201
Lai, H. M., Chen, C. J., Su, B. Y., Chen, Y. C., Yu, S. F., Yen, J. H., et al. (2012). Gout and type 2 diabetes have a mutual inter-dependent effect on genetic risk factors and higher incidences. Rheumatology 51, 715–720. doi: 10.1093/rheumatology/ker373
Machiela, M. J., and Chanock, S. J. (2015). LDlink: a web-based application for exploring population-specific haplotype structure and linking correlated alleles of possible functional variants. Bioinformatics 31, 3555–3557. doi: 10.1093/bioinformatics/btv402
Maiuolo, J., Oppedisano, F., Gratteri, S., Muscoli, C., and Mollace, V. (2016). Regulation of uric acid metabolism and excretion. Int. J. Cardiol. 213, 8–14. doi: 10.1016/j.ijcard.2015.08.109
Martovetsky, G., Tee, J. B., and Nigam, S. K. (2013). Hepatocyte nuclear factors 4alpha and 1alpha regulate kidney developmental expression of drug-metabolizing enzymes and drug transporters. Mol. Pharmacol. 84, 808–823. doi: 10.1124/mol.113.088229
Meisel, A. D., and Diamond, H. S. (1977). Hyperuricosuria in the Fanconi syndrome. Am. J. Med. Sci. 273, 109–115. doi: 10.1097/00000441-197701000-00013
Merriman, T. R. (2015). An update on the genetic architecture of hyperuricemia and gout. Arthritis Res. Ther. 17:98. doi: 10.1186/s13075-015-0609-2
Mirza, A. H., Kaur, S., Brorsson, C. A., and Pociot, F. (2014). Effects of GWAS-associated genetic variants on lncRNAs within IBD and T1D candidate loci. PLoS One 9:e105723. doi: 10.1371/journal.pone.0105723
Mirzoyan, K., Klavins, K., Koal, T., Gillet, M., Marsal, D., Denis, C., et al. (2017). Increased urine acylcarnitines in diabetic ApoE-/- mice: hydroxytetradecadienoylcarnitine (C14:2-OH) reflects diabetic nephropathy in a context of hyperlipidemia. Biochem. Biophys. Res. Commun. 487, 109–115. doi: 10.1016/j.bbrc.2017.04.026
Monnich, M., Banks, S., Eccles, M., Dickinson, E., and Horsfield, J. (2009). Expression of cohesin and condensin genes during zebrafish development supports a non-proliferative role for cohesin. Gene Expr. Patterns 9, 586–594. doi: 10.1016/j.gep.2009.08.004
Okada, Y., Sim, X., Go, M. J., Wu, J. Y., Gu, D., Takeuchi, F., et al. (2012). Meta-analysis identifies multiple loci associated with kidney function-related traits in east Asian populations. Nat. Genet. 44, 904–909. doi: 10.1038/ng.2352
Okuma, Y., O’Connor, A. E., Muir, J. A., Stanton, P. G., de Kretser, D. M., and Hedger, M. P. (2005). Regulation of activin A and inhibin B secretion by inflammatory mediators in adult rat Sertoli cell cultures. J. Endocrinol. 187, 125–134. doi: 10.1677/joe.1.06266
Pasaniuc, B., Zaitlen, N., Shi, H., Bhatia, G., Gusev, A., Pickrell, J., et al. (2014). Fast and accurate imputation of summary statistics enhances evidence of functional enrichment. Bioinformatics 30, 2906–2914. doi: 10.1093/bioinformatics/btu416
Pauza, M. E., Nguyen, A., Wolfe, T., Ho, I. C., Glimcher, L. H., von Herrath, M., et al. (2001). Variable effects of transgenic c-Maf on autoimmune diabetes. Diabetes Metab. Res. Rev. 50, 39–46. doi: 10.2337/diabetes.50.1.39
Peng, S., Lalani, S., Leavenworth, J. W., Ho, I. C., and Pauza, M. E. (2007). c-Maf interacts with c-Myb to down-regulate Bcl-2 expression and increase apoptosis in peripheral CD4 cells. Eur. J. Immunol. 37, 2868–2880. doi: 10.1002/eji.200636979
Phipps-Green, A. J., Merriman, M. E., Topless, R., Altaf, S., Montgomery, G. W., Franklin, C., et al. (2016). Twenty-eight loci that influence serum urate levels: analysis of association with gout. Ann. Rheum. Dis. 75, 124–130. doi: 10.1136/annrheumdis-2014-205877
Planque, N., Leconte, L., Coquelle, F. M., Benkhelifa, S., Martin, P., Felder-Schmittbuhl, M. P., et al. (2001). Interaction of Maf transcription factors with Pax-6 results in synergistic activation of the glucagon promoter. J. Biol. Chem. 276, 35751–35760. doi: 10.1074/jbc.M104523200
Polychronopoulos, D., King, J. W. D., Nash, A. J., Tan, G., and Lenhard, B. (2017). Conserved non-coding elements: developmental gene regulation meets genome organization. Nucleic Acids Res. 45, 12611–12624. doi: 10.1093/nar/gkx1074
Ponten, F., Jirstrom, K., and Uhlen, M. (2008). The human protein atlas–a tool for pathology. J. Pathol. 216, 387–393. doi: 10.1002/path.2440
Porcu, E., Medici, M., Pistis, G., Volpato, C. B., Wilson, S. G., Cappola, A. R., et al. (2013). A meta-analysis of thyroid-related traits reveals novel loci and gender-specific differences in the regulation of thyroid function. PLoS Genet. 9:e1003266. doi: 10.1371/journal.pgen.1003266
Prestin, K., Wolf, S., Feldtmann, R., Hussner, J., Geissler, I., Rimmbach, C., et al. (2014). Transcriptional regulation of urate transportosome member SLC2A9 by nuclear receptor HNF4alpha. Am. J. Physiol. Renal Physiol. 307, F1041–F1051. doi: 10.1152/ajprenal.00640.2013
Pruim, R. J., Welch, R. P., Sanna, S., Teslovich, T. M., Chines, P. S., Gliedt, T. P., et al. (2010). LocusZoom: regional visualization of genome-wide association scan results. Bioinformatics 26, 2336–2337. doi: 10.1093/bioinformatics/btq419
Ranzani, V., Rossetti, G., Panzeri, I., Arrigoni, A., Bonnal, R. J., Curti, S., et al. (2015). The long intergenic noncoding RNA landscape of human lymphocytes highlights the regulation of T cell differentiation by linc-MAF-4. Nat. Immunol. 16, 318–325. doi: 10.1038/ni.3093
Rao, S. S., Huntley, M. H., Durand, N. C., Stamenova, E. K., Bochkov, I. D., Robinson, J. T., et al. (2014). A 3D map of the human genome at kilobase resolution reveals principles of chromatin looping. Cell 159, 1665–1680. doi: 10.1016/j.cell.2014.11.021
Rinn, J. L., and Chang, H. Y. (2012). Genome regulation by long noncoding RNAs. Annu. Rev. Biochem. 81, 145–166. doi: 10.1146/annurev-biochem-051410-092902
See, L. C., Kuo, C. F., Yu, K. H., Luo, S. F., Chou, I. J., Ko, Y. S., et al. (2014). Hyperthyroid and hypothyroid status was strongly associated with gout and weakly associated with hyperuricaemia. PLoS One 9:e114579. doi: 10.1371/journal.pone.0114579
Sharaf El Din, U. A. A., Salem, M. M., and Abdulazim, D. O. (2017). Uric acid in the pathogenesis of metabolic, renal, and cardiovascular diseases: a review. J. Adv. Res. 8, 537–548. doi: 10.1016/j.jare.2016.11.004
So, A. K., and Martinon, F. (2017). Inflammation in gout: mechanisms and therapeutic targets. Nat. Rev. Rheumatol. 13, 639–647. doi: 10.1038/nrrheum.2017.155
Sun, Y. P., Zhang, B., Miao, L., Wang, X. M., Yu, J. H., Luo, L., et al. (2015). Association of apolipoprotein E (ApoE) polymorphisms with risk of primary hyperuricemia in Uygur men, Xinjiang, China. Lipids Health Dis. 14:25. doi: 10.1186/s12944-015-0025-2
Tamai, I., Nezu, J., Uchino, H., Sai, Y., Oku, A., Shimane, M., et al. (2000). Molecular identification and characterization of novel members of the human organic anion transporter (OATP) family. Biochem. Biophys. Res. Commun. 273, 251–260. doi: 10.1006/bbrc.2000.2922
Tan, J. Y., Smith, A. A. T., Ferreira da Silva, M., Matthey-Doret, C., Rueedi, R., Sonmez, R., et al. (2017). cis-Acting complex-trait-associated lincRNA expression correlates with modulation of chromosomal architecture. Cell Rep. 18, 2280–2288. doi: 10.1016/j.celrep.2017.02.009
Tanaka, K., Ogata, S., Tanaka, H., Omura, K., Honda, C., Osaka Twin Research, Group, et al. (2015). The relationship between body mass index and uric acid: a study on Japanese adult twins. Environ. Health Prev. Med. 20, 347–353. doi: 10.1007/s12199-015-0473-3
Teumer, A., Rawal, R., Homuth, G., Ernst, F., Heier, M., Evert, M., et al. (2011). Genome-wide association study identifies four genetic loci associated with thyroid volume and goiter risk. Am. J. Hum. Genet. 88, 664–673. doi: 10.1016/j.ajhg.2011.04.015
Thurman, R. E., Rynes, E., Humbert, R., Vierstra, J., Maurano, M. T., Haugen, E., et al. (2012). The accessible chromatin landscape of the human genome. Nature 489, 75–82. doi: 10.1038/nature11232
Tin, A., Woodward, O. M., Kao, W. H., Liu, C. T., Lu, X., Nalls, M. A., et al. (2011). Genome-wide association study for serum urate concentrations and gout among African Americans identifies genomic risk loci and a novel URAT1 loss-of-function allele. Hum. Mol. Genet. 20, 4056–4068. doi: 10.1093/hmg/ddr307
Trudu, M., Schaeffer, C., Riba, M., Ikehata, M., Brambilla, P., Messa, P., et al. (2017). Early involvement of cellular stress and inflammatory signals in the pathogenesis of tubulointerstitial kidney disease due to UMOD mutations. Sci. Rep. 7:7383. doi: 10.1038/s41598-017-07804-6
Vaisanen, S., Dunlop, T. W., Sinkkonen, L., Frank, C., and Carlberg, C. (2005). Spatio-temporal activation of chromatin on the human CYP24 gene promoter in the presence of 1alpha,25-Dihydroxyvitamin D3. J. Mol. Biol. 350, 65–77. doi: 10.1016/j.jmb.2005.04.057
Vandanmagsar, B., Youm, Y. H., Ravussin, A., Galgani, J. E., Stadler, K., Mynatt, R. L., et al. (2011). The NLRP3 inflammasome instigates obesity-induced inflammation and insulin resistance. Nat. Med. 17, 179–188. doi: 10.1038/nm.2279
Veto, B., Bojcsuk, D., Bacquet, C., Kiss, J., Sipeki, S., Martin, L., et al. (2017). The transcriptional activity of hepatocyte nuclear factor 4 alpha is inhibited via phosphorylation by ERK1/2. PLoS One 12:e0172020. doi: 10.1371/journal.pone.0172020
Wang, J., Zhuang, J., Iyer, S., Lin, X., Whitfield, T. W., Greven, M. C., et al. (2012). Sequence features and chromatin structure around the genomic regions bound by 119 human transcription factors. Genome Res. 22, 1798–1812. doi: 10.1101/gr.139105.112
Wang, J., Zhuang, J., Iyer, S., Lin, X. Y., Greven, M. C., Kim, B. H., et al. (2013). Factorbook.org: a Wiki-based database for transcription factor-binding data generated by the ENCODE consortium. Nucleic Acids Res. 41, D171–D176. doi: 10.1093/nar/gks1221
Wang, L., Hu, W., Wang, J., Qian, W., and Xiao, H. (2016). Low serum uric acid levels in patients with multiple sclerosis and neuromyelitis optica: an updated meta-analysis. Mult. Scler. Relat. Disord. 9, 17–22. doi: 10.1016/j.msard.2016.05.008
Westerfield, M. (2000). The Zebrafish Book: a Guide for the Laboratory use of Zebrafish. Available at: http://zfin.org/zf_info/zfbook/zfbk.html
Wingert, R. A., and Davidson, A. J. (2011). Zebrafish nephrogenesis involves dynamic spatiotemporal expression changes in renal progenitors and essential signals from retinoic acid and irx3b. Dev. Dyn. 240, 2011–2027. doi: 10.1002/dvdy.22691
Wingert, R. A., Selleck, R., Yu, J., Song, H. D., Chen, Z., Song, A., et al. (2007). The cdx genes and retinoic acid control the positioning and segmentation of the zebrafish pronephros. PLoS Genet. 3:e189. doi: 10.1371/journal.pgen.0030189
Yang, D., Jang, I., Choi, J., Kim, M. S., Lee, A. J., Kim, H., et al. (2018). 3DIV: a 3D-genome Interaction Viewer and database. Nucleic Acids Res. 46, D52–D57. doi: 10.1093/nar/gkx1017
Yang, J., Lee, S. H., Goddard, M. E., and Visscher, P. M. (2011). GCTA: a tool for genome-wide complex trait analysis. Am. J. Hum. Genet. 88, 76–82. doi: 10.1016/j.ajhg.2010.11.011
Zhan, M., Chen, G., Pan, C. M., Gu, Z. H., Zhao, S. X., Liu, W., et al. (2014). Genome-wide association study identifies a novel susceptibility gene for serum TSH levels in Chinese populations. Hum. Mol. Genet. 23, 5505–5517. doi: 10.1093/hmg/ddu250
Keywords: enhancer, eQTL, gout, HNF4A, lincRNA, MAF, non-coding, serum urate
Citation: Leask M, Dowdle A, Salvesen H, Topless R, Fadason T, Wei W, Schierding W, Marsman J, Antony J, O’Sullivan JM, Merriman TR and Horsfield JA (2019) Functional Urate-Associated Genetic Variants Influence Expression of lincRNAs LINC01229 and MAFTRR. Front. Genet. 9:733. doi: 10.3389/fgene.2018.00733
Received: 27 September 2018; Accepted: 22 December 2018;
Published: 21 January 2019.
Edited by:
Yafei Li, Army Medical University, ChinaReviewed by:
Zhibin Wang, Johns Hopkins University, United StatesShicheng Guo, Marshfield Clinic Research Institute, United States
Copyright © 2019 Leask, Dowdle, Salvesen, Topless, Fadason, Wei, Schierding, Marsman, Antony, O’Sullivan, Merriman and Horsfield. This is an open-access article distributed under the terms of the Creative Commons Attribution License (CC BY). The use, distribution or reproduction in other forums is permitted, provided the original author(s) and the copyright owner(s) are credited and that the original publication in this journal is cited, in accordance with accepted academic practice. No use, distribution or reproduction is permitted which does not comply with these terms.
*Correspondence: Tony R. Merriman, tony.merriman@otago.ac.nz Julia A. Horsfield, julia.horsfield@otago.ac.nz