 Bimala Malla
 Xuanzong Guo
 Gökçe Senger
 Zoi Chasapopoulou
 Ferah Yildirim
- 1Department of Psychiatry and Psychotherapy, Charité-Universitätsmedizin Berlin, Berlin, Germany
- 2Department of Experimental Oncology, IEO European Institute of Oncology IRCCS, Milan, Italy
Huntington’s disease (HD) is a chronic neurodegenerative disorder caused by an expansion of polyglutamine repeats in exon 1 of the Huntingtin gene. Transcriptional dysregulation accompanied by epigenetic alterations is an early and central disease mechanism in HD yet, the exact mechanisms and regulators, and their associated gene expression programs remain incompletely understood. This systematic review investigates genome-wide transcriptional studies that were conducted using RNA sequencing (RNA-seq) technology in HD patients and models. The review protocol was registered at the Open Science Framework (OSF). The biomedical literature and gene expression databases, PubMed and NCBI BioProject, Array Express, European Nucleotide Archive (ENA), European Genome-Phenome Archive (EGA), respectively, were searched using the defined terms specified in the protocol following the PRISMA guidelines. We conducted a complete literature and database search to retrieve all RNA-seq-based gene expression studies in HD published until August 2020, retrieving 288 articles and 237 datasets from PubMed and the databases, respectively. A total of 27 studies meeting the eligibility criteria were included in this review. Collectively, comparative analysis of the datasets revealed frequent genes that are consistently dysregulated in HD. In postmortem brains from HD patients, DNAJB1, HSPA1B and HSPB1 genes were commonly upregulated across all brain regions and cell types except for medium spiny neurons (MSNs) at symptomatic disease stage, and HSPH1 and SAT1 genes were altered in expression in all symptomatic brain datasets, indicating early and sustained changes in the expression of genes related to heat shock response as well as response to misfolded proteins. Specifically in indirect pathway medium spiny neurons (iMSNs), mitochondria related genes were among the top uniquely dysregulated genes. Interestingly, blood from HD patients showed commonly differentially expressed genes with a number of brain regions and cells, with the highest number of overlapping genes with MSNs and BA9 region at symptomatic stage. We also found the differential expression and predicted altered activity of a set of transcription factors and epigenetic regulators, including BCL6, EGR1, FOSL2 and CREBBP, HDAC1, KDM4C, respectively, which may underlie the observed transcriptional changes in HD. Altogether, our work provides a complete overview of the transcriptional studies in HD, and by data synthesis, reveals a number of common and unique gene expression and regulatory changes across different cell and tissue types in HD. These changes could elucidate new insights into molecular mechanisms of differential vulnerability in HD.
Systematic Review Registration: https://osf.io/pm3wq
Introduction
Huntington’s disease (HD) is a dominantly inherited neurodegenerative disorder caused by an expansion in CAG repeats in the exon I of the Huntingtin gene (HTT) (MacDonald, 1993). The mutant HTT gene, which translates into an abnormally long polyglutamine tract in the Huntingtin protein is expressed ubiquitously and leads to brain region-specific progressive neuronal dysfunction and degeneration that primarily affects the striatum during early disease stages and spreads to other brain regions as the disease progresses (Tabrizi et al., 2012). The disease is characterized by motor symptoms such as involuntary choreic movements, dystonia and rigidity, and is associated with psychiatric alterations, including apathy, irritability, depression and anxiety that often precede the onset of motor symptoms (Paulsen et al., 2005; Duff et al., 2007; Gil and Rego, 2008). Although many of the motor and psychiatric features of HD can be symptomatically treated (Mason and Barker, 2009; Anderson et al., 2018), a disease-modifying treatment to slow or stop the disease progression is still not available for HD patients.
While the genetic cause of HD has been known for almost 3 decades, the molecular mechanisms underlying the disease pathogenesis are complex, involving disruption of multiple cellular processes, among which transcriptional dysregulation is one of the earliest and central pathogenic mechanisms. Transcriptional profiling studies demonstrated progressive changes in gene expression in HD human brain and in experimental disease models (Hodges et al., 2006; Kuhn et al., 2007; Seredenina and Luthi-Carter, 2012; Vashishtha et al., 2013; Yildirim et al., 2019). Transcriptional dysregulation of many neuronal genes, including neurotransmitters, neurotrophins and their receptors, as well as those that are related to stress-response pathways and cell death were reported in HD brain. Some of the key neuronal genes that are consistently shown to be repressed across human HD brain and in animal models include brain-derived neurotrophic factor (Bdnf), dopamine receptor 2 (Drd2), dopamine receptor 1a (Drd1a), preproenkephalin (Penk1), adenosine A2a Receptor (Adora2a) and protein phosphatase 1 regulatory subunit 1B (Ppp1r1b).
Mechanisms through which mutant HTT has been proposed to cause transcriptional dysregulation include sequestration as well as soluble interactions with regulators of transcription leading to perturbation of their activities (Helmlinger et al., 2006; Cha, 2007; Ross and Tabrizi, 2011). In close relation to the changes in transcription and regulatory activities, epigenetic status is also altered in HD (Sadri-Vakili et al., 2007; Hervas-Corpion et al., 2018). In previous genome-wide studies, we found large changes in DNA methylation and key histone modifications such as H3K4 trimethylation, H3K27 acetylation and H3K36 trimethylation in cell and mouse models as well as in iPSC-derived neurons and postmortem brains from HD patients. These changes were linked to altered activities of certain transcription factors in HD (Ng et al., 2013; Vashishtha et al., 2013; Consortium, 2017). Importantly, genetic and pharmacological approaches that target epigenetic changes to correct aberrant transcription were shown to ameliorate HD features in preclinical trials (Ferrante et al., 2003; Thomas et al., 2008; Vashishtha et al., 2013; Suelves et al., 2017; Yildirim et al., 2019; Hecklau et al., 2021), validating the central role of transcriptional dysregulation in HD pathogenesis. Collectively, others and we demonstrated aberrant expression of thousands of genes and the associated changes in epigenomic profiles and regulatory factor activities in cell and animal models of HD and in HD patients; however, a systematic review comprising all the transcriptional profiling studies in HD is still lacking.
Here, we reviewed 27 independent studies on cellular models in human, human brain and blood as well as in non-human models. Within the human models, we observed large differences in gene expression, enrichment of gene sets and the related processes and pathways. While cellular models showed enrichment of cellular and developmental processes, postmortem brain models showed enrichment of genes involved in heat shock response, response to protein unfolding, synaptic transmission among others. One of the human studies that compared presymptomatic versus symptomatic brain provided valuable information regarding the striking uniqueness of differentially expressed genes (DEGs) between the presymptomatic and symptomatic brain. We observed that the heat shock response genes were significantly upregulated in presymptomatic brain. In particular, three common genes among all the postmortem brain regions, except for symptomatic MSNs, DNAJB1, HSPA1B and HSPB1 were upregulated. However, this upregulation was less prominent in the symptomatic brain regions, and was not observed in the striatum in mouse studies. Within the striatum, MSNs exhibit dysregulation of mitochondrial function-related genes in addition to SAT1 gene that is common with all the late postmortem brain categories. Additionally, blood shared more DEGs with symptomatic postmortem brain than with presymptomatic. Furthermore, non-human datasets also shared some key DEGs like, Adora2a, Adcy5, CamkV, Penk that are associated with HD.
Methods
Systematic Review Methodology
To retrieve all RNA-seq differential gene expression studies on HD patients or models, we searched PubMed and data repositories in a systematic way. The following term was used to search PubMed with the Advanced Search function ((huntingt*[MeSH Terms] OR huntingt*[tiab]) AND (Sequence Analysis, RNA [MeSH Terms] OR High-Throughput RNA Sequencing [MeSH Terms] OR Gene Regulatory Networks/genetics* [MeSH Terms] OR Genomics/methods* [MeSH Terms] OR RNA/genetics* [MeSH Terms] OR Gene Expression Profiling [MeSH Terms] OR Transcriptome* [MeSH Terms] OR Transcriptome/genetics* [MeSH Terms] OR RNA-seq*[Title/Abstract] OR “transcriptome profiling” [tiab] OR “transcriptome analysis” [tiab] OR “transcriptional dysregulation” [tiab] OR “genome-wide expression profiling” [tiab] OR “genome-wide expression analysis” [tiab] OR “differential* express*” [tiab] OR “mRNA-seq” [tiab] OR “transcriptome sequencing” [tiab] OR “transcriptional signatures” [tiab] OR “transcriptional alterations” [tiab] OR “transcriptional changes” [tiab]) NOT (review [pt])) AND ((“2013/01/01” [Date - Publication]: “2020/08/15” [Date-Publication])). For data repositories, search terms were adapted to each database: 1) huntingt*[title] AND “transcriptome gene expression” [Filter] for BioProject (SRA and GEO); 2) huntingt* AND exptype:“RNA-seq of coding RNA” for ArrayExpress; 3) huntingt* AND RNA-seq, with filter “study” for European Nucleotide Archive; 4) huntingt* for European Genome-Phenome Archive. In total, 288 articles were identified through PubMed and 237 datasets were identified through data repositories. Then, the articles and datasets were screened with the following exclusion criteria in order of priority: 1) Non-HD study, 2) Erratum/Superseries, 3) Review, 4) Different analysis of same data, 5) Non-RNA study, 6) RNA isoform/noncoding RNA study, 7) HTT knockout/-down study, 8) Treatment study, 9) Microarray, 10) Non-RNA-seq study, 11) Non-peer reviewed and 12) DEG not available. The screening process is presented in a PRISMA flow diagram (Supplementary Figure S1).
Data Extraction
For human HD datasets for which all filtered expressed genes were not provided (n = 12), lowly expressed genes were removed from the expression matrix based on the selection criteria defined in each paper. For each subcategory, background gene lists were created by taking the union of all expressed genes in the datasets within the corresponding category.
Human Samples
In total, 14 HD RNA-seq studies were performed on samples from either human cell culture models, blood samples or post-mortem brain samples. Cell culture models were derived from either embryonic stem cells or induced pluripotent stem cells, and samples were collected at the pluripotent, multipotent, or terminally differentiated stage. Two HD blood studies were included, one with monocytes from Grade 0–2 HD patients, one with platelets from all stages of HD. Post-mortem brain samples come from asymptomatic and symptomatic HD patients, specifically, caudate/putamen, motor cortex, prefrontal cortex and cingulate cortex. We analyzed 44 datasets after excluding 6 astrocyte datasets that didn’t analyze HD vs. WT differential expression. Then, based on sample origin, tissue type and disease stage, human HD datasets were grouped into 11 categories-cell culture datasets included pluripotent, progenitor, differentiated_neuronal, and differentiated_non_neuronal; post-mortem brain datasets included brain_early_striatal, brain_early_cortical, brain_late_striatal_neuronal_MSN, brain_late_striatal_neuronal_IN, brain_late_striatal_non_neuronal and brain_late_cortical; and the blood.
Non-Human Samples
For non-human analyses, 14 HD RNA-seq studies from mouse, monkey and sheep models were included. HD mouse models included R6/1, R6/2, HdhQ150/175, BACHD, CHL2 and Swiss Webster mouse; mouse cell lines included E14 STHdhQ111 and BV2 microglia; other HD models included Rhesus-macaque pluripotent cell lines and OVT73 sheep. Then, we graded mouse HD datasets as early, intermediate and late stages based on prior literature. The datasets have been graded as follows. R6/1: 1 and 2 months-early, 7.5 months-late. R6/2: 1 month-early, 2–3.75 months-late. HdhQ150: 8 months-intermediate, 22 months-late. HdhQ175: 2 months-early, 6 months-intermediate, 10 months-late. CHL2: 12 months-intermediate. BACHD: 1 month-early.
Gene Frequency and Overlap Analyses
The representative differentially expressed genes (DEGs) for all mouse and human categories were defined based on how often a gene was observed as significantly changed across the datasets in each category. Genes that are differentially expressed in at least two datasets were included in the category-representative DEGs. For subcategories with single dataset, all the genes were considered. As an exception, for the human blood category, union of DEGs from the two datasets within the blood category were considered as blood category-representative DEGs as the number of overlapping genes between the two blood datasets is 1.
Gene overlap analysis between pairwise comparisons were performed by using one-sided Fisher’s exact test. To test gene overlap among more than two categories, we used the SuperExactTest (Wang et al., 2015) package in R. Background gene list for each category was defined as the union of all expressed genes in each dataset. All analyses were performed in R.
GSEA Analysis
Gene set enrichment analysis (GSEA) (Subramanian et al., 2005), for differentially expressed genes between HD and control samples, was performed for each HD human dataset (n = 44) with the GSEA method in the WebGestaltR package v.0.4.2 (Liao et al., 2019) for the following functional databases; KEGG pathway and Gene Ontology Biological Process. Differentially expressed genes were ranked based on their log fold changes with HD over wild type.
GO Analysis
Common or unique gene sets were analyzed by online Gene Ontology enRIchment anaLysis and visuaLizAtion tool (GOrilla) (Eden et al., 2009). For pairwise comparisons, the intersection between the two datasets’ backgrounds was used as the background set. For multiple comparisons in the subcategories, the subcategory background was used as the background set. For unique genes in a subcategory or dataset, the subcategory or dataset background was used as the background set. Statistical significance was set at FDR <0.05.
Regulator Analysis
To identify potential regulators for DEGs in each HD human dataset, we used hTFtarget database in which human TFs were curated from Chip-Seq experiments in different cell lines, tissues and cells (Zhang et al., 2020b). For each HD human dataset, DEGs were ranked based on absolute logFC and then top 500 DEGs were queried for potential regulators. For the datasets that have less than 500 DEGs, all DEGs were considered for the query. After obtaining potential regulators for each dataset, further filtering was performed, in which regulators that were not found in all expressed gene list of the corresponding dataset were removed. For the datasets that do not have all expressed gene lists, tissue specific gene lists were curated from the (Uhlen et al., 2015) and used for the filtering. An activity score was calculated for each regulator as a ratio of the number of DEGs a regulator controls to the total number of DEGs queried.
The overlap analysis between the TFs obtained from H3K27ac motif data from the HD iPSC Consortium 2017 dataset and the regulators obtained from hTFtarget database for the same study was performed by using Fisher’s exact test. All expressed genes from the same dataset were used as a background.
Epigenetic Modifiers and Transcription Factors
Human TFs (n = 2,765) and epigenetic modifiers (n = 167) were curated from The Human Transcription Factors website (Lambert et al., 2018) and dbEM database (Singh Nanda et al., 2016), respectively. Among 2,765 curated proteins classified as TF with a known motif, TF with an inferred motif, likely TF, ssDNA/RNA binding protein, or unlikely TF, we only considered the following classes; TF with a known motif, TF with an inferred motif, which revealed 1,639 known and human TFs. Then, differential expression status of the curated human TFs and epigenetic modifiers were checked in all 44 HD human datasets.
Results
In total, 288 PubMed articles and 237 datasets published until August 2020 were retrieved using our predefined search terms that focused on transcriptional profiling studies using RNA sequencing in Huntington’s disease. Of these, 25 PubMed articles and 57 datasets met our inclusion criteria, while others were excluded based on 11 preset exclusion criteria, as described in the methods section (Figure 1). Redundancy in datasets between the four data repositories, BioProject, ArrayExpress, European Nucleotide Archive (ENA) and European Genome-Phenome Archive (EGA), was identified resulting in 28 unique datasets out of 57. Then, 28 datasets were traced to their corresponding publications, and we found 20 unique publications. Among 25 PubMed and 20 dataset related publications, 18 publications were common. In the end, 27 publications fulfilled all the criteria and were included in this systematic review (Supplementary Figure S1; Supplementary Dataset S1).
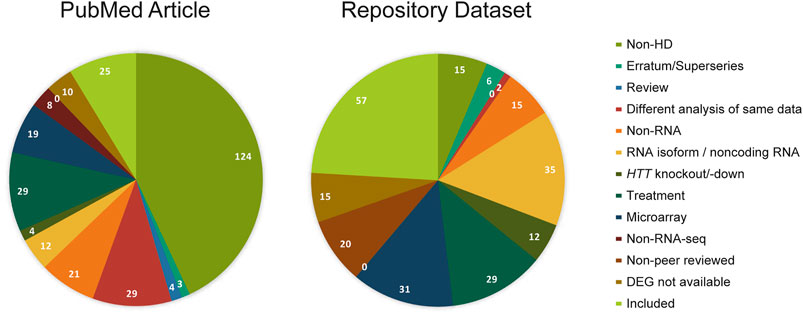
FIGURE 1. Studies screened from PubMed and dataset repositories. PubMed articles and repository datasets are screened with the same exclusion criteria in decreasing order of priority: non-HD, erratum (Pubmed)/superserie entries (repository dataset), review, different analysis of same data, non-RNA, RNA isoform/noncoding RNA, HTT knockout/down, treatment, microarray, non-RNA-seq, and no DEG analysis. The numbers of PubMed articles or repository datasets in each category are indicated.
Transcriptional Changes in Human HD
This review included 44 differentially expressed gene (DEG) datasets from 14 human HD studies (Agus et al., 2019; Al-Dalahmah et al., 2020; Consortium, 2017; Denis et al., 2019; Lee et al., 2020; Lim et al., 2017; Lin et al., 2016; Mehta et al., 2018; Miller et al., 2016; Ooi et al., 2019; Osipovitch et al., 2019; Ring et al., 2015; Smith-Geater et al., 2020; Switonska et al., 2018) (Table 1). The hierarchical clustering of all 44 datasets showed clustering of datasets irrespective of the differences in the origin of tissue/sample (Supplementary Figure S2) (Ooi et al., 2019; Lee et al., 2020). Thus, we based our analyses on grouping of the datasets according to tissue/cell type and disease stage.
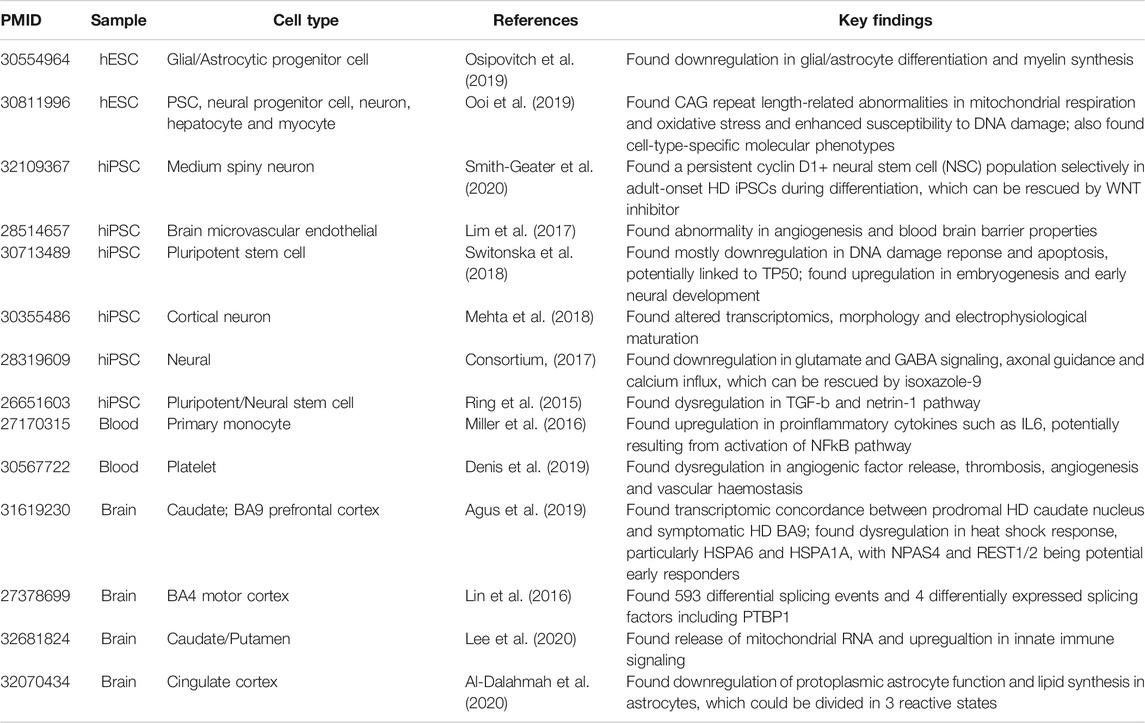
TABLE 1. Characteristics of human HD studies included in this review. The table summarizes PMID, Sample, Cell Type, Reference and Key Findings of each included study (Ring et al., 2015; Lin et al., 2016; Miller et al., 2016; Consortium, 2017; Lim et al., 2017; Mehta et al., 2018; Switonska et al., 2018; Agus et al., 2019; Denis et al., 2019; Ooi et al., 2019; Osipovitch et al., 2019; Al-Dalahmah et al., 2020; Lee et al., 2020; Smith-Geater et al., 2020).
We classified 44 human DEG datasets into five categories based on sample source and disease stage (Figure 2). The five groups were further categorized into the following 11 subcategories: pluripotent, progenitor, differentiated neuronal and differentiated non-neuronal cells from cellular models; brain_early_striatal, brain_early_cortical, brain_late_cortical, brain_late_striatal_neuronal_MSN, brain_late_striatal_neuronal_interneuron and brain_late_striatal_non-neuronal from brain tissue and blood. The top upregulated and downregulated genes in each subcategory are shown in Table 2. There were no commonly differentially expressed genes (DEGs) across all the studies. We then identified frequently dysregulated genes in each subcategory by taking the genes that appeared in at least two of the datasets. Figure 3A shows a heatmap of the frequent DEGs across all the subcategories and shows that DEGs from early cortical tissues changed extensively in the late cortical tissues from symptomatic brains (Figure 3A, Supplementary Figure S3). The late striatal subcategories showed similar differential expression of many genes. Additionally, we observed some similarities among pluripotent, progenitor, differentiated_neuronal and differentiated_non_neuronal cellular subcategories.
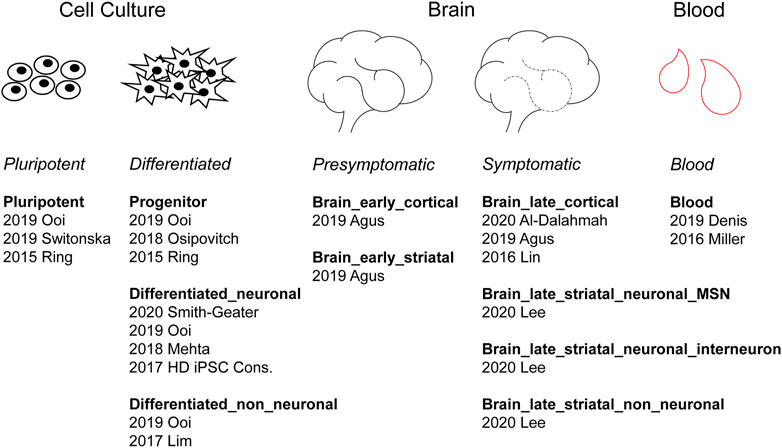
FIGURE 2. Categorization of human HD differentially expressed gene (DEG) datasets. According to the sample source, human HD studies can be divided into three groups: cell culture, brain and blood. Cell culture studies can be further divided into pluripotent and differentiated subgroups. Brain studies can be divided into presymptomatic and symptomatic subgroups. Under each subheading are listed the respective studies identified by their publication year and the last name of the first author.
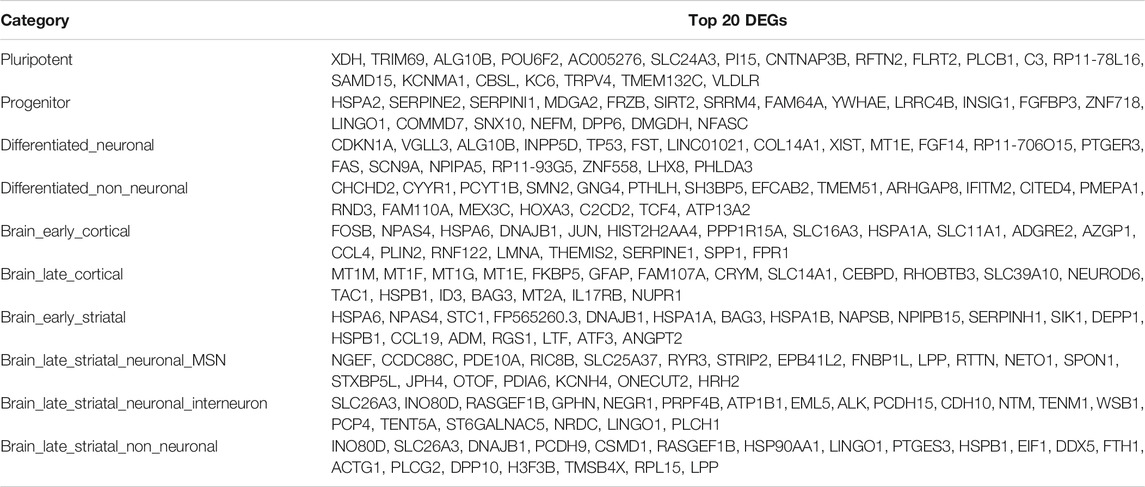
TABLE 2. Human top differentially expressed genes (DEGs) in each category. The table summarizes the top DEGs in brain subcategories in human, first ranked by the frequency of DEGs, then by the average FDR value of DEGs across all datasets in that subcategory.
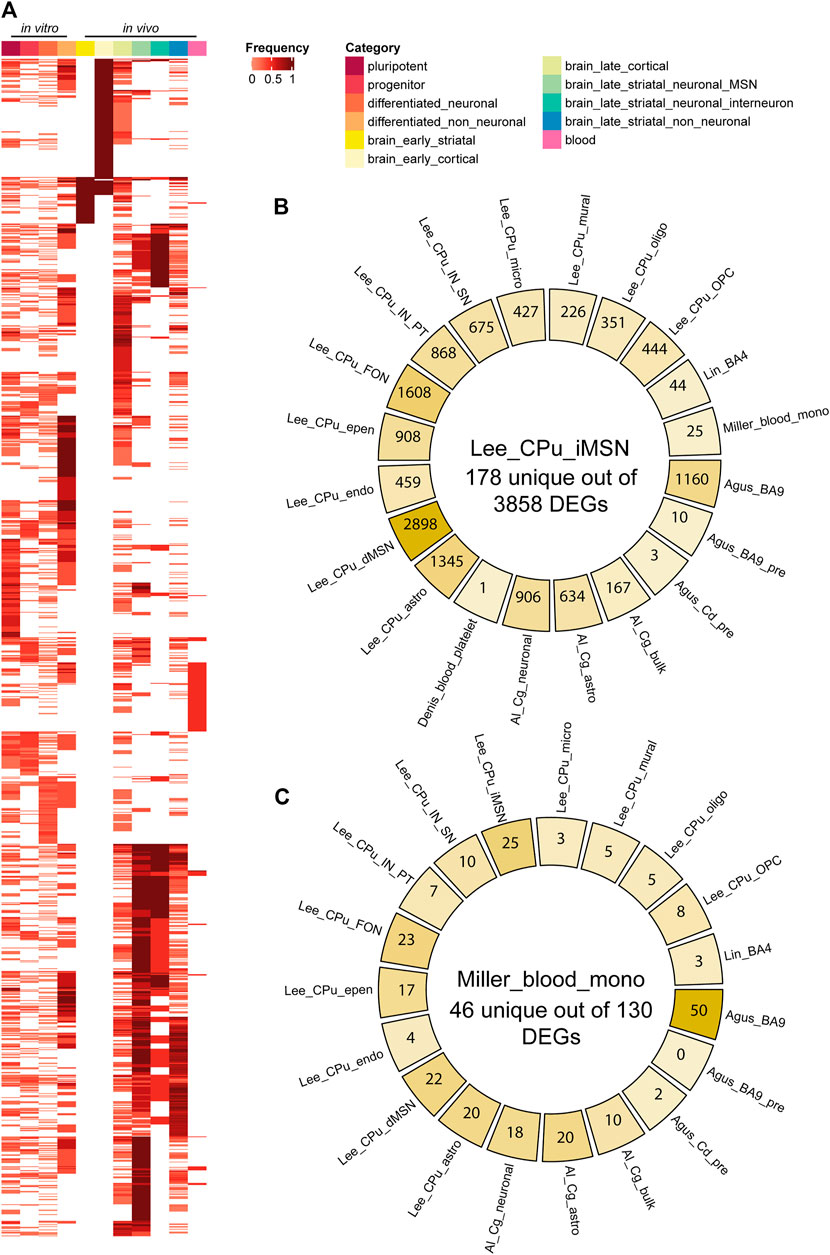
FIGURE 3. HD differentially expressed gene (DEG) comparisons between categories and datasets. (A) DEG Frequency heatmap across all subcategories. Each column is a subcategory, each row is a DEG. DEG frequency is calculated as the number of datasets that DEG appears in divided by the total number of datasets in that subcategory. (B,C) Diagrams for pairwise comparisons of indirect pathway medium spiny neuron (iMSN) or blood monocyte DEG list vs all other data from primary tissues/cells. At the center is the number of unique DEGs in iMSN or blood monocyte, and on the side is the number of DEGs in common with other datasets. Abbreviations: CPu, caudate putamen; astro, astrocyte; epen, ependymal; endo, endothelial; IN, interneuron; PT, Pvalb/Th-expressing; MSN, medium spiny neuron; MNS, MAP2+ and NES/SOX2-; OPC, oligodendrocyte progenitor cell; oligo, oligodendrocyte; micro, microglia; NSC, neural stem cell; Cg, cingulate cortex; FON, Foxp2/Olfm3-expressing neuron; SN, Sst/Npy-expressing; dSPN/iSPN, direct/indirect pathway spiny projection neuron; mono, monocyte; NPC, neural progenitor cell; CoNeuron, cortical neuron; Cd, caudate nucleus; pre, presymptomatic; GPC, glial progenitor cell; APC, astrocyte precursor cell; BBB, blood brain barrier.
Cellular Models
Of 8594, 3119, 5633 and 10120 total DEGs in each subcategory, we obtained 1,638, 174, 804 and 2,125 frequently dysregulated genes in pluripotent, progenitor, differentiated_neuronal and differentiated_non-neuronal subcategories, respectively (Supplementary Datasets S2, S3). Comparison of the gene frequency across four subcategories of the cellular models showed that two genes, Immunoglobulin Superfamily DCC Subclass Member 3 (IGDCC3) and XK Related 4 (XKR4) were common in all four subcategories (p = 2.3E-4) (Supplementary Dataset S4). Overall, cellular models showed an enrichment of gene sets related to phosphatidylserine exposure on apoptotic cell surface (Supplementary Dataset S5).
Among pluripotent, differentiated_neuronal and differentiated_non-neuronal categories, 39 genes (p = 5.7E-28) overlapped, with the most significant enrichment of GO terms related to low-density lipoprotein transport. We observed an overlap of 156 genes (p = 1.7E-49) between pluripotent and differentiated_neuronal while there were 285 common genes (p = 5.3E-48) between pluripotent and differentiated_non-neuronal. The overlapping genes between pluripotent and progenitor (43 genes, p = 4.6E-18) showed enrichment of GO terms such as regulation of cell differentiation, regulation of developmental process, regulation of nervous system development, and regulation of cellular component organization. There were 115 overlapping genes (p = 5.8E-15) between differentiated_neuronal and differentiated_non-neuronal while, we obtained 551 unique genes in differentiated_neuronal subcategory (Supplementary Dataset S3).
Postmortem Brain Tissues From HD Patients
We classified the postmortem human HD brain category into six subcategories as mentioned above. In early_ and late_cortical, early_ and late_ striatal_medium spiny neuron (MSN), late_ striatal_interneuron and late_ striatal_non-neuronal brain tissues, there were 226, 2,806, 70, 3414, 1988 and 1914 frequently differentially expressed genes, respectively (Supplementary Dataset S3).
Interestingly, Agus et al. (2019) examined presymptomatic and symptomatic brain tissue from HD patients (Agus et al., 2019). In presymptomatic tissues, in early striatal and cortical subcategories, we obtained 25 common genes (p = 1.2E-35), such as HSPA6, DNAJB1, HSPA1B, HSPA1A, HSPB1, JUN (Supplementary Dataset S4) showing enrichment of GO terms related to the response to unfolded protein, negative regulation of transcription from RNA polymerase II promoter in response to stress, chaperone-mediated protein folding, “de novo” posttranslational protein folding, negative regulation of inclusion body assembly and, regulation of apoptotic process (Supplementary Dataset S5). In the cortex, we observed an overlap of 59 genes (p = 1.87E-13) between early and late cortical tissues (Supplementary Dataset S4). Some of the common genes were HSPA6, HSPA7, SERPINH1, HSPA1A, DNAJB1, SLC11A1, HSPA1B, HSPB1, SERPINA1, JUNB, EGR1, SNAI1, PTPN6, SLC2A5, SAT1 and HSPE1 that are related to GO terms such as response to unfolded protein, chaperone cofactor-dependent protein refolding, regulation of apoptotic process and immune effector process.
Within the three subcategories of the late striatal group from Lee et al., 2020, there were 488 common genes (p = 2.1E-275), showing enrichment of various GO terms such as regulation of neuron projection development, regulation of neurogenesis, regulation of neuron differentiation, regulation of nervous system development, regulation of synapse organization, biological adhesion, axon guidance, vesicle localization and cyclic nucleotide catabolic process (Supplementary Dataset S5). Meanwhile, 1,287 common genes (p = 0) between MSNs and interneurons in striatum showed enrichment of GO terms such as modulation of chemical synaptic transmission, regulation of neuron projection development, regulation of synaptic plasticity, regulation of neurotransmitter levels, glutamate receptor signaling pathway, axon guidance, regulation of synaptic vesicle exocytosis, regulation of NMDA receptor activity, regulation of cation channel activity, cytosolic calcium ion transport, lysosomal transport, glutamate secretion, receptor localization to synapse, metal ion homeostasis, and regulation of GTPase activity. On the other hand, 2,127 unique genes in MSNs compared to interneurons show enrichment of cytoskeleton organization, cytoskeleton-dependent intracellular transport, cell projection organization, movement of cell or subcellular component, microtubule-based process as well as transport, plasma membrane bounded cell projection organization, positive regulation of GTPase activity, macromolecule modification and nervous system process to name some (Supplementary Dataset S5). While there were 84 common genes between MSNs and non_neuronal tissues (p = 1.4E-152), interneurons and non-neuron cells within striatum showed an overlap of 694 genes (p = 2.2E-143).
As medium spiny projection neurons of the indirect pathway (iMSN/iSPN) are the most vulnerable cell types to degeneration in HD patients (Reiner et al., 1988), we examined in detail the upregulated and downregulated genes in iMSNs in the dataset Lee_CPu_iMSN (Lee et al., 2020). Most of the top upregulated genes, MT-CO2, MT-ND4L, MT-ND4, MT-ATP6, MT-CO3, SLC26A3, INO80D, and MT-ND1, were related to mitochondrial complex I, cytochrome c oxidase and ATP synthase, while the top downregulated genes were OTOF, TAC1, PILRB, JPH4, DDX24, MPHOSPH8 and KNOP1 (Table 2, Supplementary Table S2) that are related to immune activation, kinases, RNA preprocessing and cell division. Then, we compared Lee_CPu_iMSN dataset (Lee et al., 2020) with other brain and blood datasets (Figure 3B). Among 3858 differentially expressed iMSN genes, 178 were unique. We observed highest commonality of iMSNs with the direct pathway medium spiny projection neurons (dMSN) with 2,898 common genes. Interestingly, only 10 genes- AL117339, SLC16A7, SAT1, SLC39A10, HOMER1, HSPA1b, JUND, SPP1, UBC and SLC2A13-and 3 genes-CRYAB, HSPA1B and HSPH1- were common with presymptomatic BA9 cortex and caudate brain regions, respectively. Moreover, 25 genes were common with blood monocytes (Figure 3B, Supplementary Dataset S6; Table 3).
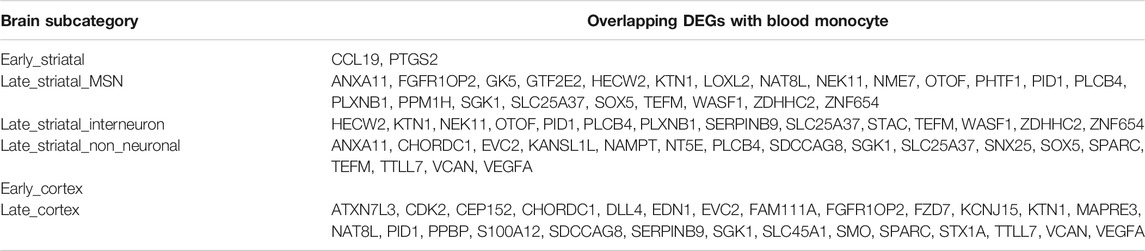
TABLE 3. Overlapping differentially expressed genes (DEGs) with blood monocyte DEG list in each brain subcategory. The table shows common DEGs between blood monocytes and the six brain subcategories. No common DEGs between early_cortex dataset and blood monocytes.
Importantly, in the five brain subcategories except for the brain_late_striatal_neuronal_MSNs, three genes, DnaI Heat Shock Protein Family (Hsp40) Member B1 (DNAJB1), Heat Shock Protein Family A (Hsp70) Member 1B (HSPA1B) and Heat Shock Protein Family B (Small) Member 1 (HSPB1) were common. These genes encode for HSP40, HSP70 and HSPB1 proteins, respectively, showing an enrichment of GO terms like chaperone-mediated protein folding, response to unfolded protein and negative regulation of inclusion body assembly. The expression of DNAJB1, HSPA1B and HSPB1 was upregulated in early BA9 and caudate nucleus. In late brain subcategories related datasets, the expression was less upregulated in comparison to the presymptomatic datasets (Table 4). Similarly, Heat Shock Protein Family H (Hsp110) Member 1 (HSPH1) and Spermidine/Spermine N1-Acetyltransferase 1 (SAT1) were common for all late-brain categories (Supplementary Dataset S4).
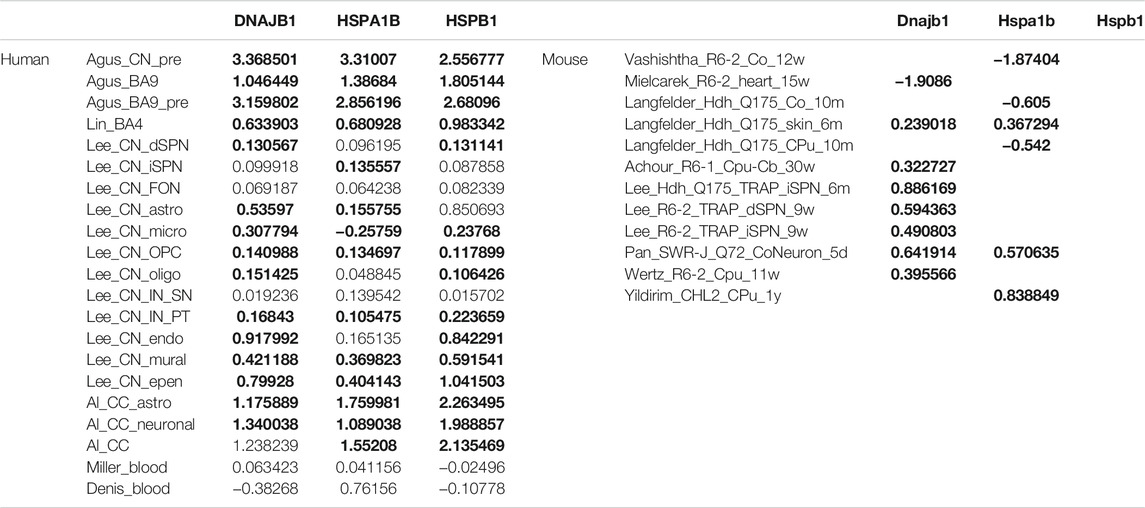
TABLE 4. Log fold change (LFC) of differentially expressed gene (DEG), DNAJB1, HSPA1B and HSPB1 in human and mouse primary tissue datasets. The table summarized Log2 fold changes of the three most commonly dysregulated genes in postmortem brain across human and mouse primary tissue datasets. Note that the differentially expressed genes are bolded (Vashishtha et al., 2013; Mielcarek et al., 2014; Achour et al., 2015; Ring et al., 2015; Langfelder et al., 2016; Lin et al., 2016; Miller et al., 2016; Consortium, 2017; Lim et al., 2017; Mehta et al., 2018; Pan et al., 2018; Switonska et al., 2018; Agus et al., 2019; Denis et al., 2019; Ooi et al., 2019; Osipovitch et al., 2019; Yildirim et al., 2019; Al-Dalahmah et al., 2020; Lee et al., 2020; Smith-Geater et al., 2020; Wertz et al., 2020).
Peripheral Tissues From HD Patients
To investigate concordant changes between blood and brain, we compared 130 DEGs from the primary monocyte dataset from Grade 0–2 HD patients (Miller et al., 2016) with all the brain datasets. In Figure 3C, we show the overlap of differentially expressed genes in blood with the datasets in postmortem brain tissues. We obtained 46 unique genes, such as IL12B, IL23A, CECR5, CCL8, CD300E, TSPAN33, CA13, MIR1249, CLDN1 and HPSE to name some that were differentially expressed only in blood monocytes (Figure 3C). Of the top 10 differentially expressed genes in blood, 4 upregulated genes, FAM124A, IL19, C6orf65 and IL23A and 4 downregulated genes, ZNF414, R3HCC1, PGAP3 and FAM213B were unique for blood (Supplementary Dataset S2). Early striatum dataset-Agus_Cd_pre had two overlapping genes with the blood dataset: C-C Motif Chemokine Ligand 19 (CCL19) and Prostaglandin-Endoperoxide Synthase 2 (PTGS2) (p = 0.07). Moreover, we observed significant overlap of 27 frequently dysregulated genes (p = 0.004) with late cortical subcategory (Table 3).
Gene Sets and Pathways Dysregulated in Human HD
Next, we performed Gene Set Enrichment Analysis (GSEA) (Subramanian et al., 2005) on 44 human DEG datasets using the ranked lists of DEGs based on their log fold changes, Gene ontology biological processes and KEGG pathways databases using WebGestalt (Liao et al., 2019).
GSEA analysis showed strong negative enrichment of genes associated with p53 signaling pathway and cancer in pluripotent cells in Switonska_hiPSC_PSC_109Q (Switonska et al., 2018). Contrastingly, Ring_hiPSC_PSC did not show any enrichment of p53 signaling pathways and cancer in pluripotent cells. It showed exclusively negative enrichment of gene sets related to metal ion homeostasis, immune response, regulation of transcription regulatory region DNA binding, JAK-STAT cascade and peptidyl-tyrosine phosphorylation (Ring et al., 2015). Regarding the progenitor subcategory, the neural stem cell dataset from Smith_hiPSC_MSN_NSC had the largest number of enriched gene gets, with positive enrichment in gene sets such as ribosome, spliceosome, DNA replication, base excision repair, RNA transport, mismatch repair, p53 signaling pathway, and cell cycle, and with negative enrichment in gene sets such as synaptic vesicle cycle, oxidative phosphorylation, Alzheimer disease, and Parkinson disease (Smith-Geater et al., 2020). Smith_hiPSC_MSN_adult showed strong positive enrichment of numerous gene sets such as metal ion homeostasis, lysosome, JAK-STAT cascade, regulation of transcription regulatory region, cAMP signaling pathway, nerve development, synaptic transmission, Interestingly, Mehta_hiPSC_CoNeuron datasets showed strong negative enrichment of cancer related genes on day-0 in differentiated neuronal cell culture that changed on day-80 and 100 showing positive enrichment and no enrichment on day-130 (Mehta et al., 2018) (Supplementary Dataset S7). Most differentiated_neuronal datasets showed positive enrichment of metal ion homeostasis and detoxification.
In brain, presymptomatic striatum and cortex showed positive regulation of gene sets associated with intrinsic apoptotic signaling pathway in response to endoplasmic reticulum stress, immune response, transcriptional misregulation in cancer, regulation of protein maturation, heat shock response. In symptomatic brain subcategory, the late cortex was positively enriched for various gene sets related to metal ion homeostasis, protein folding, p53 signaling, cancer and positive regulation of peptidyl-tyrosine phosphorylation. Late cortex and late_striatal_neuronal_MSNs showed common positive enrichment of glutathione metabolism, RNA polymerase, biosynthesis of unsaturated fatty acids, alanine, aspartate and glutamate metabolism, protein localization to chromosome/centromeric region, DNA replication, acidic amino acid transport, postsynapse assembly, purine metabolism, and synaptic vesicle cycle, while sharing negative enrichment in gene sets related to amyloid precursor protein metabolic process, cAMP signaling pathway, nerve development, alcoholism, Huntington disease, synaptic transmission, morphine addiction, long-term depression, Alzheimer disease and circadian entrainment (Figure 4, Supplementary Figure S5; Supplementary Dataset S7). In striatal interneurons, Sst/Npy-expressing (SN) GABAergic interneurons in Lee_CPu_IN_SN dataset and the Pvalb/Th-expressing (PT) GABAergic interneurons in Lee_CPu_IN_PT dataset revealed a contrasting enrichment profile of various gene sets (Figure 4, Supplementary Figure S5; Supplementary Dataset S7).
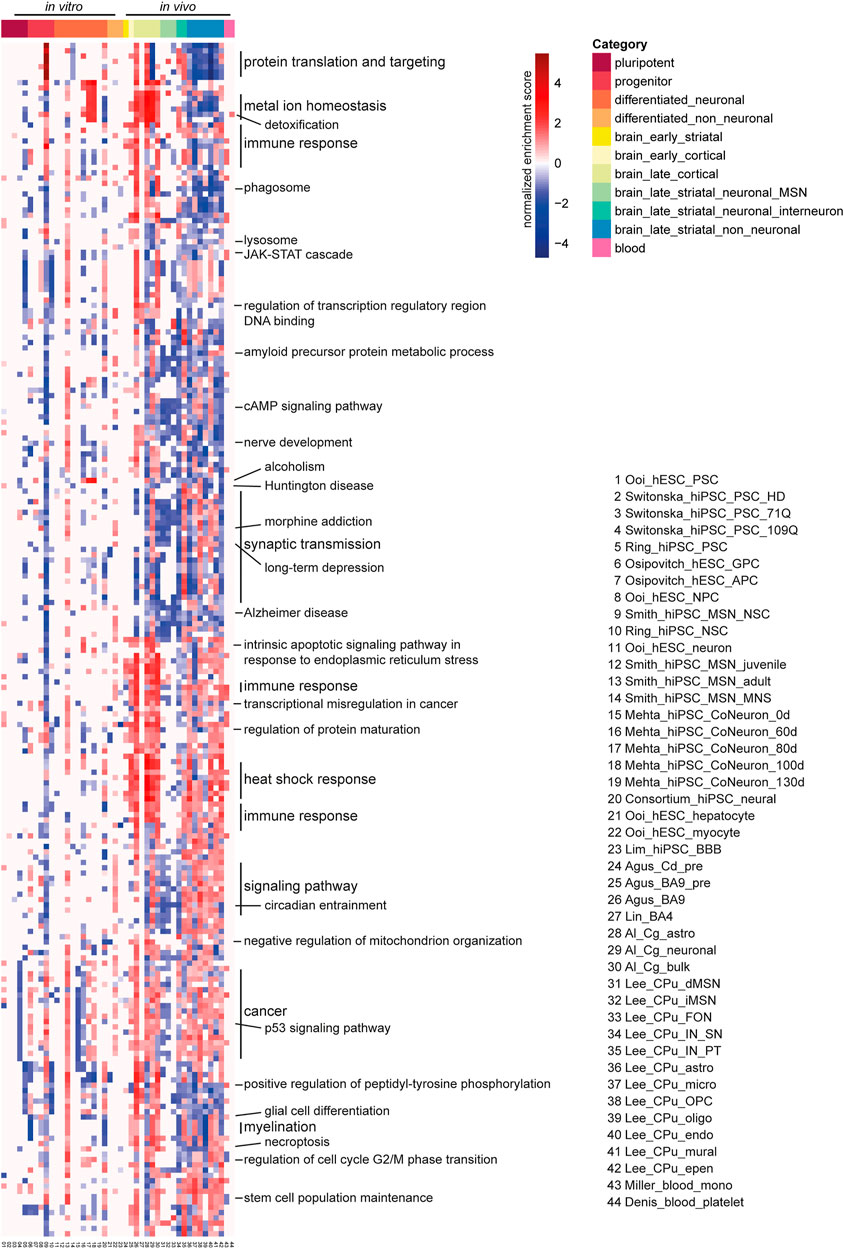
FIGURE 4. Gene set enrichment analysis (GSEA) enrichment heatmap of 44 human HD RNA-seq datasets. Top 20 enriched gene sets for the GO biological process and KEGG pathway were combined and shown here. Each column is a human HD RNA-seq DEG dataset, each row is a gene set of the GO biological process or KEGG pathway. Adjacent gene sets with a common biological function are grouped and labeled as such. Red indicates positive enrichment, blue negative. Abbreviations: CPu, caudate putamen; astro, astrocyte; epen, ependymal; endo, endothelial; IN, interneuron; PT, Pvalb/Th-expressing; MSN, medium spiny neuron; MNS, MAP2+ and NES/SOX2-; OPC, oligodendrocyte progenitor cell; oligo, oligodendrocyte; micro, microglia; NSC, neural stem cell; Cg, cingulate cortex; FON, Foxp2/Olfm3-expressing neuron; SN, Sst/Npy-expressing; dSPN/iSPN, direct/indirect pathway spiny projection neuron; mono, monocyte; NPC, neural progenitor cell; CoNeuron, cortical neuron; Cd, caudate nucleus; pre, presymptomatic; GPC, glial progenitor cell; APC, astrocyte precursor cell; BBB, blood brain barrier.
For the blood monocyte dataset- Miller_blood_mono, there was positive enrichment in gene sets such as cytokine-cytokine receptor interaction, chemokine signaling pathway, IL-17 signaling pathway, JAK-STAT signaling pathway and pathways in cancer (Figure 4, Supplementary Figure S5). Concordant enrichment in gene sets, such as, chemokine signaling pathway and IL-17 signaling pathway was found in early cortical dataset from Agus et al., 2019, as well as in most of the late cortical datasets and late striatal non-neuronal datasets from Lee et al., 2020. Positive enrichment in the gene set JAK-STAT signaling pathway was also found in the neural stem cell and adult-onset HD datasets from Smith-Geater et al., 2020, and most of the late cortical datasets and late striatal non-neuronal datasets (Smith-Geater et al., 2020). For the blood platelet dataset, the only enriched gene set was related to detoxification in the positive direction, and the same positive enrichment was found in neural stem cell and adult-onset HD datasets from Smith-Geater et al., 2020, the Day 60, Day 80 and Day 100 iPSC-derived cortical neuron datasets from Mehta et al., 2018, all the late cortical datasets and both of the interneuron datasets. Meanwhile, negative enrichment in the gene set detoxification was observed in the hiPSC pluripotent stem cell dataset from Ring et al., 2015, the neural dataset from HD iPSC Consortium 2017 as well as in the astrocyte, the microglia, the OPC, the oligodendrocyte, the endothelial cell and the ependymal cell datasets from Lee et al., 2020 (Ring et al., 2015; Consortium, 2017; Mehta et al., 2018; Lee et al., 2020; Smith-Geater et al., 2020) (Supplementary Dataset S7).
Regulators of Transcription in Human HD
To investigate potential regulators responsible for differential expression of genes in HD, we searched for the potential regulators of the DEGs in each dataset using human transcription factors target (hTFtarget) database (Zhang et al., 2020a). An activity score based on the number of DEGs co-regulated by a regulator in a dataset were assigned for each regulator in the respective dataset.
In the circular heatmap depicting the regulators and their activity scores (Figure 5, Supplementary Dataset S8), one third of the heatmap (indicated as group A) depicts the most common set of regulators across the categories and the datasets. In this set of most common regulators, we observed regulators such as, SP4, NRF1, BRD4, RYBP, ZFP64, HDAC1, FOXO1, CREB1, NFKB1, BRD2, SP1, CTCF and JUN some of which were previously implicated in HD pathology (De Souza et al., 2016; Dunah et al., 2002; Steffan et al., 2000). Gene ontology analysis of these transcription factors (TFs) showed significant enrichment of genes related to transcriptional misregulation in cancer, pathways in cancer, Huntington’s disease, longevity regulating pathway and cell cycle (Supplementary Dataset S5). Regulators grouped in B show strong scores for all except for differentiated_non_neuronal, Mehta_hiPSC_CoNeurons, pluripotent cell and presymptomatic brain. Some of the less common regulators (Figure 5, group C), such as PCGF1, KLF4, ELF3 and EGR2 showed strong scores in all categories except the datasets in the late striatal category from Lee et al., 2020. Interestingly, the DEGs from the blood platelet dataset from Denis et al. were enriched for a group of high-scoring TFs (Figure 5, group G), namely POLR2A, TAF3, BHLHE40, REST, TEAD4, RBBP5, RING1, GTF3C5 and CBFB. Of note, to test the reliability of our method, we checked the overlap between transcription factors (TFs) from the available H3K27ac motif data from a previous publication (Consortium, 2017) and the potential regulators predicted by hTFtarget for the same study. We found a significant overlap of 39 regulators (p-value = 3.79e-10; Fisher’s exact test; Supplementary Dataset S8).
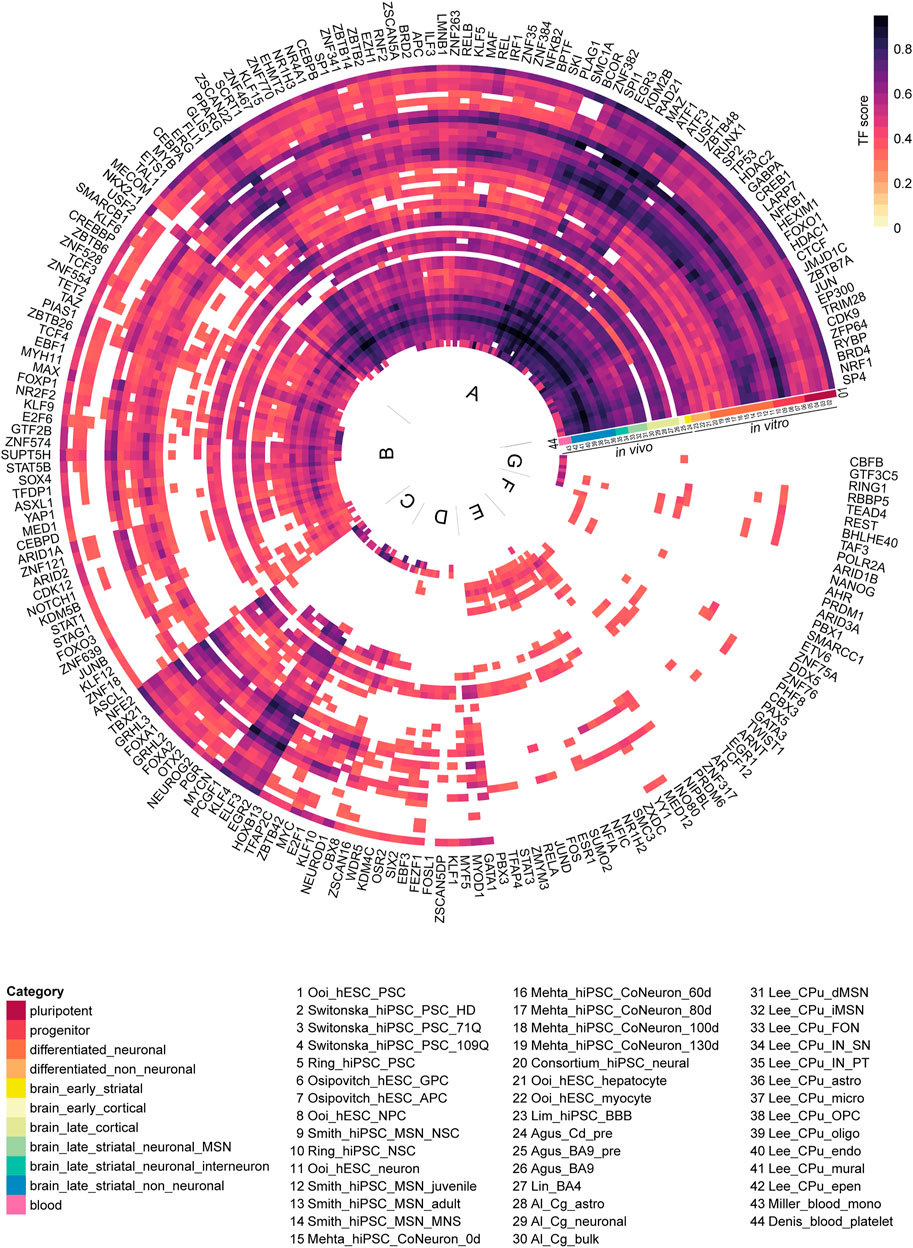
FIGURE 5. Potential enriched regulators for all 44 human differentially expressed gene (DEG) datasets. Each ring is a human DEG dataset, each spoke is a regulator. The regulator activity score was defined as the ratio of DEGs controlled by a regulator to the total number of DEGs in a dataset. For each dataset, regulators with an activity score higher than 0.3 were shown (n = 205). The regulators were clustered using the Ward D2 method. Based on commonality in the 44 human DEG datasets, regulators can be divided into 7 groups (A to G). Abbreviations: CPu, caudate putamen; astro, astrocyte; epen, ependymal; endo, endothelial; IN, interneuron; PT, Pvalb/Th-expressing; MSN, medium spiny neuron; MNS, MAP2+ and NES/SOX2-; OPC, oligodendrocyte progenitor cell; oligo, oligodendrocyte; micro, microglia; NSC, neural stem cell; Cg, cingulate cortex; FON, Foxp2/Olfm3-expressing neuron; SN, Sst/Npy-expressing; dSPN/iSPN, direct/indirect pathway spiny projection neuron; mono, monocyte; NPC, neural progenitor cell; CoNeuron, cortical neuron; Cd, caudate nucleus; pre, presymptomatic; GPC, glial progenitor cell; APC, astrocyte precursor cell; BBB, blood brain barrier.
Next, we investigated the differential expression of TFs and epigenetic modifiers in HD using the human TFs (Lambert et al., 2018) and dbEM (Singh Nanda et al., 2016) databases, respectively, in each of the 44 datasets. Of 1,639 human TFs and 167 human epigenetic modifiers, we found differential expression of 1,388 TFs and 155 epigenetic modifiers in HD in at least one of the 44 datasets (Supplementary Dataset S9). Figure 6 shows the top common up-regulated and down-regulated TFs and epigenetic modifiers in HD in all 44 human datasets. The top common up-regulated TFs were TCF4, ZBTB20, ZHX2 and BCL6, while the most common downregulated TFs were SON, ZNF302, ZKSCAN1 and ZMAT1. The most common up-regulated epigenetic modifiers were IN O 80D, CREBBP, HDAC4 and KDM4B, while the most common downregulated epigenetic modifiers were PRMT2, PRMT8, JMJD1C and TAF1. Interestingly, in MSNs, three of the top upregulated epigenetic modifiers, KDM4B, KMT2C and SMARCD1 were uniquely downregulated, while the top downregulated epigenetic modifier genes SETD5 and PRMT8 were upregulated (Figure 6).
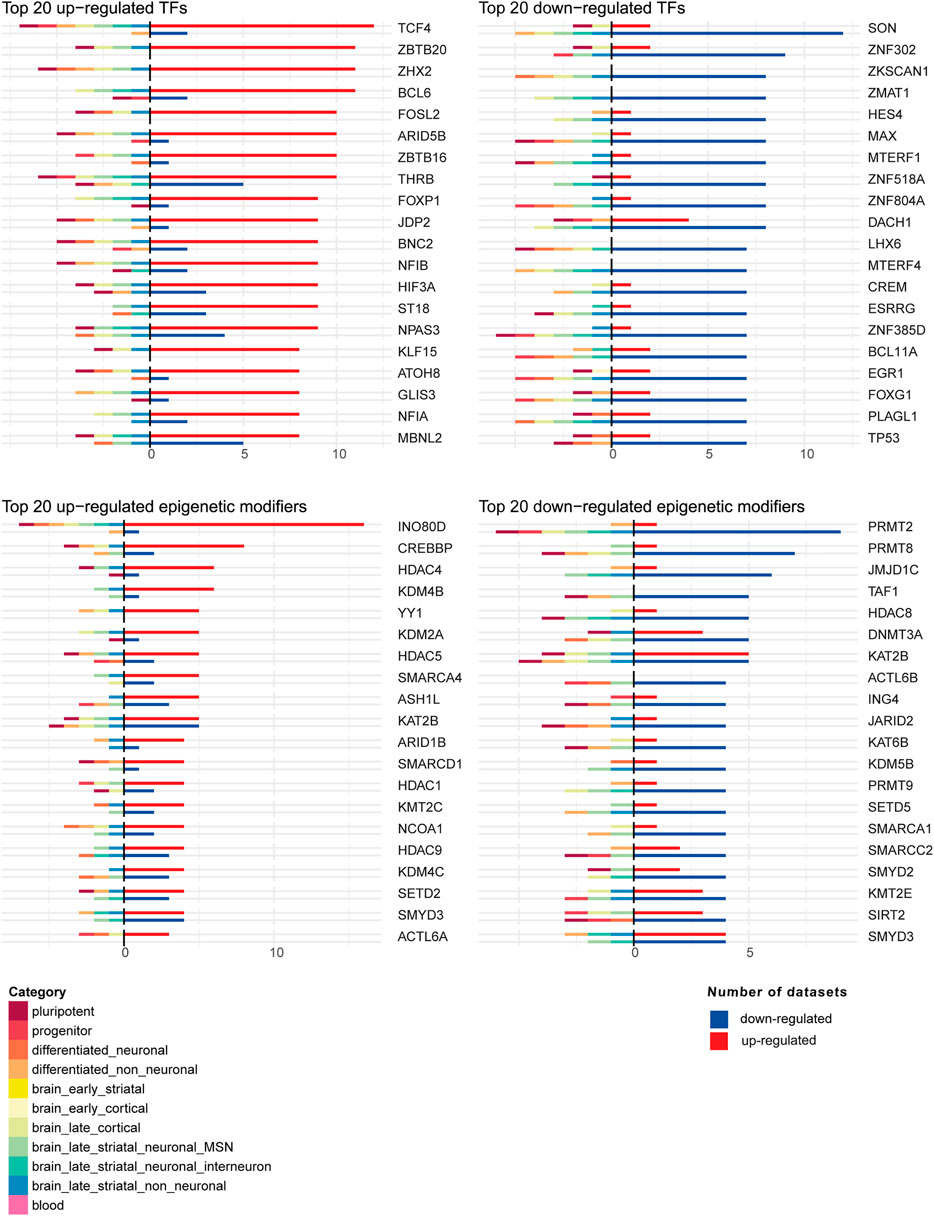
FIGURE 6. Top 20 up-regulated and down-regulated transcription factors (TFs) and epigenetic modifiers in the 44 human DEG datasets. For each TF or epigenetic modifier, shown were the numbers of datasets where the TF or epigenetic modifier was up-regulated or down-regulated. On the positive axis, the number of datasets in which the TF or epigenetic modifier is up-regulated or down-regulated are shown. On the negative axis, the category membership of the datasets where the TF or epigenetic modifier is up-regulated or down-regulated is indicated.
Finally, we investigated whether the predicted regulators of DEGs were themselves differentially expressed in HD in the 44 human DEG datasets. In total, 204 out of the predicted 557 regulators were differentially expressed in at least one of the datasets (Supplementary Dataset S9). Among the differentially expressed regulators, TCF4, FOSL2, BCL6, ZBTB16, FOXP1, KLF15, RXRA, CUX1, CREBBP and NFIA were the top upregulated regulators that were also predicted to be the regulators of DEGs in HDare, while the top downregulated ones were ZKSCAN1, MAX, E2F3, BCL11A, EGR1, FOXG1, TP53, HMG20A, JMJD1C and STAT4 (Supplementary Dataset S9).
Transcriptional Changes in Non-Human Models
In order to evaluate the suitability of non-human models to study transcriptional changes in HD patients, we compared the non-human data to human mRNA changes. For this, we retrieved 14 studies and 79 datasets (Table 5; Supplementary Figure S1). Among 14 studies, 12 were related to mouse models (Ng et al., 2013; Vashishtha et al., 2013; Crotti et al., 2014; Mielcarek et al., 2014; Achour et al., 2015; Langfelder et al., 2016; Miller et al., 2016; Handley et al., 2017; Jacobsen et al., 2017; Pan et al., 2018; Goodnight et al., 2019; Radulescu et al., 2019; Yildirim et al., 2019; Lee et al., 2020; Wertz et al., 2020), one study was related to sheep (Handley et al., 2017) and one to monkey (Goodnight et al., 2019).
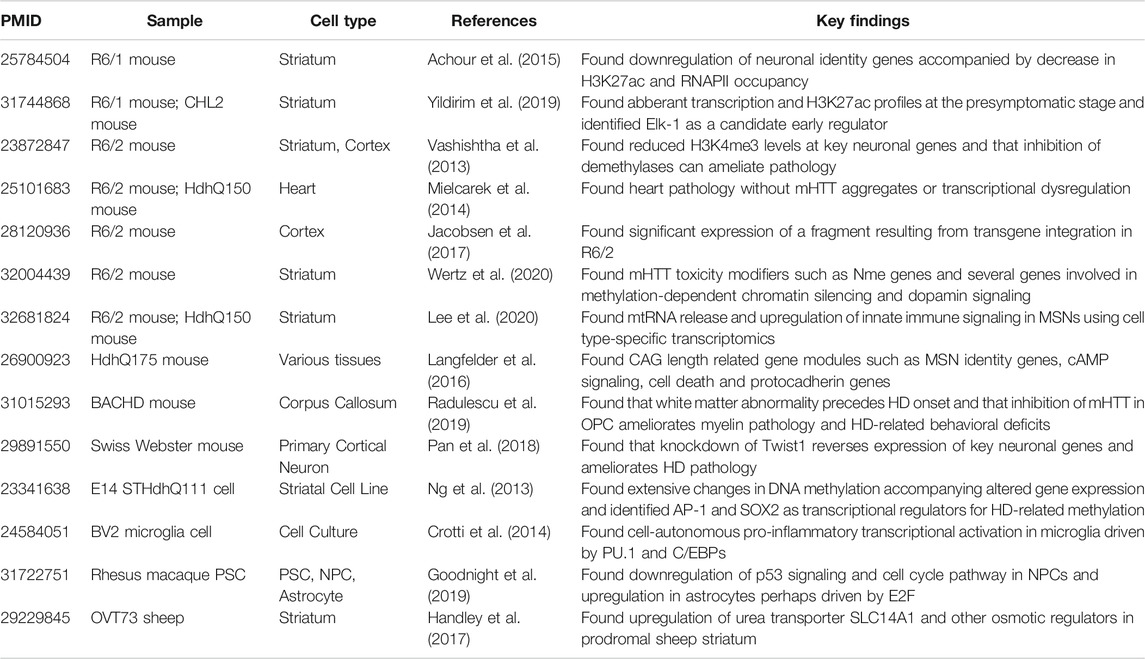
TABLE 5. Characteristics of included non human HD studies. The table summarizes the PMID, sample, cell type, reference and key findings of each included non human study (Ng et al., 2013; Vashishtha et al., 2013; Crotti et al., 2014; Mielcarek et al., 2014; Langfelder et al., 2016; Handley et al., 2017; Jacobsen et al., 2017; Pan et al., 2018; Goodnight et al., 2019; Radulescu et al., 2019; Yildirim et al., 2019; Lee et al., 2020; Wertz et al., 2020).
Similar to human data, in the mouse data, we checked the expression changes of 45 previously published key HD genes (Seredenina and Luthi-Carter, 2012; Vashishtha et al., 2013). Among the 45 key HD genes, the commonly dysregulated genes in mice were Ryr1, Scn4b, Gpr6, Hrh3, Foxp1, Gpr88, Rgs9, Pde10a, Arpp21, Adora 2a, Adcy5, Drd2, Pcp4 (Supplementary Figure S6A). Moreover, the available monkey dataset showed genes such as CAMKV, KCNIP2, OPRD1, RGS9, HRH3, ADORA2A, KLF16, CNR1, OPRK1, FOXP1, NR4A1, TESC, GSN and RARB that were dysregulated in monkey model of HD (Supplementary Figure S6B). These findings provide evidence that the HD animal models faithfully recapitulate human HD regarding its molecular pathology.
While different HD mouse models show disease progression at different ages, we sorted all the datasets along a disease progression timeline based on the literature regarding HD mouse models (see methods). For this, three studies were excluded as they were cell culture models and could not be confidently assigned to a disease stage. Then, we categorized the mouse datasets as early, intermediate and late stages (Figure 7A), in which the latter two were comparable to the symptomatic stage in humans. Out of 1,037, 13788 and 12609 total DEGs (Supplementary Dataset S10), 58, 5201 and 6985 genes were frequently dysregulated in early, intermediate and late disease stage of HD mice, respectively, of which only 47 genes were common across all the three disease stages (Figure 7B). Some of the common genes were Scn4b, Penk, Arpp21, Kcnab1, Ngef, Ppp4r4, Gpx6, Slc4a11, Rgs4, Rgs14, Adora2a, Gpr153, Plk5 and Wnt4 (Supplementary Dataset S10). In early stage, genes such as Clspn, Gpr153, Gpx6, Krt9, Penk and Plk5 were frequently dysregulated, while in intermediate stage, Penk, Atp2b1, Scn4b, Pde10a and Rbfox1 were dysregulated to name a few. In late stage, Pcp4, Scn4b, Pde10a, Penk Atp2b1, Hspa8 and Nrxn3 were dysregulated among many others (Supplementary Dataset S10). The top upregulated and downregulated genes in each dataset are shown in Table 6. Additionally, we compared single cell transcriptomic analysis of medium spiny neurons and interneurons with bulk striatal data. We observed that of 4,936 differentially expressed genes in MSNs, 2,522 genes were unique in medium spiny neurons and out of 173 in interneurons, 77 genes were unique to interneurons (Figures 7C,D).
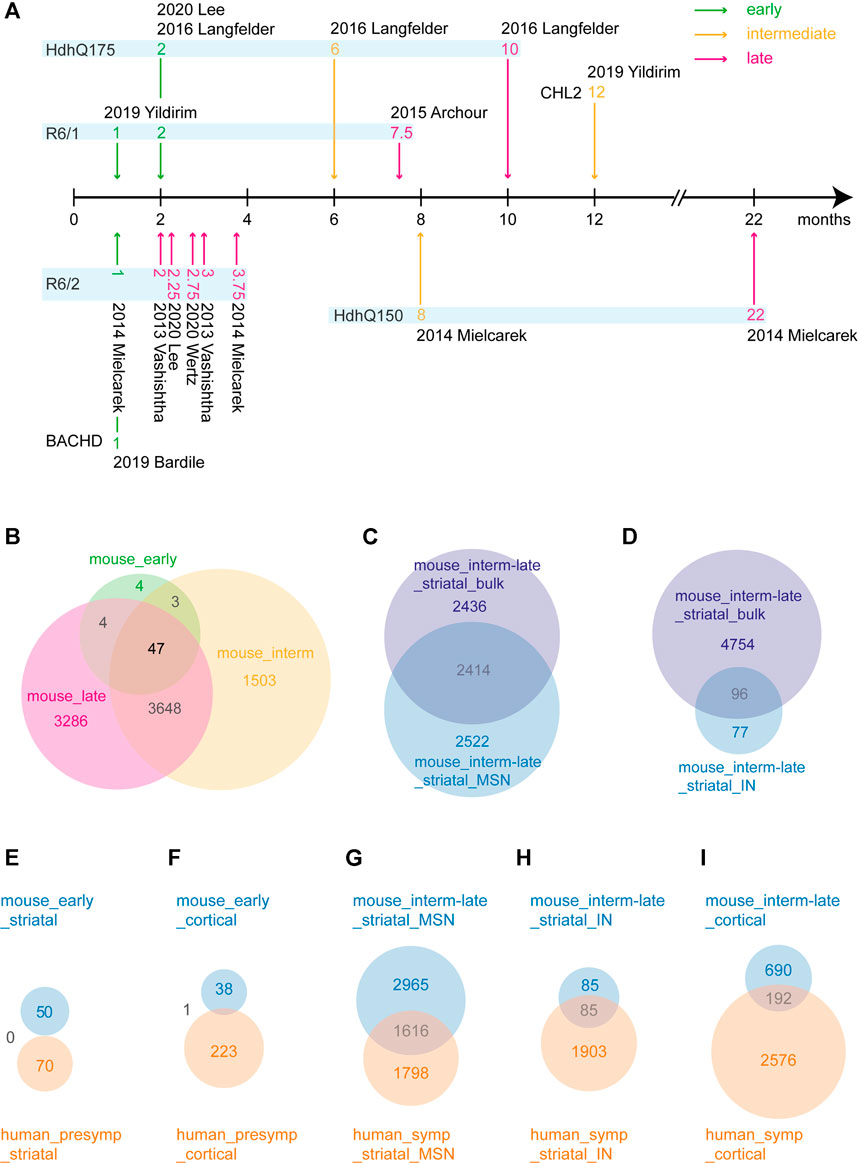
FIGURE 7. Differentially expressed gene (DEG) analysis and overlap between mouse and human datasets. (A) HD mouse model disease progression timeline. Based on existing literature, timepoints from HD models are categorized as early, intermediate and late disease stage. (B) Venn diagram of DEG overlap between mouse early, intermediate and late categories. (C) Venn diagram of DEG overlap between mouse intermediate/late bulk striata and mouse intermediate/late striatal medium spiny neurons. (D) Venn diagram of DEG overlap between mouse intermediate/late bulk striata and mouse intermediate/late striatal interneurons. (E–I) Corresponding cell types and disease stages between human and mouse categories were compared. Blue denotes mouse categories; orange denotes human categories.
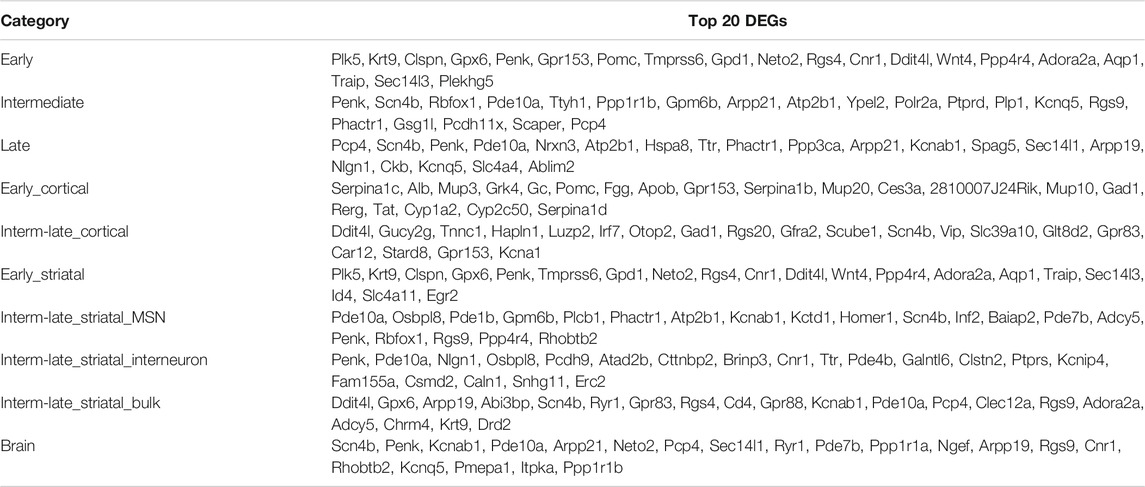
TABLE 6. Mouse top differentially expressed genes (DEGs) in each category. The table summarizes the top DEGs in brain subcategories in mouse, first ranked by the frequency of DEGs, then by the average FDR value of DEGs across all datasets in that subcategory.
To evaluate how well the mouse models recapitulate the transcriptional changes in human HD, we compared early disease stages in mice with presymptomatic human brain, and intermediate and late stages in mice with symptomatic human brain. In early/presymptomatic stages, we observed no overlapping DEGs in the striatum and only one overlapping DEG, Serpina1 in the cortex (Figures 7E,F, Supplementary Dataset S10). The overlap between the mouse and human data was comparably large with 1,616, 85 and 192 overlapping DEGs between intermediate-late mouse MSNs, interneurons and cortex with corresponding symptomatic HD human brain subcategories (Figures 7G–I). Some of the genes common between human and mouse are Mtf2, Mtus2, Slc25A, Smarcal1, Snap25, Smarca2, Mt-co3, Camk4 (Supplementary Dataset S10). Moreover, the expression changes of the three common heat shock genes from the human subcategories, Dnajb1, Hspa1b and Hspb1, were variable in the mouse datasets. While the expression of Hspa1b and Hspb1 weren’t altered in majority of the striatal mouse datasets, Dnajb1 showed upregulation in some datasets and downregulation in some others in HD mice Table 4).
Comparison of mRNA Changes to Previous Microarray Studies
We also compared the mRNA data included in our analysis with two key microarray studies in the field, Hodges et al. (2006) and Kuhn et al. (2007). As reported in Hodges et al. (2006), we observed the majority of dysregulated genes in caudate or striatum, which they showed in their study to be independent of neuronal loss in this area. Out of the listed top 30 upregulated and down regulated genes, 15 and 20 genes, respectively were common in our data (Supplementary Dataset S6). Dysregulation of genes associated mainly with heat shock proteins, chaperonins, protein folding and response to unfolded protein were in consistency with the microarray study in human HD caudate. In accordance with Hodges et al. (2006), we also report that the dysregulated genes in MSNs are mostly associated with neurotransmitter receptor activity, as well as with those conveying signals from excitatory amino acids like glutamate receptor signalling pathway. Furthermore, Kuhn et al. (2007) demonstrated that the different genetic models of mouse could replicate the transcriptomic changes of human HD caudate, however, regional specificity in most mouse models was considered to be very low. The study showed stronger similarity in downregulated genes between mouse models and human HD. We observed in our study 43 genes out of 60 top mouse genes that were concordant with human caudate in the microarray analysis of Kuhn et al., 2007. Some of the common genes between our study and Kuhn et al. (2007) are RASGRP2, RGS14, HOMER1, PENK, PPP3CA, PLCB1, PPP1R1A, CAMK2A and RGS4 (Supplementary Dataset S6). Overall, our finding of genes dysregulated in human and non-human HD models using RNA-seq were consistent with the findings from previous key microarray studies.
Discussion
In Huntington’s disease, transcriptional dysregulation is one of the early and central contributors to the disease pathogenesis. Examination of these changes by comparing gene expression patterns, their regulators and the affected pathways is therefore crucial for understanding the pathophysiology of the disease. Although there are numerous studies, including both research and review work, focusing on gene expression changes in HD, a systematic review of this literature has been lacking. Here, we performed a comprehensive systematic review of all available transcriptional profiling studies in HD that used RNA sequencing technique, published by the time of our screening (August 2020). Our systematic review protocol has been registered at the Open Science Framework (OSF) (Chasapopoulou et al., 2020). We retrieved literature from PubMed and gene expression databases from BioProject, ArrayExpress, ENA and EGA following the PRISMA guidelines (Supplementary Figure S1). After excluding papers and datasets that did not meet the inclusion criteria (Figure 1), we grouped the human studies based on tissue/cell types and disease stages (Figure 2) for the assessment of differential expression of genes as well as gene ontology and gene set enrichment analyses in cell culture models, postmortem brain and blood samples from HD patients. Further, we examined transcription factors and epigenetic regulators, which may underlie the observed transcriptional dysregulation in HD. Additionally, we systematically reviewed non-human HD studies and compared differential gene expression patterns in mouse models to the human data.
In human studies, comparison of the most frequent DEGs across subcategories revealed that human HD cell culture models were distinct in their transcriptional profiles compared to postmortem brain samples, suggesting that the cell culture models may not fully recapitulate the molecular pathology in human HD (Figure 3A, Supplementary Figure S3). In cell culture models, IGDCC3 and XKR4 genes were commonly dysregulated in all studies. IGDCC3 takes part in nervous system development (Salbaum, 1998) and XKR4 is involved in apoptotic processes during development (Suzuki et al., 2014). On the other hand, the most commonly dysregulated genes in post-mortem brain samples were DNAJB1, HSPA1B and HSPB1 that were reported in all postmortem datasets except for the MSN subcategory, while HSPH1 and SAT1 were reported in all symptomatic subcategories. SAT1 is involved in p53-mediated ferroptotic responses and tumorigenic aggressiveness (Kang et al., 2019), while the other genes are involved in heat shock response. Heat shock response is initiated during cellular stress that leads to regulation of heat shock proteins. Differential expression of these genes are in consistency with the reports of dysregulation of heat shock genes in HD in many studies (Gomez-Paredes et al., 2021; Labbadia et al., 2011; Labbadia and Morimoto, 2013; San Gil et al., 2017). Importantly, several heat shock proteins have been reported to be associated with regulation of huntingtin aggregation (Orozco-Diaz et al., 2019), including DNAJB1, HSPA1A, HSPA1B and HSPB1 that were reported to suppress polyglutamine aggregation in mammalian cells (Gomez-Paredes et al., 2021; Hay et al., 2004; Zourlidou et al., 2007). In our study, we observed mostly an upregulation of DNAJB1, HSPA1B and HSPB1 in HD. In presymptomatic postmortem brain, the upregulation was even higher in comparison to the symptomatic postmortem brain regions, which could be a mechanism of coping with protein misfolding during early stage of the disease. In contrast, MSNs did not show upregulation of heat shock response genes in the symptomatic stage of HD, which might implicate a lack of protein quality control and stress response leading to enhanced vulnerability of these neurons in HD. Importantly, while mouse datasets showed diverse changes of expression of Dnajb1, Hspa1b and Hspb1 were not differentially expressed in majority of the striatal mouse datasets, indicating consistency with the findings from the caudate data in human.
Protein misfolding is one of the hallmarks in not only HD but also is associated with other neurodegenerative disorders like Alzheimer’s Disease (AD), Parkinson’s Disease (PD) and amyotrophic lateral sclerosis (ALS). Ruffinni et al. (2020) have identified an overlap of 139 genes among HD, AD, PD and ALS, which were also involved in the response to heat and hypoxia (Ruffini et al., 2020). In this context, modulation of heat shock response geneshas also been proposed to be a potential therapeutic target in neurodegenerative diseases associated with misfolded protein aggregates (Ramos et al., 2018; Gomez-Paredes et al., 2021; Labbadia and Morimoto, 2013). Hsp 27 and Hsp 70 overexpression were shown to exert protective effects in cell culture models. Contrastingly, overexpression of Hsp27 and Hsp 70 in R6/2 mice could not improve the disease phenotype. In acute conditions such as kainate-induced or ischemic injury, in vivo studies also reported to show protective effects, suggesting difference in heat shock response in acute and chronic disease conditions (Hay et al., 2004; Zourlidou et al., 2007; Labbadia et al., 2011). Labbadia et al., 2011 demonstrated a transient positive effect on disease phenotype via pharmacological activation of HSF1, a major regulator of heat shock response, in HD mice. As potential explanation for this transient effect, the authors suggested that as the disease progresses, the progressive reduction in histone acetylation may lead to reduced HSF1 binding, consequently reducing the expression of heat shock response genes. Hence, a combinatorial targeting approach targeting both the heat shock response regulators and the altered epigenome could be considered in future studies. In this line, we previously reported highly coordinated chromatin and transcriptional changes in the brains of HD mice, revealing the epigenomic changes as strong candidates for targeting transcriptional dysregulation in HD (Vashishtha et al., 2013; Yildirim et al., 2019). Moreover, all late brain categories shared the Spermidine/Spermine N1-Acetyltransferase 1 (SAT1) gene, which has been reported to have positive influence on recognition and memory in a rodent model of HD (Velloso et al., 2009). Vivo et al., 2001 reported that during severe brain atrophy, the concentration of spermine reduces in neurodegenerative diseases like Parkinson’s disease and HD and in the aging brain (Vivo et al., 2001). Additionally, spermidine pathway was shown to modulate muscarinic and NMDA receptor blockade in hippocampus, preventing reactive astrogliosis and mnemonic deficits in HD (Velloso et al., 2009). In MSNs, neurodegeneration might influence SAT1 gene expression leading to spermine depletion-associated gliosis and mnemonic deficits. In our study, we observed upregulation of the SAT1 gene in the presymptomatic brain, and downregulation in most of the symptomatic brain regions, specifically in MSNs (Supplementary Dataset S4).
Specifically focusing on iMSNs, the most vulnerable cell types to mutant HTT toxicity, we observed that dMSNs and Foxp2/Olfm3-expressing neurons (FON) share most genes with iMSNs. In contrast, only a few genes were in common with blood monocytes, platelets as well as with presymptomatic BA9 and caudate nucleus (Figure 3B). Furthermore, differential expression of genes associated to dysregulation of mitochondrial complex I, cytochrome c oxidase, ATP synthase and kinases were observed in iMSNs. Regarding mitochondrial genes, we observed that MT-ND3, MT-CO2, MT-ND4L, MT-ND4, MT-ATP6, MT-CO3, SLC26A3, INO80D, MT-CO1 and MT-ND genes were upregulated in iMSNs in HD. Impaired energy metabolism due to mitochondrial dysfunction is considered as one of the contributing factors in HD as well as in other neurodegenerative diseases (Gomez-Paredes et al., 2021; Labbadia and Morimoto, 2013). Lee et al. (2020) also reported mitochondrial genes to be the most upregulated genes in iMSNs in HD. In HD, mitochondrial dysfunction is known to cause mtRNA release, which subsequently triggers innate immune signaling leading to enhanced vulnerability of iMSNs (Lee et al., 2020).
Blood is of great interest, since it can provide accessible diagnostic and prognostic biomarkers (Borovecki et al., 2005). In this study, we found that the blood had no common DEGs with presymptomatic BA9 and only two common DEGs with presymptomatic caudate, which is in line with the fact that the blood samples in the included datasets were obtained from symptomatic HD patients. The number of common DEGs was significantly more between blood and symptomatic brain regions, for instance, 50 genes with BA9, 25 genes with iMSN, 23 genes with FON, 22 genes with dMSN, and 20 genes with astrocytes (Figure 3C). These concordant gene expression changes could be further investigated to explore their potential as biomarkers in HD (Figure 8).
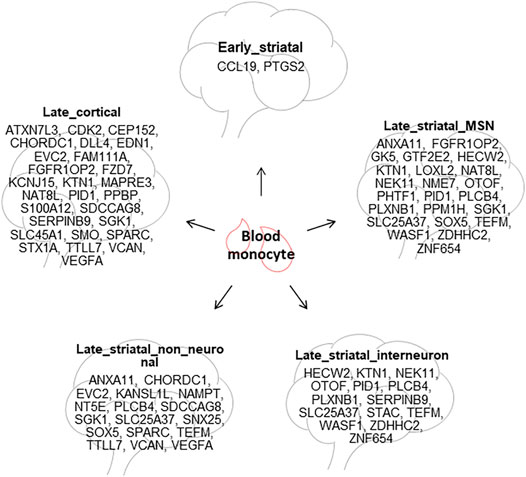
FIGURE 8. Potential blood biomarkers for HD. The common DEGs between HD blood monocytes and different HD brain tissues are summarized.
Our gene set enrichment analysis results showed that the human HD datasets were commonly enriched for many gene sets such as dysregulation of protein translation and targeting, heat shock response, immune response, transcription regulatory region DNA-binding, cAMP signaling, synaptic transmission, signaling pathway and p53 pathway (Figure 4). On the other hand, there were also different enrichments depending on the categories. While the cellular models showed enrichment of cellular processes and developmental pathways, postmortem brains showed distinct enrichment of major gene sets related to protein folding, translation and localization, immune response, apoptotic processes, stress responses and synaptic transmission. Of note, in line with previous studies (Seredenina and Luthi-Carter, 2012; Vashishtha et al., 2013), some of the key HD genes including PCP4, RARB, NGEF, ADCY5, CAMKV, GRM3, BCL11B, CNR1, RGS9, DRD2 and CAMKK2 were downregulated in postmortem neuronal cells but upregulated in some of the cell culture models (Supplementary Figure S4), indicating the distinct differential gene expression patterns in the postmortem primary tissues and cellular models in HD. In blood, gene set enrichment analysis showed that signaling pathways associated with IL-17, JAK-STAT and cancer related gene sets were enriched.
Furthermore, to search for key regulators underlying the transcriptional dysregulation in HD, we examined both the regulators predicted by DEGs and regulators that were differentially expressed themselves in HD. In the first analysis, we found potential regulators like SP4, NRF1, BRD4, RYBP, ZFP64, HDAC1, FOXO1, CREB1, NFKB1, BRD2, SP1 and CTCF that were common in all subcategories and regulators predicted only in specific categories such as TCF12, AR, ZNF317 and PRDM6 in brain_late_striatal_non_neuronal subcategory and CBFB, GTF3C5, RING1, RBBP5, TEAD4 and BHLHE40 in blood (Figure 5). The second analysis uncovered many differentially expressed transcription factors and epigenetic regulators, some of which were indicated as potential master regulators in HD by previous studies, e.g., JUN related transcription factors (Perrin et al., 2009), FOS related transcription factors (Cabanas et al., 2017), CBP (Giralt et al., 2012), EGR1 (Chandrasekaran and Bonchev, 2016) and ELK1 (Yildirim et al., 2019). Additionally, Valor et al., reviewed the role of SP1, CREB, NF-KB, P53, REST, HIPPI, FOXP1 as well as HSF1 in HD pathology (Valor, 2014). Among these, binding of HSF1 to their loci was observed to be depleted in in vitro HD studies. In vivo, both the expression of heat shock genes as well as HSF1 binding were reported to be modulated in HD (Valor, 2015). Among the top upregulated and downregulated transcription factors and epigenetic regulators (Figure 6), TCF4 is involved in regulation of synaptic plasticity, DNA methylation and memory function (Kennedy et al., 2016), SON is known to participate in transcription, pre-messenger RNA splicing and cell cycle regulation (Lu et al., 2014), INO80 complex an ATP-dependent nucleosome remodeling complex conserved from yeast to human (Jin et al., 2005) and PRMT2 an arginine methyltransferase and a coactivator of the androgen- and estrogen-mediated transactivation (Meyer et al., 2007). Interestingly, some of the top upregulated epigenetic modifiers, KDM4B, SMARCD1 and KMT2C were downregulated and two of the top downregulated epigenetic modifiers, PRMT8 and SETD5 were upregulated in MSNs (Figure 6). Moreover, there were some regulators, such as TCF4, FOSL2, BCL6, RXRA, CUX1, CREBBP, E2F3, BCL11A, EGR1, FOXG1, TP53, JMJD1C and STAT4, which were both changed in expression and were predicted to be the regulators of DEGs in HD (Supplementary Dataset S9).
In non-human models, we observed some of the well reported DEGs in HD such as, Adora2a, Adcy5, CamkV and Penk (Seredenina and Luthi-Carter, 2012; Vashishtha et al., 2013; Shao et al., 2020). In particular, the mouse data showed relatively fewer dysregulated transcripts in the early stages, which expanded tremendously during the progression of the disease at later stages (Figure 7B). We found a large concordance of transcriptional changes between the mouse and human data in the progressive disease phase, which indicates the suitability of mouse models for studying HD molecular pathology. Notably, we found that only around half of the genes were common between MSNs data and the whole striatum data in mouse models (Figure 7C). This is likely due to the contribution of other cell types of the striatum to the bulk data. Also, differences between single cell RNA-seq and bulk RNA-seq should be taken into consideration. In this context, limitations of the present study should be acknowledged. We encountered technical challenges dealing with methodological variability between datasets. As the scope of our study was not the re-analysis of RNA sequencing data, we used the DEGs and the backgrounds generated by the authors, using the filtering and cutoffs indicated in the respective papers. Some of the studies applied single-cell transcriptomics, while others used bulk tissue transcriptomics. Although, single cell RNA-seq data tended to have larger numbers of significant DEGs, they were treated similarly with bulk RNA-seq data. Hence, these differences in study settings, techniques and data analysis in each paper may have generated potential bias in the analysis of our study.
Nevertheless, in this study, we were able to show that MSNs exhibit unique dysregulation of genes in comparison to the other brain regions. Except for MSNs, all cortex and striatum categories shared three heat shock response and unfolded protein response genes, DNAJB1, HSPA1B and HSPB1, that were upregulated in both early and late stages of HD (Figure 9). In iMSNs, we found unique dysregulation of mitochondrial function related genes (Figure 9). Additionally, downregulation of SAT1 gene may be related to early neurodegeneration of MSNs, which might also be the consequence of unique dysregulation of mitochondrial function related genes. We also found differential expression and predicted activity of a number of transcription factors such as BCL11A, BCL6, EGR1 and FOSL2, and epigenetic regulators like CREBBP, HDAC1, KAT2B, KDM4C and KDM5B in human HD. This review hence summarizes and confirms reports from previous studies as well as presents new observations by systematically reviewing all the literature on transcriptional analysis using RNA sequencing in HD.
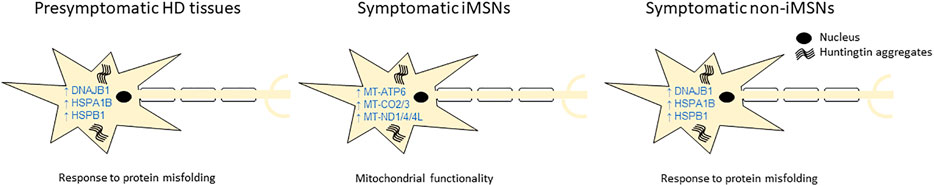
FIGURE 9. Key differentially expressed genes (DEGs) and pathways potentially responsible for HD pathology. The diagram summarizes the key DEGs and pathways generated from data synthesis, which may explain the differential vulnerability of indirect pathway medium spiny neurons (iMSNs) compared to other cell types in brain.
Data Availability Statement
The datasets presented in this study can be found in online repositories. The names of the repository/repositories and accession number(s) can be found in the article/Supplementary Material.
Author Contributions
FY conceived and supervised the study. XG and ZC prepared and registered the systematic review protocol, performed the literature search, screening and data acquisition. GS analyzed and visualized the data with contributions from XG. BM, XG and FY interpreted the data. BM and FY wrote the manuscript with contributions from XG and GS. All authors read, contributed to manuscript revision and approved the final manuscript.
Conflict of Interest
The authors declare that the research was conducted in the absence of any commercial or financial relationships that could be construed as a potential conflict of interest.
Publisher’s Note
All claims expressed in this article are solely those of the authors and do not necessarily represent those of their affiliated organizations, or those of the publisher, the editors and the reviewers. Any product that may be evaluated in this article, or claim that may be made by its manufacturer, is not guaranteed or endorsed by the publisher.
Acknowledgments
We would like to acknowledge all the authors of included or excluded studies in this systematic review who kindly provided data upon request. We thank Dr. Sarah McCann for advice and technical support for preparation of the systematic review methodology.
Supplementary Material
The Supplementary Material for this article can be found online at: https://www.frontiersin.org/articles/10.3389/fgene.2021.751033/full#supplementary-material
References
Achour, M., Le Gras, S., Keime, C., Parmentier, F., Lejeune, F.-X., Boutillier, A.-L., et al. (2015). Neuronal Identity Genes Regulated by Super-enhancers Are Preferentially Down-Regulated in the Striatum of Huntington's Disease Mice. Hum. Mol. Genet. 24, 3481–3496. doi:10.1093/hmg/ddv099
Agus, F., Crespo, D., Myers, R. H., and Labadorf, A. (2019). The Caudate Nucleus Undergoes Dramatic and Unique Transcriptional Changes in Human Prodromal Huntington's Disease Brain. BMC Med. Genom. 12, 137. doi:10.1186/s12920-019-0581-9
Al-Dalahmah, O., Sosunov, A. A., Shaik, A., Ofori, K., Liu, Y., Vonsattel, J. P., et al. (2020). Single-nucleus RNA-Seq Identifies Huntington Disease Astrocyte States. Acta Neuropathol. Commun. 8, 19. doi:10.1186/s40478-020-0880-6
Anderson, K. E., van Duijn, E., Craufurd, D., Drazinic, C., Edmondson, M., Goodman, N., et al. (2018). Clinical Management of Neuropsychiatric Symptoms of Huntington Disease: Expert-Based Consensus Guidelines on Agitation, Anxiety, Apathy, Psychosis and Sleep Disorders. J. Huntingtons Dis. 7, 355–366. doi:10.3233/jhd-180293
Borovecki, F., Lovrecic, L., Zhou, J., Jeong, H., Then, F., Rosas, H. D., et al. (2005). Genome-wide Expression Profiling of Human Blood Reveals Biomarkers for Huntington's Disease. Proc. Natl. Acad. Sci. 102, 11023–11028. doi:10.1073/pnas.0504921102
Cabanas, M., Bassil, F., Mons, N., Garret, M., and Cho, Y. H. (2017). Changes in Striatal Activity and Functional Connectivity in a Mouse Model of Huntington's Disease. PLoS One 12, e0184580. doi:10.1371/journal.pone.0184580
Cha, J.-H. J. (2007). Transcriptional Signatures in Huntington's Disease. Prog. Neurobiol. 83, 228–248. doi:10.1016/j.pneurobio.2007.03.004
Chandrasekaran, S., and Bonchev, D. (2016). Network Analysis of Human post-mortem Microarrays Reveals Novel Genes, microRNAs, and Mechanistic Scenarios of Potential Importance in Fighting huntington's Disease. Comput. Struct. Biotechnol. J. 14, 117–130. doi:10.1016/j.csbj.2016.02.001
Chasapopoulou, Z., Guo, X., and Yildirim, F (2020). A Systematic Review of Transcriptional Dysregulation in Huntington`s Disease Studied by RNA Sequencing. osfio/pm3wq
Consortium, H. D. I. (2017). Developmental Alterations in Huntington's Disease Neural Cells and Pharmacological rescue in Cells and Mice. Nat. Neurosci. 20, 648–660. doi:10.1038/nn.4532
Crotti, A., Benner, C., Kerman, B. E., Gosselin, D., Lagier-Tourenne, C., Zuccato, C., et al. (2014). Mutant Huntingtin Promotes Autonomous Microglia Activation via Myeloid Lineage-Determining Factors. Nat. Neurosci. 17, 513–521. doi:10.1038/nn.3668
De Souza, R. A. G., Islam, S. A., McEwen, L. M., Mathelier, A., Hill, A., Mah, S. M., et al. (2016). DNA Methylation Profiling in Human Huntington's Disease Brain. Hum. Mol. Genet. 25, 2013–2030. doi:10.1093/hmg/ddw076
Denis, H. L., Lamontagne-Proulx, J., St-Amour, I., Mason, S. L., Rowley, J. W., Cloutier, N., et al. (2019). Platelet Abnormalities in Huntington's Disease. J. Neurol. Neurosurg. Psychiatry 90, 272–283. doi:10.1136/jnnp-2018-318854
Duff, K., Paulsen, J. S., Beglinger, L. J., Langbehn, D. R., and Stout, J. C.Predict-HD Investigators of the Huntington Study Group (2007). Psychiatric Symptoms in Huntington's Disease before Diagnosis: the Predict-HD Study. Biol. Psychiatry 62, 1341–1346. doi:10.1016/j.biopsych.2006.11.034
Dunah, A. W., Jeong, H., Griffin, A., Kim, Y. M., Standaert, D. G., Hersch, S. M., et al. (2002). Sp1 and TAFII130 Transcriptional Activity Disrupted in Early Huntington's Disease. Science 296, 2238–2243. doi:10.1126/science.1072613
Eden, E., Navon, R., Steinfeld, I., Lipson, D., and Yakhini, Z. (2009). GOrilla: a Tool for Discovery and Visualization of Enriched GO Terms in Ranked Gene Lists. BMC Bioinformatics 10, 48. doi:10.1186/1471-2105-10-48
Ferrante, R. J., Kubilus, J. K., Lee, J., Ryu, H., Beesen, A., Zucker, B., et al. (2003). Histone Deacetylase Inhibition by Sodium Butyrate Chemotherapy Ameliorates the Neurodegenerative Phenotype in Huntington's Disease Mice. J. Neurosci. 23, 9418–9427. doi:10.1523/jneurosci.23-28-09418.2003
Gil, J. M., and Rego, A. C. (2008). Mechanisms of Neurodegeneration in Huntington's Disease. Eur. J. Neurosci. 27, 2803–2820. doi:10.1111/j.1460-9568.2008.06310.x
Giralt, A., Puigdellivol, M., Carreton, O., Paoletti, P., Valero, J., Parra-Damas, A., et al. (2012). Long-term Memory Deficits in Huntington's Disease Are Associated with Reduced CBP Histone Acetylase Activity. Hum. Mol. Genet. 21, 1203–1216. doi:10.1093/hmg/ddr552
Goodnight, A. V., Kremsky, I., Khampang, S., Jung, Y. H., Billingsley, J. M., Bosinger, S. E., et al. (2019). Chromatin Accessibility and Transcription Dynamics during In Vitro Astrocyte Differentiation of Huntington's Disease Monkey Pluripotent Stem Cells. Epigenetics Chromatin 12, 67. doi:10.1186/s13072-019-0313-6
Gomez-Paredes, C., Mason, M. A., Taxy, B. A., Papadopoulou, A. S., Paganetti, P., and Bates, G. P. (2021). The heat shock response, determined by QuantiGene multiplex, is impaired in HD mouse models and not caused by HSF1 reduction. Sci Rep 11, 9117. doi:10.1038/s41598-021-88715-5
Hay, D. G., Sathasivam, K., Tobaben, S., Stahl, B., Marber, M., Mestril, R., et al. (2004). Progressive Decrease in Chaperone Protein Levels in a Mouse Model of Huntington's Disease and Induction of Stress Proteins as a Therapeutic Approach. Hum Mol Genet 13, 1389–1405. doi:10.1093/hmg/ddh144
Handley, R. R., Reid, S. J., Brauning, R., Maclean, P., Mears, E. R., Fourie, I., et al. (2017). Brain Urea Increase Is an Early Huntington's Disease Pathogenic Event Observed in a Prodromal Transgenic Sheep Model and HD Cases. Proc. Natl. Acad. Sci. USA 114, E11293–E11302. doi:10.1073/pnas.1711243115
Hecklau, K., Mueller, S., Koch, S. P., Mehkary, M. H., Kilic, B., Harms, C., et al. (2021). The Effects of Selective Inhibition of Histone Deacetylase 1 and 3 in Huntington's Disease Mice. Front. Mol. Neurosci. 14, 616886. doi:10.3389/fnmol.2021.616886
Helmlinger, D., Tora, L., and Devys, D. (2006). Transcriptional Alterations and Chromatin Remodeling in Polyglutamine Diseases. Trends Genet. 22, 562–570. doi:10.1016/j.tig.2006.07.010
Hervás-Corpión, I., Guiretti, D., Alcaraz-Iborra, M., Olivares, R., Campos-Caro, A., Barco, Á., et al. (2018). Early Alteration of Epigenetic-Related Transcription in Huntington's Disease Mouse Models. Sci. Rep. 8, 9925. doi:10.1038/s41598-018-28185-4
Hodges, A., Strand, A. D., Aragaki, A. K., Kuhn, A., Sengstag, T., Hughes, G., et al. (2006). Regional and Cellular Gene Expression Changes in Human Huntington's Disease Brain. Hum. Mol. Genet. 15, 965–977. doi:10.1093/hmg/ddl013
Jacobsen, J. C., Erdin, S., Chiang, C., Hanscom, C., Handley, R. R., Barker, D. D., et al. (2017). Potential Molecular Consequences of Transgene Integration: The R6/2 Mouse Example. Sci. Rep. 7, 41120. doi:10.1038/srep41120
Jin, J., Cai, Y., Yao, T., Gottschalk, A. J., Florens, L., Swanson, S. K., et al. (2005). A Mammalian Chromatin Remodeling Complex with Similarities to the Yeast INO80 Complex. J. Biol. Chem. 280, 41207–41212. doi:10.1074/jbc.m509128200
Kang, R., Kroemer, G., and Tang, D. (2019). The Tumor Suppressor Protein P53 and the Ferroptosis Network. Free Radic. Biol. Med. 133, 162–168. doi:10.1016/j.freeradbiomed.2018.05.074
Kennedy, A. J., Rahn, E. J., Paulukaitis, B. S., Savell, K. E., Kordasiewicz, H. B., Wang, J., et al. (2016). Tcf4 Regulates Synaptic Plasticity, DNA Methylation, and Memory Function. Cel Rep. 16, 2666–2685. doi:10.1016/j.celrep.2016.08.004
Kuhn, A., Goldstein, D. R., Hodges, A., Strand, A. D., Sengstag, T., Kooperberg, C., et al. (2007). Mutant Huntingtin's Effects on Striatal Gene Expression in Mice Recapitulate Changes Observed in Human Huntington's Disease Brain and Do Not Differ with Mutant Huntingtin Length or Wild-type Huntingtin Dosage. Hum. Mol. Genet. 16, 1845–1861. doi:10.1093/hmg/ddm133
Labbadia, J., Cunliffe, H., Weiss, A., Katsyuba, E., Sathasivam, K., Seredenina, T., et al. (2011). Altered Chromatin Architecture Underlies Progressive Impairment of the Heat Shock Response in Mouse Models of Huntington Disease. J Clin Invest 121, 3306–3319. doi:10.1172/JCI57413
Labbadia, J., and Morimoto, R. I. (2013). Huntington's disease: underlying molecular mechanisms and emerging concepts. Trends Biochem. Sci 38, 378–385. doi:10.1016/j.tibs.2013.05.003
Lambert, S. A., Jolma, A., Campitelli, L. F., Das, P. K., Yin, Y., Albu, M., et al. (2018). The Human Transcription Factors. Cell 175, 598–599. doi:10.1016/j.cell.2018.09.045
Langfelder, P., Cantle, J. P., Chatzopoulou, D., Wang, N., Gao, F., Al-Ramahi, I., et al. (2016). Integrated Genomics and Proteomics Define Huntingtin CAG Length-dependent Networks in Mice. Nat. Neurosci. 19, 623–633. doi:10.1038/nn.4256
Lee, H., Fenster, R. J., Pineda, S. S., Gibbs, W. S., Mohammadi, S., Davila-Velderrain, J., et al. (2020). Cell Type-specific Transcriptomics Reveals that Mutant Huntingtin Leads to Mitochondrial RNA Release and Neuronal Innate Immune Activation. Neuron 107, 891–908. doi:10.1016/j.neuron.2020.06.021
Liao, Y., Wang, J., Jaehnig, E. J., Shi, Z., and Zhang, B. (2019). WebGestalt 2019: Gene Set Analysis Toolkit with Revamped UIs and APIs. Nucleic Acids Res. 47, W199–W205. doi:10.1093/nar/gkz401
Lim, R. G., Quan, C., Reyes-Ortiz, A. M., Lutz, S. E., Kedaigle, A. J., Gipson, T. A., et al. (2017). Huntington's Disease iPSC-Derived Brain Microvascular Endothelial Cells Reveal WNT-Mediated Angiogenic and Blood-Brain Barrier Deficits. Cel Rep. 19, 1365–1377. doi:10.1016/j.celrep.2017.04.021
Lin, L., Park, J. W., Ramachandran, S., Zhang, Y., Tseng, Y.-T., Shen, S., et al. (2016). Transcriptome Sequencing Reveals Aberrant Alternative Splicing in Huntington's Disease. Hum. Mol. Genet. 25, 3454–3466. doi:10.1093/hmg/ddw187
Lu, X., Ng, H.-H., and Bubulya, P. A. (2014). The Role of SON in Splicing, Development, and Disease. Wiley Interdiscip. Rev. RNA 5, 637–646. doi:10.1002/wrna.1235
MacDonald, M. (1993). A Novel Gene Containing a Trinucleotide Repeat that Is Expanded and Unstable on Huntington's Disease Chromosomes. Cell 72, 971–983. doi:10.1016/0092-8674(93)90585-e
Mason, S. L., and Barker, R. A. (2009). Emerging Drug Therapies in Huntington's Disease. Expert Opin. Emerging Drugs 14, 273–297. doi:10.1517/14728210902918299
Mehta, S. R., Tom, C. M., Wang, Y., Bresee, C., Rushton, D., Mathkar, P. P., et al. (2018). Human Huntington's Disease iPSC-Derived Cortical Neurons Display Altered Transcriptomics, Morphology, and Maturation. Cel Rep. 25, 1081–1096. doi:10.1016/j.celrep.2018.09.076
Meyer, R., Wolf, S. S., and Obendorf, M. (2007). PRMT2, a Member of the Protein Arginine Methyltransferase Family, Is a Coactivator of the Androgen Receptor. J. Steroid Biochem. Mol. Biol. 107, 1–14. doi:10.1016/j.jsbmb.2007.05.006
Mielcarek, M., Bondulich, M. K., Inuabasi, L., Franklin, S. A., Muller, T., and Bates, G. P. (2014). The Huntington's Disease-Related Cardiomyopathy Prevents a Hypertrophic Response in the R6/2 Mouse Model. PLoS One 9, e108961. doi:10.1371/journal.pone.0108961
Miller, J. R., Lo, K. K., Andre, R., Hensman Moss, D. J., Träger, U., Stone, T. C., et al. (2016). RNA-seq of Huntington's Disease Patient Myeloid Cells Reveals Innate Transcriptional Dysregulation Associated with Proinflammatory Pathway Activation. Hum. Mol. Genet. 25, 2893–2904. doi:10.1093/hmg/ddw142
Ng, C. W., Yildirim, F., Yap, Y. S., Dalin, S., Matthews, B. J., Velez, P. J., et al. (2013). Extensive Changes in DNA Methylation Are Associated with Expression of Mutant Huntingtin. Proc. Natl. Acad. Sci. 110, 2354–2359. doi:10.1073/pnas.1221292110
Ooi, J., Langley, S. R., Xu, X., Utami, K. H., Sim, B., Huang, Y., et al. (2019). Unbiased Profiling of Isogenic Huntington Disease hPSC-Derived CNS and Peripheral Cells Reveals Strong Cell-type Specificity of CAG Length Effects. Cel Rep. 26, 2494–2508. doi:10.1016/j.celrep.2019.02.008
Orozco-Díaz, R., Sánchez-Álvarez, A., Hernández-Hernández, J. M., and Tapia-Ramírez, J. (2019). The Interaction between RE1-Silencing Transcription Factor (REST) and Heat Shock Protein 90 as New Therapeutic Target against Huntington's Disease. PLoS One 14, e0220393. doi:10.1371/journal.pone.0220393
Osipovitch, M., Asenjo Martinez, A., Mariani, J. N., Cornwell, A., Dhaliwal, S., Zou, L., et al. (2019). Human ESC-Derived Chimeric Mouse Models of Huntington's Disease Reveal Cell-Intrinsic Defects in Glial Progenitor Cell Differentiation. Cell Stem Cell 24, 107–122. doi:10.1016/j.stem.2018.11.010
Pan, Y., Zhu, Y., Yang, W., Tycksen, E., Liu, S., Palucki, J., et al. (2018). The Role of Twist1 in Mutant Huntingtin-Induced Transcriptional Alterations and Neurotoxicity. J. Biol. Chem. 293, 11850–11866. doi:10.1074/jbc.ra117.001211
Paulsen, J. S., Nehl, C., Hoth, K. F., Kanz, J. E., Benjamin, M., Conybeare, R., et al. (2005). Depression and Stages of Huntington's Disease. J. Neuropsychiatry Clin. Neurosci. 17, 496–502. doi:10.1176/jnp.17.4.496
Perrin, V., Dufour, N., Raoul, C., Hassig, R., Brouillet, E., Aebischer, P., et al. (2009). Implication of the JNK Pathway in a Rat Model of Huntington's Disease. Exp. Neurol. 215, 191–200. doi:10.1016/j.expneurol.2008.10.008
Radulescu, C. I., Garcia-Miralles, M., Sidik, H., Bardile, C. F., Yusof, N. A. B. M., Lee, H. U., et al. (2019). Manipulation of Microbiota Reveals Altered Callosal Myelination and white Matter Plasticity in a Model of Huntington Disease. Neurobiol. Dis. 127, 65–75. doi:10.1016/j.nbd.2019.02.011
Ramos, E., Romero, A., Marco-Contelles, J., López-Muñoz, F., and Del Pino, J. (2018). Modulation of Heat Shock Response Proteins by ASS234, Targeted for Neurodegenerative Diseases Therapy. Chem. Res. Toxicol. 31, 839–842. doi:10.1021/acs.chemrestox.8b00192
Reiner, A., Albin, R. L., Anderson, K. D., D'Amato, C. J., Penney, J. B., and Young, A. B. (1988). Differential Loss of Striatal Projection Neurons in Huntington Disease. Proc. Natl. Acad. Sci. 85, 5733–5737. doi:10.1073/pnas.85.15.5733
Ring, K. L., An, M. C., Zhang, N., O’Brien, R. N., Ramos, E. M., Gao, F., et al. (2015). Genomic Analysis Reveals Disruption of Striatal Neuronal Development and Therapeutic Targets in Human Huntington's Disease Neural Stem Cells. Stem Cel Rep. 5, 1023–1038. doi:10.1016/j.stemcr.2015.11.005
Ross, C. A., and Tabrizi, S. J. (2011). Huntington's Disease: from Molecular Pathogenesis to Clinical Treatment. Lancet Neurol. 10, 83–98. doi:10.1016/s1474-4422(10)70245-3
Ruffini, N., Klingenberg, S., Schweiger, S., and Gerber, S. (2020). Common Factors in Neurodegeneration: A Meta-Study Revealing Shared Patterns on a Multi-Omics Scale. Cells 9. doi:10.3390/cells9122642
Sadri-Vakili, G., Bouzou, B., Benn, C. L., Kim, M.-O., Chawla, P., Overland, R. P., et al. (2007). Histones Associated with Downregulated Genes Are Hypo-Acetylated in Huntington's Disease Models. Hum. Mol. Genet. 16, 1293–1306. doi:10.1093/hmg/ddm078
Salbaum, J. M. (1998). Punc, a Novel Mouse Gene of the Immunoglobulin Superfamily, Is Expressed Predominantly in the Developing Nervous System. Mech. Develop. 71, 201–204. doi:10.1016/s0925-4773(98)00005-7
San Gil, R., Ooi, L., Yerbury, J. J., and Ecroyd, H. (2017). The Heat Shock Response in Neurons and Astroglia and its Role in Neurodegenerative Diseases. Mol. Neurodegener. 12, 65. doi:10.1186/s13024-017-0208-6
Seredenina, T., and Luthi-Carter, R. (2012). What Have We Learned from Gene Expression Profiles in Huntington's Disease? Neurobiol. Dis. 45, 83–98. doi:10.1016/j.nbd.2011.07.001
Shao, Z., Koh, W., Ni, Y., Li, W., Agatisa-Boyle, B., Merkurjev, D., et al. (2020). RNA Sequence Analyses throughout the Course of Mouse Cardiac Laminopathy Identify Differentially Expressed Genes for Cell Cycle Control and Mitochondrial Function. Sci. Rep. 10, 6632. doi:10.1038/s41598-020-63563-x
Singh Nanda, J., Kumar, R., and Raghava, G. P. S. (2016). dbEM: A Database of Epigenetic Modifiers Curated from Cancerous and normal Genomes. Sci. Rep. 6, 19340. doi:10.1038/srep19340
Smith-Geater, C., Hernandez, S. J., Lim, R. G., Adam, M., Wu, J., Stocksdale, J. T., et al. (2020). Aberrant Development Corrected in Adult-Onset Huntington's Disease iPSC-Derived Neuronal Cultures via WNT Signaling Modulation. Stem Cel Rep. 14, 406–419. doi:10.1016/j.stemcr.2020.01.015
Steffan, J. S., Kazantsev, A., Spasic-Boskovic, O., Greenwald, M., Zhu, Y.-Z., Gohler, H., et al. (2000). The Huntington's Disease Protein Interacts with P53 and CREB-Binding Protein and Represses Transcription. Proc. Natl. Acad. Sci. 97, 6763–6768. doi:10.1073/pnas.100110097
Subramanian, A., Tamayo, P., Mootha, V. K., Mukherjee, S., Ebert, B. L., Gillette, M. A., et al. (2005). Gene Set Enrichment Analysis: a Knowledge-Based Approach for Interpreting Genome-wide Expression Profiles. Proc. Natl. Acad. Sci. 102, 15545–15550. doi:10.1073/pnas.0506580102
Suelves, N., Kirkham-McCarthy, L., Lahue, R. S., and Ginés, S. (2017). A Selective Inhibitor of Histone Deacetylase 3 Prevents Cognitive Deficits and Suppresses Striatal CAG Repeat Expansions in Huntington's Disease Mice. Sci. Rep. 7, 6082. doi:10.1038/s41598-017-05125-2
Suzuki, J., Imanishi, E., and Nagata, S. (2014). Exposure of Phosphatidylserine by Xk-Related Protein Family Members during Apoptosis. J. Biol. Chem. 289, 30257–30267. doi:10.1074/jbc.m114.583419
Świtońska, K., Szlachcic, W. J., Handschuh, L., Wojciechowski, P., Marczak, Ł., Stelmaszczuk, M., et al. (2018). Identification of Altered Developmental Pathways in Human Juvenile HD iPSC with 71Q and 109Q Using Transcriptome Profiling. Front Cel Neurosci. 12, 528. doi:10.3389/fncel.2018.00528
Tabrizi, S. J., Reilmann, R., Roos, R. A., Durr, A., Leavitt, B., Owen, G., et al. (2012). Potential Endpoints for Clinical Trials in Premanifest and Early Huntington's Disease in the TRACK-HD Study: Analysis of 24 Month Observational Data. Lancet Neurol. 11, 42–53. doi:10.1016/s1474-4422(11)70263-0
Thomas, E. A., Coppola, G., Desplats, P. A., Tang, B., Soragni, E., Burnett, R., et al. (2008). The HDAC Inhibitor 4b Ameliorates the Disease Phenotype and Transcriptional Abnormalities in Huntington's Disease Transgenic Mice. Proc. Natl. Acad. Sci. U S A 105, 15564–15569. doi:10.1073/pnas.0804249105
Valor, L. M. (2015). Transcription, epigenetics and ameliorative strategies in Huntington's Disease: a genome-wide perspective. Mol Neurobiol 51, 406–423. doi:10.1007/s12035-014-8715-8
Vashishtha, M., Ng, C. W., Yildirim, F., Gipson, T. A., Kratter, I. H., Bodai, L., et al. (2013). Targeting H3K4 Trimethylation in Huntington Disease. Proc. Natl. Acad. Sci. 110, E3027–E3036. doi:10.1073/pnas.1311323110
Velloso, N. A., Dalmolin, G. D., Gomes, G. M., Rubin, M. A., Canas, P. M., Cunha, R. A., et al. (2009). Spermine Improves Recognition Memory Deficit in a Rodent Model of Huntington's Disease. Neurobiol. Learn. Mem. 92, 574–580. doi:10.1016/j.nlm.2009.07.006
Vivó, M., Vera, N. d., Cortés, R., Mengod, G., Camón, L., and Martı́nez, E. (2001). Polyamines in the Basal Ganglia of Human Brain. Influence of Aging and Degenerative Movement Disorders. Neurosci. Lett. 304, 107–111. doi:10.1016/s0304-3940(01)01776-1
Uhlen, M., Fagerberg, L., Hallstrom, B. M., Lindskog, C., Oksvold, P., Mardinoglu, A., et al. (2015). Proteomics Tissue-Based Map of the Human Proteome. Science 347, 1260419. doi:10.1126/science.1260419
Wang, M., Zhao, Y., and Zhang, B. (2015). Efficient Test and Visualization of Multi-Set Intersections. Sci. Rep. 5, 16923. doi:10.1038/srep16923
Wertz, M. H., Mitchem, M. R., Pineda, S. S., Hachigian, L. J., Lee, H., Lau, V., et al. (2020). Genome-wide In Vivo CNS Screening Identifies Genes that Modify CNS Neuronal Survival and mHTT Toxicity. Neuron 106, 76–89. doi:10.1016/j.neuron.2020.01.004
Yildirim, F., Ng, C. W., Kappes, V., Ehrenberger, T., Rigby, S. K., Stivanello, V., et al. (2019). Early Epigenomic and Transcriptional Changes Reveal Elk-1 Transcription Factor as a Therapeutic Target in Huntington's Disease. Proc. Natl. Acad. Sci. USA 116, 24840–24851. doi:10.1073/pnas.1908113116
Zhang, H. L., Li, H. Q., and Fan, S. Y. (2020a). Indicators for the Compression and Stretching Characteristics of the HTF-Coordinate of WRF. Adv. Meteorol. 2020, 1–11. doi:10.1155/2020/8854761
Zhang, Q., Liu, W., Zhang, H.-M., Xie, G.-Y., Miao, Y.-R., Xia, M., et al. (2020b). hTFtarget: A Comprehensive Database for Regulations of Human Transcription Factors and Their Targets. Genomics Proteomics Bioinformatics 18, 120–128. doi:10.1016/j.gpb.2019.09.006
Keywords: huntington’s disease, transcriptional dysregulation, RNA sequencing, transcription factors, epigenetic regulators
Citation: Malla B, Guo X, Senger G, Chasapopoulou Z and Yildirim F (2021) A Systematic Review of Transcriptional Dysregulation in Huntington’s Disease Studied by RNA Sequencing. Front. Genet. 12:751033. doi: 10.3389/fgene.2021.751033
Received: 31 July 2021; Accepted: 15 September 2021;
Published: 15 October 2021.
Edited by:
Anthony John Hannan, University of Melbourne, AustraliaReviewed by:
Caroline Louise Benn, LoQus23 Therapeutics, United KingdomDanny Hatters, The University of Melbourne, Australia
Geraldine Kong, Peter Doherty Institute for Infection and Immunity, Australia
Copyright © 2021 Malla, Guo, Senger, Chasapopoulou and Yildirim. This is an open-access article distributed under the terms of the Creative Commons Attribution License (CC BY). The use, distribution or reproduction in other forums is permitted, provided the original author(s) and the copyright owner(s) are credited and that the original publication in this journal is cited, in accordance with accepted academic practice. No use, distribution or reproduction is permitted which does not comply with these terms.
*Correspondence: Ferah Yildirim, ferah.yildirim@charite.de
†These authors share first authorship