 Nitika Sandhu1*†
 Gomsie Pruthi1†
 Om Prakash Raigar1†
 Mohini Prabha Singh1†Kanika Phagna2
 Aman Kumar1
 Mehak Sethi1Jasneet Singh1Pooja Ankush Ade1
 Dinesh Kumar Saini1
- 1Punjab Agricultural University, Ludhiana, India
- 2Indian Institute of Science Education and Research, Berhampur, India
The phenomenal increase in the use of nitrogenous fertilizers coupled with poor nitrogen use efficiency is among the most important threats to the environment, economic, and social health. During the last 2 decades, a number of genomic regions associated with nitrogen use efficiency (NUE) and related traits have been reported by different research groups, but none of the stable and major effect QTL have been utilized in the marker-assisted introgression/pyramiding program. Compiling the data available in the literature could be very useful in identifying stable and major effect genomic regions associated with the root and NUE-related trait improving the rice grain yield. In the present study, we performed meta-QTL analysis on 1,330 QTL from 29 studies published in the past 2 decades. A total of 76 MQTL with a stable effect over different genetic backgrounds and environments were identified. The significant reduction in the confidence interval of the MQTL compared to the initial QTL resulted in the identification of annotated and putative candidate genes related to the traits considered in the present study. A hot spot region associated with correlated traits on chr 1, 4, and 8 and candidate genes associated with nitrate transporters, nitrogen content, and ammonium uptake on chromosomes 2, 4, 6, and 8 have been identified. The identified MQTL, putative candidate genes, and their orthologues were validated on our previous studies conducted on rice and wheat. The research-based interventions such as improving nitrogen use efficiency via identification of major genomic regions and candidate genes can be a plausible, simple, and low-cost solution to address the challenges of the crop improvement program.
Introduction
Asian rice (Oryza sativa) is a major cereal crop grown worldwide and an essential food source for over half of the world’s population (Nayar, 2014). The area under rice has continued to grow despite severe unsustainability issues due to national food security concerns and assured procurement on a minimum support price. Nitrogen is the essential macronutrient, and it is considered as the limiting factor for crop productivity. The nitrogen requirement of crops is highly dependent on the exogenous supply of nitrogen (Kraiser et al., 2011). The world’s agriculture is facing new challenges, and the global grain and food security problem persists (Kalugina, 2014). Globally, 119.41 million tons of nitrogen (N) fertilizers are being applied to the cereal crops to achieve the desirable crop yield (FAO, 2018). Rice needs nitrogen during whole stages of growth and development (Cassman et al., 1998; Ye et al., 2019). The rice crop has the lowest NUE among the major cereal crops (Norton et al., 2015). The increasing use of nitrogenous fertilizers for crop production coupled with poor nitrogen use efficiency (NUE) has led to the degradation of soil, water, and environment. The uptake, transport, assimilation/utilization, and remobilization of N are controlled by a complex and interconnected network of genes involved in various biological processes (Kant et al., 2011).
To date, a number of QTLs associated with nitrogen uptake, utilization, and nitrogen use efficiency have been detected in different cereal crop species (Agrama et al., 1999; Gallais and Hirel, 2004; Ribaut et al., 2007; Fontaine et al., 2009; Wei et al., 2012; Hu et al., 2015; Sandhu et al., 2015; Li et al., 2017; Zhou et al., 2017; Pozzo et al., 2018; Van Deynze et al., 2018; Zhang et al., 2019; Brasier et al., 2020). To the best of our knowledge, none of the identified genomic regions have been deployed in the marker-assisted introgression and pyramiding program. The QTL mapping approach generally influenced by the parents is used to develop the mapping population, choice of marker sets, population size and types, and the testing environments (Li et al., 2013; Lei et al., 2018; Zhao et al., 2018). Integrating QTL results from different independent experiments performed on the related cereal crop species provide useful information to study the genetic diversity of loci/alleles underlying the quantitative traits and highlight the potential targets to be further used in molecular breeding or the QTL cloning program.
The efficiency of any genomics-assisted breeding (GAB) program depends upon the consistency of the QTL effect across different genetic backgrounds and multiple environments (Collard and Mackill, 2008). The major effect QTLs which have been consistently reported in various studies in a common genomic region of the chromosome pinpoint its major role in regulating the particular trait to be further used efficiently in the GAB program.
Meta-QTL (MQTL) analysis is the approach to compile the information regarding consensus QTLs for a particular trait and to validate their effect across environments and backgrounds (Goffinet, 2000). Several studies have already been conducted to successfully locate the regions (meta-QTLs) in the genome of multiple crops for multiple traits (Li et al., 2013; Semagn et al., 2013; Acuña-Galindo et al., 2015; Van and McHale, 2017; Zhang et al., 2017; Khahani et al., 2021). The additional advantage of MQTL is the reduction of the confidence interval (CI) of the MQTLs controlling a particular trait of interest and identification of targeted candidate genes, thus improving the genetic resolution of the marker-assisted breeding program (Khahani et al., 2019). So, keeping in line the usefulness of meta-QTL analysis for narrowing down the major target genes, the present study is planned to aggregate all the reported QTLs for nitrogen use efficiency (NUE) and related traits and to fetch out relevant meta-QTL which can be further used in the breeding program with more precise knowledge about the genomic regions that can be targeted for NUE-associated traits in rice.
Materials and Methods
The MQTL analysis for the nitrogen use efficiency (NUE) and related traits in rice was performed in the present study. It involves three main steps in identifying consensus QTLs associated with NUE and their related traits in rice:
1. An extensive bibliographic search of the QTL mapping studies and compilation of the reliable data on QTLs associated with NUE and related traits.
2. Creation of a consensus map on which QTLs of the individual studies were projected.
3. Meta-analysis on the QTL clusters to identify the consensus MQTL.
Bibliographic Search and Data Mining
An extensive bibliographic search on the QTLs associated with the traits controlling NUE and related traits in rice was conducted and retrieved from Google Scholar, PubMed (http://www.ncbi.nlm. nih. gov/pubmed), and Mendeley using appropriate keywords such as the agro-morphological trait, developmental stage, grain yield, nitrogen application, nitrogen use efficiency, nitrogen deficiency, nitrogen uptake, nitrogen utilization, nitrogen remobilization, QTL, root trait, and rice. The literature reports published in journal articles and dissertations from 2000 to 2021 were considered, and all information on QTLs pertaining to nitrogen use efficiency (NUE) and its related traits was compiled for carrying forward the genome-wide meta-QTL analysis. QTL data including details on the parents used to develop the mapping population, type of mapping population (F2; recombinant inbred lines (RILs); backcross population (BC); near isogenic lines (NILs); chromosome segment substitution lines (CSSLs); double haploids (DHs)), size of population assayed, logarithm of the odds (LOD) score, phenotypic variance (R2 or PVE), molecular markers flanking the QTL along with its genetic position (QTL position), and the genetic position of the QTL interval (confidence interval; CI) were compiled. The mid-point position between the two flanking markers was considered as the peak position wherever the information about the peak position was missing. The actual LOD score reported in the study was used, and in case, when the actual LOD score for an individual QTL was not available, a threshold LOD score of 3.0 was chosen for the study. The different QTLs located on the same chromosome were distinguished using the numerical identifiers following the chromosome. After careful examination, 28 relevant studies including 11-BC, 13-RILs, 3-DH, and 1-CSSL with all complete information from the 200 studies searched were compiled (Table 1). The studies that lacked the required data, such as the genetic position, LOD, and phenotypic variance, were excluded from the analysis. The size of the mapping populations ranged from 75 to 611 for BC lines, 101 to 291 for RILs, 113 to 233 for DH, and 247 for CSSL lines. The information on the 33 traits associated with NUE and its related traits was compiled for carrying forward the genome-wide meta-QTL analysis. The 33 traits were accommodated into 11 major trait categories (Table 2). The detailed information on 1,330 QTLs associated with 11 major trait categories including the agricultural nitrogen-absorption efficiency (ANAE)((65 QTLs)); nitrogen content (NC)(118 QTLs); nitrogen use efficiency (NUE)(73 QTLs); photosynthetic rate and chlorophyll content (SPAD) (60 QTLs); nitrogen-related enzymes and amino acids (NEAA) [proline (PRO), free amino acid (FAA), soluble proteins (SP), peroxidases (POD), nitrate reductase (NR), catalase (CAT), glutamine synthetase (GSI), NADH-glutamate synthetase (NGOC)] (53 QTLs); root traits (RT) [root length (RL), root number (RN), root thickness (RT), root dry weight (RDW)] (53 QTLs); plant growth and morphological traits such as plant height (PH) (105 QTLs); shoot dry weight (SDW) (57 QTLs); total dry biomass (TDB) (89 QTLs); leaf number and area (LN and A) (20 QTLs); and grain yield (GY) and yield-related traits [biomass yield (BY), grain weight (GW), harvest index (HI), days to 50% flowering (DTF), tiller number (TN), panicle length (PL), panicle number per plant (PNP), number of grains per panicle (NGP), spikelet fertility (SF), partial factor productivity (PFP)](630 QTLs) were compiled. The compiled information on the 1,330 QTLs associated with the 11 trait categories was subjected to MQTL analysis. The QTLs have been renumbered based on their location on each chromosome.
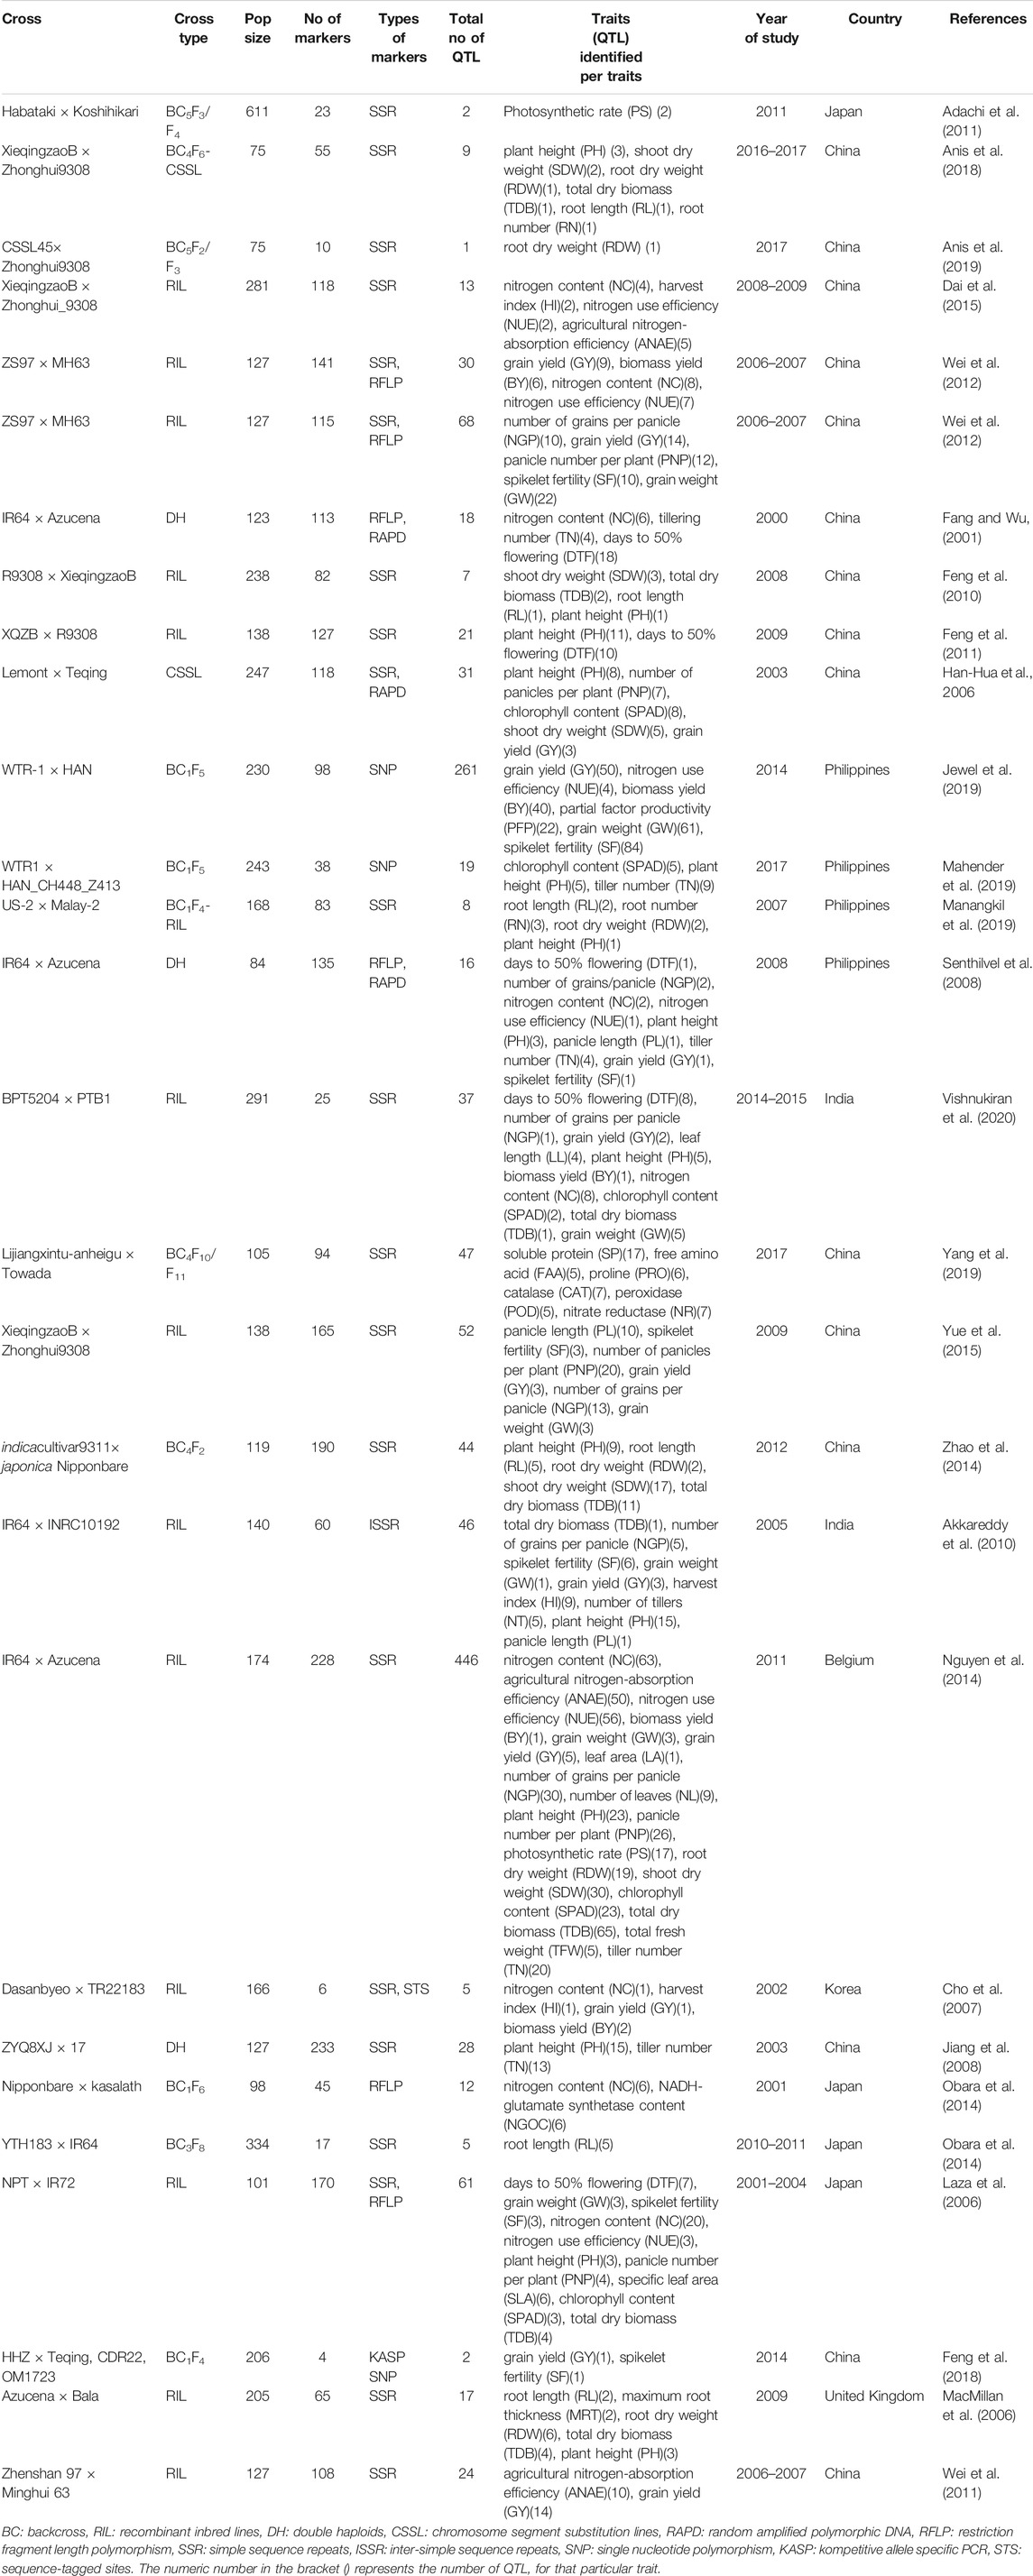
TABLE 1. Summary of the QTL studies used in the QTL meta-analysis for the nitrogen use efficiency and related traits in rice.
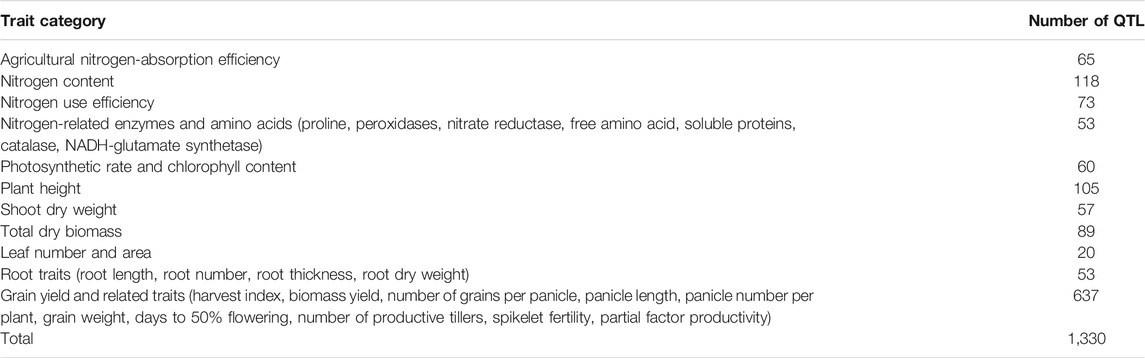
TABLE 2. The trait category and number of QTL compiled per category in the QTL meta-analysis for the nitrogen use efficiency and related traits in rice.
QTL Projection and Development of the Consensus Map
To construct a consensus map, the LPmerge tool in the R package was employed (Endelman and Plomion, 2014) where the maps with the markers and QTLs were iteratively projected on a composite reference map (integrated rice genetic linkage maps). The reference maps used were those from Orjuela et al. (2010), Supplementary table 18 from GRAMENE (https://archive.gramene.org (International Rice Genome Sequencing Project, 2005), Cornell SSR 2001, and IRMI-2003 (https://archive.gramene.org). It is based on the common marker between the original map and reference map by means of a homothetic function described by Chardon et al. (2004). Any marker that did not comply (inverted) in terms of linkage was automatically discarded. After the integration of all the maps, the consensus map contained 21,280 markers, including SSR, RFLP, AFLP, SNP markers, and genes. The total number of markers discarded was 560 markers. The consensus map covered a total length of 1821 cM, with an average distance of 3.5 cM between markers. Only 1,330 QTLs from the 2,763 available QTLs associated with the 11 trait categories with complete information (estimated CIs, original LOD scores, peak positions, and phenotypic variance) required for the QTL projection were used for projection on the consensus map using BioMercator V4.2 (Sosnowski et al., 2012) (Table 2).
Meta-QTL Analysis
Following projection, the meta-QTL analysis was performed, for each chromosome individually following the Veyrieras et al. (2007) two-step algorithm available in the software BioMercator V4.2. The Akaike (AIC) statistics values were used to find the best QTL model for determining the actual number of MQTLs on each of the rice chromosome. The detailed statistical procedures and the algorithms used in this software have been well-described in the study by Sosnowski et al. (2012). The first step involved the use of five different models based on the presence of 1, 2, 3, 4, or N real QTL. The best model was selected using Akaike (AIC) statistics. The second step involved setting up the suitable parameters for further analysis. The parameters used were the actual number of MQTLs or the real QTL to be mapped on the concerned chromosome. The phenotypic variance and LOD values of the MQTLs were calculated as the averages of the phenotypic variance and LOD values of the QTLs involved.
Functional Analysis and Identification of Nitrogen Use Efficiency–Associated Candidate Genes
The selected 42 meta-QTL regions possessing QTLs with average phenotypic variance >8%, average LOD >4, and the involvement of ≥10 initial QTLs within the MQTL were subjected to the functional analysis to identify candidate genes related to the traits associated with nitrogen use efficiency in rice. First, genetic markers flanking the confidence intervals of each rice MQTL (rMQTL) were selected, and their physical positions on respective chromosomes were obtained from the Gramene database (www.gramene.org), or gene models present within the original or estimated physical regions were retrieved using the “BioMart” of the Ensembl Plants database. All the genes physically located within or near each rice MQTL region were considered as candidate genes and retrieved from the Rice Annotation Project Database (RAPDB) (http://rapdb.dna.affrc.go.jp) as batch download, or the primer sequence of the marker is subjected to nucleotide blast in NCBI (https://blast.ncbi.nlm.nih.gov/Blast.cgi?PROGRAM=blastn) to identify the range of the sequence in the reference genome of Nipponbare using RAP and Build 5 (www.rapdatabase.org). It is assumed that the genes identified in Nipponbare regions are homologous and collinear to those underlying the nitrogen use efficiency and associated QTLs mapped in different studies involving different donor wild species and recipients. The functional annotations of the identified gene models were explored for the best candidate genes within each MQTL. All genes with the gene ontology (GO) term or description related to NUE, nitrogen uptake, its assimilation, and all related traits were filtered and considered as candidate genes (CGs). The QTLs associated with nitrogen use efficiency and related traits identified previously by Sandhu et al. (2015), Sandhu et al. (2016), Sandhu et al. (2019), Subedi et al. (2019), and Sandhu et al. (2021) were projected on the MQTLs identified in the present study to find consistency in the genomic regions.
Rice MQTL Regions Homologous to the Other Cereals
Additionally, to evaluate transferability of information to other cereals, ortho-MQTLs were investigated based on the genomic collinearity between rice–maize, rice–wheat, and rice–barley. The information on maize, wheat, and barley genes associated with NUE and related traits was collected from the available literature and used for the retrieval of corresponding protein sequences for the identification of homologous MQTL genomic regions. The amino acid sequences for the relevant genes were then retrieved from NCBI https://www.ncbi.nlm.nih.gov/) and used for BLASTP search to identify the rice protein (available in Ensembl Plants) at an E-value of <10–10, with 60% coverage, and >60% identity. The physical positions of the corresponding genes and rice MQTLs were then compared to detect the MQTL regions homologous to known genes in other cereals.
To detect the ortho-MQTLs between rice and maize, rice and wheat, and rice and barley syntenic regions between the two respective species were identified by using the Ensembl Plants database.
The distribution of the aforementioned factors, number of MQTL related to nitrogen use efficiency and all related traits, and candidate genes underlying MQTL over the rice genome were shown by using Circos (Krzywinski et al., 2009).
Development of the Validation Panel to Check the Efficacy of the Identified MQTL and Candidate Genes.
The information on the marker trait associated with root traits improving nitrogen use efficiency and grain yield/yield-related traits in rice (Sandhu et al., 2015; Sandhu et al., 2019; Subedi et al., 2019) and wheat (Kumar et al., 2021; Sandhu et al., 2021) was collected from our previous studies. The information on the nitrate transporter gene in wheat and rice was collected from the Ensembl Plants database. To check the nitrogen responsiveness of candidate genes, the expression data of all the candidate genes were downloaded from the RiceXPro database. Specifically, root gene expression profiles in response to nitrogen were considered. The dataset RXP_5002, which contained microarray-based expression data of 7-day-old seedlings exposed to nitrogen deficiency treatments and control conditions, was analyzed.
Results
Salient Features of the QTL Studies
In order to identify the consensus genomic regions associated with the 33 nitrogen use efficiency and related traits, we compiled the information on a total of 1,330 QTLs derived from 28 relevant studies including 11-BC, 13-RILs, 3-DH, and 1-CSSL with the population size that ranged from 75 to 611 reported between 2001 and 2021. All the 33 traits were grouped into 11 main trait categories (Table 2). The 1,330 QTLs were distributed across all 12 chromosomes (chr) of rice (Figure 1A). The chr 1 and 3 harbored the maximum number of QTL (172 QTL) for all the studied traits followed by chr 2 (145 QTL) and chr 5 (126 QTL). The chr 12 harbored the lowest number of QTL (68 QTL). Among the studied trait category, GY and related trait categories had the highest number of QTL with 630 QTLs followed by 118 QTLs for nitrogen content and 105 QTLs for plant height. The phenotypic variance of the individual QTLs ranged from 1.9 to 66.9%, with an average of 17.43%. The frequency distribution of the QTL with different levels of phenotypic variation explained is presented in Figure 1B. The LOD value of the individual QTL ranged from 2.02 to 28.7 with an average of 4.77.
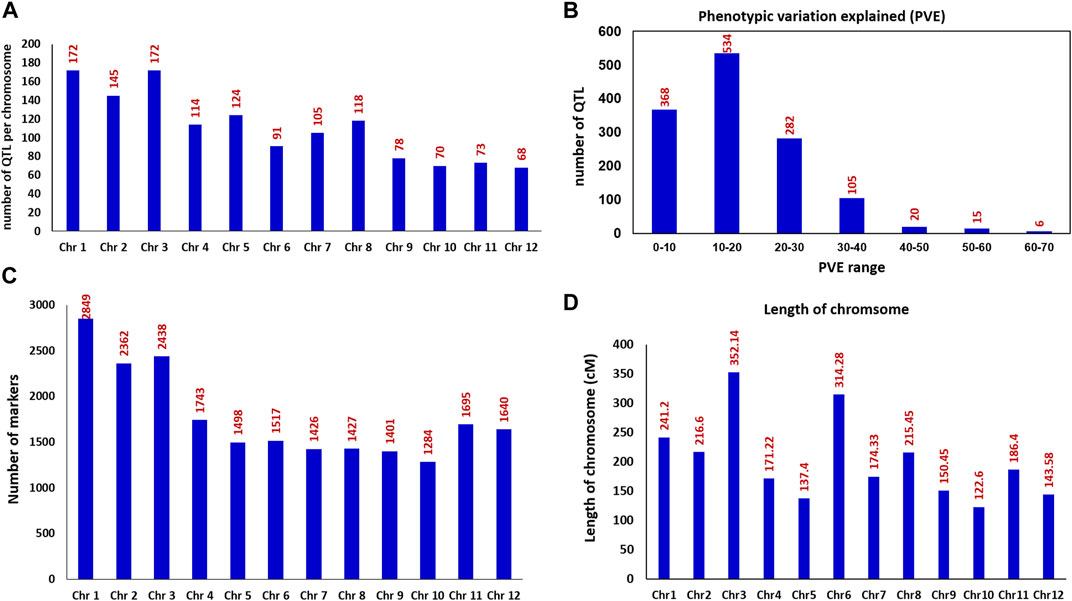
FIGURE 1. Frequencies of QTL and details on the mapped markers used for the identification of MQTLs in rice (A) Number of QTLs present on the 12 rice chromosomes (B) Frequencies of the QTL with different levels of phenotypic variation explained (PVE%) (C) Frequencies of the mapped markers on each of the 12 rice chromosomes (D) Length/size of the rice genetic map in cM (centimorgan) across 12 chromosomes.
Rice Consensus Map
The rice consensus genetic map included a total of 22,280 markers (Figure 1C) covering a total length of 2425.65 cM, thus giving a density of 8.77 markers/cM for the whole rice genome. The size of the rice genetic map for an individual chr ranged from 122.60 cM (chr 10) to 352.14 cM (chr 3) (Figure 1D), and the number of markers on an individual chr ranged from 1,284 on chr 10 to 2849 on chr 1. The marker density on individual chr varied from 4.83 markers/cM for chr 6 to 11.81 markers/cM for chr 1.
MQTLs Detected for Grain Yield/Related Traits and Nitrogen Content/Nitrogen Use Efficiency
Only 915 QTLs from the 1,330 available QTLs could be used for successful projection onto the consensus map; the remaining 415 QTLs could not be projected as either the associated markers were absent in the consensus map, or they had comparatively low PVE values and/or a large confidence interval. The MQTL analysis significantly summarized the total number of projected QTLs from 915 to 76 MQTLs (8.3%) (Table 3). The number of MQTLs per rice chromosome ranged from three (chr 1) to nine (chr 3) with an average of 6.33 MQTLs per chromosome. The 76 MQTLs involving 636 QTLs were identified using the MQTL analysis. The remaining 279 QTLs could not be assigned to any of the identified MQTL since they either lacked the common markers between the consensus map and initial maps or the QTL had a relatively low phenotypic variance or LOD value and/or a large confidence interval.
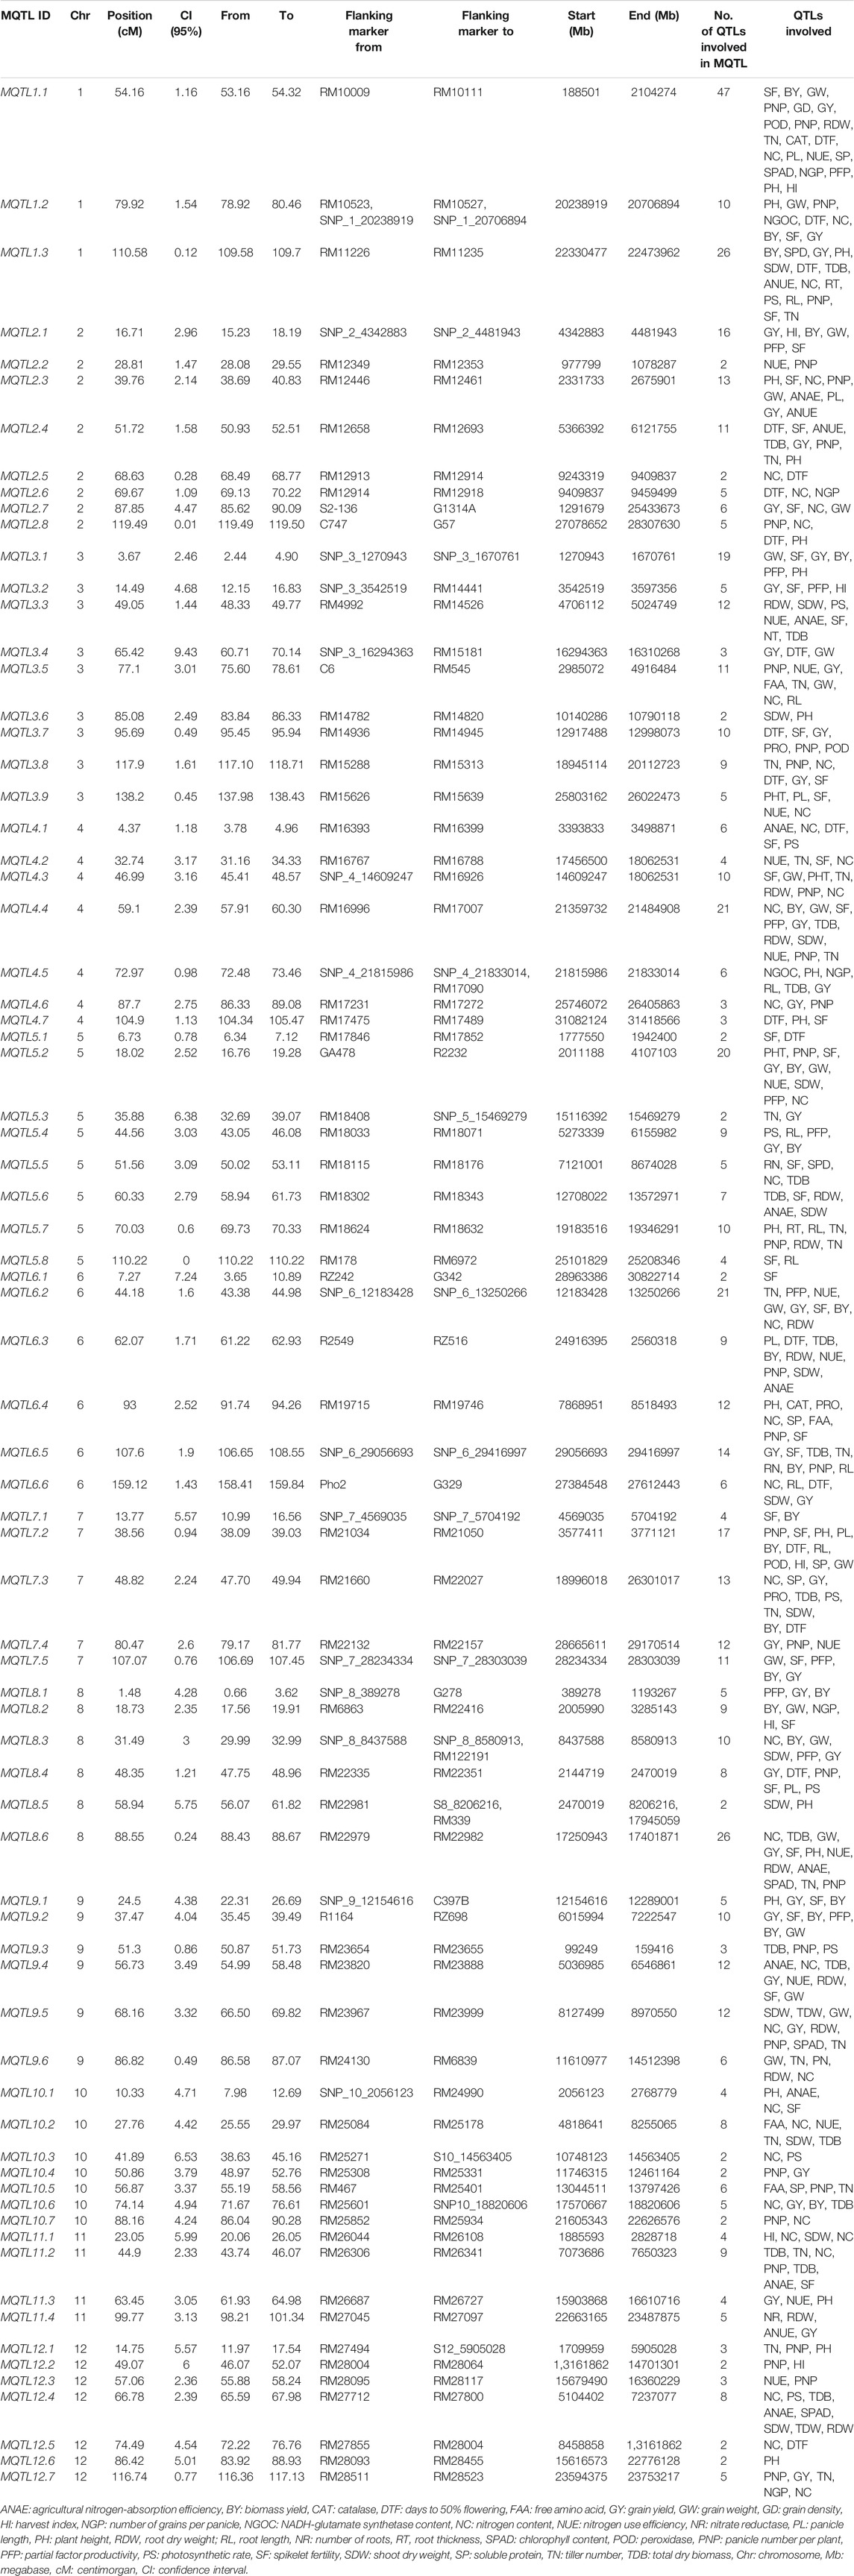
TABLE 3. Summary of the detected MQTLs for the nitrogen use efficiency and related traits in rice.
The phenotypic variance of the detected MQTL ranged from 8.14 to 21.16, and the LOD ranged from 3.29 to 9.47. The confidence interval of the MQTLs, on an average, was reduced 5.24-fold relative to the confidence intervals of the QTLs used in the present study. The average confidence interval of the QTL used in the present study ranged from 8.72 to 20.20 cM with an average confidence interval of 12.26 cM. The frequencies of QTL with different sizes of confidence interval (in cM) are presented in Figure 2A. The average confidence interval of the MQTLs detected in the present study varied from 0.94 to 4.57 cM with an average confidence interval of 2.73. The average reduction in the size of the confidence interval for individual MQTLs was as high as 13.3-fold for chromosome 1 and 8.95-fold for chromosome 2, and as low as 2.9-fold for chromosome 10 and 2.55-fold for chromosome 12 (Figure 2B).
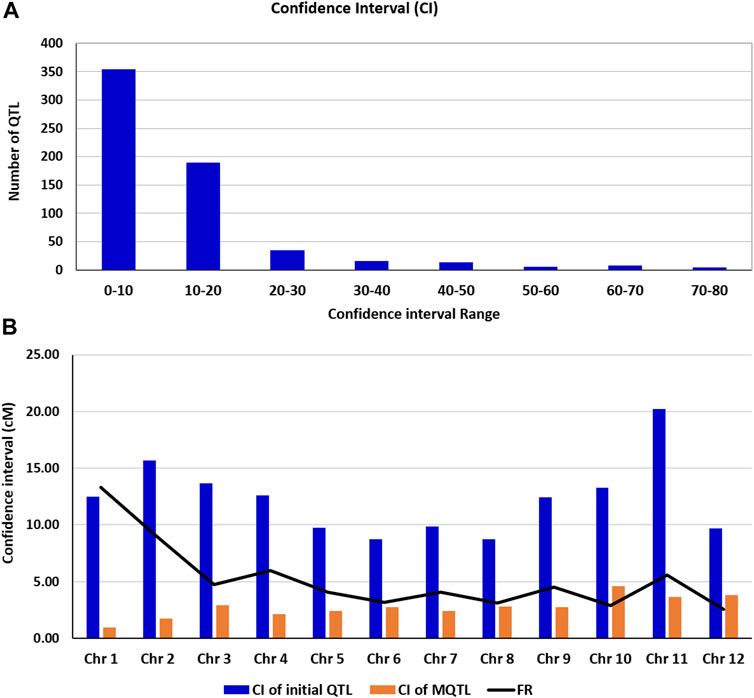
FIGURE 2. (A) Frequencies of QTL with different sizes of confidence interval (in cM) (B) (b) Comparison of confidence intervals (CIs) of the QTL and those of meta-QTL (MQTL), showing the fold level of reduction (FR) in the size of CI.
Each of the individual MQTL differed for the number of traits controlling the MQTL (Table 3). The association of MQTL with traits varied from a single trait for MQTL6.1 and MQTL12.6 to 21 traits for MQTL1.1. The 20 MQTLs out of 76 detected MQTLs were reported to be associated with more than 10 traits (Table 3). The 55 MQTLs were reported to be associated with nitrogen use efficiency–related traits, root traits, and grain yield/yield-related traits (Table 3). The major colocation of genomic regions associated with root traits improving the nitrogen use efficiency and grain yield/related traits was observed on chr 2, 3, 4, 5, 6, and 10 (Table 3). The MQTL analysis for the 630 QTLs associated with the grain yield and yield-related traits indicates the presence of MQTL for yield and related traits in the same genomic region (Supplementary Table S1). A total of 11 MQTLs (MQTLYRT1.3 on chr 1, MQTLYRT2.1 and MQTLYRT2.4 on chr 2, MQTLYRT3.4 and MQTLYRT3.5 on chr 3, MQTLYRT4.3 on chr 4, MQTLYRT5.2 on chr 5, MQTLYRT6.5 on chr 6, MQTLYRT7.2 on chr 7, and MQTLYRT8.2 and MQTLYRT8.4 on chr 8) were observed to be associated with more than 6 yield and yield-related traits (Supplementary Table S1). The 13 MQTLs (MQTLN&R1.1 on chr 1; MQTLN&R2.4 on chr 2; MQTLN&R3.1 and MQTLN&R3.2 on chr 3; MQTLN&R4.3, MQTLN&R4.4, and MQTLN&R4.5 on chr 4; MQTLN&R5.2 and MQTLN&R5.3 on chr 5; MQTLN&R6.1 and MQTLN&R6.9 on chr 6; MQTLN&R7.4 on chr 7; and MQTLN&R11.4 on chr 11) showed association with the root traits improving nitrogen use efficiency in rice (Supplementary Table S2). The 15 MQTLs were solely associated with nitrogen use efficiency in rice (Supplementary Table S2).
Identification of Candidate Genes and Orthologues
The 76 MQTLs reported in the present study were used for further selection of some of the promising MQTLs using the criteria; average phenotypic variance >8%, average LOD >4, and the involvement of ≥10 initial QTLs within the MQTL. This screening of MQTL resulted in the selection of 42 promising MQTLs (Supplementary Table S3), which was further used for the identification of candidate genes and orthologues in other crops such as wheat, barley, and maize.
A total of 2665 genes were present in the genomic region constituting the 42 promising MQTLs (Supplementary Table S4). A total of 158 candidate genes associated with plant growth and development, amino acid biosynthesis, nitrogen assimilation and transport, and stress resistance/tolerance were chosen (Supplementary Table S5) to identify the orthologues in barley, maize, and wheat. Out of the 158 candidate genes, 39 candidate genes showed no syntenic relationship with any of the three genomes i.e., barley, maize, and wheat. The 109, 104, and 94 of these 158 rice candidate genes could be utilized to identify the 376 wheat orthologues, 149 maize orthologues, and 109 barley orthologues, respectively, in the MQTL region (Supplementary Table S6).
Collinearity Within the Rice Genome and Synteny With Other Genomes
The investigation of collinear genomic regions within the rice genome resulted in the identification of duplicated regions containing the MQTLs associated with the same traits. The candidate genes underlying MQTL7.4 and MQTL9.6 were reported to be associated with the cellular response to nitrate, and MQTL1.2 and MQTL5.2, with nutrient reservoir activity (Supplementary Table S6). The candidate genes in the genomic region of MQTLs on chr 3, 5, 6, 7, 8, 10, 11, and 12 were observed to be associated with the transmembrane transport activity (Supplementary Table S6). The collinearity in the genomic region on chr 1,5; chr 2,3; chr 3,6; chr 3, 7; chr 4, 6; chr 5, 6; chr 5, 7; chr 6,9; and chr 7,9 was observed (Supplementary Table S6). The MQTLs associated with the nitrogen content, root traits, and grain yield such as MQTL1.1 and MQTL1.3 on chr 1; MQTL3.3 and MQTL3.5 on chr 3; MQTL4.3 and MQTL4.5 on chr 4; MQTL5.5 on chr 5; MQTL6.2 and MQTL6.3 on chr 6; MQTL7.2 on chr 7; MQTL8.6 on chr 8; MQTL9.4, MQTL9.5, and MQTL9.6 on chr 9; and MQTL11.4 on chr 11 were co-located in the rice genome duplicated regions (Figure 3). The already reported genes have been investigated in the MQTL region using the Q-TARO database. The MQTL1.1 comprises the OsDET1 gene associated with photosynthetic capacity, sui1 gene with plant height, and AIP1 gene with root hair development; MQTL2.7 comprises the GW2 gene associated with grain weight and size and OsNAR2.1 gene associated with nitrogen uptake; MQTL3.5 comprises the OsMDP1 gene associated with root elongation; MQTL4.6 comprises the OsAMT1;1 gene associated with ammonium uptake; and MQTL12.6 comprises the kch1 gene associated with coleoptile elongation (Supplementary Table S7).
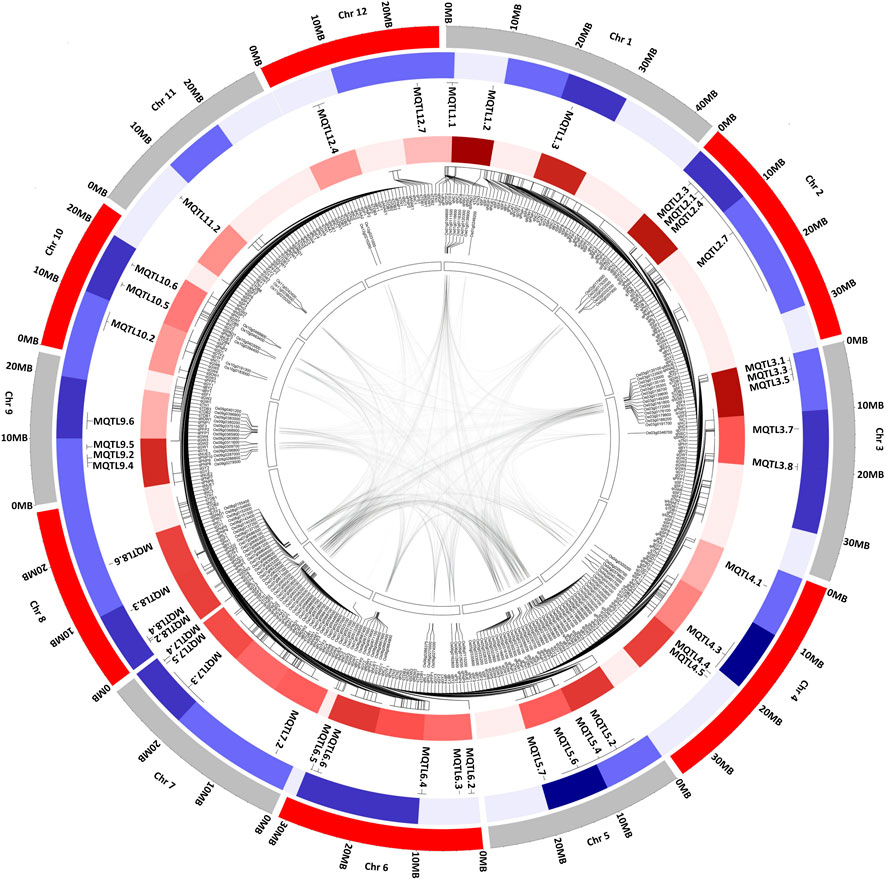
FIGURE 3. Schematic representation of the distribution pattern of identified MQTL, QTL, and candidate genes on rice chromosomes. From the center of the plot moving to the outer circle (1) The innermost circle representing the collinearity within the rice genome (2) Candidate genes identified in the major MQTL region (3)(query) QTL density in the MQTL region (4) MQTLs associated with nitrogen use efficiency and related traits (5) Outermost circle represents the rice genome in MB. The color density indicates the number of MQTL detected and number of QTLs present in the MQTL region. The denser color indicates a greater number of MQTL or QTL within the MQTL region.
The syntenic relationship was observed for rice candidate genes present in the MQTL region with the wheat, maize, and barley genome (Supplementary Table S8). The comparison of rice genome with wheat (Figure 4A), maize (Figure 4B), and barley (Figure 4C) genomes suggested that most of the orthologues were retained during evolution.

FIGURE 4. Syntenic relationship of rice candidate genes present in the MQTL region with the (A) wheat, (B) maize, and (C) barley genome.
Checking the Efficacy of MQTL
To check the efficacy of identified MQTL and candidate genes underlying MQTL, a validation panel of the marker-trait association identified in our previous study (Sandhu et al., 2015; Sandhu et al., 2019; Subedi et al., 2019) in rice and wheat (Sandhu et al., 2021) and nitrate transporters reported in rice was made. The identification of previously identified marker-trait associations associated with the nitrogen use efficiency–related traits in rice and nitrate transporter genes in close proximity to the MQTL and candidate genes reported in the present study indicated the robustness of the reported MQTL. The marker-trait association associated with the root traits (root hair length and root hair density) improving nutrient uptake (nitrogen and phosphorus) was reported to be collocated or in close proximity to the nitrogen transporter genes and candidate genes identified in the present study on chr 2, 5, and 6 (Figure 5). The marker-trait associations associated with grain yield/yield-related traits and plant morphological traits reported in our previous studies were present in the MQTL region reported in the present study. Similarly, the wheat orthologues were present in close proximity to the marker-trait association and nitrate transporter genes identified in our previous study (Kumar et al., 2021; Sandhu et al., 2021) (Figure 6). The identified 20 candidate genes in wheat are nitrogen transporters.
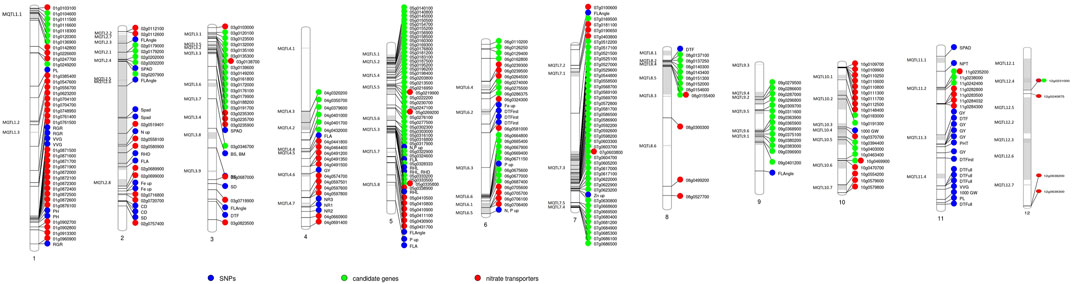
FIGURE 5. Schematic representation of the distribution of previously reported single nucleotide polymorphism (SNP) associated with traits of interest, candidate genes reported in the present study, and the nitrate transporter along the 7 chromosomes of rice. The chromosome map showing MQTL identified in the present study and their co-location with the previously reported single nucleotide polymorphism (SNP) associated with different nitrogen use efficiency (NUE)–related trait, root traits, yield, and yield-related traits (Sandhu et al., 2015; Sandhu et al., 2019; Subedi et al., 2019), candidate genes reported in the present study, and the nitrate transporter reported in rice. The numbers below each rice chromosome indicate chromosome numbers.
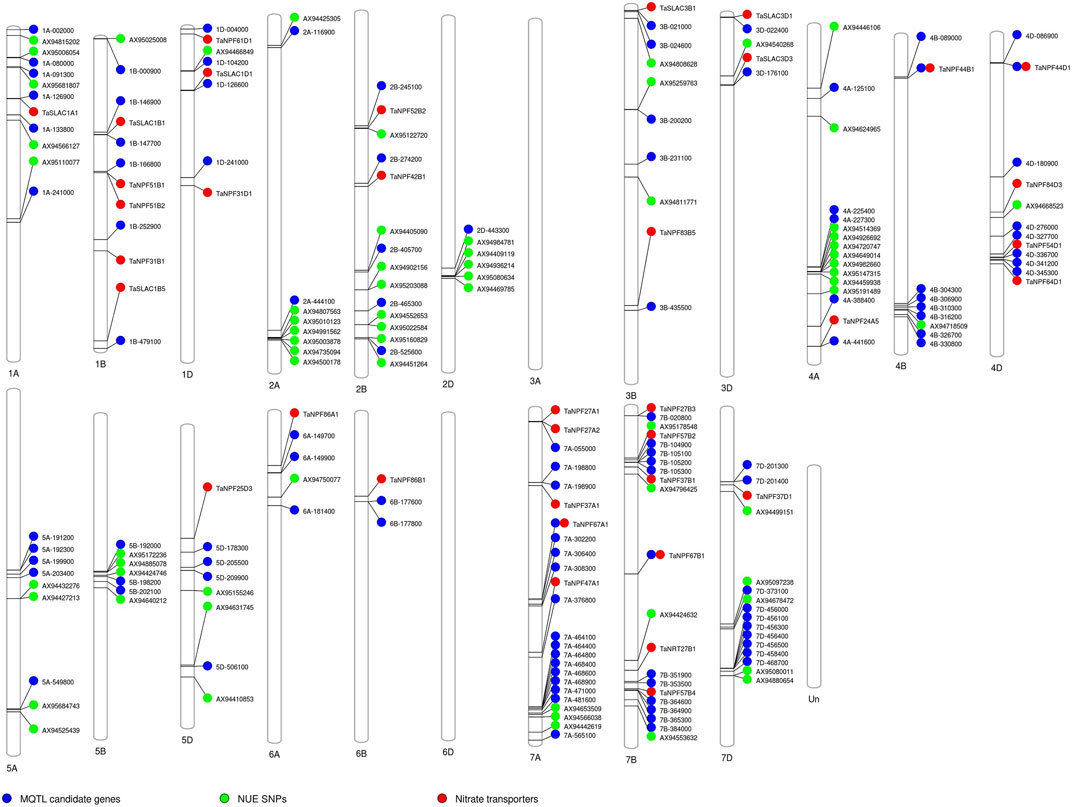
FIGURE 6. Schematic representation of the distribution of previously reported single nucleotide polymorphism (SNP) associated with traits of interest, candidate genes reported in the present study, and the nitrate transporter along the 21 chromosomes of wheat. The chromosome map showing the candidate genes reported in the present study in the MQTL gene based on the synteny and their co-location with the previously reported single nucleotide polymorphism (SNP) associated with different nitrogen use efficiency (NUE)–related trait, root traits, yield, and yield-related traits (Sandhu et al., 2021), and the nitrate transporter reported in wheat (Kumar et al., 2021). The numbers below each rice chromosome indicate chromosome numbers.
Expression Profiles of Candidate Genes
To identify the target genes for NUE, we analyzed the expression data of all 158 candidate genes identified in this study. We studied the response of candidate genes against nitrogen deficiency in the microarray-based expression dataset from the RiceXPro database. Of all the 158 candidate genes, 15 genes were selected which showed significant changes in expression values in response to nitrogen deficiencies in roots (Table 4). Twelve out of 15 genes showed upregulation in response to nitrogen deficiency, while three genes were downregulated (Figure 7). Eight genes out of twelve were upregulated in both 6 and 24 h after treatment in comparison to control. These genes consisted of glutamine amidotransferase, OsVIT2, PLA1, GL7, ERF transcription factor (Sub1C), CEF1, HD zip TF (Oshox14), and TGF beta receptor (Table 4). Three genes (OsWRKY67, acid phosphatase, and OsABCG12) showed a similar expression to control at 6 h after treatment, but their expression increased at 24 h. Meanwhile, one gene showed more expression at 6 h after treatment, but its expression was similar to control at 24 h after treatment (Figure 7). Three genes showed similar expressions at 6 h after treatment, but their expression decreased significantly after 24 h in comparison to control (Figure 7). These genes consisted of EF1(B type response regulator), DIP3 (glycosyl hydrolase family 18), and OsGZF1 (Zn finger CCCH domain containing protein) (Table 4). There were 5 genes that had multiple transcripts or splice variants, but no variation was detected between transcripts of the same gene.
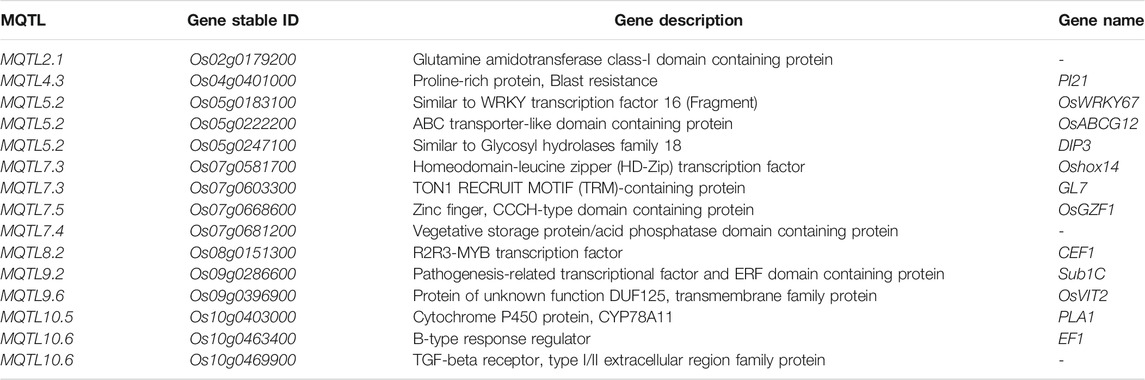
TABLE 4. Selected 15 candidate genes showing response to nitrogen treatment.
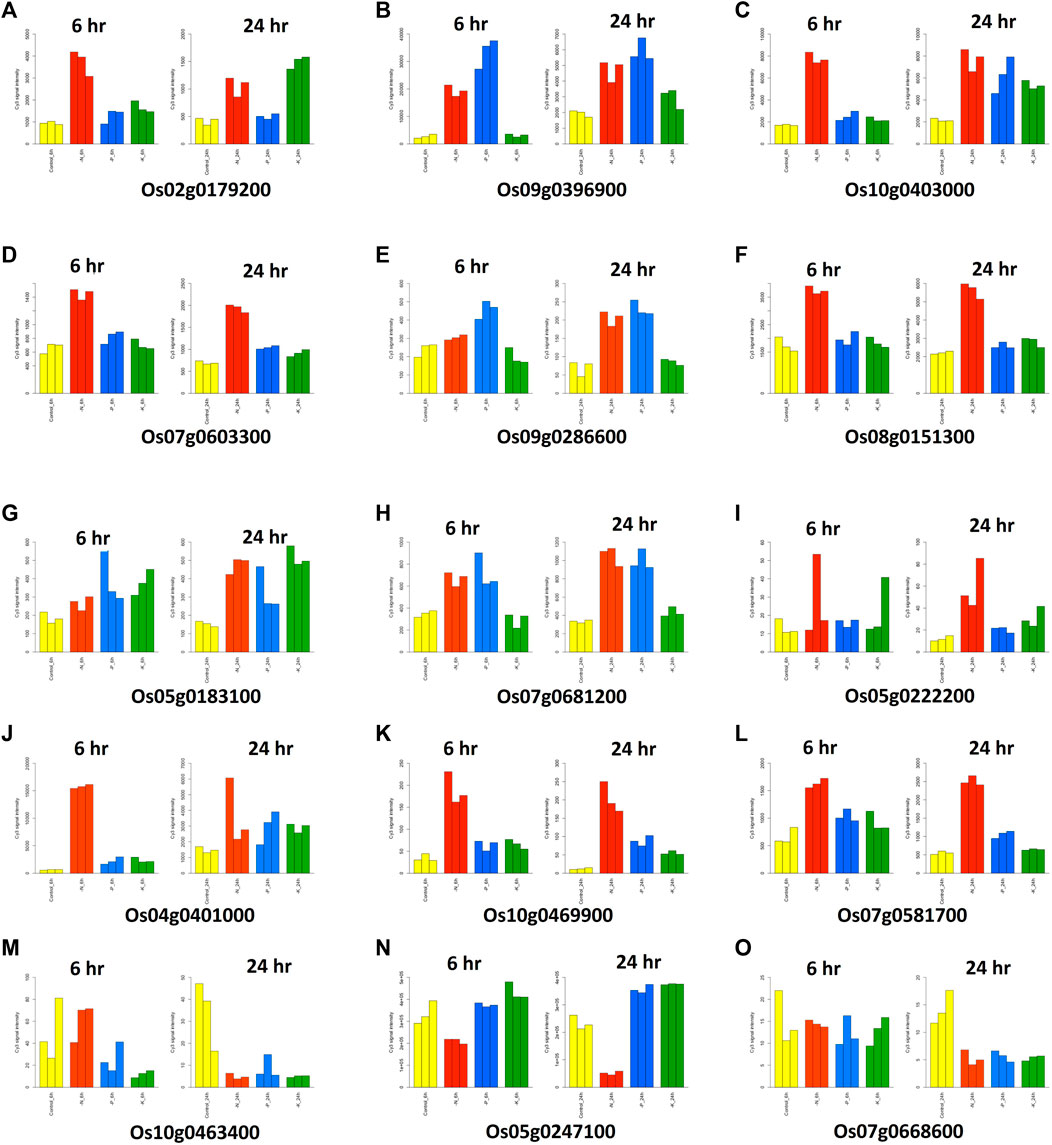
FIGURE 7. Graphical representation of the significant changes in expression values of the candidate genes in response to nitrogen deficiencies in roots.
Discussion
Among all the plant nutrients basic for crop development, N is the nutrient limiting the crop productivity. Overabundance use of nitrogenous fertilizers creates imbalance in ecosystem function and services (Fowler et al., 2013). There is a strong requirement to enhance nitrogen use efficiency for the sustainable agriculture production (Paul et al., 2014). The identification of genomic regions associated with traits of interest using molecular markers is an accurate and useful approach in the marker-assisted breeding program (Ashikari and Matsuoka, 2006; Price, 2006). The complex nature of the QTL and their interaction with other QTLs, genetic background, and environment are some of the important constraints in identifying their precise location. The identification of a major effect and consistent QTL across different genetic backgrounds and environments is an important requirement for the precise use of the identified genomic regions in marker-assisted selection.
The meta-analysis of the genomic regions reported in different studies helps in identification of most accurate and confined genomic regions to be further used in the marker-assisted introgression program. The trait NUE is not a biological measure by itself; it is a complex derivative of biological measures such as the grain yield/related traits and nitrogen response. A number of studies reported QTL associated with NUE in rice (Anis et al., 2019; Jewel et al., 2019; Mahender et al., 2019; Zhang et al., 2019). To the best of our knowledge, many QTLs involved in the NUE were reported separately, but a comprehensive listing and analysis of the genomic region associated with the grain yield and nitrogen use efficiency were not available. In the present study, the meta-QTL analysis was performed to identify the consistent and major effect QTL associated with nitrogen use efficiency in rice.
The present study explored 1,330 QTLs associated with NUE and related traits in rice and identified a total of 76 MQTLs, suggesting the power of MQTL analysis in narrowing down the genomic regions controlling the different traits of interest (Khahani et al., 2020). The number of available QTLs that we listed here was 1,330 QTLs of which 915 major QTLs were used for the identification of as many as 76 MQTLs, suggesting that to the best of our knowledge, the present study is so far the most comprehensive study for the identification of NUE-associated MQTLs in rice. The first attempt to map the genomic region associated with NUE and related traits was initiated at IRRI. The distribution of the QTL on different rice chromosomes with the highest number of QTL on chr 1 and 3 was similar to that of the previous reports (Swamy et al., 2011; Swamy and Sarla, 2011; Khahani et al., 2020). Some of the MQTLs identified in the present study constituted as high as 47 initial QTLs per MQTL (MQTL1.1), indicating the robustness of the detected MQTL. The consensus map developed in the present study is much informative relative to those prepared and used in the earlier studies for the identification of MQTL associated with the traits (Courtois et al., 2009; Swamy et al., 2011; Khahani et al., 2021; Kumari et al., 2021). The fold reduction in the size of the confidence interval of the MQTL detected in the present study is in contrast to those reported in the previous studies (Courtois et al., 2009; Danan et al., 2011). The reduction in the confidence interval allows for the exploration of most promising and less number of candidate genes per MQTL.
Here, we ran the MQTL analysis separately for the grain yield/yield-related traits and nitrogen use efficiency–related traits also to identify the major and consistent genomic regions associated solely with the trait. However, it is more effective and robust to pool different correlated traits measured in the same population (Goffinet and Gerber, 2000), assuming that a number of traits studied are pleiotropically related. The analysis of pooled correlated traits may be more powerful than the analysis of an individual trait ensuring better coverage of the genome than the single trait analysis. This enabled us to identify the stable QTL and “hotspots” for the NUE-related traits in rice across different genetic and environmental backgrounds to be further used in the marker-assisted introgression program.
Our approach of using all correlated traits altogether in the MQTL analysis in the present study was more robust, not only because we used all correlated traits but also we targeted only the genomic region (phenotypic variance >8) associated with NUE-related traits to shortlist the target genes. The co-location of root traits improving NUE and yield/yield-related traits in the duplicated region of the rice genome might be useful in identification of promising candidate genes controlling the traits of interest. The MQTLs reported in the present study showed a positive effect on the grain yield/yield-related traits, root traits improving nutrient uptake, NUE, and related traits. The presence of candidate genes Os02g0207900 (MQTL2.4), Os04g0379600 (MQTL4.3), Os06g0286375 (MQTL6.4), and Os08g0155400 (MQTL8.2) encoded nitrate transporters, suggesting the efficacy of the detected MQTL. The MQTL on chr 1, 4, and 8 reported as a hotspot with 21, 12, and 12 yield/yield-related and NUE-related traits, respectively. The MQTL on chr 2 and 6 constituting genes associated with the nitrate/ammonium uptake/content (OsNAR2.1, OsAMT1;1, OsPTR9, OsAAT49) (Yan et al., 2011; Lu et al., 2012; Fang et al., 2013; Ranathunge et al., 2014). The identification of genes encoding the nitrate transporter may be very useful to target for improving nitrogen use efficiency under direct seeded cultivation conditions where the soil conditions are dry and nitrate is the major source of nitrogen. Various other reported genes and candidate genes associated with the floral organ development, grain size, grain weight, fertility, and root development have been found in the MQTL region detected in the present study (Supplementary Tables S7, S8, S9).
The rice genomic region subtending the MQTL4.3 (Os04g0379600) and MQTL8.2 (Os08g0155400) harbor the candidate genes encoding nitrate transporters; we identified the orthologue of these genes in wheat (Os04g0379600: TraesCS2D02G279200, TraesCS2A02G280400, TraesCS2B02G297700; Os08g0155400: TraesCS7B02G201900, TraesCS7A02G301700, TraesCS7D02G297000), maize (Os04g0379600: Zm00001eb085850; Os08g0155400: Zm00001eb416090), and barley (Os08g0155400: HORVU7Hr1G071600). The other genes associated with nitrogen uptake/transport/assimilation, amino acid synthesis/transport, protein synthesis/transport/phosphorylation in the MQTL region, and their orthologues in wheat, maize, and barley have been reported in the present study (Supplementary Tables S7, S8), providing a better understanding of candidate genes controlling NUE with a similar evolutionary background and conserved the function between different cereal crops. The root-specific expression of the candidate genes was identified in the MQTL region under the nitrogen-deficit condition, suggesting the role of root traits in improving NUE in plants. The identification of nitrate transporter genes and previously identified marker-trait associations in rice and wheat (Sandhu et al., 2015; Sandhu et al., 2019; Subedi et al., 2019; Kumar et al., 2021; Sandhu et al., 2021) in close proximity to the MQTL/candidate genes/their orthologues associated with the NUE-related traits in the present study validates the efficacy of the reported MQTL. The 76 MQTLs reported in the present study were used for a further selection of some of the promising MQTL using the criteria; average phenotypic variance >10%, average LOD >4, and the involvement of ≥10 initial QTLs within the MQTL. Furthermore, the MQTLs were screened on the basis of phenotypic variance, LOD, and number of QTL in the MQTL region and resulted in the selection of 42 promising MQTLs, which were further used for the identification of candidate genes and expression studies. Once validated, the identified 15 target genes for NUE in the MQTL present on chromosomes 2,4,5,7,8,9, and 10 (Table 4) may be targeted for identification of donors possessing candidate genes and for marker development for further deployment in the marker-assisted breeding program.
Conclusions
NUE is a quantitative trait controlled by multiple genes and the co-localization of genomic regions associated with yield/yield-related traits and root traits improving NUE providing key candidate genes for the rice crop improvement. The MQTL analysis approach is used in the present study overcoming the limitation of QTL mapping while felicitating identification of robust markers and fine-mapped genomic regions to be further used in the marker-assisted introgression program. The present study identified 76 MQTLs associated with NUE and related traits in rice. The study also verified the evolutionary relationship of cereal crops through the mining of orthologues using the ortho-MQTL approach. The results reported in the present study will be applicable to improve the selection for the yield/yield-related traits and root traits improving nitrogen use efficiency in rice-breeding programs. The detailed crosstalk between the genome and proteome and the validation of identified putative candidate genes in the MQTL region through gene expression and gene editing studies may lay down the foundation to improve the nitrogen use efficiency of cereal crops.
Data Availability Statement
The original contributions presented in the study are included in the article/Supplementary Material, further inquiries can be directed to the corresponding author.
Author Contributions
NS designed this study and wrote the manuscript. GP, OP, and MPS collected the literature and performed the MQTL analysis. KR helped in collecting information on candidate genes in the MQTL region. NS, GP, and KP performed ortho-MQTL analysis. NS and AK worked on the identification of nitrate transporters and checked the efficacy of identified MQTL. MS helped in drafting the introduction section of the manuscript. MPS helped in drafting the material and methods section of the manuscript. GP, JS, and PA helped in the circos plot. DKS provided guidance in the MQTL analysis. All authors contributed to the manuscript and approved the submitted version.
Funding
The work was compiled under the projects funded by the Department of Biotechnology, Govt. of India (Grant Nos. BT/PR30871/BIC/101/1159/2018 and BT/PR31462/ATGC/127/6/2019) and GCRF Global Research Translation Awards, UKRI, United Kingdom.
Conflict of Interest
The authors declare that the research was conducted in the absence of any commercial or financial relationships that could be construed as a potential conflict of interest.
Publisher’s Note
All claims expressed in this article are solely those of the authors and do not necessarily represent those of their affiliated organizations, or those of the publisher, the editors, and the reviewers. Any product that may be evaluated in this article, or claim that may be made by its manufacturer, is not guaranteed or endorsed by the publisher.
Acknowledgments
We are thankful to the Department of Biotechnology, Govt. of India, and GCRF Global Research Translation Awards, UKRI, United Kingdom, for providing grants.
Supplementary Material
The Supplementary Material for this article can be found online at: https://www.frontiersin.org/articles/10.3389/fgene.2021.807210/full#supplementary-material
1000 GW: 1,000 grain weight, BS: bending strength, BM: bending moment, CD: culm diameter, DTF: days to 50% flowering, DTFirst: days to first emergence, DTFull: days to full emergence, Fe up: iron uptake, FLA: flag leaf area, FLAngle: flag leaf angle, GY: grain yield, NPT: number of productive tillers, NR: nodal root number, N up: nitrogen uptake, P up: phosphorus uptake, RGR: relative growth rate, RHL: root hair length, RHD: root hair density, PL: panicle length, PH: plant height, SPAD: chlorophyll content, SD: stem diameter, VVG: vegetative vigor, Zn up: zinc uptake.
References
Acuña‐Galindo, M. A., Mason, R. E., Subramanian, N. K., and Hays, D. B. (2015). Meta‐analysis of Wheat QTL Regions Associated with Adaptation to Drought and Heat Stress. Crop Sci. 55 (2), 477–492.
Adachi, S., Tsuru, Y., Nito, N., Murata, K., Yamamoto, T., Ebitani, T., et al. (2011). Identification and Characterization of Genomic Regions on Chromosomes 4 and 8 that Control the Rate of Photosynthesis in rice Leaves. J. Exp. Bot. 62 (6), 1927–1938. doi:10.1093/jxb/erq387
Agrama, H. A. S., Zakaria, A. G., Said, F. B., and Tuinstra, M. (1999). Identification of Quantitative Trait Loci for Nitrogen Use Efficiency in maize. Mol. Breed. 5, 187–195. doi:10.1023/a:1009669507144
Akkareddy, S., Vemireddy, L. R., Hariprasad, A. S., Jayaprada, M., Sridhar, S., Ramanarao, P. V., et al. (2010). Identification and Mapping of Landrace Derived QTL Associated with Yield and its Components in rice under Different Nitrogen Levels and Environments. Int. J. Plant Breed. Genet. 4 (4), 210–227.
Anis, G. B., Zhang, Y., Islam, A., Zhang, Y., Cao, Y., Wu, W., et al. (2019). RDWN6XB, a Major Quantitative Trait Locus Positively Enhances Root System Architecture under Nitrogen Deficiency in rice. BMC Plant Biol. 19 (1), 12–13. doi:10.1186/s12870-018-1620-y
Anis, G., Zhang, Y., Xu, X., Fiaz, S., Wu, W., Rahman, M. H., et al. (2018). QTL Analysis for rice Seedlings under Nitrogen Deficiency Using Chromosomal Segment Substitution Lines. Pak. J. Bot. 50 (2), 537–544.
Ashikari, M., and Matsuoka, M. (2006). Identification, Isolation and Pyramiding of Quantitative Trait Loci for rice Breeding. Trends Plant Sci. 11, 344–350. doi:10.1016/j.tplants.2006.05.008
Brasier, K., Ward, B., Smith, J., Seago, J., Oakes, J., Balota, M., et al. (2020). Identification of Quantitative Trait Loci Associated with Nitrogen Use Efficiency in winter Wheat. PLoS One 15, e0228775. doi:10.1371/journal.pone.0228775
Cassman, K. G., Peng, S., Olk, D. C., Ladha, J. K., Reichardt, W., Dobermann, A., et al. (1998). Opportunities for Increased Nitrogen-Use Efficiency from Improved Resource Management in Irrigated rice Systems. Field Crops Res. 56 (1-2), 7–39. doi:10.1016/s0378-4290(97)00140-8
Chardon, F., Virlon, B., Moreau, L., Falque, M., Joets, J., Decousset, L., et al. (2004). Genetic Architecture of Flowering Time in maize as Inferred from Quantitative Trait Loci Meta-Analysis and Synteny Conservation with the rice Genome. Genetics 168 (4), 2169–2185. doi:10.1534/genetics.104.032375
Cho, Y. I., Jiang, W., Chin, J. H., Piao, Z., Cho, Y. G., McCouch, S., et al. (2007). Identification of QTLs Associated with Physiological Nitrogen Use Efficiency in riceMolecules & Cells. Mol. Cell 23 (1), 72–79.
Collard, B. C. Y., and Mackill, D. J. (2008). Marker-assisted Selection: an Approach for Precision Plant Breeding in the Twenty-First century. Phil. Trans. R. Soc. B 363 (1491), 557–572. doi:10.1098/rstb.2007.2170
Courtois, B., Ahmadi, N., Khowaja, F., Price, A. H., Rami, J. F., Frouin, J., et al. (2009). Rice Root Genetic Architecture: Meta-Analysis from a Drought QTL Database. Rice 2 (2), 115–128. doi:10.1007/s12284-009-9028-9
Dai, G. J., Cheng, S. H., Hua, Z. T., Zhang, M. L., Jiang, H. B., Feng, Y., et al. (2015). Mapping Quantitative Trait Loci for Nitrogen Uptake and Utilization Efficiency in rice (Oryza Sativa L.) at Different Nitrogen Fertilizer Levels. Genet. Mol. Res. 14 (3), 10404–10414. doi:10.4238/2015.september.8.1
Danan, S., Veyrieras, J. B., and Lefebvre, V. (2011). Construction of a Potato Consensus Map and QTL Meta-Analysis Offer New Insights into the Genetic Architecture of Late Blight Resistance and Plant Maturity Traits. BMC Plant Biol. 11 (1), 16–17. doi:10.1186/1471-2229-11-16
Endelman, J. B., and Plomion, C. (2014). LPmerge: an R Package for Merging Genetic Maps by Linear Programming. Bioinformatics 30 (11), 1623–1624. doi:10.1093/bioinformatics/btu091
Fang, P., and Wu, P. (2001). QTL× N-Level Interaction for Plant Height in rice (Oryza Sativa L.). Plant and Soil 236 (2), 237–242. doi:10.1023/a:1012787510201
Fang, Z., Xia, K., Yang, X., Grotemeyer, M. S., Meier, S., Rentsch, D., et al. (2013). Altered Expression of thePTR/NRT1homologueOsPTR9affects Nitrogen Utilization Efficiency, Growth and Grain Yield in rice. Plant Biotechnol. J. 11 (4), 446–458. doi:10.1111/pbi.12031
FAO (2018). World Fertilizer Trends and Outlook to 2018. Rome: Food and Agriculture Organization of the United Nations.
Feng, B., Chen, K., Cui, Y., Wu, Z., Zheng, T., Zhu, Y., et al. (2018). Genetic Dissection and Simultaneous Improvement of Drought and Low Nitrogen Tolerances by Designed QTL Pyramiding in rice. Front. Plant Sci. 9, 306. doi:10.3389/fpls.2018.00306
Feng, Y., Cao, L. Y., Wu, W. M., Shen, X. H., Zhan, X. D., Zhai, R. R., et al. (2010). Mapping QTLs for Nitrogen-Deficiency Tolerance at Seedling Stage in rice (Oryza Sativa L.). Plant Breed 129 (6), 652–656. doi:10.1111/j.1439-0523.2009.01728.x
Feng, Y., Zhai, R.-R., Cao, L.-Y., Lin, Z.-C., Wei, X.-H., and Cheng, S.-H. (2011). QTL Analysis for Plant Height and Heading Date in Rice under Two Nitrogen Levels. A a S 37 (9), 1525–1532. doi:10.3724/sp.j.1006.2011.01525
Fontaine, J.-X., Ravel, C., Pageau, K., Heumez, E., Dubois, F., Hirel, B., et al. (2009). A Quantitative Genetic Study for Elucidating the Contribution of Glutamine Synthetase, Glutamate Dehydrogenase and Other Nitrogen-Related Physiological Traits to the Agronomic Performance of Common Wheat. Theor. Appl. Genet. 119, 645–662. doi:10.1007/s00122-009-1076-4
Fowler, D., Pyle, J. A., Raven, J. A., and Sutton, M. A. (2013). The Global Nitrogen Cycle in the Twenty-First century: Introduction. Philos. Trans. R. Soc. Lond. B Biol. Sci. 368 (1621), 1–2. doi:10.1098/rstb.2013.0165
Gallais, A., and Hirel, B. (2004). An Approach to the Genetics of Nitrogen Use Efficiency in maize. J. Exp. Bot. 55, 295–306. doi:10.1093/jxb/erh006
Goffinet, B., and Gerber, S. (2000). Quantitative Trait Loci: a Meta-Analysis. Genetics 155 (1), 463–473. doi:10.1093/genetics/155.1.463
Hu, B., Wang, W., Ou, S., Tang, J., Li, H., Che, R., et al. (2015). Variation in NRT1.1B Contributes to Nitrate-Use Divergence between rice Subspecies. Nat. Genet. 47, 834–838. doi:10.1038/ng.3337
International Rice Genome Sequencing Project (20052005). IRGSP Releases the Assembled rice Genome Sequences. Available at: http://rgp.dna.affrc.go.jp/IRGSP/Build2/build2.html.
Jewel, Z., Ali, J., Mahender, A., Hernandez, J., Pang, Y., and Li, Z. (2019). Identification of Quantitative Trait Loci Associated with Nutrient Use Efficiency Traits, Using SNP Markers in an Early Backcross Population of rice (Oryza Sativa L.). Ijms 20 (4), 900. doi:10.3390/ijms20040900
Jiang, H., Jiang, L., Guo, L., Gao, Z., Zeng, D., Zhu, L., et al. (2008). Conditional and Unconditional Mapping of Quantitative Trait Loci Underlying Plant Height and Tiller Number in rice (Oryza Sativa L.) Grown at Two Nitrogen Levels. Prog. Nat. Sci. 18 (12), 1539–1547. doi:10.1016/j.pnsc.2008.05.025
Kalugina, Z. I. (2014). Agricultural Policy in Russia: Global Challenges and the Viability of Rural Communities. Int. J. Sociol. Agric. Food 21, 115–131.
Kant, S., Bi, Y.-M., and Rothstein, S. J. (2011). Understanding Plant Response to Nitrogen Limitation for the Improvement of Crop Nitrogen Use Efficiency. J. Exp. Bot. 62, 1499–1509. doi:10.1093/jxb/erq297
Khahani, B., Tavakol, E., Shariati, V., and Fornara, F. (2020). Genome Wide Screening and Comparative Genome Analysis for Meta-QTLs, Ortho-MQTLs and Candidate Genes Controlling Yield and Yield-Related Traits in rice. BMC Genomics 21 (1), 294–317. doi:10.1186/s12864-020-6702-1
Khahani, B., Tavakol, E., Shariati, V., and Rossini, L. (2021). Meta-QTL and Ortho-MQTL Analyses Identified Genomic Regions Controlling rice Yield, Yield-Related Traits and Root Architecture under Water Deficit Conditions. Sci. Rep. 11 (1), 6942–6959. doi:10.1038/s41598-021-86259-2
Khahani, B., Tavakol, E., and Shariati, V. (2019). Genome-wide Meta-Analysis on Yield and Yield-Related QTLs in Barley (Hordeum Vulgare L.). Mol. Breed. 39 (4), 1–16. doi:10.1007/s11032-019-0962-y
Kraiser, T., Gras, D. E., Gutierrez, A. G., Gonzalez, B., and Gutierrez, R. A. (2011). A Holistic View of Nitrogen Acquisition in Plants. J. Exp. Bot. 62, 1455–1466. doi:10.1093/jxb/erq425
Krzywinski, M., Schein, J., Birol, İ., Connors, J., Gascoyne, R., Horsman, D., et al. (2009). Circos: an Information Aesthetic for Comparative Genomics. Genome Res. 19 (9), 1639–1645. doi:10.1101/gr.092759.109
Kumar, A., Sandhu, N., Kumar, P., Pruthi, G., Singh, J., Kaur, S., et al. (2021). Genome-wide Analysis of NPF, NRT2, CLC and SLAC1/SLAH Nitrate Transporters in Hexaploid Wheat (Triticum aestivum). Sci. Rep.. (under review).
Kumari, S., Sharma, N., and Raghuram, N. (2021). Meta-Analysis of Yield-Related and N-Responsive Genes Reveals Chromosomal Hotspots, Key Processes and Candidate Genes for Nitrogen-Use Efficiency in rice. Front. Plant Sci. 12, 627955. doi:10.3389/fpls.2021.627955
Laza, M. R., Kondo, M., Ideta, O., Barlaan, E., and Imbe, T. (2006). Identification of Quantitative Trait Loci for δ13C and Productivity in Irrigated Lowland Rice. Crop Sci. 46 (2), 763–773. doi:10.2135/cropsci2005.05.0084
Lei, L., Zheng, H. L., Wang, J. G., Liu, H. L., Sun, J., Zhao, H. W., et al. (2018). Genetic Dissection of rice (Oryza Sativa L.) Tiller, Plant Height, and Grain Yield Based on QTL Mapping and Metaanalysis. Euphytica 214, 1–7. doi:10.1007/s10681-018-2187-2
Li, H., Hu, B., and Chu, C. (2017). Nitrogen Use Efficiency in Crops: Lessons from Arabidopsis and rice. J. Exp. Bot. 68, 2477–2488. doi:10.1093/jxb/erx1010.1093/jxb/erx101
Li, W.-T., Liu, C., Liu, Y.-X., Pu, Z.-E., Dai, S.-F., Wang, J.-R., et al. (2013). Meta-analysis of QTL Associated with Tolerance to Abiotic Stresses in Barley. Euphytica 189, 31–49. doi:10.1007/s10681-012-0683-3
Lu, Y., Song, Z., Lü, K., Lian, X., and Cai, H. (2012). Molecular Characterization, Expression and Functional Analysis of the Amino Acid Transporter Gene Family (OsAATs) in rice. Acta Physiol. Plant 34 (5), 1943–1962. doi:10.1007/s11738-012-0995-x
MacMillan, K., Emrich, K., Piepho, H.-P., Mullins, C. E., and Price, A. H. (2006). Assessing the Importance of Genotype × Environment Interaction for Root Traits in rice Using a Mapping Population II: Conventional QTL Analysis. Theor. Appl. Genet. 113, 953–964. doi:10.1007/s00122-006-0357-4
Mahender, A., Ali, J., Prahalada, G. D., Sevilla, M. A. L., Balachiranjeevi, C. H., Md, J., et al. (2019). Genetic Dissection of Developmental Responses of Agro-Morphological Traits under Different Doses of Nutrient Fertilizers Using High-Density SNP Markers. PLoS One 14 (7), e0220066. doi:10.1371/journal.pone.0220066
Manangkil, J. M., Niones, J. M., Undan, J. R., Obara, M., Mananghaya, T. E., Mallari, R. P., et al. (2019). Quantitative Trait Loci Associated with Root Elongation Ability of rice under Nitrogen-Deficient Condition. Philip. J. Sci. 148 (2), 401–409.
Nayar, N. M. (2014). The Origin of Asian rice. Origin and Phylogeny of Rices. Chapter 6. Academic Press, Elsevier, 169–253. doi:10.1016/b978-0-12-417177-0.00006-1
Nguyen, H. T. T., Van Pham, C., and Bertin, P. (2014). The Effect of Nitrogen Concentration on Nitrogen Use Efficiency and Related Parameters in Cultivated Rices (Oryza Sativa L. Subsp. Indica and Japonica and O. Glaberrima Steud.) in Hydroponics. Euphytica 198 (1), 137–151. doi:10.1007/s10681-014-1101-9
Norton, R., Davidson, E., and Roberts, T. (2015). Position Paper - Nitrogen Use Efficiency and Nutrient Performance Indicators. Nairobi: Global Partnership on Nutrient Management.
Obara, M., Ishimaru, T., Abiko, T., Fujita, D., Kobayashi, N., Yanagihara, S., et al. (2014). Identification and Characterization of Quantitative Trait Loci for Root Elongation by Using Introgression Lines with Genetic Background of Indica-type rice Variety IR64. Plant Biotechnol. Rep. 8 (3), 267–277. doi:10.1007/s11816-014-0320-9
Orjuela, J., Garavito, A., Bouniol, M., Arbelaez, J. D., Moreno, L., Kimball, J., et al. (2010). A Universal Core Genetic Map for rice. Theor. Appl. Genet. 120 (3), 563–572. doi:10.1007/s00122-009-1176-1
Paul, K., Chopra, N. K., Soni, P. G., Kumar, R., and Mondal, G. (2014). Influence of Different Nitrogen Levels and weed Control on Yield and Chemical Composition of Mustard (Brassica Rapa L. Sub. Chinensis) Fodder. Ind. J. Ani. Nut. 31 (4), 400–403.
Pozzo, T., Higdon, S. M., Pattathil, S., Hahn, M. G., and Bennett, A. B. (2018). Characterization of Novel Glycosyl Hydrolases Discovered by Cell wall Glycan Directed Monoclonal Antibody Screening and Metagenome Analysis of maize Aerial Root Mucilage. PLoS One 13, e0204525. doi:10.1371/journal.pone.0204525
Price, A. H. (2006). Believe it or Not, QTLs Are Accurate!. Trends Plant Sci. 11 (5), 213–216. doi:10.1016/j.tplants.2006.03.006
Ranathunge, K., El-Kereamy, A., Gidda, S., Bi, Y.-M., and Rothstein, S. J. (2014). AMT1;1 Transgenic rice Plants with Enhanced NH4+ Permeability Show superior Growth and Higher Yield under Optimal and Suboptimal NH4+ Conditions. J. Exp. Bot. 65 (4), 965–979. doi:10.1093/jxb/ert458
Ribaut, J.-M., Fracheboud, Y., Monneveux, P., Banziger, M., Vargas, M., and Jiang, C. (2007). Quantitative Trait Loci for Yield and Correlated Traits under High and Low Soil Nitrogen Conditions in Tropical maize. Mol. Breed. 20, 15–29. doi:10.1007/s11032-006-9041-2
Sandhu, N., Subedi, S. R., Singh, V. K., Sinha, P., Kumar, S., Singh, S. P., et al. (2019). Deciphering the Genetic Basis of Root Morphology, Nutrient Uptake, Yield, and Yield-Related Traits in rice under Dry Direct-Seeded Cultivation Systems. Sci. Rep. 9 (1), 9334–9350. doi:10.1038/s41598-019-45770-3
Sandhu, N., Kaur, A., Sethi, M., Kaur, S., Varinderpal-Singh, V., Sharma, A., et al. (2021). Genetic Dissection Uncovers Genome-wide Marker-Trait Associations for Plant Growth, Yield, and Yield-Related Traits under Varying Nitrogen Levels in Nested Synthetic Wheat Introgression Libraries. Front. Plant Sci. 12, 738710. doi:10.3389/fpls.2021.738710
Sandhu, N., Raman, K. A., Torres, R. O., Audebert, A., Dardou, A., Kumar, A., et al. (2016). Rice Root Architectural Plasticity Traits and Genetic Regions for Adaptability to Variable Cultivation and Stress Conditions. Plant Physio 171 (4), 2562–2576. doi:10.1104/pp.16.00705
Sandhu, N., Torres, R. O., Sta Cruz, M. T., Maturan, P. C., Jain, R., Kumar, A., et al. (2015). Traits and QTLs for Development of Dry Direct-Seeded Rainfed rice Varieties. J. Exp. Bot. 66 (1), 225–244. doi:10.1093/jxb/eru413
Semagn, K., Beyene, Y., Warburton, M. L., Tarekegne, A., Mugo, S., Meisel, B., et al. (2013). Meta-analyses of QTL for Grain Yield and Anthesis Silking Interval in 18 maize Populations Evaluated under Water-Stressed and Well-Watered Environments. BMC Genomics 14 (1), 313–316. doi:10.1186/1471-2164-14-313
Senthilvel, S., Vinod, K. K., Malarvizhi, P., and Maheswaran, M. (2008). QTL and QTL × Environment Effects on Agronomic and Nitrogen Acquisition Traits in Rice. J. Integ. Plant Bio. 50 (9), 1108–1117. doi:10.1111/j.1744-7909.2008.00713.x
Sosnowski, O., Charcosset, A., and Joets, J. (2012). BioMercator V3: an Upgrade of Genetic Map Compilation and Quantitative Trait Loci Meta-Analysis Algorithms. Bioinformatics 28 (15), 2082–2083. doi:10.1093/bioinformatics/bts313
Subedi, S. R., Sandhu, N., Singh, V. K., Sinha, P., Kumar, S., Singh, S. P., et al. (2019). Genome-wide Association Study Reveals Significant Genomic Regions for Improving Yield, Adaptability of rice under Dry Direct Seeded Cultivation Condition. BMC Genomics 20 (1), 471–491. doi:10.1186/s12864-019-5840-9
Swamy, B. P., Vikram, P., Dixit, S., Ahmed, H. U., and Kumar, A. (2011). Meta-analysis of Grain Yield QTL Identified during Agricultural Drought in Grasses Showed Consensus. BMC Genomics 12 (1), 319–336. doi:10.1186/1471-2164-12-319
Swamy, B. P. M., and Sarla, N. (2011). Meta-analysis of Yield QTLs Derived from Inter-specific Crosses of rice Reveals Consensus Regions and Candidate Genes. Plant Mol. Biol. Rep. 29 (3), 663–680. doi:10.1007/s11105-010-0274-1
Van Deynze, A., Zamora, P., Delaux, P.-M., Heitmann, C., Jayaraman, D., Rajasekar, S., et al. (2018). Nitrogen Fixation in a Landrace of maize Is Supported by a Mucilage-Associated Diazotrophic Microbiota. Plos Biol. 16, e2006352. doi:10.1371/journal.pbio.2006352
Van, K., and McHale, L. (2017). Meta-analyses of QTLs Associated with Protein and Oil Contents and Compositions in Soybean (Glycine max (L.) Merr.) Seed. Ijms 18 (6), 1180. doi:10.3390/ijms18061180
Veyrieras, J. B., Goffinet, B., and Charcosset, A. (2007). MetaQTL: a Package of New Computational Methods for the Meta-Analysis of QTL Mapping Experiments. BMC Bioinformatics 8 (1), 49–16. doi:10.1186/1471-2105-8-49
Vishnukiran, T., Neeraja, C. N., Jaldhani, V., Vijayalakshmi, P., Raghuveer Rao, P., Subrahmanyam, D., et al. (2020). A Major Pleiotropic QTL Identified for Yield Components and Nitrogen Content in rice (Oryza Sativa L.) under Differential Nitrogen Field Conditions. PloS one 15 (10), e0240854. doi:10.1371/journal.pone.0240854
Wei, D., Cui, K., Pan, J., Ye, G., Xiang, J., Nie, L., et al. (2011). Genetic Dissection of Grain Nitrogen Use Efficiency and Grain Yield and Their Relationship in rice. Field Crops Res. 124 (3), 340–346. doi:10.1016/j.fcr.2011.07.003
Wei, D., Cui, K., Ye, G., Pan, J., Xiang, J., Huang, J., et al. (2012). QTL Mapping for Nitrogen-Use Efficiency and Nitrogen-Deficiency Tolerance Traits in rice. Plant and Soil 359 (1), 281–295. doi:10.1007/s11104-012-1142-6
Yan, M., Fan, X., Feng, H., Miller, A. J., Shen, Q., and Xu, G. (2011). Rice OsNAR2.1 Interacts with OsNRT2.1, OsNRT2.2 and OsNRT2.3a Nitrate Transporters to Provide Uptake over High and Low Concentration Ranges. Plant Cel Environ. 34 (8), 1360–1372. doi:10.1111/j.1365-3040.2011.02335.x
Yang, S. M., Zhang, F. F., Zhang, S. H., Li, G. Y., Zeng, L. Q., Liu, G. S., et al. (2019). QTL Mapping of Physiological Traits at the Booting Stage in rice under Low Temperature Combined with Nitrogen Fertilization. Czech J. Genet. Plant Breed. 55 (4), 146–155. doi:10.17221/67/2018-cjgpb
Ye, T., Li, Y., Zhang, J., Hou, W., Zhou, W., Lu, J., et al. (2019). Nitrogen, Phosphorus, and Potassium Fertilization Affects the Flowering Time of rice (Oryza Sativa L.). Glob. Ecol. Conservation 20, e00753. doi:10.1016/j.gecco.2019.e00753
Yue, F., Rong-rong, Z., Ze-chuan, L., Li-yong, C., Xing-hua, W., and Shi-hua, C. (2015). Quantitative Trait Locus Analysis for rice Yield Traits under Two Nitrogen Levels. Rice Sci. 22 (3), 108–115. doi:10.1016/j.rsci.2015.05.014
Zhang, M., Gao, M., Zheng, H., Yuan, Y., Zhou, X., Guo, Y., et al. (2019). QTL Mapping for Nitrogen Use Efficiency and Agronomic Traits at the Seedling and Maturity Stages in Wheat. Mol. Breed. 39, 71. doi:10.1007/s11032-019-0965-8
Zhang, X., Shabala, S., Koutoulis, A., Shabala, L., and Zhou, M. (2017). Meta-analysis of Major QTL for Abiotic Stress Tolerance in Barley and Implications for Barley Breeding. Planta 245 (2), 283–295. doi:10.1007/s00425-016-2605-4
Zhao, C.-F., Zhou, L.-H., Zhang, Y.-D., Zhu, Z., Chen, T., Zhao, Q.-Y., et al. (2014). QTL Mapping for Seedling Traits Associated with Low-Nitrogen Tolerance Using a Set of Advanced Backcross Introgression Lines of rice. Plant Breed 133 (2), 189–195. doi:10.1111/pbr.12123
Zhao, X., Peng, Y., Zhang, J., Fang, P., and Wu, B. (2018). Identification of QTLs and Meta‐QTLs for Seven Agronomic Traits in Multiple Maize Populations under Well‐Watered and Water‐Stressed Conditions. Crop Sci. 58, 507–520. doi:10.2135/cropsci2016.12.0991
Keywords: candidate gene, grain yield, meta-QTL, NUE, orthologue, rice, root
Citation: Sandhu N, Pruthi G, Prakash Raigar O, Singh MP, Phagna K, Kumar A, Sethi M, Singh J, Ade PA and Saini DK (2021) Meta-QTL Analysis in Rice and Cross-Genome Talk of the Genomic Regions Controlling Nitrogen Use Efficiency in Cereal Crops Revealing Phylogenetic Relationship. Front. Genet. 12:807210. doi: 10.3389/fgene.2021.807210
Received: 01 November 2021; Accepted: 30 November 2021;
Published: 21 December 2021.
Edited by:
Ahmed Sallam, Assiut University, EgyptReviewed by:
Jose Miguel Soriano, Institute of Agrifood Research and Technology (IRTA), SpainAgata Gadaleta, University of Bari Aldo Moro, Italy
Karansher Singh Sandhu, Washington State University, United States
Copyright © 2021 Sandhu, Pruthi, Prakash Raigar, Singh, Phagna, Kumar, Sethi, Singh, Ade and Saini. This is an open-access article distributed under the terms of the Creative Commons Attribution License (CC BY). The use, distribution or reproduction in other forums is permitted, provided the original author(s) and the copyright owner(s) are credited and that the original publication in this journal is cited, in accordance with accepted academic practice. No use, distribution or reproduction is permitted which does not comply with these terms.
*Correspondence: Nitika Sandhu, nitikasandhu@pau.edu
†These authors have contributed equally to this work