 Yang Kong1,2,3,4
 Zhiwei Xue1,2Haiying Wang5Guangqiang Cui3,4
 Anjing Chen1,2Jie Liu3,4
 Jian Wang1,2,6
 Xingang Li1,2
 Bin Huang1,2*
- 1Department of Neurosurgery, Qilu Hospital, Cheeloo College of Medicine and Institute of Brain and Brain-Inspired Science, Shandong University, Jinan, China
- 2Jinan Microecological Biomedicine Shandong Laboratory and Shandong Key Laboratory of Brain Function Remodeling, Jinan, China
- 3Neurological Care Unit, The Affiliated Yantai Yuhuangding Hospital of Qingdao University, Yantai, China
- 4Department of Neurosurgery, The Affiliated Yantai Yuhuangding Hospital of Qingdao University, Yantai, China
- 5Department of Anesthesiology, The Affiliated Yantai Yuhuangding Hospital of Qingdao University, Yantai, China
- 6Department of Biomedicine, University of Bergen, Bergen, Norway
Rigorous molecular analysis of the immune cell environment and immune response of human tumors has led to immune checkpoint inhibitors as one of the most promising strategies for the treatment of human cancer. However, in human glioblastoma multiforme (GBM) which develops in part by attracting immune cell types intrinsic to the human brain (microglia), standard immunotherapy has yielded inconsistent results in experimental models and patients. Here, we analyzed publicly available expression datasets to identify molecules possibly associated with immune response originating from or influencing the tumor microenvironment in primary tumor samples. Using three glioma datasets (GSE16011, Rembrandt-glioma and TCGA-glioma), we first analyzed the data to distinguish between GBMs of high and low tumor cell purity, a reflection of the cellular composition of the tumor microenvironment, and second, to identify differentially expressed genes (DEGs) between these two groups using GSEA and other analyses. Tumor purity was negatively correlated with patient prognosis. The interferon gamma-related gene BST2 emerged as a DEG that was highly expressed in GBM and negatively correlated with tumor purity. BST2high tumors also tended to harbor PTEN mutations (31 vs. 9%, BST2high versus BST2low) while BST2low tumors more often had sustained TP53 mutations (8 versus 36%, BST2high versus BST2low). Prognosis of patients with BST2high tumors was also poor relative to patients with BST2low tumors. Further molecular in silico analysis demonstrated that high expression of BST2 was negatively correlated with CD8+ T cells but positively correlated with macrophages with an M2 phenotype. Further functional analysis demonstrated that BST2 was associated with multiple immune checkpoints and cytokines, and may promote tumorigenesis and progression through interferon gamma, IL6/JAK/STAT3 signaling, IL2/STAT5 signaling and the TNF-α signaling via NF-kB pathway. Finally, a series of experiments confirmed that the expression of BST2 can be significantly increased by IFN induction, and knockdown of BST2 can significantly inhibit the growth and invasion of GBM cells, and may affect the phenotype of tumor-associated macrophages. In conclusion, BST2 may promote the progression of GBM and may be a target for treatment.
Introduction
Glioblastoma multiforme (GBM) is the most common and lethal tumor type in the central nervous system (CNS), and exhibits many aggressive tumor characteristics such as rapid growth, invasion, and genetic heterogeneity (Appin and Brat, 2015; Reifenberger et al., 2017). Moreover, lesions cannot be completely removed leading to the inevitability of recurrence, and the presence of the blood-brain barrier complicates access of various molecular therapies to the tumor bed (Aldape et al., 2019). Thus, despite the multimodal therapy of surgery, radiation and chemotherapy, most patients with GBM survive less than 2 years following primary diagnosis (Stupp et al., 2005).
One of the more promising treatment strategies for aggressive human cancers has been immunotherapy (Medrano et al., 2017; Singh and McGuirk, 2020). Current approaches include cellular immunotherapy, such as chimeric antigen receptor T cells (CAR-T therapy), and strategies that trigger the immune response, such as antibodies, cytokines, immune checkpoint inhibitors, and oncolytic viruses (Togashi et al., 2019; Krishna et al., 2020; Fares et al., 2021). Targeting mutant TP53 has also been an attractive approach to modulate immune response in cancer immunotherapy, and TP53 and genes in its pathway are frequently mutated during the development of GBM (Shiraishi et al., 2002; Chasov et al., 2021). While these therapies have been successful in some primary tumor types such as melanoma, lung and colon cancers, treatment of GBM patients with immunotherapies has been less effective, in part due to a unique and complex tumor microenvironment which consists of a variety of stromal cell types, including fibroblasts, adipocytes, endothelial cells and immune cells of either intrinsic (microglia) or peripheral origin, and the extracellular matrix (Buerki et al., 2018; Shergalis et al., 2018). Many of these cell types promote tumor development, such as tumor-associated macrophages (Pyonteck et al., 2013) and tumor-associated fibroblasts which, for example, secrete the protumorigenic chemokine CXCL14 (Zhang et al., 2019a).
Molecular characterization of GBM samples with an emphasis on tumor microenvironment might lead to the identification of different molecules that could be targeted for therapy, particularly with respect to the infiltrating immune cells types in human gliomas (Reifenberger et al., 2017). Here, we analyzed expression data in publicly available databases to distinguish between profiles of tumors with a high versus low stromal cell content, or low purity versus high purity tumors (Zhang et al., 2017). Analysis to identify differentially expressed genes (DEGs) between these two groups of tumors yielded BST2, a gene associated with immune cell types/function (Swiecki et al., 2012). Our analysis provides a path towards mining publicly available databases with the goal of targeting molecules unique to the GBM tumor microenvironment and may improve the efficacy of anti-GBM immunotherapy.
Materials and Methods
Data Source
Analysis was performed on expression data obtained from three publicly available glioma datasets, GSE16011, Rembrandt-glioma and TCGA-glioma. Expression data collected on the Affymetrix GeneChip Human Genome U133 Plus 2.0 Array was obtained from GSE16011 (n = 276 cases WHO grades II-IV, n = 8 non-neoplastic brain tissue samples; https://www.ncbi.nlm.nih.gov/geo/query/acc.cgi?acc=GSE16011) (Gravendeel et al., 2009) and Rembrandt-glioma datasets (n = 474 gliomas; https://caintegrator.nci.nih.gov/rembrandt/) (Gusev et al., 2018). For the TCGA-glioma dataset (n = 699 cases; https://gdc.cancer.gov/) (Cancer Genome Atlas Research Network, 2008), normalized expression data obtained through RNA sequencing and the mutation data generated through DNA sequencing were used in our analysis. Clinical data for all patients were obtained from the corresponding data portal.
Cell Lines and Cultures
Normal human astrocytes (NHA) and GBM cell lines U251, LN229, A172 and human monocyte leukemia cell line (THP-1) were provided by the Chinese Academy of Sciences Cell Bank (Shanghai, China) and authenticated by short tandem repeat (STR) profiling. The Mycoplasma PCR Detection Kit was used to detect Mycoplasma contamination. The cells are anchorage-dependent cells in the absence of any stress. Cells were cultured in complete medium: Dulbecco’s modified Eagle’s medium (DMEM, Thermo Fisher Scientific; Waltham, MA, United States), 10% fetal bovine serum (FBS, Thermo Fisher Scientific), streptomycin (100 U/ml) and penicillin (100 U/ml). THP-1 cells were treated with 200 nM phorbol-12-myristate-13-acetate (PMA, Sigma-Aldrich; St. Louis, MO, United States) for 24 h to allow for the differentiation into macrophages in 6-well plates. The cells were cultured in a humidified incubator (HERAcell 240i, Thermo Fisher Scientific) at 37°C and 5% CO2.
Preparation of Experimental Reagents
Interfering RNA sequences (siRNA) were synthesized (GenePharma, Shanghai, China). Before use, the siRNA powder was centrifuged, dissolved in DEPC water, aliquoted and stored at −20°C. Recombinant human IFN-γ protein was provided by T&L Biological Technology (Beijing, China). IFN-γ protein was dissolved in sterile PBS, aliquoted and stored at −20°C.
Bioinformatics Analysis
The Estimation of STromal and Immune cells in Malignant Tumor tissues using Expression data (ESTIMATE) R package was used to calculate tumor purity and the presence of infiltrating stromal/immune cells in tumor tissues based on transcriptomic data (Yoshihara et al., 2013). TIMER (https://cistrome.shinyapps.io/timer/) was used for systematic analysis of immune infiltrates (Li et al., 2020). The CIBERSORT database (https://cibersort.stanford.edu/runcibersort.php) was used to estimate the fraction of 22 immune cell types in a mixed cell population (Newman et al., 2015). Gene Set Enrichment Analysis (GSEA) was performed with the JAVA program (http://www.broadinstitute.org/gsea, version 4.0.3), using | NES |> 1, p-val < 0.05 as the criterion for the results (Subramanian et al., 2005). MSigDB gene set collections were used in the analysis of the expression profile data of different groups to correlate the enriched corresponding genes obtained from different molecular signatures to biological processes. R “edgeR” package was used to identify DEGs based on a threshold false discovery rate (FDR) of <0.05 and an absolute log2 fold change (FC) of >1 (Robinson et al., 2010).
The variation data and corresponding clinical data from the TCGA-glioma dataset were analyzed with the R “maftools” package, and the top 20 genes with the highest frequency of mutations in different groups were displayed in a waterfall chart (Mayakonda et al., 2018). Kaplan–Meier survival curves, expression difference box plots and histograms were generated using GraphPad Prism version eight software (San Diego, CA, United States). Intersecting genes were identified using Database for Annotation, Visualization and Integrated Discovery (DAVID, https://david.ncifcrf.gov/) (Huang et al., 2009) for Kyoto Encyclopedia of Genes and Genomes (KEGG, https://www.genome.jp/kegg/) pathway enrichment analysis (Ogata et al., 1999). KEGG pathway enrichment bubble charts, gene expression heat maps, correlation coefficient maps and chord diagrams were created with ggplot2 (Wickham, 2009), Pheatmap (Raivo, 2012), Corrplot (Wei et al., 2017) and Circlize package (Gu et al., 2014) in R Version 3.5.1, respectively.
RNA Interference
SiRNAs targeting BST2 were transfected into cells with Lipofectamine 2000 reagent (Thermo Fisher Scientific) according to the protocol. After 4 h, fluorescently labeled RNA was used to detect transfection efficiency. Knockdown efficiency was evaluated 48 h after transfection by qRT-PCR or immunoblotting. SiRNA sequences used are the following:
si-Control: 5′-UUCUCCGAACGUGUCACGUTT-3′;
si-BST2-1: 5′-GCAUCUACUUCGUAUGACUTT-3′;
si-BST2-2: 5′-GGAUAGGAAUUCUGGUGCUTT-3′;
si-BST2-3: 5′-GAGCGACUGAGAAGAGAAATT-3′.
Production of Conditioned Supernatant
U251 cells were seeded 5 × 10⁶ cells/well in 6-well plates and allowed to adhere overnight. They were then extensively washed and incubated for 48 h with fresh complete DMEM containing si-Control or si-BST2. Supernatants were collected, centrifuged at 5000 g, filtered using a 0.2 μm filter (Millipore) and stored at −80°C until use.
Real-Time PCR
Total RNA was prepared from treated cells using TRIzol (Thermo Fisher Scientific). Briefly, after centrifugation, the aqueous layer was transferred to a fresh eppendorf tube, and isopropanol was added to precipitate total RNA. cDNA was generated from total RNA (1 µg) using the ReverTra Ace qPCR RT Kit (TOYOBO, Osaka, Japan). qRT-PCR was performed with SYBR Green Master (Roche, Basel, Switzerland) on the CFX96 Real Time PCR Detection System (Roche). ACTB mRNA was used to normalize mRNA expression. The results are representative of at least three independent experiments. The sequences of the PCR primers used are the following: IL10-Forward: 5′-CCAGACATCAAGGCGCATGT-3′, Reverse: 5′-GATGCCTTTCTCTTGGAGCTTATT-3′; TGF-β- Forward: 5′-GCAACAATTCCTGGCGATACC-3′, Reverse: 5′-ATTTCCCCTCCACGGCTCAA-3′; TNF-α- Forward: 5′- GAGGCCAAGCCCTGGTATG-3′, Reverse: 5′-CGGGCCGATTGATCTCAGC-3′; BST2- Forward: 5′-ATGGAAGACGGGGATAAGCG-3′, Reverse: 5′-GGAGATGGGTGACATTGCGA-3′; ACTB- Forward: 5′-CATGTACGTTGCTATCCAGGC-3′, Reverse: 5′-CTCCTTAATGTCACGCACGAT-3′.
Western Blotting
Harvested cells were lysed with heat denaturation in RIPA cell lysis buffer supplemented with phenylmethanesulfonyl fluoride (PMSF, Beyotime, Shanghai, China). Protein lysates (20 μg) were run on SDS-PAGE, and proteins were transferred to polyvinylidene difluoride (PVDF) membrane (0.22 μm, Millipore; Danvers, MA, United States). Blots were incubated with primary antibodies against BST2 (Proteintech, Wuhan, China) and ACTB (Cell Signaling Technology; Danvers, MA, United States). HRP-labeled goat anti-rabbit secondary antibodies were purchased from Zhongshan Golden Bridge Bio-technology (Beijing, China). Specific proteins were detected with enhanced chemiluminescence (ECL, Millipore). Luminous intensity was detected with the Chemiluminescence Imager (Bio-Rad ChemiDoc XRS+, Bio-Rad; Hercules, CA, United States) according to the manufacturer’s protocol. Band density was measured (ImageJ software) and normalized to ACTB.
Cell Viability Assay
Cell viability was assessed using the Cell Counting Kit-8 assay (CCK-8, Dojindo; Kumamoto, Japan). GBM cells (4 × 10³) were seeded into the wells of 96-well plates (Corning, Corning, NY, United States) and cultured in a humidified incubator at 37°C and 5% CO2. After 12 h, the medium was replaced with 100 μl of fresh culture medium containing corresponding treatment or control. At 24, 48, 72, and 96 h after dosing, GBM cells were incubated with 10 μl of CCK-8 reagent in 100 μl of serum-free DMEM at 37°C for an hour. The absorbance at 450 nm was measured using an EnSight Multimode Plate Reader (PerkinElmer, Singapore).
5-Ethynyl-2′-Deoxyuridine Cell Proliferation Assay
GBM cells (2 × 10⁴) were seeded into 24-well plates, allowed to attach, and treated. Following treatment, cell proliferation was measured using the EdU Apollo 567 Cell Tracking Kit (Ribo-bio, Guangzhou, China). Briefly, cells were incubated with EdU reagent (200 μM) for 2 h at room temperature, fixed with 4% paraformaldehyde for 20 min and permeabilized with 0.5% Triton X-100 for 10 min. Cells were rinsed with phosphate buffered saline (PBS) three times, incubated with 100 μl of Apollo reagent for 30 min and stained with 4′,6-diamidino-2-phenylindole (DAPI). Three fields of view were randomly selected for counting EdU-positive cells, and three independent experiments were performed.
Cell Invasion Assay
Transwell assays were performed in matrigel-coated (BD Biosciences, San Jose, CA, United States) Transwell chambers (8 μm pores, Corning). Cells (2 × 10⁴) in DMEM medium (200 μl) were seeded in the top chamber. The lower chamber was filled with medium (600 μl) containing 30% FBS. Chambers were incubated for 24 h. Cells that migrated to the lower surface were fixed with 4% paraformaldehyde (Solarbio, Beijing, China), stained with crystal violet (Solarbio) for 15 min and counted under bright field microscopy. Images were acquired from five random fields in each well.
Statistical Analysis
Each assay was performed at least three times independently. Data were reported as the mean ± SD. Quantitative data were first tested for normal distribution. If the data met the criteria for normal distribution, differences were assessed between two groups using a Student’s t test and between multiple groups using one-way ANOVA. Otherwise, non-parametric tests were chosen to detect the differences. The association between glioma purity and continuous variables was assessed using Spearman rank correlation. The log-rank test was used to assess the statistical significance between groups. Patients with missing information were excluded from corresponding analysis. All statistical analyses were conducted using R Version 3.5.1 and GraphPad Prism version eight software (San Diego, CA, United States). Differences were considered to be significant at the following p-values: *p < 0.05; **p < 0.01; ***p < 0.001.
Results
High Tumor Purity is Associated With Better Prognosis in Human Glioma
To explore the relationship between tumor purity and clinical characteristics, we ranked the tumor purity of the samples in the GSE16011, Rembrandt and TCGA-glioma datasets from low to high along with clinical characteristics, including WHO grade, EGFR, IDH1, and 1p/19q status, survival time, and age (Figure 1A). The correlation between tumor purity and clinical characteristics was calculated using a previously described method (Zhang et al., 2017). Higher WHO grade was associated with lower tumor purity, while longer overall survival and higher KPS were associated with higher tumor purity. Tumor purity based on the four molecular glioma subtypes was often lower in mesenchymal tumors relative to proneural and classical tumors. In contrast, tumor purity was higher in tumors with 1p/19q codeletion, IDH1 mutation (R132) and/or MGMT promoter mutation.
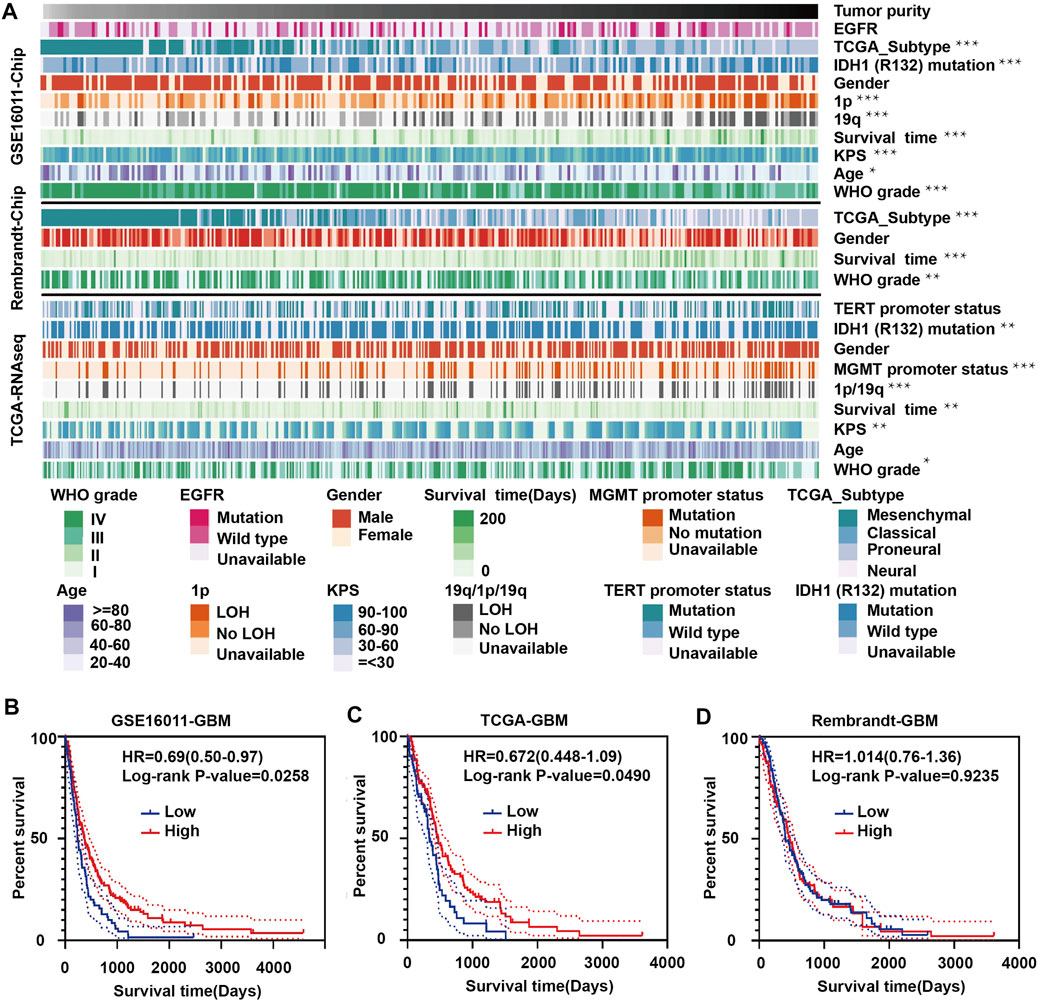
FIGURE 1. Landscape of clinical and molecular characteristics associated with glioma purity. (A) Diagram showing clinical and molecular data for a total of 1449 samples from all three datasets (GSE16011, Rembrandt and TCGA-glioma) arranged on the basis of increasing tumor purity. The status of clinical and molecular characteristics is designated based on shades of colors. The relationship between glioma purity and patient characteristics was evaluated under the following conditions: (a) the distribution of glioma purity was assessed using the Student’s t test between two groups; (b) the association between glioma purity and continuous variables was assessed using Spearman correlation tests; and (c) the distribution of glioma purity between several groups was assessed using one-way ANOVA. Kaplan–Meier survival curves for GBM patients with high and low purity tumors in (B) GSE16011, (C) TCGA-glioma and (D) Rembrandt. The statistical differences in the figure are highlighted as follows: ∗p < 0.05; ∗∗p < 0.01; ∗∗∗p < 0.001.
Some results were inconsistent between data sets. For example, we found a negative correlation between glioma purity and age at diagnosis in the GSE16011 dataset, but no such correlation was observed in the other two datasets. These results corroborate a study by Chuanbao Zhang et al. (2017).
We further examined the significance of high- and low-purity tumors using Kaplan-Meier analysis to determine the overall survival of patients in the three data sets. Longer overall survival was associated with high-purity tumors based on the GSE16011 and TCGA datasets (Figures 1B,C). However, we found no significant difference between the two groups using the Rembrandt dataset (Figure 1D). These results may be due to the small sample size and sample bias.
The Interferon Gamma Signature is Associated With Tumor Purity
To identify DEGs between GBM high-purity and low-purity tumors, we first used the “edgeR” package to analyze the molecular profiles of GBMs in GSE16011 and TCGA datasets (FDR <0.05, | log2fold change |> 1). No DEGs were obtained. When we switched to the more sensitive, genome-wide GSEA method, we found that 13 molecular signatures were up-regulated in the high-purity tumor group while seven were down-regulated in the low-purity group using the GSE16011 dataset. In the TCGA dataset, we found 11 up-regulated and down-regulated molecular signatures associated with high and low purity tumor groups, respectively. The intersection of the up-regulated and down-regulated molecular signatures of the two datasets yielded profiles associated with interferon gamma response and pancreas beta cells (Figures 2A,B respectively) as well as in GSEA (interferon gamma response, Figures 2C,D, and pancreas beta cells, Figures 2E,F in GSE16011 and TCGA data sets, respectively).
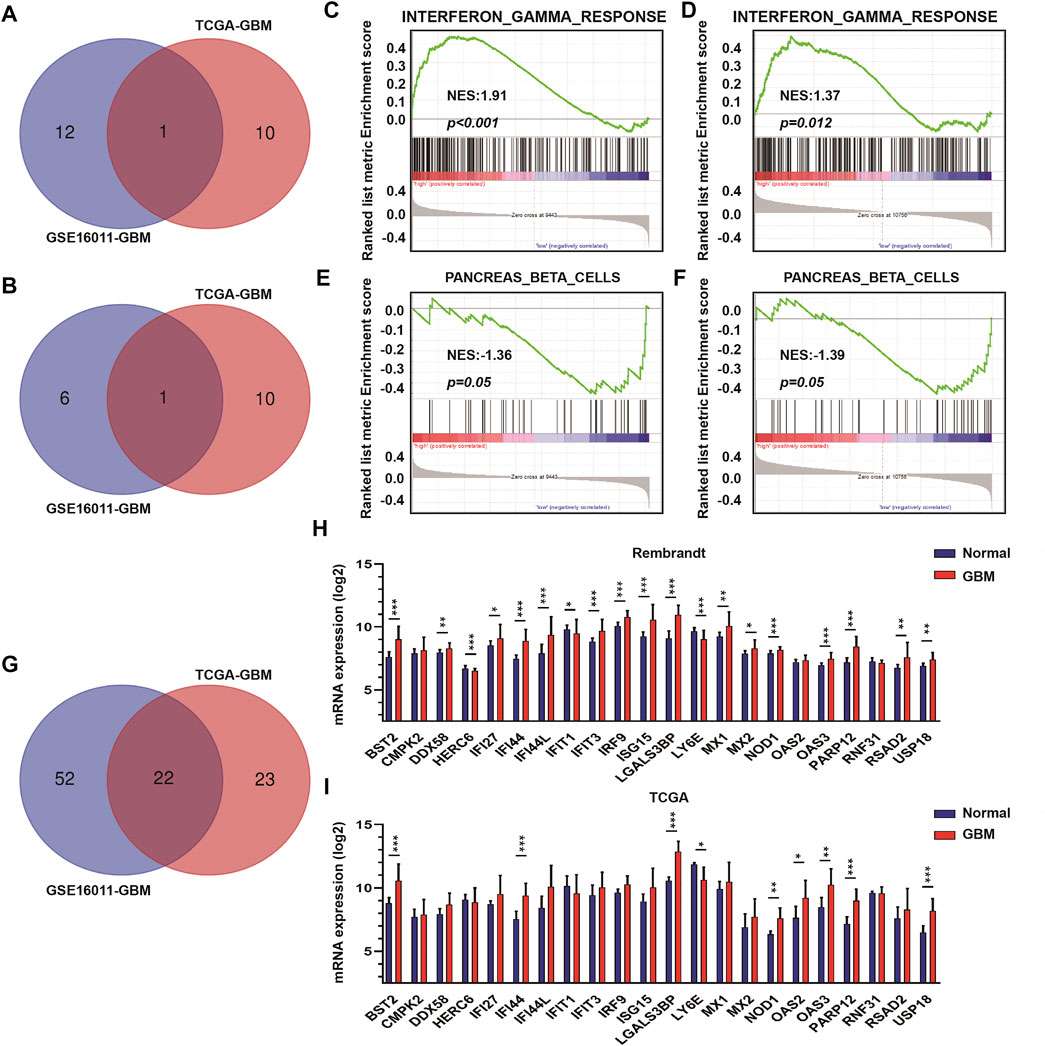
FIGURE 2. The interferon γ signature is associated with differences in GBM tumor purity. (A) Venn diagram displaying the intersection between up-regulated molecular signatures in GSE16011-GBM and TCGA-GBM datasets. (B) Venn diagram displaying the intersection between down-regulated molecular signatures in GSE16011-GBM and TCGA-GBM datasets. GSEA results for interferon γ response in (C) GSE16011-GBM and (D) TCGA-GBM datasets. GSEA results for pancreas beta cells in (E) GSE16011-GBM and (F) TCGA-GBM datasets. (G) Venn diagram displaying the intersection between core genes of the interferon gamma signature in GSE16011 and TCGA datasets. The expression levels of intersecting genes in normal brain and GBM tissue samples in (H) Rembrandt and (I) TCGA datasets. The statistical differences in the figure are highlighted as follows: ∗p < 0.05; ∗∗p < 0.01; ∗∗∗p < 0.001.
Considering that interferon gamma, as the only type II interferon, has significant antiviral and antitumor properties and shows fewer side effects (Ni et al., 2013; Li et al., 2018; Song et al., 2019), we focused on the relationship between genes in the interferon gamma molecular tags and tumor progression and purity. Analysis of the intersection of the core genes of the interferon gamma signature in the two datasets yielded several genes, which included BST2, CMPK2, DDX58, HERC6, IFI27, IFI44, IFI44L, IFIT1, IFIT3, IRF9, ISG15, LGALS3BP, LY6E, MX1, MX2, NOD1, OAS2, OAS3, PARP12, RNF31, RSAD2, and USP18 (Figures 2G–I). We examined the expression of these genes in the Rembrandt and TCGA databases and selected those with consistent expression among the three datasets. Finally, we obtained a total of eight genes for further analysis, including BST2, IFI44, LGALS3BP, LY6E, NOD1, USP18, OAS3, and PARP12.
High Expression of BST2 is Associated With Worse Prognosis
Using Kaplan-Meier analysis, we examined overall survival of patients in the TCGA-GBM dataset based on high and low expression of BST2, IFI44, LGALS3BP, LY6E, NOD1, USP18, OAS3, and PARP12 in tumors. High and low expressions were determined based on the median expression values of the genes in the dataset. Groups showing high expression of BST2, NOD1 or LY6E were associated with a poor prognosis (Figures 3A–C). In contrast, high expression of USP18 was associated with a better prognosis (Figure 3D). There was no significant difference in overall survival of patients based on high and low expression of IFI44, LGALS3BP, PARP12 or OAS3 (Figures 3E–H). Due to the consistency of the results for BST2 in multiple datasets and the ranking of core genes, we selected BST2 for further analysis.
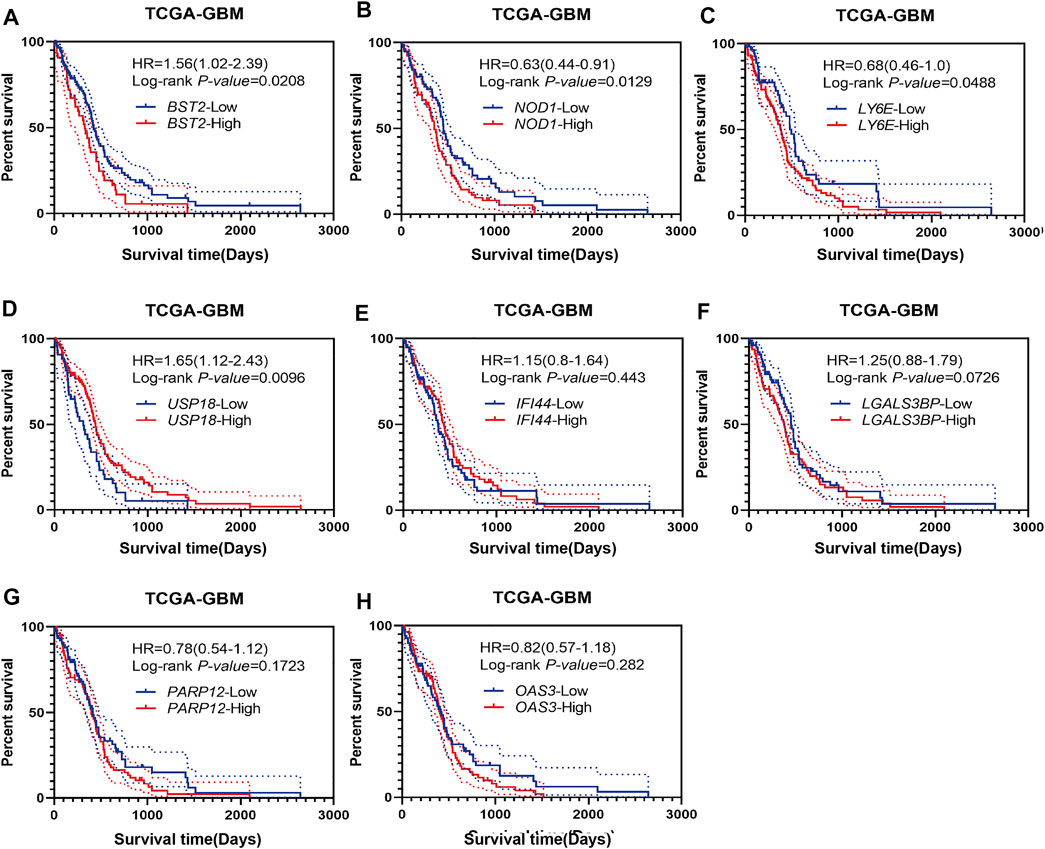
FIGURE 3. Prognostic analysis of intersecting genes in the TCGA-GBM dataset. Kaplan–Meier survival curves for patients based on high and low expression of intersecting genes in GBMs: (A) BST2high vs. BST2low; (B) NOD1high vs. NOD1low; (C) LY6Ehigh vs. LY6Elow; (D) USP18high vs. USP18low; (E) IFI44high vs. IFI44low; (F) LGALS3BPhigh vs. LGALS3BPlow; (G) PARP12high vs. PARP12low and (H) OAS3high vs. OAS3low. High and low expression is based on the median value of expression for that gene.
Increased Expression of BST2 is Associated With Characteristics of Higher Grade Gliomas
We next examined the expression of BST2 based on tumor grade and molecular characteristics of glioma histological and molecular subtypes. First, BST2 in GBM samples was significantly increased compared with normal brain tissue (Figure 4A). Second, the expression level of BST2 significantly increased with increasing pathological grade in tumors from TCGA and Rembrandt databases (Figures 4B,C). Third, BST2 expression was highest in GBMs with the classical molecular subtype, followed by the mesenchymal subtype, and lowest in the proneural subtype based on the data in TCGA and Rembrandt databases (Figures 4D,E). Fourth, patients from the Rembrandt database with high BST2 expressing tumors also exhibited worse prognosis (Figure 4F). Finally, immunohistochemical results from The Human Protein Atlas database (HPA, https://www.proteinatlas.org/) verified that protein levels of BST2 were also increased with increasing tumor grade (Uhlen et al., 2017). Immunohistochemical results indicated that BST2 protein is expressed in the cytoplasm and cell membrane, and immunofluorescence suggested that its subcellular localization is mainly in the Golgi apparatus and cell vesicles (De Palma and Lewis, 2013; Bego et al., 2015).
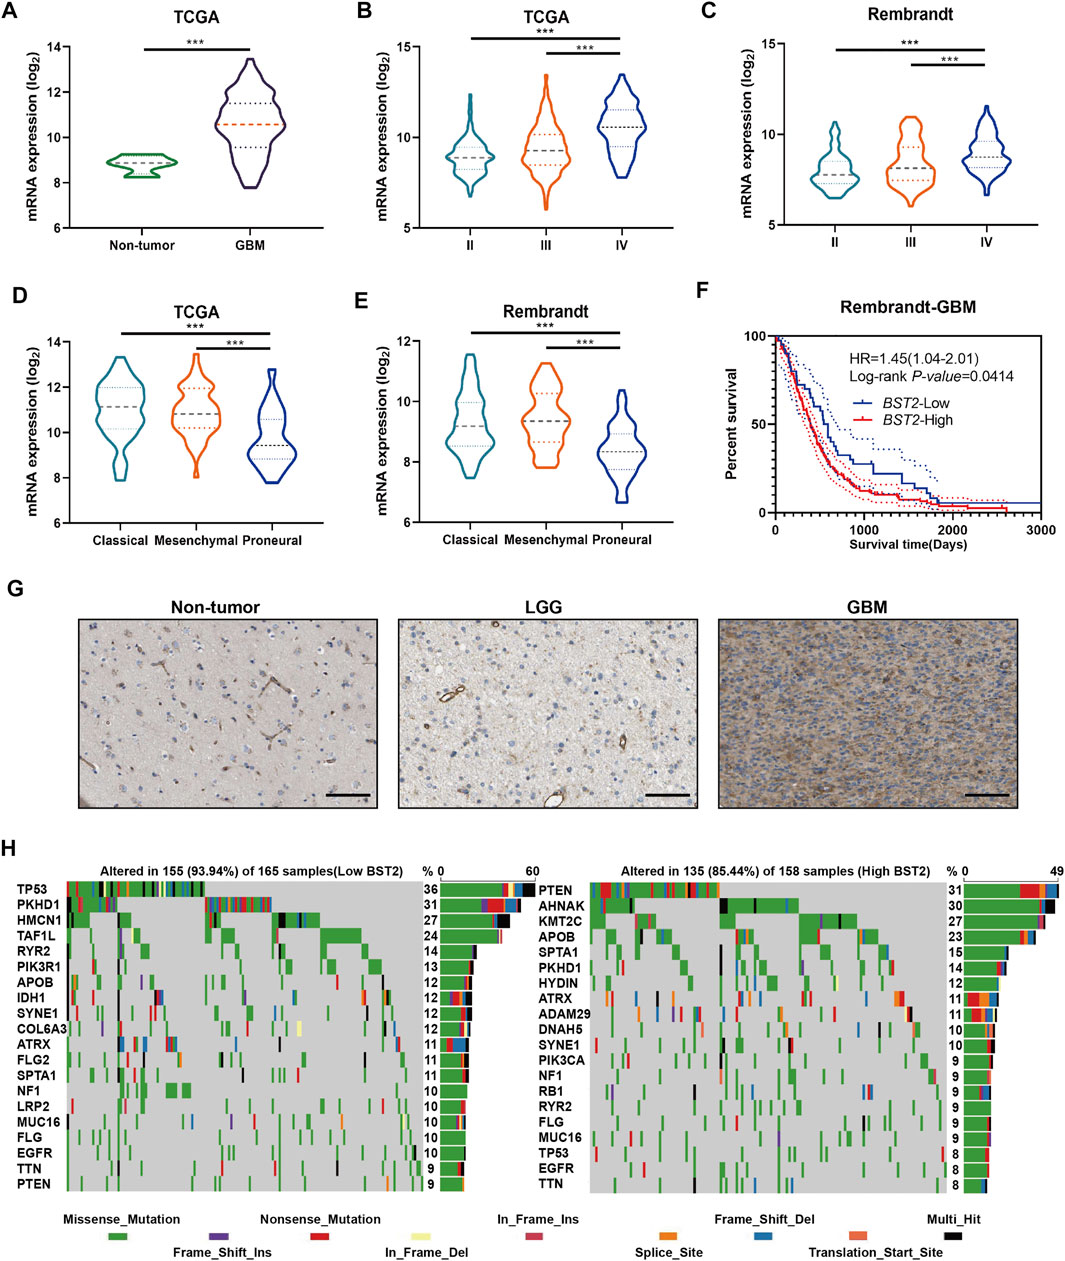
FIGURE 4. BST2 is associated with multiple clinical features. (A) BST2 mRNA levels in non-neoplastic brain relative to GBM tissue samples in the TCGA-glioma dataset. BST2 mRNA expression profiles based on pathological grade from the TCGA-Glioma dataset (B) and Rembrandt-Glioma datasets (C). BST2 mRNA expression profiles based on molecular subtype from the TCGA-Glioma dataset (D) and Rembrandt-Glioma datasets (E). (F) Kaplan–Meier survival curves for GBM patients with BST2high and BST2low tumors using the Rembrandt database. (G) IHC of BST2 in non-neoplastic tissues, low grade glioma (LGG) and GBM. Scale bars: 100 µm. (H) Spectrum of somatic mutations in gliomas from BST2low and BST2high groups in the TCGA-glioma dataset. ∗∗∗p < 0.001.
Considering that BST2 expression was highest in the classical molecular subtype, we examined whether BST2 high expression may be related to specific gene mutations (Figure 4G). Therefore, we downloaded the mutation data from the TCGA-GBM dataset. We divided cases on the basis of high and low expression of BST2 and used the maftools package to identify potential associations between BST2 and driver gene mutations (Figure 4H). In the BST2high tumors, the top 20 genes with the highest gene mutation frequency were PTEN, AHNAK, KMT2C, APOB, SPTA1, PKHD1, HYDIN, ATRX, ADAM29, DNAH5, SYNE1, PIK3CA, NF1, RB1, RYR2, FLG, MUC16, TP53, EGFR, and TTN. In the BST2low tumors, the top 20 genes with the highest gene mutation frequency were TP53, PKHD1, HMCN1, TAF1L, RYR2, PIK3R1, APOB, IDH1, SYNE1, COL6A3, ATRX, FLG2, SPTA1, NF1, LRP2, MUC16, FLG, EGFR, TTN, and PTEN. Among these gene mutations, PTEN and TP53 showed the most significant differences between BST2high and BST2low tumors. In BST2high tumors, the PTEN mutation frequency was 31%. Mutation types in PTEN included the following: missense, nonsense, splice site, and frame shift deletions. However, the frequency of PTEN mutations in BST2low tumors was only 9%. In contrast, the mutation frequency of TP53 was reversed relative to PTEN between the two expression groups: 8% in BST2high tumors and 36% in BST2low tumors.
BST2-Related Genes Are Involved in Immune Response Related Pathways
We next identified and compared the DEGs associated with BST2 expression in GBM patients in the GSE16011, Rembrandt-GBM and TCGA-GBM datasets (Log2 ∣fold change∣≥1, p < 0.05). The analysis yielded 215, 461, and 316 DEGs in GSE16011, Rembrandt-GBM and TCGA-GBM datasets, respectively (Figures 5A–C). Intersection of the DEGs from the three datasets yielded a total of 306 genes (Figure 5D). These resultant genes at the intersection of these three datasets were analyzed in David for KEGG pathway enrichment analysis to identify function (Figure 5E). We found that these genes were mainly enriched in immune response and inflammatory factor-related pathways, such as pertussis, influenza A, herpes simplex infection, toll-like receptor signaling, NF-kB signaling, antigen processing and presentation, chemokine signaling and complement and coagulation cascades.
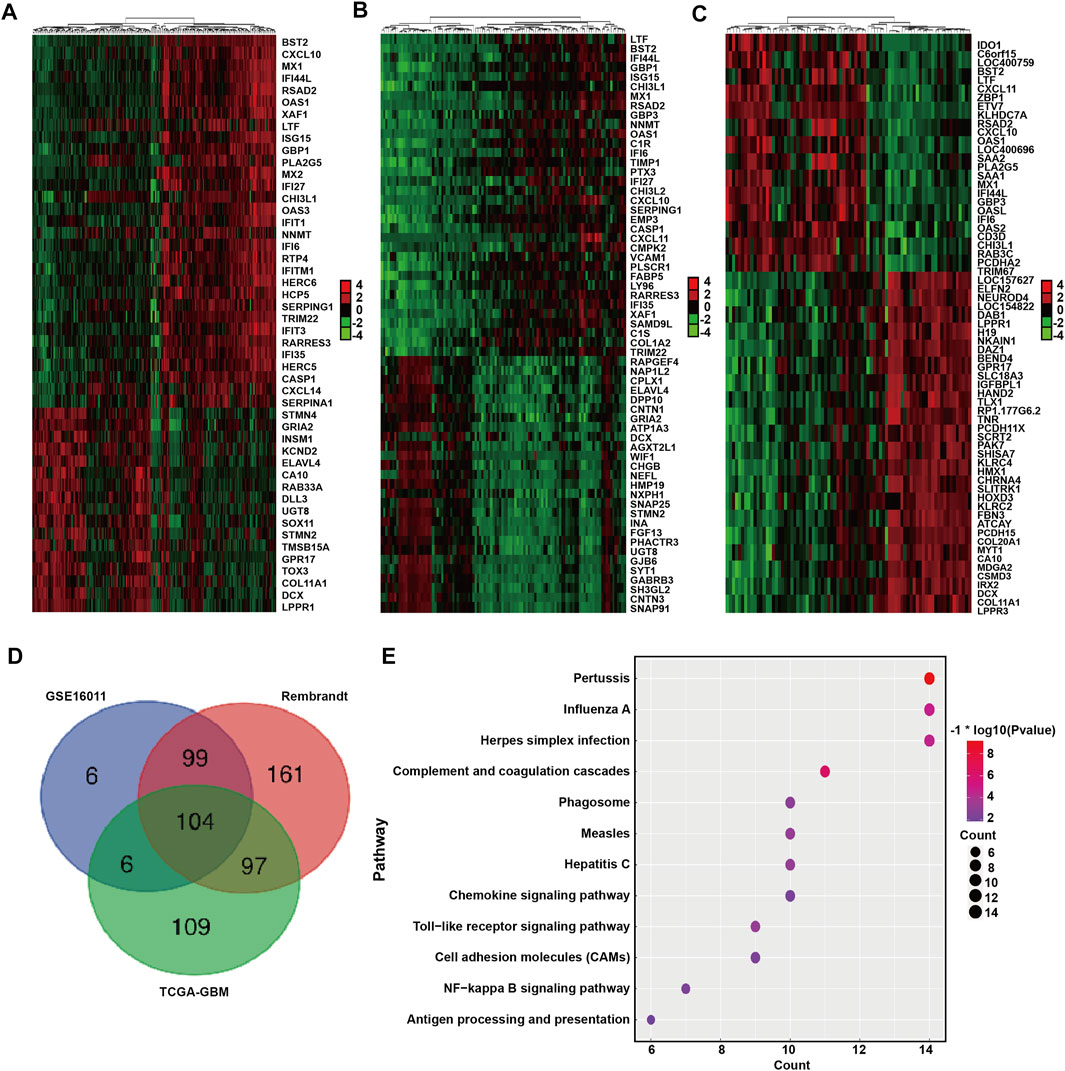
FIGURE 5. DEGs between BST2 high VS. low group related to KEGG immune pathways. Heatmaps generated using mRNA expression levels of partial DEGs based on BST2high and BST2low groups from (A) GSE16011, (B) Rembrandt and (C) TCGA-glioma datasets. Cutoff ratio: Log2 fold change is 1.5, 1.5, and 2.5, respectively; p-value < 0.05. (D) Venn diagram displaying the intersection of DEGs genes for the three datasets. (E) Bubble chart for KEGG pathway enrichment analysis of the intersecting genes.
BST2 is Associated With Immune Cell Infiltration
Because BST2 belongs to the MSigDB molecular tag and the enrichment analysis results revealed that it was related to immune response and cytokines, we explored the relationship of the gene with immune cell infiltration. We converted the expression profiles of the TCGA gliomas to the expression profiles of 22 immune cell types using CIBERSORT (Figure 6A). We also used TIMER to analyze the relationship between BST2 expression and immune infiltration. We found that BST2 was negatively correlated with tumor purity in GBM and low grade gliomas and (correlation coefficients −0.196 and −0.353) (Figures 6B,C). In GBM, the expression of BST2 was negatively correlated with CD8+ T cells (correlation coefficient −0.152), while the expression of BST2 in low grade glioma was positively correlated with CD8+ T cells (correlation coefficient 0.226) (Figures 6D,E). These results are consistent with the idea that a decrease in the number of CD8+ T cells may be related to the progression of gliomas and poor prognosis.
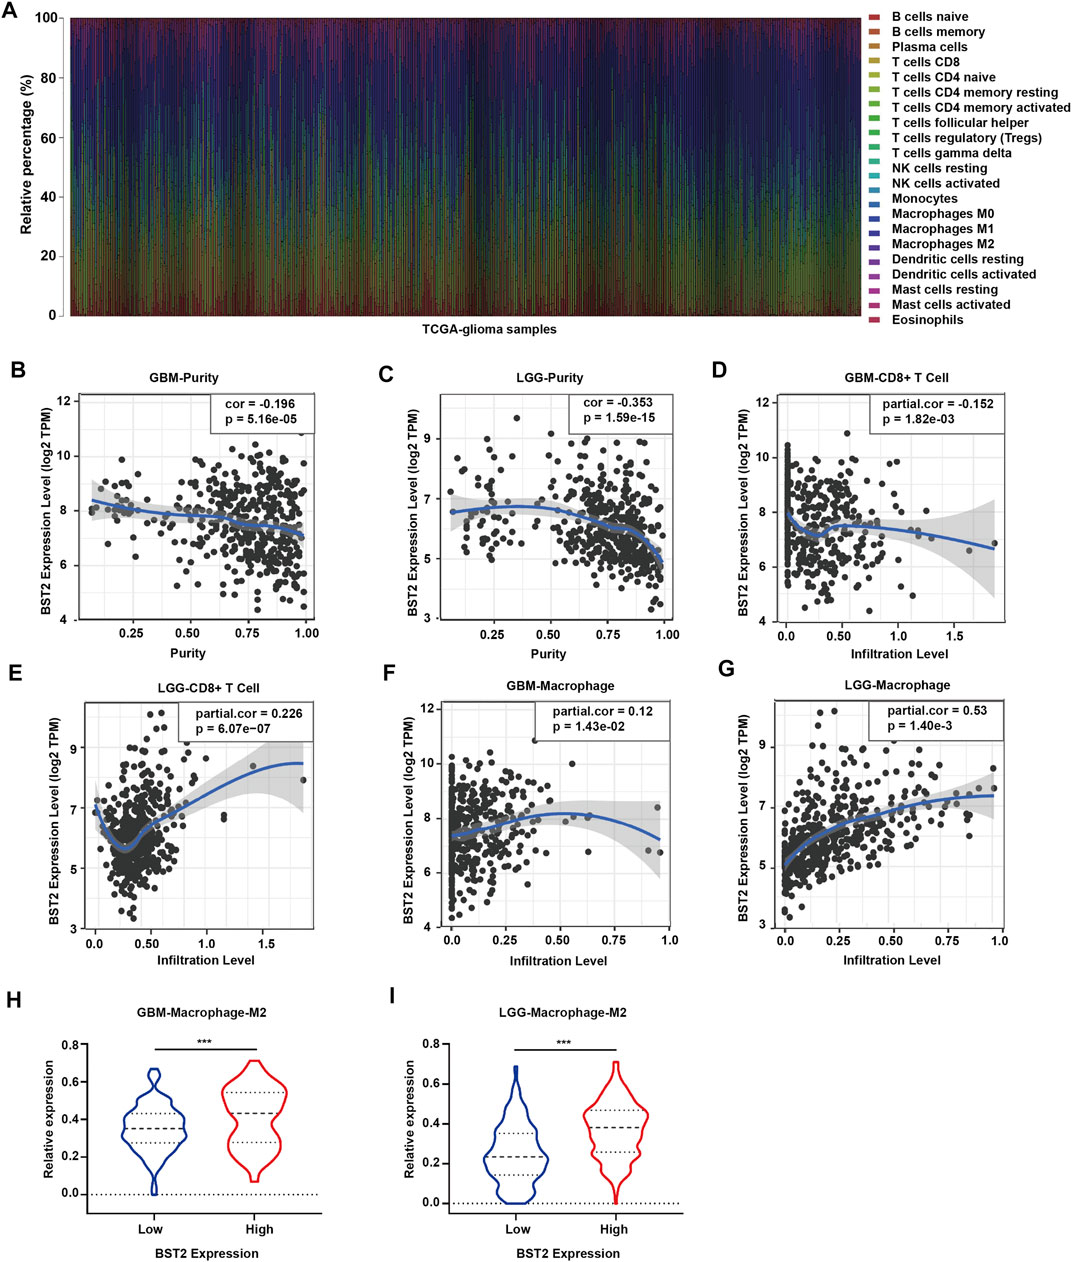
FIGURE 6. The mRNA expression level of BST2 is associated with immune cells. (A) Stacked histogram reflects the relative expression of immune cells based on the mRNA expression profiles from the TCGA-glioma dataset. The correlation between the expression level of BST2 and tumor purity is in (B) GBM and (C) LGG. The correlation between the expression level of BST2 and the relative expression level of CD8+ T cells in GBM (D) and LGG (E). The correlation between the expression level of BST2 and the relative expression level of macrophages in GBM (F) and LGG (G). The violin diagram reflects the expression value of M2 type macrophages in BST2high and BST2low GBM (H) and LGG (I) samples. ∗∗∗p < 0.001.
Macrophages were also positively correlated with GBM and low-grade gliomas (correlation coefficients were 0.12 and 0.53, respectively) (Figures 6F,G). Macrophages are critical players in the human innate immune system. However, under the influence of the tumor microenvironment, the gene expression of macrophages changes, yielding two types of cells, M1 type macrophages (classically activated macrophages, AMs) and M2 type macrophages (alternatively activated macrophages, AAMs) (Mantovani et al., 2002; Martinez et al., 2006). Based on the results of CIBERSORT, we found the M2 macrophage expression profile to be significantly increased in BST2high tumors for both GBM and low grade gliomas (Figures 6H,I).
BST2 is Associated With Other Immune Checkpoint Molecules and Cytokine Genes
One of the characteristics of human tumor cells is that they avoid immune surveillance/destruction. One important mechanism is by affecting immune checkpoints that regulate the level of immune response activation on specific immune cells (Cantrell, 2002; Mantovani et al., 2002). In T cells, immune checkpoints can be divided into co-suppressive immune checkpoints and co-stimulatory immune checkpoints. The former checkpoints, such as PD1, CTLA-4 and VISTA, suppress immunity, and the latter checkpoints, such as CD28, ICOS, and CD137, promote immunity. Cancer cells cleverly influence immune checkpoints to evade immune surveillance. M2 type macrophages also participate in this suppression of the immune response process by secreting many cytokines, including IL-10 and TGF-β, which in addition to suppressing immune response, participate in tissue repair and matrix reconstruction, and promote tumor progression (Xu et al., 2003). We therefore calculated the correlation of the expression of BST2 with immune checkpoint and cytokine genes in the TCGA-GBM data set (Figures 7A,B). Expression of BST2 was closely related to the expression of the following immune checkpoint genes and chemokines: CD226, CD274, CD48, CD40, CD80, CD86, HAVCR2, PDCD1LG2 and TNFRSF14; and VEGFA, TGFBR1, PDGFA, IL1A, EBI3, CXCL10, CSF1, CXCL9, PDGFB and EGF (Figures 7C,D). Finally, we used GSEA to predict that BST2 may promote GBM development through the IL6/JAK/STAT3 signaling, IL2/STAT5 signaling and TNF-α signaling via NF-kB pathways (Figures 7E–G).
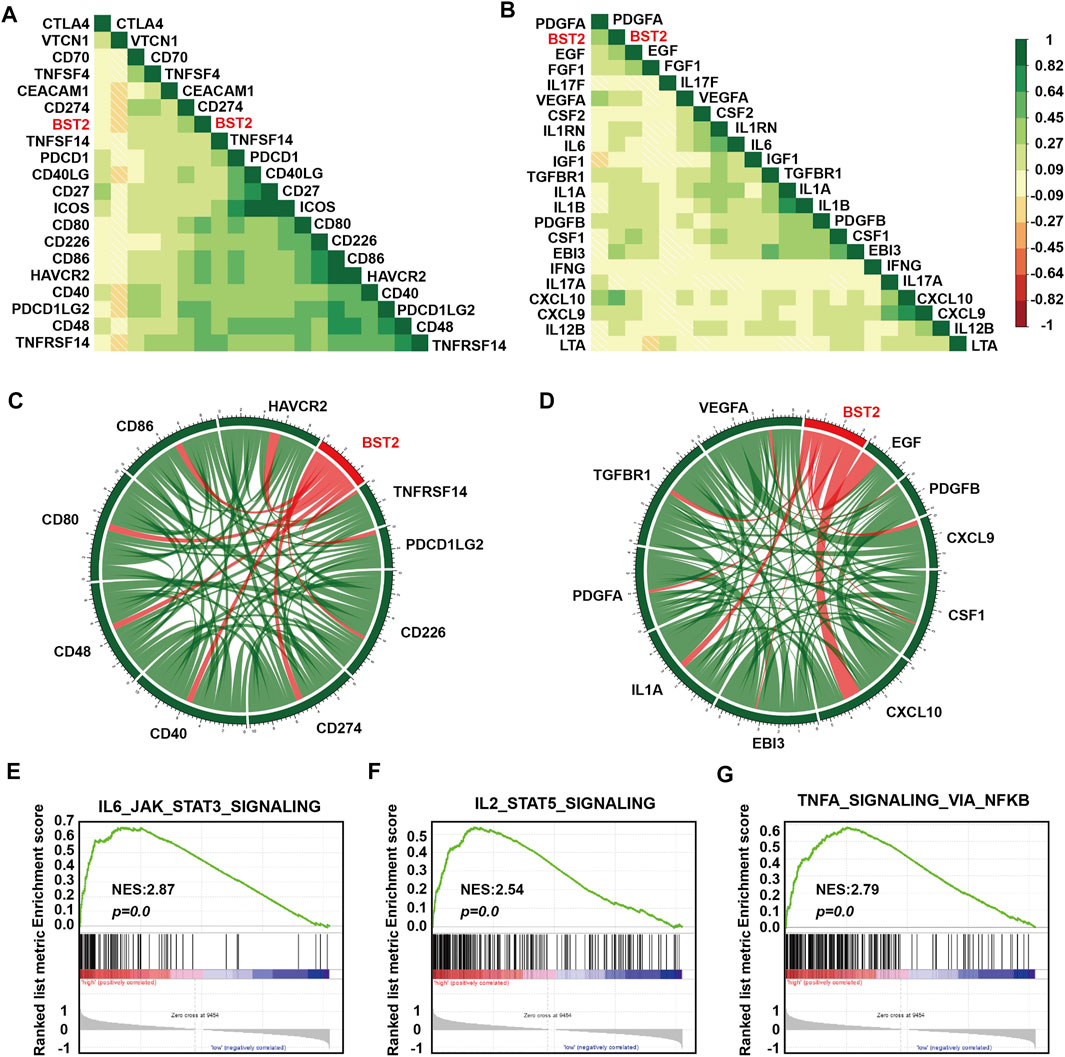
FIGURE 7. BST2 is associated with immune checkpoint and cytokine genes. Corrgrams illustrating Pearson r-values for analysis between BST2 and (A) immune checkpoint genes and (B) cytokine genes in the TCGA-glioma dataset. Chord diagram illustrating correlation between BST2 and top (C) immune checkpoint genes and (D) cytokine genes in the TCGA-glioma dataset. (E–G). GSEA enrichment analysis for IL6_JAK_STAT3_SIGNALING, IL2_STAT5_SIGNALING and the TNF-α signaling via NF-kB pathways pathway signatures in BST2high vs. BST2low samples in the TCGA GBM dataset. Normalized enrichment score (NES) and FDR are shown for each plot.
BST2 is Induced by IFN-γ
We first examined BST2 protein levels in NHA and GBM cell lines. Compared with NHA, BST2 protein expression was significantly higher in U251 but lower in A172 and LN229 cells lines (1.53 ± 0.07 vs. 1.01 ± 0.13, 0.10 ± 0.01 vs. 1.01 ± 0.13, 0.30 ± 0.08 vs. 1.01 ± 0.13, Figures 8A,B). U251 was chosen for knockdown experiments, whereas A172 and LN229 were used for IFN-γ induction experiments. qRCR analysis was used to verify the knockdown efficiency of BST2 (Figure 8C). After induction with IFN-γ (100 ng/ml), the protein expression of BST2 was significantly increased in a time-dependent manner in A172 and LN229 cells (×12 ×−23, Figures 8D,E).
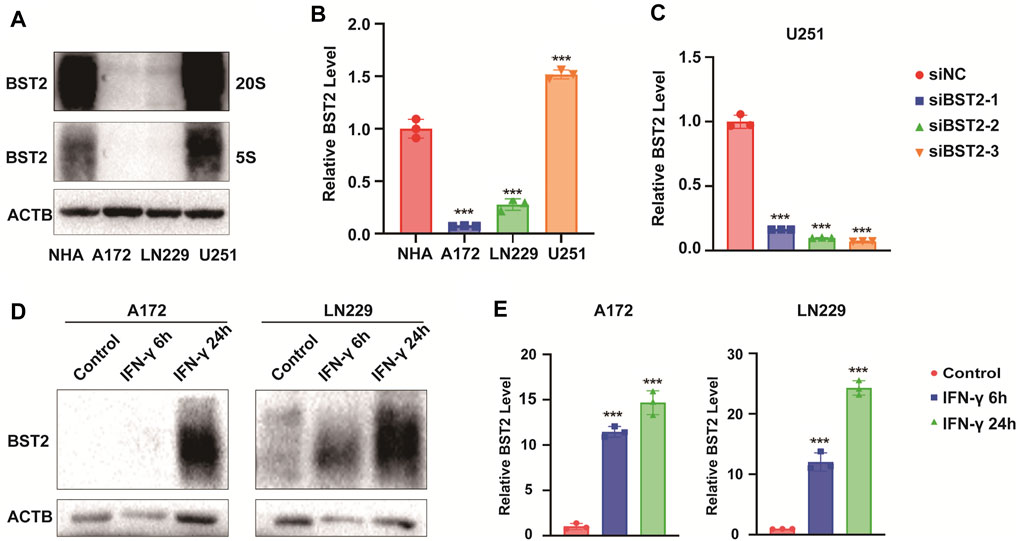
FIGURE 8. BST2 is induced by IFN-γ. (A). Western blotting analysis of BST2 protein levels in NHA, A172, LN229 and U251 at two exposure durations. ACTB was used as an internal reference. (B) Relative quantitation histogram based on bands from western blots. (C) Graphic representation of qRT-PCR after siRNA knockdown of BST2. ACTB was used as an internal reference. (D) Western blotting analysis of BST2 protein levels in A172 and LN229 after IFN-γ treatment. (E) Relative quantitation histogram based on bands from western blots. ACTB was used as an internal reference. ∗∗∗p < 0.001.
BST2 Promotes Proliferation of Glioblastoma Multiforme Cells in vitro
To explore the effect of IFN-γ on GBM viability, GBM cells were treated with IFN-γ. Growth curves based on the CCK-8 assay demonstrated that IFN-γ significantly decreased cell growth in A172 and LN229 cells (Figures 9A,B). The results of the CCK8 assay demonstrated that the viability of U251 cells decreased relative to controls with BST2 knockdown (Figure 9C). The EdU assay confirmed these results. EdU incorporation in IFN-γ-treated A172 and LN229 cells decreased relative to controls (28.84 ± 4.52 vs. 15.69 ± 3.17 and 40.18 ± 4.51 vs. 8.36 ± 1.83, Figures 9D–G). Knockdown of BST2 led to a significant decrease in the percentage of EdU positive cells in U251 cells (Figures 9H,I).
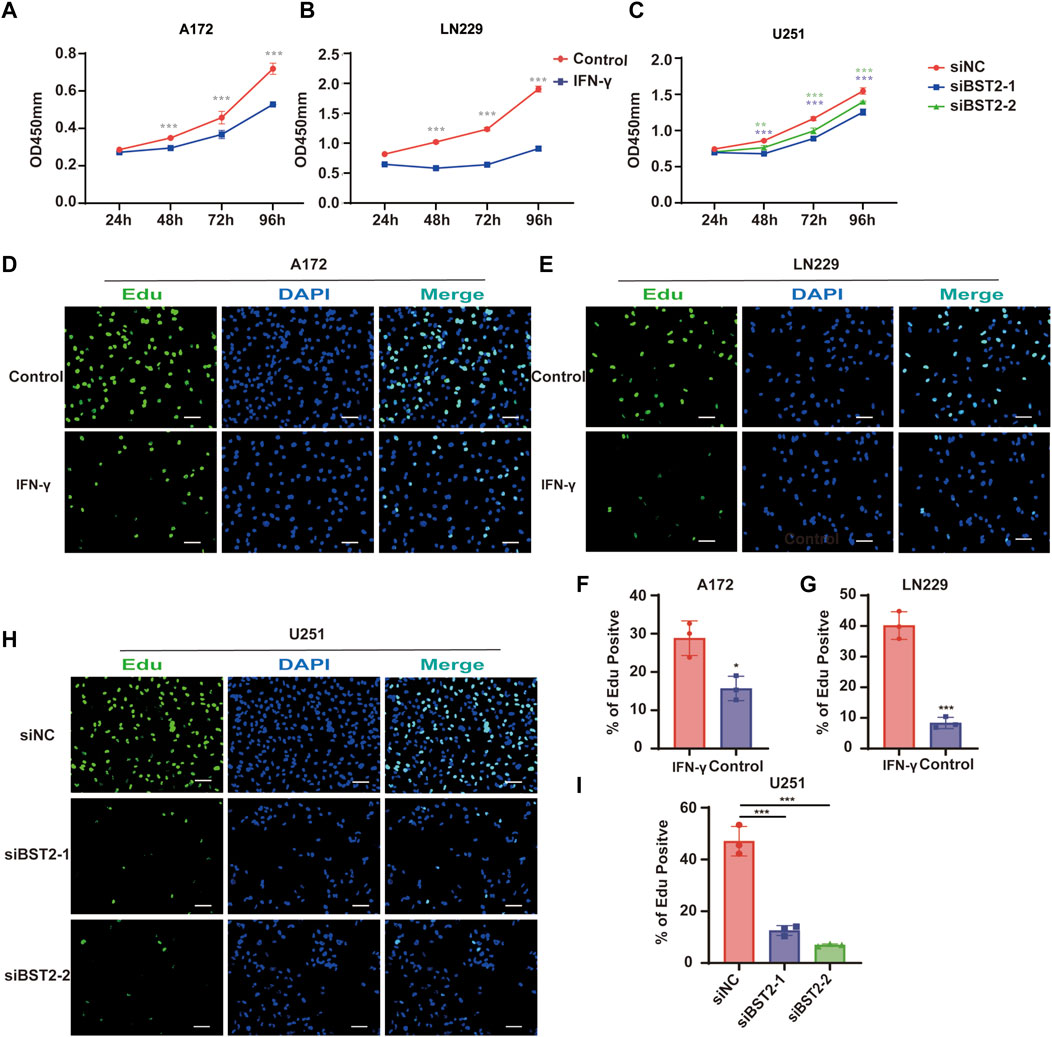
FIGURE 9. BST2 promotes proliferation of GBM cells in vitro. (A,B) Growth curves generated with data from the CCK8 assay after IFN-γ treatment in A172 and LN229 cell lines. (C) OD values from CCK8 assays of U251 plotted over time in hours after transfection of si-control and si-BST2. (D,E) Representative images of EdU assays after IFN-γ treatment of A172 and LN229 cell lines. (F,G) Graphic representation of EdU-positive cells in the above treatment groups. Scale bars: 20 µm. (H) Representative images of EdU assays after transfection of si-control and si-BST2 in U251 cells. Data are represented as the mean ± SD. (I) Graphic representation of EdU-positive cells in si-control and si-BST2 groups. Scale bars: 20 μm ∗p < 0.05; ∗∗∗p < 0.001.
BST2 Promotes Glioblastoma Multiforme Cells Invasion
In Transwell invasion assays, treatment with IFN-γ led to an increased number of A172 and LN229 cells invading the membrane at 24 h (345.3 ± 15.04 vs. 172.7 ± 12.22, 75.67 ± 7.02 vs. 31.67 ± 7.02, Figures 10A–D). In contrast, the number of invaded cells was reduced by nearly 80% in U251 cells with BST2 knockdown (Figures 10E,F).
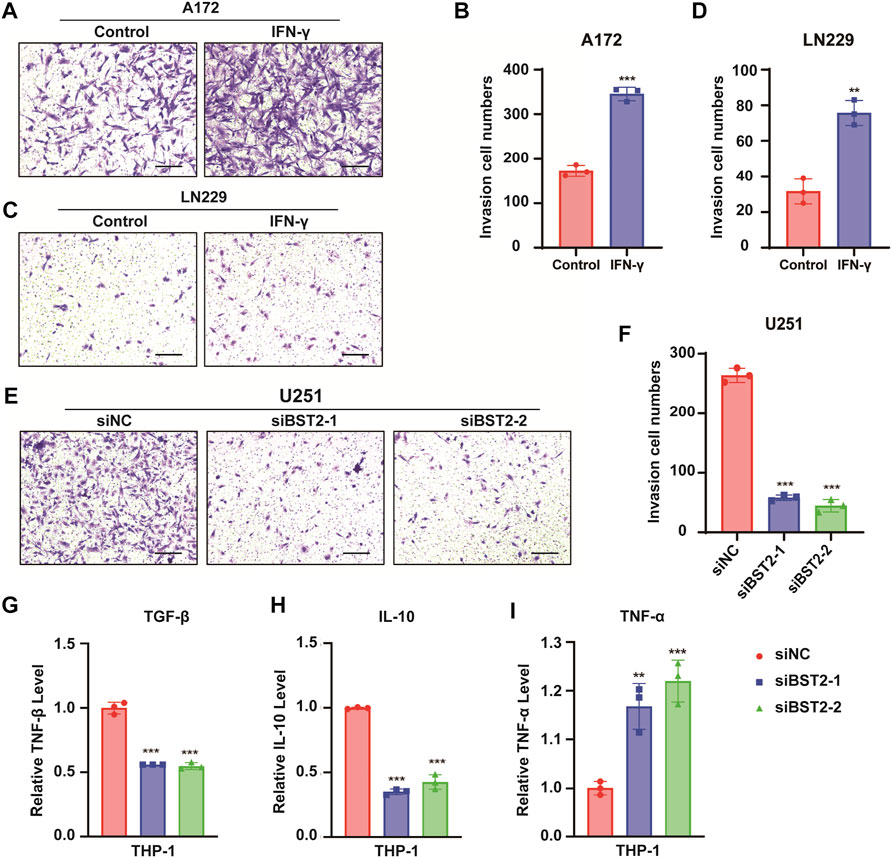
FIGURE 10. BST2 promotes GBM cells invasion. (A,C) Representative images of fixed and stained Transwell invasion assays performed on A172 and LN229 cells after treatment of IFN-γ. (B,D) Graphic representation of migrated and invaded cell counts from Transwell assay. Data are represented as the mean ± SD from three independent experiments. Scale bars:100 µm. (E) Representative images of Transwell invasion for U251 cells with siRNA knockdown of BST2. (F) Graphic representation of migrated cell counts from Transwell assays. Data are represented as the mean ± SD from three independent experiments. Scale bars:100 µm. (G–I) qRT-PCR for the expression levels of TGF-β, IL-10, and TNF-α in macrophages treated with preprocessed supernatant from U251 cells. ∗∗p < 0.01; ∗∗∗p < 0.001.
The supernatant of U251 cells in BST2 knockdown and control groups was collected and mixed 1:1 with complete culture medium to induce differentiation in THP-1 cells. THP1 cells were collected 48 h later, and macrophage program markers were detected by qRT-PCR. Results demonstrated that knockdown of BST2 decreased M2 polarization markers TGF-β and IL-10, but increased the M1 polarization marker TNF-α (Figures 10G–I).
Discussion
Immunotherapy demonstrates the power of mining the tumor microenvironment for new molecular targets in the treatment of human cancer. However, human gliomas reside in a unique tumor microenvironment, attracting both intrinsic and peripheral immune cell types. The molecular characterization of GBMs with an emphasis on their tumor microenvironment may therefore yield approaches to immunotherapy with greater efficacy in the treatment of human gliomas. Here, we distinguished glioma tumor samples on the basis of tumor purity using expression data to identify DEGs and the biological pathways they are associated with. Our analysis yielded several genes involved in IFN signaling, such as BST2. High expression of BST2 was associated with low tumor purity, increasing tumor grade and decreased numbers of CD8+ T cells in GBM. We found the gene to be associated with other immune checkpoint genes, which highlights BST2 as another molecular target for immunotherapy tailored for human gliomas.
Numerous studies show that interferons inhibit tumor growth. IFN-γ has been shown to effectively inhibit the growth of tumor cells by inducing G1 phase arrest, apoptosis (Höpfner et al., 2004), and metastasis (Sun et al., 2021). Interferons also have a role in tumor immunosuppression. IFN-γ promoted the accumulation of CXCR3+ lymphocytes in tumor tissues, which exhibited anti-tumor immune properties (Li et al., 2018). IFN-γ also directly up-regulated functional MHC class I molecules on human GBMs, which led to increased immunogenicity (Yang et al., 2004). In contrast, suppression of the production of IFN and other proinflammatory cytokines through BST2-ILT7 interactions in plasmacytoid dendritic cells may contribute to tumor tolerance (Cao et al., 2009). Therefore, IFN-γ treatment of GBM and the role of BST2 in IFN-γ treatment warrant further study.
The IFN-inducible factor BST2 has emerged as an important component of the antiviral immune response. BST2 is a negative regulator of the type I IFN signaling pathway and inhibits the release of diverse enveloped viral particles from infected cells (Perez-Caballero et al., 2009; Swiecki et al., 2012). Many factors have been implicated in the up-regulation of BST2 expression, notably IFN-α (Jones et al., 2013), IFN-γ (Yoo et al., 2011), and even viral infections (Homann et al., 2011). However, chronic infection with Mouse mammary tumor virus has also been shown to suppress both IFNα and IFN-γ, while BST2 remains elevated in breast cancer (Jones et al., 2013). BST2 expression is also significantly higher in various tumors than in the corresponding normal tissues (Wainwright et al., 2011; Sayeed et al., 2013; Kuang et al., 2017).
BST2 function has been previously investigated in a variety of human cancers. BST2 has been shown to activate EGFR and the initiation of downstream signaling pathways by regulating its association with lipid rafts in hepatocellular carcinoma and to be involved in resistance to tumor cell death and chemotherapy (Zhang et al., 2019b). BST2 has also been proposed as a tumor-associated antigen in some tumor cell lines (Gong et al., 2015; Yang et al., 2018). Finally, the expression of BST2 was found to be increased during brain tumor progression in an orthotopic mouse tumor model where it was mainly located in the cell membrane and cytoplasm (Wainwright et al., 2011). All together, these results indicate that interfering with BST2 may be a valuable strategy in the treatment of GBM. In fact in B-cell lymphoma, targeting BST2 with two independent monoclonal antibodies delayed tumor growth in a syngeneic mouse model of the disease (Gong et al., 2015). Other studies have also demonstrated that inhibiting BST2 can achieve the effect of inhibiting tumor cell growth or inducing cell death (Sayeed et al., 2013; Mahauad-Fernandez and Okeoma, 2017). However, BST2 silencing and immunotherapy did not improve the overall survival of tumor bearing mice in an orthotopic mouse brain tumor model (Wainwright et al., 2011). This result might be possibly due to the fact that GBM is protected from normal immune surveillance because of the blood-brain-barrier, the lack of lymphatic drainage and low expression of MHC II expression. Therefore, the role of BST2 in the development of GBM requires further study.
Immune checkpoint inhibitors have achieved remarkable outcomes in the treatment of a variety of solid human tumors. Checkpoint inhibitors target the immunomodulatory effect of cytotoxic T lymphocyte–associated protein 4 (CTLA-4) and programmed death-1 (PD-1)/programmed death-ligand 1 (PD-L1) restoring effector T-cell function and antitumor activity (Smyth et al., 2016; Ramos-Casals et al., 2020). CTLA-4 is mainly expressed on activated T cells, which binds to CD80 and transmits inhibitory signals to cause immunosuppression. Tumor-associated macrophages/microglia (TAMs) are a major stromal cell component in GBM(37). PD-1 is expressed by human TAMs and inhibits tumor immunity. We found that BST2 was positively correlated with several immune checkpoint genes, including PD1, ICOS, CD80, CD226, CD86, HAVCR2, CD40, PDCD1LG2, CD48, and TNFRSF14. The expression of BST2 was positively correlated with the expression of M2 type macrophages in all grades of gliomas, but the amount of CD8+ T cells exhibited inconsistent results, which highlights the complexity of the microenvironment of gliomas. A series of clinical trials investigating efficacy of checkpoint inhibitors in GBM showed that only a small subset of patients (8%) demonstrated objective responses (Buerki et al., 2018). One possibility for this result is the lower tumor mutational burden of GBM (Brennan et al., 2013) and the low level of T-cell infiltration (Woroniecka et al., 2018). Since IFN induces the immunogenicity of GBM and promotes the infiltration of immune cells, treatment with IFN might improve the efficacy of immune checkpoint inhibitors in GBM patients. Finally, considering the relationship between BST2 and these immune checkpoint genes, the inhibition of BST2 may also improve the efficacy of immune checkpoint inhibitors in the treatment of GBM.
Other genes related to IFN-γ may also promote the development of human GBM. Ly6E is a member of a multigene family of glycosylphosphatidylinositol-anchored cell surface proteins and is considered a stem/progenitor cell marker (Bacquin et al., 2017). Overexpression of Ly6E promoted cancer cell growth and metastasis in gastric cancer (Lv et al., 2018), drug resistance and immune escape in breast cancer, and TGF-β-induced PD-L1 activation and binding of NK cells to cancer cells (AlHossiny et al., 2016). An LY6E antibody drug conjugate (ADC) was found to inhibit cell proliferation and produced long-lasting tumor regression in multiple solid tumor xenograft models (Asundi et al., 2015). LGALS3BP has been found to be elevated in the serum of patients with cancer. The protein might have a role in centriole biogenesis, NK cell immune response and cell-matrix interactions. Expression of the 90K immunostimulatory antigen LGALS3BP has been inversely correlated with the tumorigenicity of mammary carcinoma, GBM, and other tumor-derived cell lines in athymic mice (Fogeron et al., 2013; Stampolidis et al., 2015; Zhou et al., 2015). Thus, several of these correlated genes may be important in the study of human GBM.
In summary, we analyzed the GBM expression data in the TCGA, Rembrandt and GSE16011 datasets and found tumor purity to be closely related to prognosis. IFN was one of the differentially expressed genes between high and low tumor purity in GBM. A gene correlated with IFN expression was BST2 which we found to be positively correlated with multiple immune checkpoint genes and negatively correlated with tumor purity, CD8+ T cells, and M2 type macrophages. Finally, a series of experiments confirmed that the expression of BST2 can be significantly induced by IFN, and knockdown of BST2 can significantly inhibit the growth and invasion of GBM cells. Loss of BST2 also affects the phenotype of tumor-associated macrophages. Thus, targeting BST2 might be considered as a viable therapeutic strategy in the treatment of human GBM.
Data Availability Statement
The original contributions presented in the study are included in the article/supplementary material, further inquiries can be directed to the corresponding author.
Author Contributions
YK, HW and BH conceived the study. ZX conducted cell experiments. KY and HW were involved in bioinformatics analysis. AC and JL performed the statistical analysis. YK and BH drafted the paper. GC, XL, JW and JL contributed substantially to its revision. All authors read and approved the final manuscript.
Funding
This work was supported by the Clinical Research Center of Shandong University (2020SDUCRCB002), the Natural Science Foundation of China (81972351), the National “111” Project (B20058), the Special Foundation for Taishan Scholars (ts20110814, tshw201502056, and tsqn201909173), the Department of Science & Technology of Shandong Province (ZR2019ZD33), the China Postdoctoral Science Foundation (2020T130371), the Jinan Science and Technology Bureau of Shandong Province (2019GXRC006), the Research Project of Jinan Microecological Biomedicine Shandong Laboratory (JNL-2022003A, JNL-2022042C) and the Shandong Research Institute of Industrial Technology.
Conflict of Interest
The authors declare that the research was conducted in the absence of any commercial or financial relationships that could be construed as a potential conflict of interest.
Publisher’s Note
All claims expressed in this article are solely those of the authors and do not necessarily represent those of their affiliated organizations, or those of the publisher, the editors and the reviewers. Any product that may be evaluated in this article, or claim that may be made by its manufacturer, is not guaranteed or endorsed by the publisher.
Acknowledgments
We would like to thank our investigators for their hard work and reviewers for their valuable advice.
References
Aldape, K., Brindle, K. M., Chesler, L., Chopra, R., Gajjar, A., Gilbert, M. R., et al. (2019). Challenges to Curing Primary Brain Tumours. Nat. Rev. Clin. Oncol. 16 (8), 509–520. Epub 2019/02/09. doi:10.1038/s41571-019-0177-5
AlHossiny, M., Luo, L., Frazier, W. R., Steiner, N., Gusev, Y., Kallakury, B., et al. (2016). Ly6E/K Signaling to TGFβ Promotes Breast Cancer Progression, Immune Escape, and Drug Resistance. Cancer Res. 76 (11), 3376–3386. doi:10.1158/0008-5472.CAN-15-2654
Appin, C. L., and Brat, D. J. (2015). Molecular Pathways in Gliomagenesis and Their Relevance to Neuropathologic Diagnosis. Adv. Anat. Pathol. 22 (1), 50–58. Epub 2014/12/03. doi:10.1097/PAP.0000000000000048
Asundi, J., Crocker, L., Tremayne, J., Chang, P., Sakanaka, C., Tanguay, J., et al. (2015). An Antibody-Drug Conjugate Directed against Lymphocyte Antigen 6 Complex, Locus E (Ly6e) Provides Robust Tumor Killing in a Wide Range of Solid Tumor Malignancies. Clin. cancer Res. official J. Am. Assoc. Cancer Res. 21 (14), 3252–3262. doi:10.1158/1078-0432.CCR-15-0156
Bacquin, A., Bireau, C., Tanguy, M., Romanet, C., Vernochet, C., Dupressoir, A., et al. (2017). A Cell Fusion-Based Screening Method Identifies Glycosylphosphatidylinositol-Anchored Protein Ly6e as the Receptor for Mouse Endogenous Retroviral Envelope Syncytin-A. J. Virol. 91 (18). doi:10.1128/JVI.00832-17
Bego, M. G., Côté, É., Aschman, N., Mercier, J., Weissenhorn, W., and Cohen, É. A. (2015). Vpu Exploits the Cross-Talk between BST2 and the ILT7 Receptor to Suppress Anti-HIV-1 Responses by Plasmacytoid Dendritic Cells. PLoS Pathog. 11 (7), e1005024. doi:10.1371/journal.ppat.1005024
Brennan, C. W., Verhaak, R. G., McKenna, A., Campos, B., Noushmehr, H., Salama, S. R., et al. (2013). The Somatic Genomic Landscape of Glioblastoma. Cell 155 (2), 462–477. doi:10.1016/j.cell.2013.09.034
Buerki, R. A., Chheda, Z. S., and Okada, H. (2018). Immunotherapy of Primary Brain Tumors: Facts and Hopes. Clin. cancer Res. official J. Am. Assoc. Cancer Res. 24 (21), 5198–5205. doi:10.1158/1078-0432.CCR-17-2769
Cancer Genome Atlas Research Network (2008). Comprehensive Genomic Characterization Defines Human Glioblastoma Genes and Core Pathways. Nature 455 (7216), 1061–1068. Epub 2008/09/06. doi:10.1038/nature07385
Cantrell, D. A. (2002). Transgenic Analysis of Thymocyte Signal Transduction. Nat. Rev. Immunol. 2 (1), 20–27. Epub 2002/03/22. doi:10.1038/nri703
Cao, W., Bover, L., Cho, M., Wen, X., Hanabuchi, S., Bao, M., et al. (2009). Regulation of Tlr7/9 Responses in Plasmacytoid Dendritic Cells by Bst2 and Ilt7 Receptor Interaction. J. Exp. Med. 206 (7), 1603–1614. doi:10.1084/jem.20090547
Chasov, V., Zaripov, M., Mirgayazova, R., Khadiullina, R., Zmievskaya, E., Ganeeva, I., et al. (2021). Promising New Tools for Targeting P53 Mutant Cancers: Humoral and Cell-Based Immunotherapies. Front. Immunol. 12, 707734. doi:10.3389/fimmu.2021.707734
De Palma, M., and Lewis, C. E. (2013). Macrophage Regulation of Tumor Responses to Anticancer Therapies. Cancer Cell 23 (3), 277–286. Epub 2013/03/23. doi:10.1016/j.ccr.2013.02.013
Fares, J., Ahmed, A. U., Ulasov, I. V., Sonabend, A. M., Miska, J., Lee-Chang, C., et al. (2021). Neural Stem Cell Delivery of an Oncolytic Adenovirus in Newly Diagnosed Malignant Glioma: A First-In-Human, Phase 1, Dose-Escalation Trial. Lancet Oncol. 22 (8), 1103–1114. Epub 2021/07/03. doi:10.1016/S1470-2045(21)00245-X
Fogeron, M.-L., Müller, H., Schade, S., Dreher, F., Lehmann, V., Kühnel, A., et al. (2013). Lgals3bp Regulates Centriole Biogenesis and Centrosome Hypertrophy in Cancer Cells. Nat. Commun. 4, 1531. doi:10.1038/ncomms2517
Gong, S., Osei, E. S., Kaplan, D., Chen, Y. H., and Meyerson, H. (2015). Cd317 is Over-Expressed in B-Cell Chronic Lymphocytic Leukemia, but Not B-Cell Acute Lymphoblastic Leukemia. Int. J. Clin. Exp. Pathol. 8 (2), 1613–1621. Epub 2015/05/15.
Gravendeel, L. A. M., Kouwenhoven, M. C. M., Gevaert, O., de Rooi, J. J., Stubbs, A. P., Duijm, J. E., et al. (2009). Intrinsic Gene Expression Profiles of Gliomas Are a Better Predictor of Survival Than Histology. Cancer Res. 69 (23), 9065–9072. doi:10.1158/0008-5472.CAN-09-2307
Gu, Z., Gu, L., Eils, R., Schlesner, M., and Brors, B. (2014). Circlize Implements and Enhances Circular Visualization in R. Bioinformatics 30 (19), 2811–2812. Epub 2014/06/16. doi:10.1093/bioinformatics/btu393
Gusev, Y., Bhuvaneshwar, K., Song, L., Zenklusen, J.-C., Fine, H., and Madhavan, S. (2018). The Rembrandt Study, a Large Collection of Genomic Data from Brain Cancer Patients. Sci. Data 5, 180158. Epub 2018/08/15. doi:10.1038/sdata.2018.158
Homann, S., Smith, D., Little, S., Richman, D., and Guatelli, J. (2011). Upregulation of Bst-2/Tetherin by Hiv Infection In Vivo. J. Virol. 85 (20), 10659–10668. doi:10.1128/JVI.05524-11
Höpfner, M., Sutter, A. P., Huether, A., Ahnert-Hilger, G., and Scherübl, H. (2004). A Novel Approach in the Treatment of Neuroendocrine Gastrointestinal Tumors: Additive Antiproliferative Effects of Interferon-γ and Meta-Iodobenzylguanidine. BMC Cancer 4, 23. Epub 2004/05/25. doi:10.1186/1471-2407-4-23
Huang, D. W., Sherman, B. T., and Lempicki, R. A. (2009). Systematic and Integrative Analysis of Large Gene Lists Using David Bioinformatics Resources. Nat. Protoc. 4 (1), 44–57. doi:10.1038/nprot.2008.211
Jones, P. H., Mahauad-Fernandez, W. D., Madison, M. N., and Okeoma, C. M. (2013). Bst-2/Tetherin Is Overexpressed in Mammary Gland and Tumor Tissues in Mmtv-Induced Mammary Cancer. Virology 444 (1-2), 124–139. doi:10.1016/j.virol.2013.05.042
Krishna, S., Lowery, F. J., Copeland, A. R., Bahadiroglu, E., Mukherjee, R., Jia, L., et al. (2020). Stem-Like Cd8 T Cells Mediate Response of Adoptive Cell Immunotherapy against Human Cancer. Science 370 (6522), 1328–1334. Epub 2020/12/12. doi:10.1126/science.abb9847
Kuang, C.-m., Fu, X., Hua, Y.-j., Shuai, W.-d., Ye, Z.-h., Li, Y., et al. (2017). BST2 Confers Cisplatin Resistance via NF-κB Signaling in Nasopharyngeal Cancer. Cell Death Dis. 8 (6), e2874. doi:10.1038/cddis.2017.271
Li, J., Ybarra, R., Mak, J., Herault, A., De Almeida, P., Arrazate, A., et al. (2018). IFNγ-induced Chemokines Are Required for CXCR3-Mediated T-Cell Recruitment and Antitumor Efficacy of Anti-HER2/CD3 Bispecific Antibody. Clin. cancer Res. official J. Am. Assoc. Cancer Res. 24 (24), 6447–6458. doi:10.1158/1078-0432.CCR-18-1139
Li, T., Fu, J., Zeng, Z., Cohen, D., Li, J., Chen, Q., et al. (2020). Timer2.0 for Analysis of Tumor-Infiltrating Immune Cells. Nucleic acids Res. 48, W509–W514. doi:10.1093/nar/gkaa407
Lv, Y., Song, Y., Ni, C., Wang, S., Chen, Z., Shi, X., et al. (2018). Overexpression of Lymphocyte Antigen 6 Complex, Locus E in Gastric Cancer Promotes Cancer Cell Growth and Metastasis. Cell Physiol. Biochem. 45 (3), 1219–1229. doi:10.1159/000487453
Mahauad-Fernandez, W. D., and Okeoma, C. M. (2017). Cysteine-Linked Dimerization of Bst-2 Confers Anoikis Resistance to Breast Cancer Cells by Negating Proapoptotic Activities to Promote Tumor Cell Survival and Growth. Cell Death Dis. 8 (3), e2687. doi:10.1038/cddis.2017.68
Mantovani, A., Sozzani, S., Locati, M., Allavena, P., and Sica, A. (2002). Macrophage Polarization: Tumor-Associated Macrophages as a Paradigm for Polarized M2 Mononuclear Phagocytes. Trends Immunol. 23 (11), 549–555. Epub 2002/10/29. doi:10.1016/s1471-4906(02)02302-5
Martinez, F. O., Gordon, S., Locati, M., and Mantovani, A. (2006). Transcriptional Profiling of the Human Monocyte-To-Macrophage Differentiation and Polarization: New Molecules and Patterns of Gene Expression. J. Immunol. 177 (10), 7303–7311. Epub 2006/11/04. doi:10.4049/jimmunol.177.10.7303
Mayakonda, A., Lin, D.-C., Assenov, Y., Plass, C., and Koeffler, H. P. (2018). Maftools: Efficient and Comprehensive Analysis of Somatic Variants in Cancer. Genome Res. 28 (11), 1747–1756. doi:10.1101/gr.239244.118
Medrano, R. F. V., Hunger, A., Mendonça, S. A., Barbuto, J. A. M., and Strauss, B. E. (2017). Immunomodulatory and Antitumor Effects of Type I Interferons and Their Application in Cancer Therapy. Oncotarget 8 (41), 71249–71284. doi:10.18632/oncotarget.19531
Newman, A. M., Liu, C. L., Green, M. R., Gentles, A. J., Feng, W., Xu, Y., et al. (2015). Robust Enumeration of Cell Subsets from Tissue Expression Profiles. Nat. Methods 12 (5), 453–457. doi:10.1038/nmeth.3337
Ni, C., Wu, P., Zhu, X., Ye, J., Zhang, Z., Chen, Z., et al. (2013). IFN-γ Selectively Exerts Pro-apoptotic Effects on Tumor-Initiating Label-Retaining Colon Cancer Cells. Cancer Lett. 336 (1), 174–184. Epub 2013/05/07. doi:10.1016/j.canlet.2013.04.029
Ogata, H., Goto, S., Sato, K., Fujibuchi, W., Bono, H., and Kanehisa, M. (1999). Kegg: Kyoto Encyclopedia of Genes and Genomes. Nucleic acids Res. 27 (1), 29–34. Epub 1998/12/10. doi:10.1093/nar/27.1.29
Perez-Caballero, D., Zang, T., Ebrahimi, A., McNatt, M. W., Gregory, D. A., Johnson, M. C., et al. (2009). Tetherin Inhibits Hiv-1 Release by Directly Tethering Virions to Cells. Cell 139 (3), 499–511. doi:10.1016/j.cell.2009.08.039
Pyonteck, S. M., Akkari, L., Schuhmacher, A. J., Bowman, R. L., Sevenich, L., Quail, D. F., et al. (2013). Csf-1r Inhibition Alters Macrophage Polarization and Blocks Glioma Progression. Nat. Med. 19 (10), 1264–1272. doi:10.1038/nm.3337
Ramos-Casals, M., Brahmer, J. R., Callahan, M. K., Flores-Chávez, A., Keegan, N., Khamashta, M. A., et al. (2020). Immune-Related Adverse Events of Checkpoint Inhibitors. Nat. Rev. Dis. Prim. 6 (1), 38. doi:10.1038/s41572-020-0160-6
Reifenberger, G., Wirsching, H.-G., Knobbe-Thomsen, C. B., and Weller, M. (2017). Advances in the Molecular Genetics of Gliomas - Implications for Classification and Therapy. Nat. Rev. Clin. Oncol. 14 (7), 434–452. Epub 2016/12/30. doi:10.1038/nrclinonc.2016.204
Robinson, M. D., McCarthy, D. J., and Smyth, G. K. (2010). Edger: A Bioconductor Package for Differential Expression Analysis of Digital Gene Expression Data. Bioinformatics 26 (1), 139–140. doi:10.1093/bioinformatics/btp616
Sayeed, A., Luciani-Torres, G., Meng, Z., Bennington, J. L., Moore, D. H., and Dairkee, S. H. (2013). Aberrant Regulation of the Bst2 (Tetherin) Promoter Enhances Cell Proliferation and Apoptosis Evasion in High Grade Breast Cancer Cells. PloS one 8 (6), e67191. doi:10.1371/journal.pone.0067191
Shergalis, A., Bankhead, A., Luesakul, U., Muangsin, N., and Neamati, N. (2018). Current Challenges and Opportunities in Treating Glioblastoma. Pharmacol. Rev. 70 (3), 412–445. doi:10.1124/pr.117.014944
Shiraishi, S., Tada, K., Nakamura, H., Makino, K., Kochi, M., Saya, H., et al. (2002). Influence Ofp53 Mutations on Prognosis of Patients with Glioblastoma. Cancer 95 (2), 249–257. doi:10.1002/cncr.10677
Singh, A. K., and McGuirk, J. P. (2020). Car T Cells: Continuation in a Revolution of Immunotherapy. Lancet Oncol. 21 (3), e168–e178. doi:10.1016/S1470-2045(19)30823-X
Smyth, M. J., Ngiow, S. F., Ribas, A., and Teng, M. W. L. (2016). Combination Cancer Immunotherapies Tailored to the Tumour Microenvironment. Nat. Rev. Clin. Oncol. 13 (3), 143–158. doi:10.1038/nrclinonc.2015.209
Song, M., Ping, Y., Zhang, K., Yang, L., Li, F., Zhang, C., et al. (2019). Low-Dose IFNγ Induces Tumor Cell Stemness in Tumor Microenvironment of Non-Small Cell Lung Cancer. Cancer Res. 79 (14), 3737–3748. Epub 2019/05/16. doi:10.1158/0008-5472.CAN-19-0596
Stampolidis, P., Ullrich, A., and Iacobelli, S. (2015). Lgals3bp, Lectin Galactoside-Binding Soluble 3 Binding Protein, Promotes Oncogenic Cellular Events Impeded by Antibody Intervention. Oncogene 34 (1), 39–52. doi:10.1038/onc.2013.548
Stupp, R., Mason, W. P., van den Bent, M. J., Weller, M., Fisher, B., Taphoorn, M. J. B., et al. (2005). Radiotherapy Plus Concomitant and Adjuvant Temozolomide for Glioblastoma. N. Engl. J. Med. 352 (10), 987–996. Epub 2005/03/11. doi:10.1056/NEJMoa043330
Subramanian, A., Tamayo, P., Mootha, V. K., Mukherjee, S., Ebert, B. L., Gillette, M. A., et al. (2005). Gene Set Enrichment Analysis: A Knowledge-Based Approach for Interpreting Genome-Wide Expression Profiles. Proc. Natl. Acad. Sci. U.S.A. 102 (43), 15545–15550. doi:10.1073/pnas.0506580102
Sun, L., Kees, T., Almeida, A. S., Liu, B., He, X.-Y., Ng, D., et al. (2021). Activating a Collaborative Innate-Adaptive Immune Response to Control Metastasis. Cancer Cell 39 (10), 1361–1374. e9. Epub 2021/09/04. doi:10.1016/j.ccell.2021.08.005
Swiecki, M., Wang, Y., Gilfillan, S., Lenschow, D. J., and Colonna, M. (2012). Cutting Edge: Paradoxical Roles of Bst2/Tetherin in Promoting Type I Ifn Response and Viral Infection. J. I. 188 (6), 2488–2492. doi:10.4049/jimmunol.1103145
Togashi, Y., Shitara, K., and Nishikawa, H. (2019). Regulatory T Cells in Cancer Immunosuppression - Implications for Anticancer Therapy. Nat. Rev. Clin. Oncol. 16 (6), 356–371. doi:10.1038/s41571-019-0175-7
Uhlen, M., Zhang, C., Lee, S., Sjöstedt, E., Fagerberg, L., Bidkhori, G., et al. (2017). A Pathology Atlas of the Human Cancer Transcriptome. Science 357 (6352). Epub 2017/08/19. doi:10.1126/science.aan2507
Wainwright, D. A., Balyasnikova, I. V., Han, Y., and Lesniak, M. S. (2011). The Expression of Bst2 in Human and Experimental Mouse Brain Tumors. Exp. Mol. pathology 91 (1), 440–446. doi:10.1016/j.yexmp.2011.04.012
Wei, T., Simko, V., Levy, M., Xie, Y., Jin, Y., and Zemla, J. J. S. (2017). Package ‘Corrplot’. 56(316):e24.
Woroniecka, K., Chongsathidkiet, P., Rhodin, K., Kemeny, H., Dechant, C., Farber, S. H., et al. (2018). T-Cell Exhaustion Signatures Vary with Tumor Type and Are Severe in Glioblastoma. Clin. cancer Res. official J. Am. Assoc. Cancer Res. 24 (17), 4175–4186. doi:10.1158/1078-0432.CCR-17-1846
Xu, Y., Banerjee, D., Huelsken, J., Birchmeier, W., and Sen, J. M. (2003). Deletion of β-catenin Impairs T Cell Development. Nat. Immunol. 4 (12), 1177–1182. Epub 2003/11/11. doi:10.1038/ni1008
Yang, I., Kremen, T. J., Giovannone, A. J., Paik, E., Odesa, S. K., Prins, R. M., et al. (2004). Modulation of Major Histocompatibility Complex Class I Molecules and Major Histocompatibility Complex-Bound Immunogenic Peptides Induced by Interferon-α and Interferon-γ Treatment of Human Glioblastoma Multiforme. J. Neurosurg. 100 (2), 310–319. doi:10.3171/jns.2004.100.2.0310
Yang, L.-L., Wu, L., Yu, G.-T., Zhang, W.-F., Liu, B., and Sun, Z.-J. (2018). Cd317 Signature in Head and Neck Cancer Indicates Poor Prognosis. J. Dent. Res. 97 (7), 787–794. doi:10.1177/0022034518758604
Yoo, H., Park, S.-H., Ye, S.-K., and Kim, M. (2011). IFN-γ-induced BST2 Mediates Monocyte Adhesion to Human Endothelial Cells. Cell. Immunol. 267 (1), 23–29. doi:10.1016/j.cellimm.2010.10.011
Yoshihara, K., Shahmoradgoli, M., Martínez, E., Vegesna, R., Kim, H., Torres-Garcia, W., et al. (2013). Inferring Tumour Purity and Stromal and Immune Cell Admixture from Expression Data. Nat. Commun. 4, 2612. doi:10.1038/ncomms3612
Zhang, C., Cheng, W., Ren, X., Wang, Z., Liu, X., Li, G., et al. (2017). Tumor Purity as an Underlying Key Factor in Glioma. Clin. cancer Res. official J. Am. Assoc. Cancer Res. 23 (20), 6279–6291. doi:10.1158/1078-0432.CCR-16-2598
Zhang, G., Li, X., Chen, Q., Li, J., Ruan, Q., Chen, Y. H., et al. (2019). Cd317 Activates Egfr by Regulating its Association with Lipid Rafts. Cancer Res. 79 (9), 2220–2231. doi:10.1158/0008-5472.CAN-18-2603
Zhang, Q., Zhou, N., Wang, W., and Zhou, S. (2019). A Novel Autocrine Cxcl14/Ackr2 Axis: The Achilles' Heel of Cancer Metastasis? Clin. cancer Res. official J. Am. Assoc. Cancer Res. 25 (12), 3476–3478. doi:10.1158/1078-0432.CCR-19-0853
Keywords: glioblastoma, bioinformatics, BST2, interferon, immune
Citation: Kong Y, Xue Z, Wang H, Cui G, Chen A, Liu J, Wang J, Li X and Huang B (2022) Identification of BST2 Contributing to the Development of Glioblastoma Based on Bioinformatics Analysis. Front. Genet. 13:890174. doi: 10.3389/fgene.2022.890174
Received: 05 March 2022; Accepted: 15 June 2022;
Published: 05 July 2022.
Edited by:
Katy Janvier, Université Paris Descartes, FranceReviewed by:
Emil Bulatov, Kazan Federal University, RussiaChunyan Hao, First Hospital of Shanxi Medical University, China
Tram Pham, Montreal Clinical Research Institute (IRCM), Canada
Copyright © 2022 Kong, Xue, Wang, Cui, Chen, Liu, Wang, Li and Huang. This is an open-access article distributed under the terms of the Creative Commons Attribution License (CC BY). The use, distribution or reproduction in other forums is permitted, provided the original author(s) and the copyright owner(s) are credited and that the original publication in this journal is cited, in accordance with accepted academic practice. No use, distribution or reproduction is permitted which does not comply with these terms.
*Correspondence: Bin Huang, hb@sdu.edu.cn