 Liting Yang†
 Guoliang Yuan
 Wei Li
- Department of Cardiology, Shuyang Hospital of Traditional Chinese Medicine, Suqian, Jiangsu, China
Myocardial infarction (MI) is an acute and persistent myocardial ischemia caused by coronary artery disease. This study screened potential genes related to MI. Three gene expression datasets related to MI were downloaded from the Gene Expression Omnibus database. Differentially expressed genes (DEGs) were screened using the MetaDE package. Afterward, the modules and genes closely related to MI were screened and a gene co-expression network was constructed. A support vector machine (SVM) classification model was then constructed based on the GSE61145 dataset using the e1071 package in R. A total of 98 DEGs were identified in the MI samples. Next, three modules associated with MI were screened and an SVM classification model involving seven genes was constructed. Among them, BCL6, CEACAM8, and CUGBP2 showed co-interactions in the gene co-expression network. Therefore, ACOX1, BCL6, CEACAM8, and CUGBP2, in addition to GPX7, might be feature genes related to MI.
Introduction
Myocardial infarction (MI), a major cause of death and disability worldwide, is caused by myocardial cell death due to prolonged ischemia (Thygesen et al., 2007). The most important risk factors of MI include age, smoking, hypertension, diabetes, and total and high-density lipoprotein cholesterol levels (Bao et al., 2022; Bruyninckx et al., 2008;O’Gara, 2013). Chest pain is the most common clinical manifestation of acute MI, which is often described as stress or compression (Fauci, 2014). The pain often radiates to the left arm as well as to the jaw, neck, right arm, back, and upper abdomen (Marcus et al., 2007). Approximately 15.9 million people worldwide developed MI in 2015 (Ji et al., 2015; Cowan et al., 2018). MI is an emerging public health concern globally. Previous studies have suggested that ALOX5AP (arachidonate 5-lipoxygenase activating protein) confers a risk of MI; thus, ALOX5AP is the first specific gene conferring a substantial population-attributable risk (PAR) of MI (Helgadottir et al., 2004). TGF-β1 (Transforming growth factor-beta 1) is involved in the modulation of cell growth and differentiation, and plays an important role in cardiovascular physiopathology and the repair of vascular injury (Nikol et al., 1992; Cambien et al., 1996). Meanwhile, the ALDH2 (aldehyde dehydrogenase 2) Lys/Lys genotype is a risk factor for MI due to its influence on high-density lipoprotein (HDL) cholesterol level (Gardemann et al., 1998; Takagi et al., 2002). PLA1 (Phospholipase A1 member A) hydrolyzes fatty acids at the sn-1 position of phosphatidylserine and 1-acyl-2-lysophosphatidylserine and its abnormal expression is associated with coronary artery disease (CAD) and MI (Ji et al., 2019). Furthermore, high-throughput screening revealed that Nox2 as a potential miRNA target for function improvement following MI (Wang et al., 2012; Smyth and Smyth, 2013; Yang et al., 2017; Bao et al., 2022; Kim et al., 2022). However, the genes closely related to MI development have not been fully identified.
The present study searched microarray datasets related to human MI. Three gene expression datasets on MI were downloaded from the Gene Expression Omnibus database and differentially expressed genes (DEGs) were identified using MetaDE. The genes associated with MI were further screened by identifying disease-associated modules. With this information, we constructed a gene co-expression network. To classify the MI samples, a support vector machine (SVM) classification model trained on the GSE61145 dataset was used. With this trained model, we focused on mining related genes associated with MI.
Methods
Microarray data
The GSE61145, GSE60993, and GSE34198 gene expression datasets related to human MI, which were developed based on the GPL6106, GPL6884, and GPL6102 platforms, respectively, were downloaded from the Gene Expression Omnibus (GEO, http://www.ncbi.nlm.nih.gov/geo/) database. The GSE61145 dataset contained data on 14 blood samples from patients with MI and 10 samples from normal controls. The GSE60993 dataset included data on a total of 24 samples (7 and 17 blood samples from normal controls and patients with MI, respectively). Finally, the GSE34198 dataset contained 97 samples (48 and 49 blood samples from normal controls and patients with MI, respectively).
The raw data were downloaded and the probes were annotated into gene symbols based on platform annotation information. Because a single gene could correspond to several probes (multiple values), the average gene expression values were calculated for each gene. Afterward, log2 conversion was performed to transform the gene expression data from a skewed distribution to an approximately normal distribution. The data were then normalized using the limma package (MetaDE) (http://www.bioconductor.org/packages/2.9/bioc/html/limma.html) in R language.
Differentially expressed gene and meta-analyses
DEGs were screened by using the MetaDE package (Wang et al., 2012) in R based on the GSE61145 and GSE60993 datasets. The raw data were downloaded and the probes were annotated into gene symbols based on platform annotation information. The average gene expression values were calculated for each gene. Afterward, log2 conversion was performed to transform the gene expression data from a skewed distribution to an approximately normal distribution. The data were then normalized using the limma package in R language. The heterogeneity of gene expression data based on different platforms was analyzed using the MetaDE.ES method (Kim et al., 2022), with tau2 = 0 and Qpval >0.05. Differential expression analysis of genes with homogeneous expression was then performed between the disease and control groups, with an FDR (false discovery rate) of < 0.05 defined as the threshold value.
Screening modules and disease-related genes based on the meta-analysis
Weighted gene co-expression network analysis (WGCNA) (MetaDE) is a typical system biology algorithm used to construct gene co-expression networks based on high-throughput mRNA expression data. The genes and modules related to MI in this study were analyzed for DEGs based on the WGCNA algorithm (Langfelder and Horvath, 2008). The correlation coefficient between gene expression was calculated using the function
Construction of the gene co-expression network and enrichment analysis
The co-expressed modules that were closely associated with disease state were analyzed and the module genes were collected to construct the co-expression network. Genes related to disease were subjected to gene ontology (GO) enrichment analysis using the clusterProfiler package (Yu et al., 2012) in R based on the hypergeometric distribution algorithm. P < 0.05 was defined as the threshold value. The formula for the hypergeometric distribution algorithm is shown in Eq. 1.
where N represents the number of genes with GO functional annotations; K represents the number of DEGs among N genes, and M represents the number of genes that are annotated with a particular GO function.
Support vector machine (SVM) classification modeling
To classify the samples, an optimal classification hyperplane must be selected from numerous options to maximize the distance δ between the sample set and the classification hyperplane. When ε = |wxi + b| = 1, the distance between the two types of sample points is 2 ((|wxi + b|)/‖w‖) =(2/‖w‖). The goal is to construct an optimal classification hyperplane under the constraint of Eq. 2 to maximize (2/‖w‖) and minimize (‖w‖2/2).
Most classification issues can be treated as nonlinear separable problems, and quadratic programming problems can be modified as follows by introducing the slack variable ξi in Eq. 3.
where ξi is the slack variable and C is the penalty coefficient.
With GSE61145 as the training dataset and all genes of interest as classification factors, the SVM model was established using the e1071 package (MetaDE) in Rto distinguish the disease and control samples. The classification factors were added individually until all of them had been added to the SVM classifier. The classification accuracy of the SVM classifier was then calculated and the genes that affected classification accuracy were removed. The SVM model was then validated in the GSE60993 and GSE34198 gene expression datasets.
Results
DEG screening
A total of 1,231 DEGs were identified by the MetaDE package (Langfelder and Horvath, 2008; Wang et al., 2012; Yu et al., 2012; Meyer, 2013). The top 10 DEGs are listed in Table 1, including GZMK (granzyme K), HLA-DQA (histocompatibility complex, class II, DQ alpha), and EOMES (eomesodermin). First, the heterogeneity of gene expression data based on different platforms was analyzed using the MetaDE.ES method, with tau2 = 0 and Qpval >0.05. Then, the differential expression analysis of genes with homogeneous expression was conducted between the disease and control groups, with an FDR (false discovery rate) of <0.05 defined as the threshold value. A total of 1,231 DEGs were identified. The top 10 DEGs with the smallest p-values in the gene difference analysis between the disease and control groups were selected; that is, the genes with the largest difference between disease and control groups. The present study analyzed the co-expressed modules that were closely associated with the disease state and identified the module genes to construct a co-expression network. Genes related to disease were subjected to gene ontology (GO) enrichment analysis. KEGG pathway enrichment analysis was not performed.

TABLE 1. List of top 10 significant differentially expressed genes from GSE61145 and GSE60993.
Modules and genes closely related to disease
To satisfy the precondition of scale-free network distribution, we selected a power of 18 as the adjacency parameter. The results of the consistency analysis showed a high correlation between the GSE61145 and GSE60993 datasets (correlation coefficient = 0.86, p-value < 1e-200). Additionally, GSE61145 was used as a training set to identify disease-associated modules (Figure 1A). Module partitioning for the GSE60993 dataset (Figure 1B) showed high consistency with the GSE61145 dataset. We then calculated the correlation coefficient between module and disease state (normal and MI samples) for the GSE61145 (Figure 2A) and GSE60993 (Figure 2B) datasets, respectively (Table 1). According to the correlation coefficients, the top three modules (black, pink, and red) were identified.
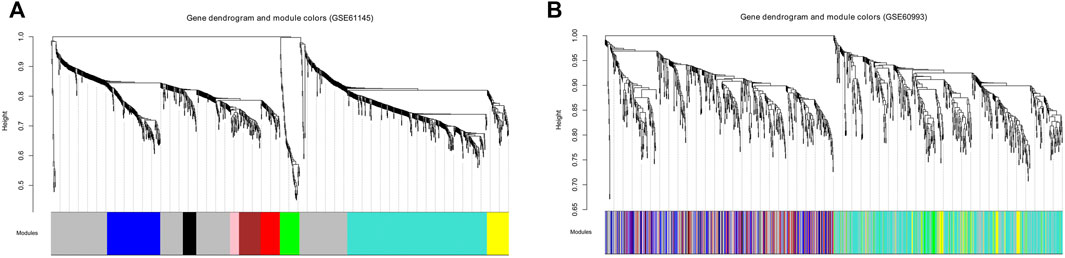
FIGURE 1. Tree diagrams for identifying the disease-associated modules based on the GSE61145 (A) and GSE60993 (B) datasets. The abscissa represents modules in different colors. The ordinate represents the height of the system clustering tree based on the expression value.
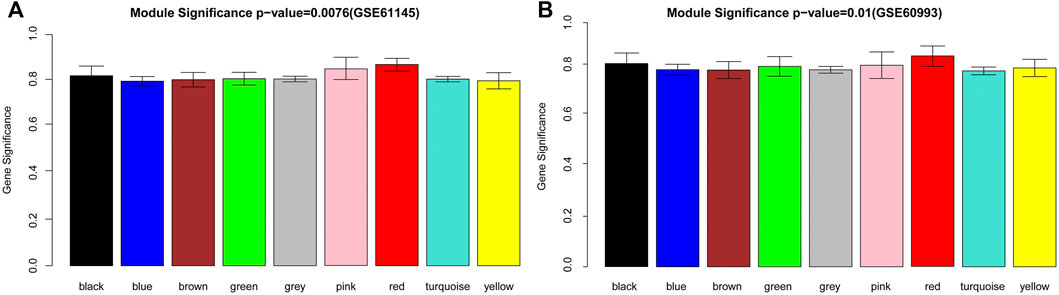
FIGURE 2. The disease-associated modules identified from the GSE61145 (A) and GSE60993 (B) datasets. The abscissa represents modules in different colors. The ordinate represents the overall correlation coefficient between the genes in each module and the disease state.
Gene co-expression network construction and enrichment analysis
The correlation coefficients between genes in the top three modules and disease state were calculated, which revealed 98 genes with correlation coefficients >0.5. These included 30 genes (11 up-regulated and 19 down-regulated) in the black module, 19 genes (9 up-regulated and 10 down-regulated) in the pink module, and 49 genes (22 up-regulated and 27 down-regulated) in the red module. The gene co-expressed networks of the 98 genes were then constructed (Figure 3). GO analysis showed the enrichment of 10 GO terms among the genes in the black module (Table 2) and 15 GO terms among the genes in the red module (Table 2). The GO terms enriched in the black module included negative regulation of cell proliferation (p-value = 0.009704), regulation of cell proliferation (p-value = 0.014724), and positive regulation of macromolecule metabolic process (p-value = 0.019608). The GO terms closely related to the genes in the red module mainly included positive regulation of I-kappaB kinase/NF-kappaB cascade (p-value = 0.024598), regulation of I-kappaB kinase/NF-kappaB cascade (p-value = 0.029497), and positive regulation of signal transduction (p-value = 0.037345). No GO terms were significantly enriched among the genes in the pink module.
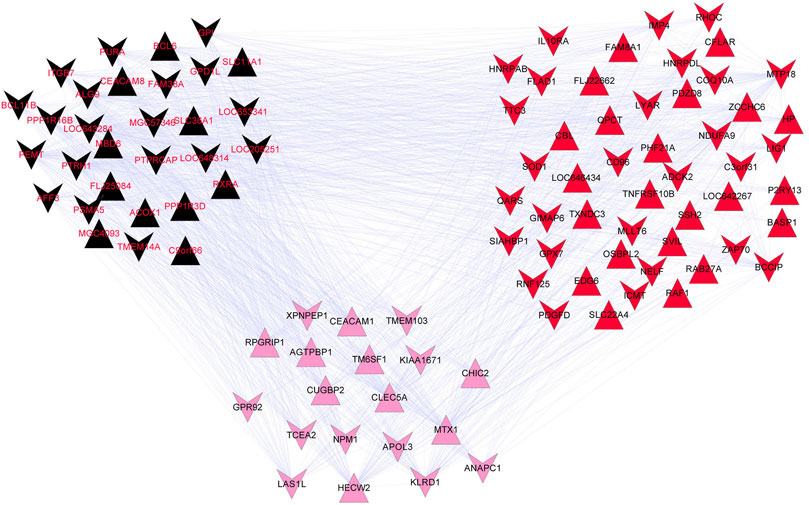
FIGURE 3. Gene co-expression network of the black, pink, and red modules. The inverted and positive triangles represent up- and down-regulated genes in the disease group, respectively. The node colors reflects the colors of the disease modules.
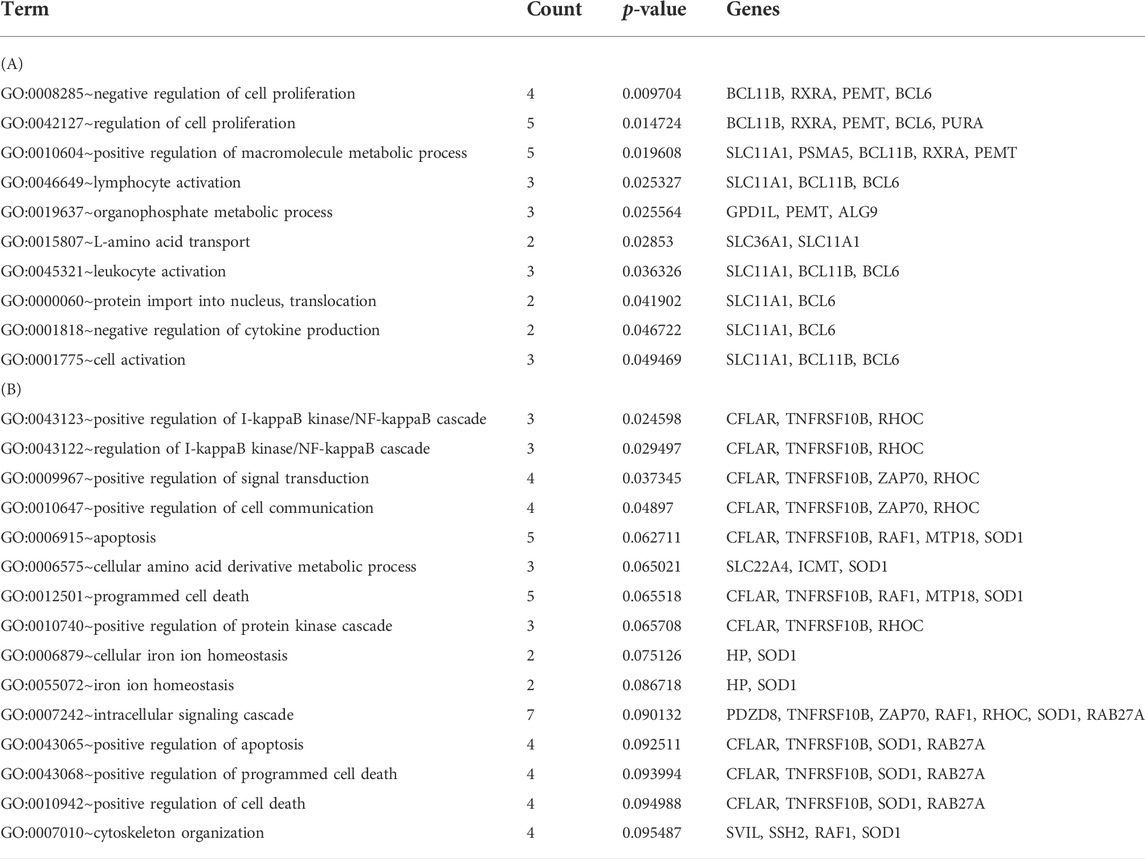
TABLE 2. Gene ontology functions enriched in the black (A) and red (B) modules.
Construction and evaluation of the SVM classification model
Based on the SVM classification model, we removed genes that could not distinguish between the disease and control samples. Finally, seven genes were obtained: ACOX1 (Acyl CoA oxidase 1), ADCK2 (aarF domain containing kinase 2), AFF3 (AF4/FMR2 family member 3), BCL6 (B-cell lymphoma 6), CEACAM8 (Carcinoembryonic antigen-related cell adhesion molecule 8), CUGBP2 (CUG triplet repeat-binding protein 2) and GPX7 (glutathione peroxidase 7). The SVM classification model of these seven genes could distinguish all samples in the GSE61145 dataset. The scatterplot of the GSE61145 dataset is shown in Figure 4A. The GSE60993 and GSE34198 datasets were then used as validation datasets to confirm the SVM classification model. As shown in Figure 4B, the SVM classification model correctly distinguished 23 (17 disease and 6 normal samples) of 24 samples in the GSE60993 dataset. Additionally, the scatterplot of the GSE34198 dataset indicated that the SVM classification model correctly distinguished 90 (48 disease and 42 normal samples) of the 97 samples (Figure 4C). The efficiency receiver operating characteristic (ROC) curves of the SVM classification model are shown in Figure 5 and the efficiency parameters of each dataset are listed in Table 3.
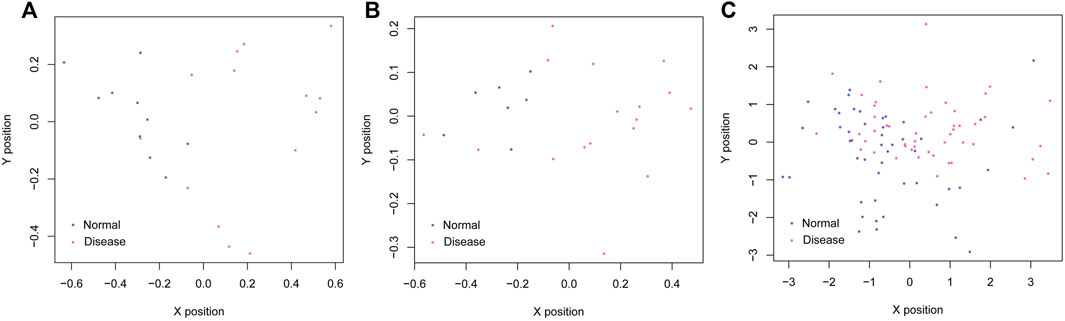
FIGURE 4. Scatterplots of the GSE61145 (A), GSE60993 (B), and GSE34198 (C) datasets. The purple and red dots represent the normal and disease samples, respectively. The X and Y axes represent the position vector coordinates of the samples.
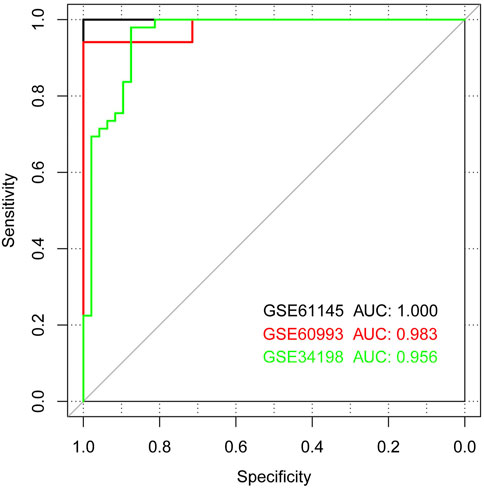
FIGURE 5. Receiver operating characteristic (ROC) curves showing classifier efficiency. The black, red, and green curves show the ROC curves of the GSE61145, GSE60993, and GSE34198 datasets, respectively.
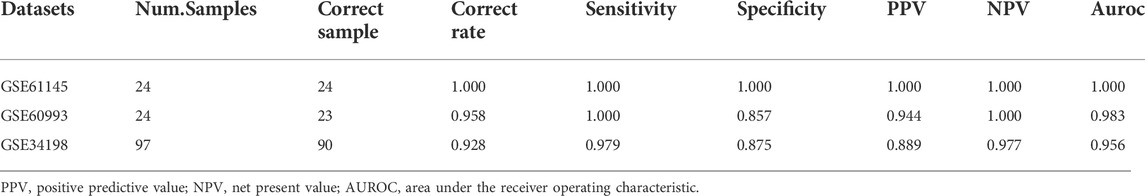
TABLE 3. Parameters for classifier performance.
Discussion
MI is a major cause of death and disability worldwide and has imposed burdens and impacted the health of the population (ErikssonP., 2014) While studies have focused on the mechanism and management of MI at the molecular level (Hak et al., 2000; Erikson et al., 2017; Wongsurawat, 2018; Yang et al., 2022), effective therapy is lacking. The present study screened 1,231 DEGs based on three microarray datasets. Based on WGCNA, the top three modules related to disease (black, pink, and red) were screened. Afterward, a total of 98 DEGs were screened from the top three modules to construct the gene co-expression network. The SVM classification model was also constructed and identified seven genes (including ACOX1, BCL6, CEACAM8, CUGBP2, and GPX7) that were closely associated with MI.
ACOX1 is the first enzyme in peroxisomal fatty acid β-oxidation. It is rate-limiting and plays a key role in fatty acid metabolism and fat deposition (Foraker et al., 2013). Both lipid abnormalities and chronic inflammation have crucial involvement in atherosclerosis initiation and progression (Bhagavan et al., 2003). Lutein plays a regulator role in gene expression and is involved in oxidative stress and the lipid metabolism of ACOX1, thereby mitigating atherosclerosis progression (Bruyninckx et al., 2008). In addition, BCL6 is a transcriptional repressor required for mature B-cell germinal center (GC) formation and is also implicated in lymphomagenesis (Jiao et al., 2011; Vik et al., 2015). Increasing Bcl6 expression reduces inflammatory responses and limits atherosclerosis (Han et al., 2015). Meanwhile, CEACAM8 is a glycosylphosphatidylinositol-anchored membrane glycoprotein with a molecular weight of around 95 kDa (Basso et al., 2010). CEACAM8 is also known as Cluster of Differentiation 66b (CD66b) and is expressed by neutrophils (Lasa et al., 2008; Kulbacki et al., 2010; Singer, 2013; Wei et al., 2015). Leucocyte activation is a crucial step in atherogenesis (Chudasama et al., 2011). The expression of leucocyte integrins, such as neutrophil and neutrophil CD66b, has been linked to atherosclerosis (Alipour et al., 2013). Furthermore, coronary artery disease (CAD) reflects generalized inflammation (Oostrom et al., 2004). Additionally, CUG triplet repeat-binding protein 2 (CUGBP2) plays a critical role in the apoptosis of breast cancer cells in response to genotoxic injury (Mukhopadhyay et al., 2004). The over-expression of miR-144 can decrease cardiomyocyte cell death by targeting CUGBP2 (Alipour et al., 2013). miR-451 is also largely responsible for ischemic preconditioning-mediated cardioprotection, which also showed protective effects against simulated ischemia/reperfusion-induced cardiomyocyte death by CUGBP2 regulation (Weiss et al., 2012; Chen et al., 2014; Feng et al., 2016). Subsequently, GPX7 is an endoplasmic reticulum (ER)-mitochondria protein that plays important and emerging functional roles in T-cell development (Higashi et al., 2013). Numerous clinical studies have found that hyperhomocysteinemia (HHcy) is an independent risk factor for cardiovascular diseases in humans (Chen et al., 2016). HHcy accelerates atherosclerosis by affecting the immuno-inflammatory response and repressing regulatory T-cell functions (Feng et al., 2016). Furthermore, the results of the gene co-expression network analysis in this study showed the co-expression of BCL6, CEACAM8, and CUGBP2. ADCK2 and AFF3 were also associated with MI in this study. However, evidence regarding their roles in MI is scarce. Thus, ACOX1, BCL6, CEACAM8, CUGBP2 and GPX7 may play key roles in MI pathogenesis.
Conclusion
Myocardial infarction is one of the most dangerous diseases worldwide. This study screened for genes associated with such diseases. We obtained gene expression datasets (GSE61145, GSE60993, and GSE34198) related to human MI. We searched microarray datasets involving human MI and then investigated the DEGs between MI and normal samples. The genes associated with MI were further screened by identifying the disease-associated modules to construct a gene co-expression network. ACOX1, BCL6, CEACAM8, CUGBP2, and GPX7 might be key genes implicated in MI development. The MI-associated genes may provide targets for novel therapy for MI. As our findings were partially drawn by prediction, they require additional validation. However, this study has several limitations that should be addressed in future work. The SVM algorithm can be treated as a typical classification model in the field of bioinformatics and computational biology. Therefore, several classification algorithms, including random forest, neural network, and some deep learning algorithms, can be used to correct this issue. This study used the GSE61145 dataset to train the classification mode. Considering the generality of the classification model, more datasets should be trained. Future work should also utilize cross-validation methods.
Data availability statement
Publicly available datasets were analyzed in this study. The names of the repository/repositories and accession number(s) can be found in the article/supplementary material.
Author contributions
LY and XP designed the experiments in this study. WL, the co-corresponding author, constructed the model and edited the manuscript. YZ, GY, and DZ edited the figures. LW, CZ, and TL edited the tables.
Conflict of interest
The authors declare that the research was conducted in the absence of any commercial or financial relationships that could be construed as a potential conflict of interest.
Publisher’s note
All claims expressed in this article are solely those of the authors and do not necessarily represent those of their affiliated organizations, or those of the publisher, the editors, and the reviewers. Any product that may be evaluated in this article, or claim that may be made by its manufacturer, is not guaranteed or endorsed by the publisher.
References
Alipour, A., Ribalta, J., Njo, T. L., Janssen, H. W., Birnie, E., van Miltenburg, A. J. M., et al. (2013). Trans-vessel gradient of myeloperoxidase in coronary artery disease. Eur. J. Clin. Invest. 43 (9), 920–925. doi:10.1111/eci.12121
Bruyninckx, R., Aertgeerts, B., Bruyninckx, P., and Buntinx, F. (2008). Signs and symptoms in diagnosing acute myocardial infarction and acute coronary syndrome: a diagnostic meta-analysis. Br. J. Gen. Pract. 58 (547), 105–111. doi:10.3399/bjgp08X277014
Bao, W., Cui, Q., Chen, B., and Yang, B. (2022). Computational and mathematical methods in medicine, 2022, 9470683–9470688. doi:10.1155/2022/9470683Phage_UniR_LGBM: Phage virion proteins classification with UniRep features and LightGBM model
Basso, K., Saito, M., Sumazin, P., Margolin, A. A., Wang, K., Lim, W. K., et al. (2010). Integrated biochemical and computational approach identifies BCL6 direct target genes controlling multiple pathways in normal germinal center B cells. Blood 115 (5), 975–984. doi:10.1182/blood-2009-06-227017
Bhagavan, N. V., Lai, E. M., Rios, P. A., Yang, J., Ortega-Lopez, A. M., Shinoda, H., et al. (2003). Evaluation of human serum albumin cobalt binding assay for the assessment of myocardial ischemia and myocardial infarction. Clin. Chem. 49 (4), 581–585. doi:10.1373/49.4.581
Cambien, F., Ricard, S., Troesch, A., Mallet, C., Generenaz, L., EvAns, A., et al. (1996). Polymorphisms of the Transforming Growth Factor-β1 Gene in Relation to Myocardial Infarction and Blood Pressure The Etude Cas-Témoin de l'Infarctus du Myocarde (ECTIM) Study. Hypertension 28 (5), 881–887. doi:10.1161/01.hyp.28.5.881
Chen, F., Zhao, X., Peng, J., Bo, L., Fan, B., and Ma, D. (2014). Integrated microRNA-mRNA analysis of coronary artery disease. Mol. Biol. Rep. 41 (8), 5505–5511. doi:10.1007/s11033-014-3426-9
Chen, Y.-I., Wei, P. C., Hsu, J. L., Su, F. Y., and Lee, W. H. (2016). NPGPx (GPx7): A novel oxidative stress sensor/transmitter with multiple roles in redox homeostasis. Am. J. Transl. Res. 8 (4), 1626–1640.
Chudasama, V., Smith, M. E. B., Schumacher, F. F., Papaioannou, D., Waksman, G., Baker, J. R., et al. (2011). Bromopyridazinedione-mediated protein and peptide bioconjugation. Chem. Commun. (Camb.) 47 (31), 8781–8783. doi:10.1039/c1cc12807h
Cowan, A. J., Allen, C., Barac, A., Basaleem, H., Bensenor, I., Curado, M. P., et al. (2018). Global burden of multiple myeloma: A systematic analysis for the global burden of disease study 2016. JAMA Onclo. 4 (9), 1221–1227. doi:10.1001/jamaoncol.2018.2128
Erikson, J. M., Valente, A. J., Mummidi, S., Kandikattu, H. K., DeMarco, V. G., Bender, S. B., et al. (2017). Targeting TRAF3IP2 by genetic and interventional approaches inhibits ischemia/reperfusion-induced myocardial injury and adverse remodeling. J. Biol. Chem. 292 (6), 2345–2358. doi:10.1074/jbc.M116.764522
ErikssonP., (2014). Prediction of the risk of myocardial infarction from polymorphisms in candidate genes — nejm. N. Engl. J. Med.
Fauci, A. (2014). Harrison's principles of internal medicine. 17th Edition. Americas New York City: McGraw-Hill.
Feng, J., Lu, S., Ding, Y., Zheng, M., and Wang, X. (2016). Homocysteine activates T cells by enhancing endoplasmic reticulum-mitochondria coupling and increasing mitochondrial respiration. Protein Cell 7 (6), 391–402. doi:10.1007/s13238-016-0245-x
Gardemann, A., Stricker, J., Nguyen, Q. D., KatzN., , PhilippM., , et al. (1998). Association of the platelet glycoprotein IIIa PlA1/A2 gene polymorphism to coronary artery disease but not to nonfatal myocardial infarction in low risk patients. Thromb. Haemost. 80 (2), 214–217.
Hak, A. E., Pols, H. A., Visser, T. J., Drexhage, H. A., HofmAn, A., and Witteman, J. C. (2000). Subclinical hypothyroidism is an independent risk factor for atherosclerosis and myocardial infarction in elderly women: The rotterdam study. Ann. Intern. Med. 132 (4), 270–278. doi:10.7326/0003-4819-132-4-200002150-00004
Han, H., Cui, W., Wang, L., Xiong, Y., Liu, L., Sun, X., et al. (2015). Lutein prevents high fat diet-induced atherosclerosis in ApoE-deficient mice by inhibiting NADPH oxidase and increasing PPAR expression. Lipids 50 (3), 261–273. doi:10.1007/s11745-015-3992-1
Helgadottir, A., Manolescu, A., Thorleifsson, G., Gretarsdottir, S., Jonsdottir, H., Thorsteinsdottir, U., et al. (2004). The gene encoding 5-lipoxygenase activating protein confers risk of myocardial infarction and stroke. Nat. Genet. 36 (3), 233–239. doi:10.1038/ng1311
Higashi, Y., Pandey, A., Goodwin, B., and Delafontaine, P. (2013). Insulin-like growth factor-1 regulates glutathione peroxidase expression and activity in vascular endothelial cells: Implications for atheroprotective actions of insulin-like growth factor-1. Biochim. Biophys. Acta 1832 (3), 391–399. doi:10.1016/j.bbadis.2012.12.005
Ji, Z., Wu, D., Zhao, W., Peng, H., Zhao, S., Huang, D., et al. (2015). Systemic modeling myeloma-osteoclast interactions under normoxic/hypoxic condition using a novel computational approach. Sci. Rep. 5, 13291. doi:10.1038/srep13291
Ji, Z., Zhao, W., Lin, H. K., and Zhou, X. (2019). Systematically understanding the immunity leading to CRPC progression. PLoS Comput. Biol. 15 (9), e1007344. doi:10.1371/journal.pcbi.1007344
Jiao, Y., Zan, L. S., Liu, Y. F., and Wang, H. B. (2011). Molecular characterization, polymorphism of the ACOX1 gene and association with ultrasound traits in Bos taurus. Genet. Mol. Res. 10 (3), 1948–1957. doi:10.4238/vol10-3gmr1036
Kim, E., Kim, Y. J., Ji, Z., Kang, J. M., Wirianto, M., Paudel, K. R., et al. (2022). ROR activation by Nobiletin enhances antitumor efficacy via suppression of IκB/NF-κB signaling in triple-negative breast cancer. Cell Death Dis. 13 (4), 374. doi:10.1038/s41419-022-04826-5
Kulbacki, E., Rehder, C., and Wang, E. (2010). Prominent Dutcher body formation in a case of follicular lymphoma with BCL6 gene rearrangement and intact BCL2 gene. Am. J. Hematol. 85 (3), 218–219. doi:10.1002/ajh.21612
Langfelder, R. b. P., and Horvath, S. (2008). Wgcna: an R package for weighted correlation network analysis. BMC Bioinforma. 9 (1), 559. doi:10.1186/1471-2105-9-559
Lasa, A., Serrano, E., Carricondo, M., Carnicer, M. J., Brunet, S., Badell, I., et al. (2008). High expression of CEACAM6 and CEACAM8 mRNA in acute lymphoblastic leukemias. Ann. Hematol. 87 (3), 205–211. doi:10.1007/s00277-007-0388-1
Marcus, G. M., Cohen, J., Varosy, P. D., Vessey, J., Rose, E., Massie, B. M., et al. (2007). The utility of gestures in patients with chest discomfort. Am. J. Med. 120 (1), 83–89. doi:10.1016/j.amjmed.2006.05.045
MetaDE (2007). A function to plot the heatmap of DE genes detectred at a given FDR threshold from the Meta-analysis.
Meyer, D. (2013). Support Vector Machines The Interface to libsvm in package e1071. R. News 1 (5), 1–3.
Mukhopadhyay, D., Jung, J., Murmu, N., Houchen, C. W., Dieckgraefe, B. K., and Anant, S. (2004). CUGBP2 plays a critical role in apoptosis of breast cancer cells in response to genotoxic injury. Ann. N. Y. Acad. Sci. 1010 (1), 504–509. doi:10.1196/annals.1299.093
Nabel, E. G., and Braunwald, E. (2012). A tale of coronary artery disease and myocardial infarction. N. Engl. J. Med. 366 (1), 54–63. doi:10.1056/NEJMra1112570
Nikol, S., Isner, J. M., Pickering, J. G., KearneyM., , Leclerc, G., and Weir, L. (1992). Expression of transforming growth factor-beta 1 is increased in human vascular restenosis lesions. J. Clin. Invest. 90 (4), 1582–1592. doi:10.1172/JCI116027
O’Gara, P. T. (2013). ACCF/AHA guideline for the management of ST-elevation myocardial infarction: Executive summary A report of the American college of cardiology foundation/American heart association task force on practice guidelines. Catheter. Cardiovasc. Interventions 128 (16), e240.
Oostrom, A., Wijk, J. P. H. V., and Cabezas, M. C. (2004). Lipaemia, inflammation and atherosclerosis: Novel opportunities in the understanding and treatment of atherosclerosis. Drugs 64 (Suppl. 22), 19–41. doi:10.2165/00003495-200464002-00004
Singer, B. (2013)., 8. US.Use of soluble CEACAM8 for diagnosing, treating or monitoring diseases, A method Screen. Compd. that Prev. apoptosis
Smyth, G., and Smyth, G. K. (2013). Limma: Linear models for microarray data. Bioinforma. Comput. Biol. Solut. Using R Bioconductor 1.
Takagi, S., Iwai, N., Yamauchi, R., Kojima, S., Yasuno, S., Baba, T., et al. (2002). Aldehyde dehydrogenase 2 gene is a risk factor for myocardial infarction in Japanese men. Hypertens. Res. 25 (5), 677–681. doi:10.1291/hypres.25.677
Thygesen, K., Alpert, J. S., Jaffe, A. S., Simoons, M. L., Chaitman, B. R., White, H. D., et al. (2012). Third universal definition of myocardial infarction. Eur. Heart J. 9 (20), 2551–2567. doi:10.1093/eurheartj/ehs184
Thygesen, K., Alpert, J. S., and White, H. D. (2007). Universal definition of myocardial infarction. Eur. Heart J. 28 (20), 2525–2538. doi:10.1093/eurheartj/ehm355
Vik, R., Brattelid, T., Skorve, J., Nygard, O., Nordrehaug, J. E., Berge, R. K., et al. (2015). A water-soluble extract of chicken reduced plasma triacylglycerols, but showed no anti-atherosclerotic activity in apoE −/− mice. J. Nutr. Intermediary Metabolism 2 (1-2), 8–14. doi:10.1016/j.jnim.2015.04.002
Wang, X., Kang, D. D., Shen, K., Song, C., Lu, S., Chang, L. C., et al. (2012). An R package suite for microarray meta-analysis in quality control, differentially expressed gene analysis and pathway enrichment detection. Bioinformatics 28 (19), 2534–2536. doi:10.1093/bioinformatics/bts485
Wei, Y., Zhu, M., Corbalan-Campos, J., Heyll, K., Weber, C., and Schober, A. (2015). Regulation of Csf1r and Bcl6 in macrophages mediates the stage-specific effects of microRNA-155 on atherosclerosis. Arterioscler. Thromb. Vasc. Biol. 35 (4), 796–803. doi:10.1161/ATVBAHA.114.304723
Weiss, J. B., Eisenhardt, S. U., Stark, G. B., Bode, C., Moser, M., and Grundmann, S. (2012). MicroRNAs in ischemia-reperfusion injury. Am. J. Cardiovasc. Dis. 2 (3), 237–247.
Wongsurawat, T. (2018). Distinctive molecular signature and activated signaling pathways in aortic smooth muscle cells of patients with myocardial infarction. Atherosclerosis 271. doi:10.1016/j.atherosclerosis.2018.01.024
Yang, B., Bao, W., and Wang, J. (2022). Active disease-related compound identification based on capsule network. Brief. Bioinform. 23 (1), bbab462. doi:10.1093/bib/bbab462
Yang, J., Brown, M. E., Zhang, H., Martinez, M., Zhao, Z., Bhutani, S., et al. (2017). High-throughput screening identifies microRNAs that target Nox2 and improve function after acute myocardial infarction. Am. J. Physiol. Heart Circ. Physiol. 312 (5), H1002-H1012–H1012. doi:10.1152/ajpheart.00685.2016
Keywords: myocardial infarction, differentially expressed genes, weighed gene co-expression network analysis, gene co-expression network, support vector machine
Citation: Yang L, Pan X, Zhang Y, Zhao D, Wang L, Yuan G, Zhou C, Li T and Li W (2022) Bioinformatics analysis to screen for genes related to myocardial infarction. Front. Genet. 13:990888. doi: 10.3389/fgene.2022.990888
Received: 10 July 2022; Accepted: 24 August 2022;
Published: 10 October 2022.
Edited by:
Zhiwei Ji, Nanjing Agricultural University, ChinaCopyright © 2022 Yang, Pan, Zhang, Zhao, Wang, Yuan, Zhou, Li and Li. This is an open-access article distributed under the terms of the Creative Commons Attribution License (CC BY). The use, distribution or reproduction in other forums is permitted, provided the original author(s) and the copyright owner(s) are credited and that the original publication in this journal is cited, in accordance with accepted academic practice. No use, distribution or reproduction is permitted which does not comply with these terms.
*Correspondence: Wei Li, 13401889559@163.com
†These authors have contributed equally to this work and share first authorship