 Lisha Zhou1,2,3†
 Meiling Wang1,2†
 Hanrui Guo1,2†Jun Hou1,2,4Yingna Zhang1,4Man Li1,4,5Xiangwei Wu1,4
 Xueling Chen1,2,4*
 Lianghai Wang1,4,5*
- 1NHC Key Laboratory of Prevention and Treatment of Central Asia High Incidence Diseases, The First Affiliated Hospital, School of Medicine, Shihezi University, Shihezi, China
- 2Department of Immunology, School of Medicine, Shihezi University, Shihezi, China
- 3State Key Laboratory of Pharmaceutical Biotechnology, Chemistry and Biomedicine Innovation Center, Department of Biotechnology and Pharmaceutical Sciences, School of Life Sciences, Nanjing University, Nanjing, China
- 4Key Laboratory of Xinjiang Endemic and Ethnic Diseases, School of Medicine, Shihezi University, Shihezi, China
- 5Department of Pathology, The First Affiliated Hospital, School of Medicine, Shihezi University, Shihezi, China
Recently, attention has been focused on the central role of TREM2 in diverse pathologies. However, the role of TREM2 signaling in the tumor microenvironment of hepatocellular carcinoma (HCC) remains poorly understood. Herein, we systematically investigated the single-cell transcriptomes of human HCC tissues and found that TREM2 was predominantly expressed by a macrophage subpopulation enriched in tumor tissues that resemble lipid-associated macrophages (LAMs). The accumulation of TREM2+ LAM-like cells in HCC was confirmed in two additional cohorts using scRNA-seq analysis and immunohistochemistry. High expression of TREM2 correlated with high infiltrating macrophage abundance and poor prognosis. Based on systematic interrogations of transcriptional profiles and cellular interactions, TREM2+ LAM-like cells were identified to mainly originate from S100A8+ monocytes and represented an immunosuppressive state. TREM2+ LAM-like cells recruited suppressive Treg cells, facilitating microenvironment remodeling. Furthermore, gene regulatory analysis and in vitro functional assays indicated that activation of LXR signaling could promote the reprogramming of TREM2+ LAM-like cells. Correlation analysis of bulk RNA-sequencing data demonstrated that the enrichment of TREM2+ LAM-like cells was an independent indicator of adverse clinical outcomes in HCC patients. Our comprehensive analyses provide deeper insights into the immunosuppressive role of TREM2+ LAM-like cells in HCC.
Introduction
Liver cancer is the third leading cause of cancer-related deaths worldwide, and hepatocellular carcinoma (HCC) accounts for 70% to 85% of the total liver cancer burden (1). Surgical resection represents the most effective treatment with curative potential for HCC (2). However, due to aggressive growth and late symptom presentation, most HCC patients are diagnosed at advanced stages and are not eligible for surgical treatments (3). To improve patient survival and quality of life, novel biomarkers of the prognosis and for the treatment of liver cancer urgently need to be explored (4).
Triggering receptor expressed on myeloid cells 2 (TREM2) encodes an innate immune receptor expressed on the surface of cells of the myeloid lineage, including monocytes, macrophages, osteoclasts, or microglia (5). TREM2 is an anti-inflammatory receptor that negatively regulates Toll-like receptor (TLR)-mediated inflammatory responses, whereas the proinflammatory receptor TREM1 augments TLR-induced inflammation (6). In recent years, the research community has focused its attention on the central role of TREM2 and myeloid cells in diverse pathologies (7). TREM2 has been extensively studied in microglia for its capacity to sustain microglial responses to neurodegenerative pathologies, such as Alzheimer’s disease (8). TREM2 promotes the optimal microglial function required to attenuate disease progression and is a potential target for eliciting a protective role of microglia in Alzheimer’s disease and other neurodegenerative diseases (8). TREM2 is also expressed in several peripheral macrophage populations involved in host defense and metabolism (9). In mouse liver, TREM2 is predominantly expressed in nonparenchymal cells, including Kupffer cells and hepatic stellate cells (10). In line with TREM2’s effects on inflammation, Kupffer cells and hepatic stellate cells isolated from Trem2-/- mice exhibit augmented proinflammatory responses upon TLR4 stimulation (10). Moreover, mice lacking Trem2 display exacerbated liver damage and inflammation in the context of toxin-induced hepatocellular injuries and even an elevated tumor burden in the early phases of liver tumorigenesis, suggesting that TREM2 plays a protective role in hepatocarcinogenesis (10, 11). An unbiased single-cell RNA sequencing (scRNA-seq) approach identified a subpopulation of circulating monocyte-derived scar-associated TREM2+CD9+ macrophages (SAMs) that spatially accumulate within the fibrotic niche of cirrhotic human livers (12). Trem2- and Cd9-expressing hepatic lipid-associated macrophages (LAMs) have also been described recently in metabolic-associated fatty liver disease (13–15). However, the role of TREM2 in human cancer is poorly understood. Several studies suggest that high TREM2 expression correlates with worsened outcomes in various cancers, including gastric cancer, glioma, and renal cell carcinoma (16–18). In contrast, a recent study showed that TREM2 expression was decreased in hepatoma cells and acted as a tumor suppressor (19). Thus, the function of TREM2 in human HCC, especially in tumor immune responses, warrants further investigation.
In the current study, we systematically interrogated the single-cell transcriptomes of human HCC tissues and found that TREM2 was enriched in a macrophage subgroup derived from tumor tissues that resemble LAMs. The presence of these cells and the prognostic significance of TREM2 expression were confirmed in independent cohorts. Comparative analyses of cell trajectories, cellular interactions, and gene regulatory networks led to the identification of a novel immunosuppressive role of TREM2 in HCC. In addition, we investigated the prognostic value of TREM2+ LAM-like cells by correlating the scRNA-seq data with bulk RNA sequencing (RNA-seq) profiles from publicly available datasets. These results will help elucidate the biological significance of TREM2 and promote the improvement of clinical treatment strategies for HCC patients.
Materials and Methods
Data Acquisition
The human HCC scRNA-seq data described by Sharma et al. (20) were derived from Seurat integration of fetal liver, adjacent liver, and tumor cells from HCC patients (n=14) and were downloaded from https://data.mendeley.com/datasets/6wmzcskt6k/1 as the Discovery cohort. Droplet-based expression profiles of single CD45+ immune cells from five HCC patients (Validation cohort 1) were obtained from the Gene Expression Omnibus (GEO) database under accession number GSE140228 (21), and data from tumor and adjacent liver tissues were extracted according to tissue site. Gene expression and clinical information from The Cancer Genome Atlas Liver Hepatocellular Carcinoma (TCGA-LIHC) project, comprising 374 tumors and 50 normal samples, were downloaded from the Genomic Data Commons (GDC) Data Portal (https://portal.gdc.cancer.gov/). Patients with a follow-up time of 0 days were excluded from the survival analysis. A liver cancer microarray dataset containing 225 HBV-related HCC and 220 nontumor tissues under accession number GSE14520 (GPL3921 Affymetrix HT Human Genome U133A Array) was obtained.
Single-Cell RNA Sequencing Data Processing
To construct a global HCC atlas, the Seurat R package (v4.0.0) (22) was used for quality control of single cells, data normalization, dimension reduction, and unsupervised clustering. Specifically, cells with less than 200 unique molecular identifier (UMI) counts or over 10% mitochondrial UMIs were considered low-quality cells and removed. The normalization methods LogNormalize and SCTransform with default parameters were adopted for the human HCC scRNA-seq data described by Sharma et al. and the GSE140228 dataset, respectively. The RunPCA function was applied to reduce the dimensionality of the datasets. Subsequently, the main cell clusters were identified using the FindClusters function (resolution = 0.8). Significant principal components were utilized for unsupervised Louvain clustering and visualized using uniform manifold approximation projection (UMAP) with default parameters.
Immunohistochemical Staining
Formalin-fixed paraffin-embedded tissue blocks from 113 HCC patients (Validation cohort 2) who underwent surgical resection without prior radiotherapy or chemotherapy between 2011 and 2019 were obtained from the First Affiliated Hospital, Shihezi University School of Medicine. Informed consent was obtained from the patients, and the study was approved by the Ethics Committee of the First Affiliated Hospital, Shihezi University School of Medicine. Tissue microarrays containing tumor specimens and corresponding noncancerous liver tissues were cut into 4-μm sections, dewaxed, and rehydrated. After heat-mediated antigen retrieval in EDTA buffer (pH 8.0) for 10 min using a pressure cooker, sections were rinsed with PBS and treated with 3% H2O2 to block endogenous peroxidase. Sections were blocked using 10% normal goat serum (ZLI-9022, ZSGB-BIO) and incubated with anti-TREM2 antibody (#91068, 1:1000, Cell Signaling Technology) overnight at 4°C, followed by secondary antibody incubation for 30 min at 37°C. Color was developed using 3,3-diaminobenzidine and counterstaining with hematoxylin. The counts for TREM2+ cells represent an average number of positively stained cells within three random intratumor areas under a 20X objective, as evaluated by experienced pathologists who were blinded to the clinicopathologic data.
Multiplex Immunofluorescence Staining
Multiplex staining was performed using a multiplex fluorescent immunohistochemistry staining kit (Yuanxibio) according to the manufacturer’s instructions with the following primary antibodies/fluorescent dyes: TREM2 (#91068, 1:1000, Cell Signaling Technology)/Neon-TSA620, FoxP3 (MAB8214, 1:200, R&D Systems)/Neon-TSA520, and CD163 (ab182422, 1:300, Abcam)/Neon-TSA670. Primary antibodies were sequentially applied, followed by horseradish peroxidase-conjugated secondary antibody incubation (DS9800, Lecia Biosystems) and tyramide signal amplification. Sections were then counterstained with DAPI and scanned using the Pannoramic MIDI imaging system (3D HISTECH).
Pseudotime Trajectory Analysis
The Monocle3 R package (v0.2.1), an unsupervised algorithm that increases the temporal resolution of transcriptome dynamics (23), was used to infer the cell lineage trajectories of monocyte and macrophage subsets, with parameter num_dim = 50. The dimensionality of the data was reduced, and the cells were plotted and colored by pseudotime to visualize how the cell lineages varied along the trajectories of the UMAP plots using the plot_cells function. Dynamics of gene expression within the trajectories were visualized with the plot_genes_in_pseudotime function.
Pathway Analysis
Gene set enrichment analysis (GSEA) (24) was applied using 50 hallmark gene sets (h.all.v7.4.symbols.gmt) to identify significantly enriched functional pathways via GSEA software (v4.1.0), with screening criteria of nominal P-value < 0.05 and false discovery rate (FDR) q value < 0.25.
The functional phenotypes of each macrophage subset were defined using gene set variation analysis (GSVA) with the GSVA package (25). The gene signatures used for GSVA analysis are listed in Supplementary Table 1. The angiogenic and phagocytic signatures were described by Cheng et al. (26) in the supplemental data. The gene sets associated with M1/M2 polarization were described by Azizi et al. (27). The metabolic signatures of the TCA cycle, lipolysis, and glutamine metabolism were obtained from PathCards (https://pathcards.genecards.org/).
Cell-Cell Interaction Analysis
CellPhoneDB (https://www.cellphonedb.org), a Python-based tool for systematic analysis of cell-cell communication networks, was used to infer ligand-receptor interactions among TREM2+ LAM-like cells, T cells, and endothelial cells in adjacent liver and tumor tissues. Ligand-receptor interactions between two cell clusters were identified based on the specific expression of a receptor by one cell population and a ligand by another cell type. Interaction pairs with P-value < 0.05 were selected. Circle plots illustrating the interactions between cell types were drawn using the chordDiagram function from the circilize package (v0.4.12).
CellChat, another tool that can quantitatively infer and analyze intercellular communication networks from scRNA-seq data, delineates the specific signaling roles played by each cell type (28). The computeCommunProbPathway function was used to compute the communication probability at the signaling pathway level by summarizing all related ligands/receptors with default parameters. The contribution of each ligand-receptor pair to the overall signaling pathways was computed and visualized using the netAnalysis_contribution function.
Gene Regulatory Network Analysis
SCENIC, a computational workflow that predicts transcription factor (TF) activities from scRNA-seq data (29), was used to construct gene regulatory networks (GRNs) in myeloid cell subsets from human HCC samples with default parameters, and the normalized data matrix from Seurat was used as input. Specifically, the output from GENIE3/GRNBoost was converted to coexpression modules, and the runGenie3 function with parameter nParts = 20 was used to infer gene coexpression networks. To prune coexpression modules, TF motif enrichment analysis with RcisTarget was utilized to identify TF binding motifs. Regulons in individual cells were scored by AUCell with the runSCENIC_3_scoreCells function.
SEEK analysis (https://seek.princeton.edu/seek/), a tool that navigates the massive human expression compendium (30), was applied to validate that the predicted regulons were functionally related to their associated cell types. The human version of SEEK was used to evaluate whether the genes in a regulon were coexpressed in a given cell type. It could be inferred that the function of a regulon was highly associated with a cell type if the genes were significantly coexpressed in many datasets related to the specific cell type.
LXR Agonist Stimulation and Gene Silencing
Authenticated human monocytic THP-1 cells were purchased from the Cell Bank, Type Culture Collection, Chinese Academy of Sciences. THP-1 cells were maintained in RPMI-1640 medium (Gibco) supplemented with 10% FBS, 0.05 mM 2-mercaptoethanol, and 1% penicillin-streptomycin at 37°C in a humidified 5% CO2 atmosphere. THP-1 cells (2×10⁵ per well) were seeded in 12-well plates and differentiated using 50 ng/ml phorbol 12-myristate-13-acetate (PMA; CS0001, Multi Sciences) for 48 hours to obtain macrophage-like cells. Then, the cells were treated with the LXR agonists GW3965 and T0901317 (Selleck Chemicals) at 1 μM for 24 hours. For gene silencing, differentiated THP-1 cells were transfected with small interfering RNA (siRNAs) targeting NR1H3 (LXR-α), HIF1A (HIF-1α), or scramble control (GenePharma) with GP-transfect-Mate (GenePharma). Oligonucleotide sequences for gene knockdown are listed in Supplementary Table 2. All experiments were performed with mycoplasma-free cells.
qRT-PCR
Total RNA was extracted using the E.Z.N.A. Total RNA Kit I (Omega Bio-tek). Complementary DNA was synthesized using a RevertAid First Strand cDNA Synthesis Kit (Thermo Scientific). Gene expression levels were detected using the UltraSYBR Mixture (CWBIO). The relative expression levels of the target genes were normalized to that of β-actin using the 2-ΔΔCt method.
Deconvolution of Bulk RNA-Seq Data
The relative abundance of infiltrating immune cell types, estimated using CIBERSORT with a signature matrix containing 22 functionally defined immune subsets (LM22), in each tumor sample from the TCGA-LIHC dataset was obtained from https://gdc.cancer.gov/about-data/publications/panimmune. To evaluate the clinical relevance of the macrophage clusters identified in the present study, a custom signature matrix was first constructed by CIBERSORTx (31) from the scRNA-seq data of myeloid cells derived from the Discovery cohort (summarized as transcripts per million) with Single Cell Input Options = 0. Based on the signature matrix, the macrophage composition of each tumor sample was deconvolved with S-mode batch correction.
Enrichment scores of 24 immune cell types, for which marker genes were extracted from Bindea et al. (32), were calculated using single-sample gene set enrichment analysis (ssGSEA) implemented in the GSVA R package with default parameters.
Statistical Analysis
Comparisons of changes between two groups were performed using nonparametric paired or unpaired Wilcoxon tests or parametric Student’s t-tests. Kaplan-Meier analysis and Cox hazard regression analysis were used to estimate patient survival using the survival and survminer R packages. P < 0.05 was considered statistically significant.
Results
Overview of Single Cells Derived From HCC and Nonmalignant Tissues
To explore the complexity of TREM2+ cells in the tumor microenvironment (TME), we first characterized the human HCC single-cell transcriptome atlas of tumor and corresponding nontumor samples from 14 HCC patients (20) (Discovery cohort). After quality control and removal of batch effects, a total of 73,564 cells were subjected to downstream analyses. We identified and visualized 11 major cell clusters through UMAP plots (Figure 1A). Cell type-specific markers for each cluster were identified based on the top differentially expressed genes and used to annotate cell types (Figure 1B). Among all the major cell types, we found that TREM2 was mainly expressed in myeloid cells, the proportion of which was significantly higher in tumor samples than in adjacent liver tissues (Figures 1C, D). These findings suggested a central role of myeloid cells in TREM2-mediated immune signaling.
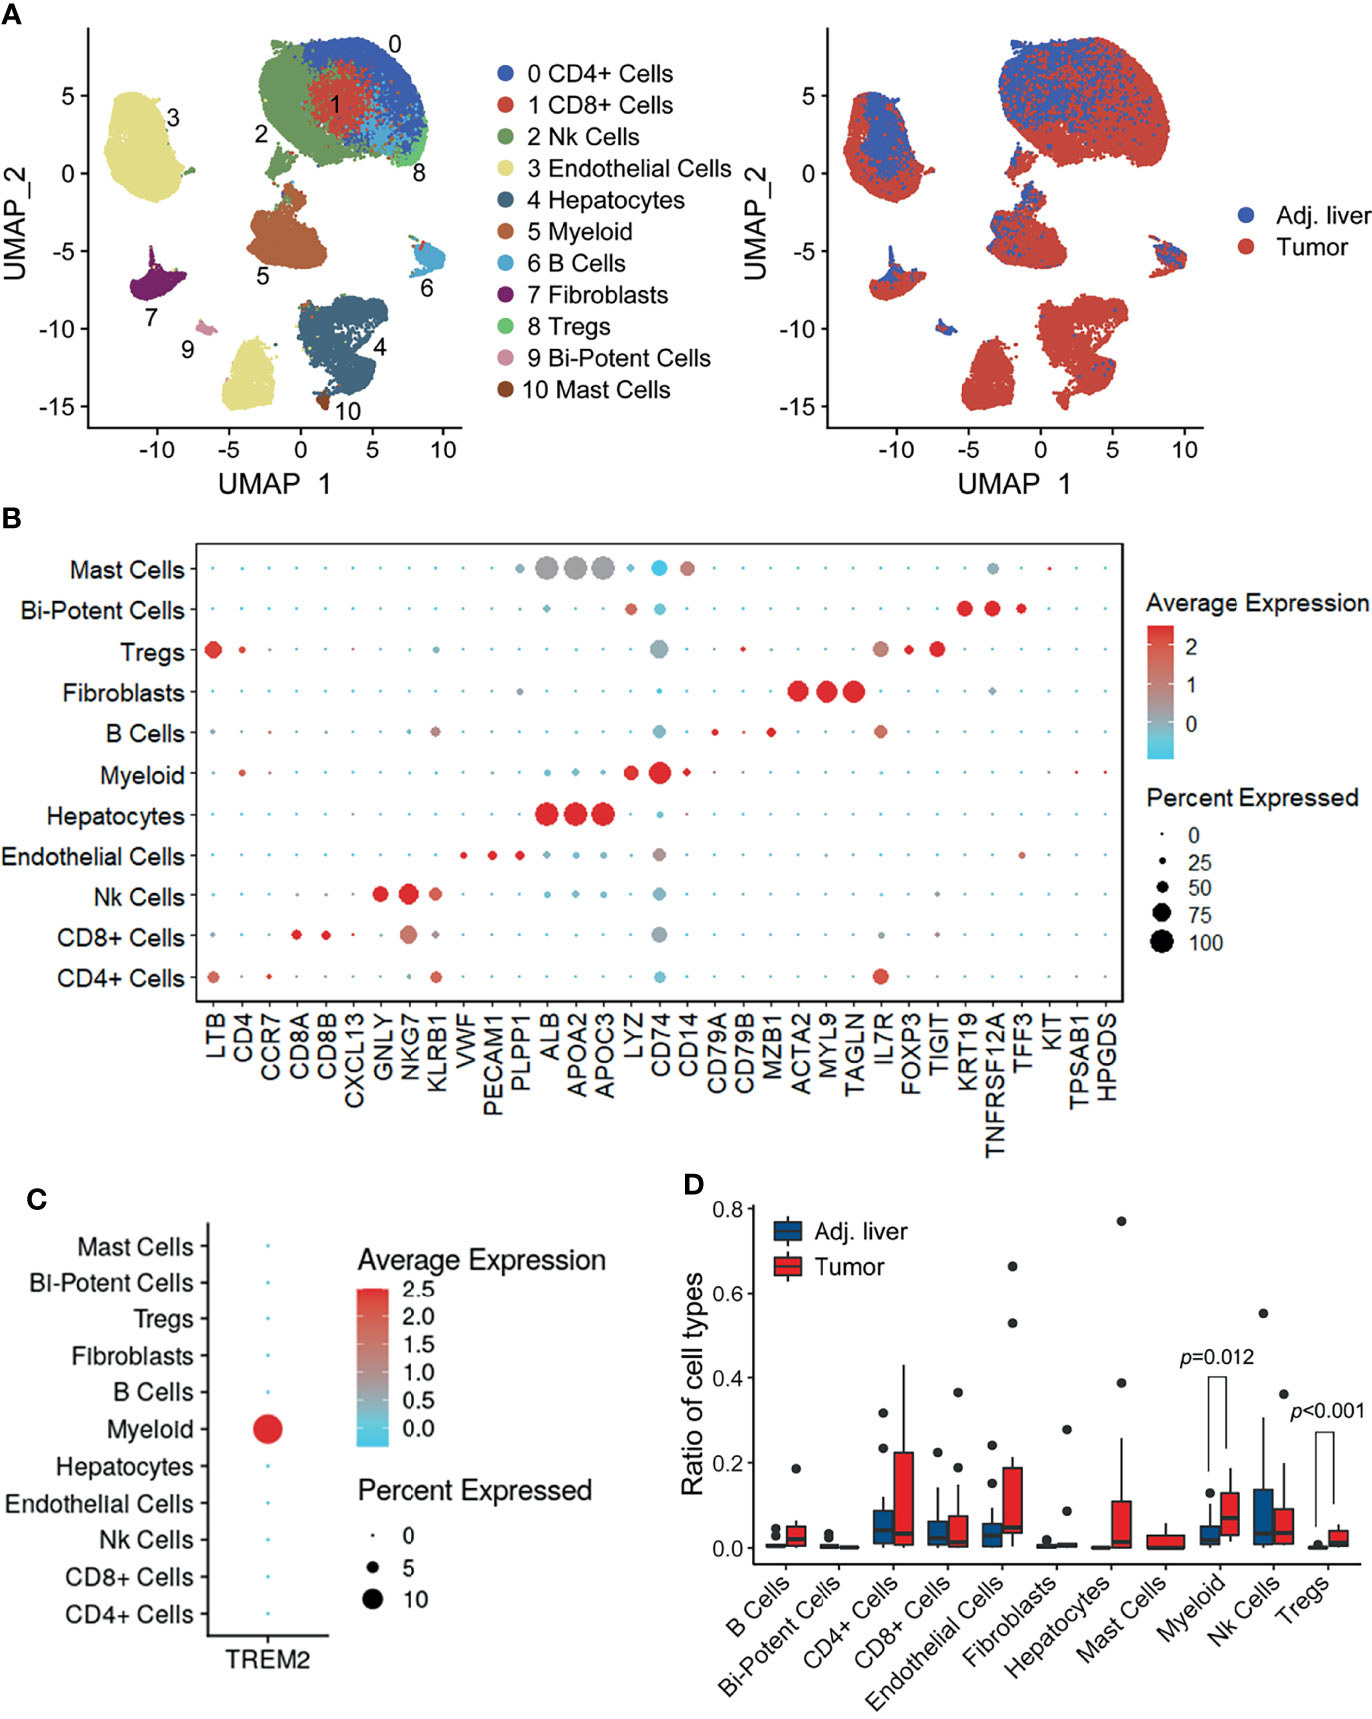
Figure 1 Overview of infiltrating cell types in HCC. (A) UMAP projection of single cells derived from 14 HCC patients colored by cell clusters (left) and tissue origin (right). (B) Bubble heatmap depicting the expression levels of cluster-specific marker genes. The dot size indicates the fraction of expressing cells, and dots are colored based on average expression levels. (C) Dot plot showing the expression levels of TREM2 in the major cell types. (D) Box plot illustrating the fractions of the indicated cell types (divided by the total cell number) in adjacent liver and tumor tissues. Significance was determined using unpaired Wilcoxon test.
Identification of the Tumor-Infiltrating TREM2+ Macrophage Subtype
Subsequently, we set out to identify the TREM2-expressing cell subtypes in the myeloid cell lineage. Further clustering of myeloid cells gave rise to 9 subpopulations representing monocytes, macrophages, and dendritic cells (cells resembling doublets were removed from further analyses; Figure 2A). We noticed that TREM2 was expressed almost exclusively in tumor-derived cells (Figure 2B). The TREM2+ macrophage subpopulation was characterized by the high expression of the marker genes TREM2, FOLR2, and CD163 (Figure 2C). Notably, as the gene expression profile of TREM2+ macrophages best resembled those of recently described hepatic LAMs (Supplementary Figure 1), we referred to this subset as TREM2+ LAM-like cells. In addition, TREM2+ LAM-like cells were predominantly enriched in tumor compared with adjacent nontumor tissues, although displayed a comparable expression level of TREM2 (Figures 2D, E). To verify the findings from single-cell analysis in the Discovery cohort, we collected the scRNA-seq profiles of tumor and adjacent liver tissues from five additional HCC patients (21) (Validation cohort 1). The results confirmed the preferential enrichment of the TREM2+ LAM-like cells subpopulation in tumor samples (Supplementary Figures 2A–F), demonstrating the rationality of our cluster identification. To confirm the presence of TREM2+ LAM-like cells, we also performed dual-color immunofluorescence staining and found that TREM2+CD163+ macrophages were highly enriched in HCC tissues (Figure 2F). Differentially expressed gene analysis identified SPP1 and CCL2 as significantly upregulated genes in those TREM2+ LAM-like cells derived from tumor samples compared to those derived from adjacent liver tissues (Figure 2G), in line with reports stating that SPP1 is secreted by infiltrating macrophages and stimulates angiogenesis (33) and that CCL2 participates in tumor-mediated immunosuppression by recruiting immunosuppressive Treg cells and myeloid-derived suppressor cells into the glioblastoma microenvironment (34).
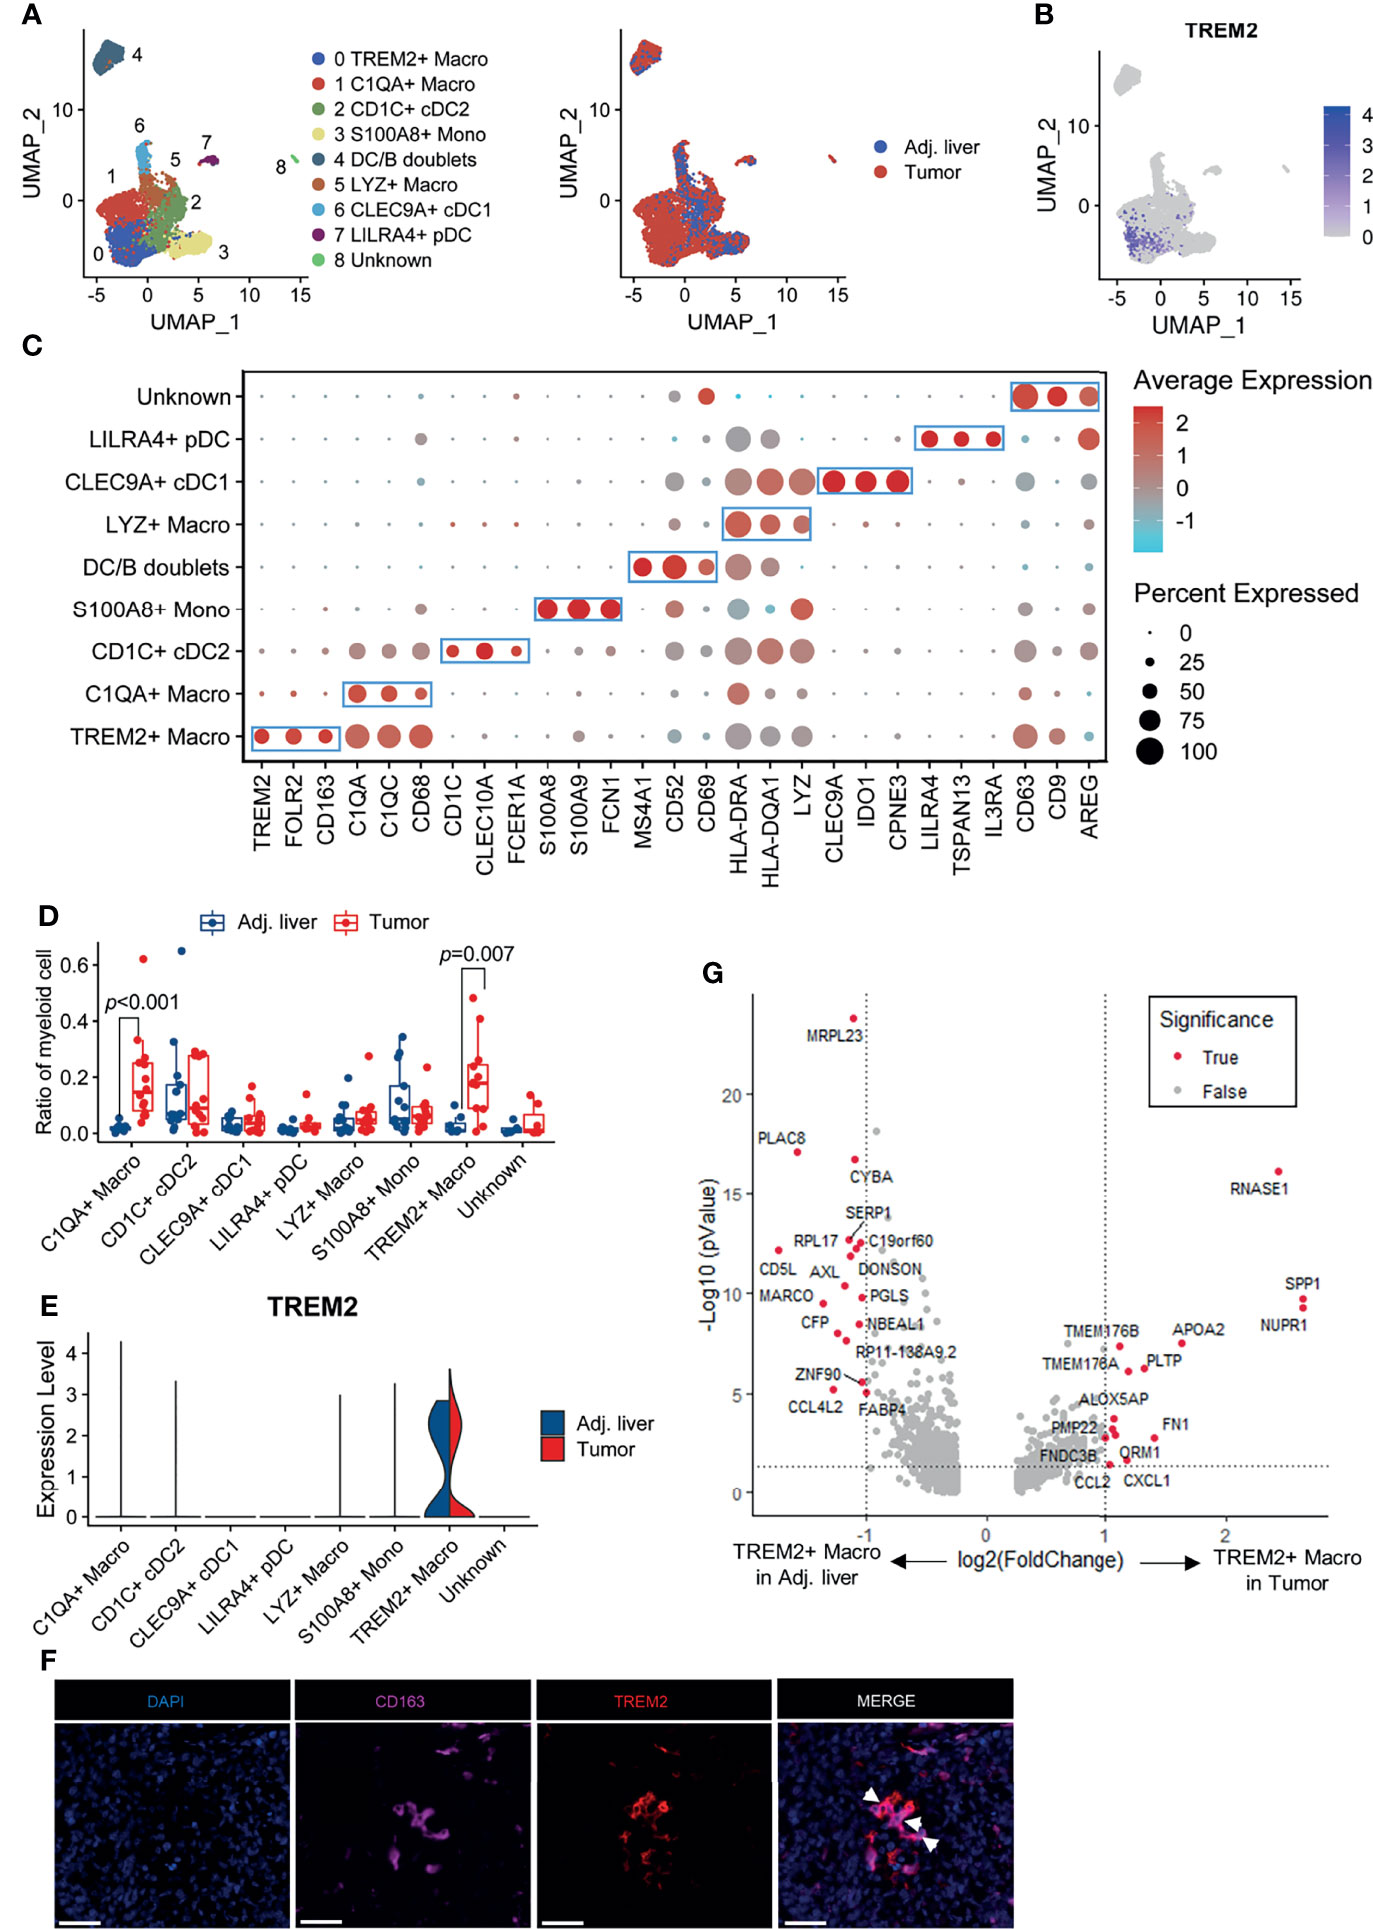
Figure 2 TREM2 expression defines a tumor-infiltrating myeloid subpopulation. (A) UMAP projection showing the subtypes of myeloid cells colored by cluster (left) and tissue origin (right). (B) UMAP plot of myeloid cells colored by TREM2 expression level. (C) Bubble heatmap depicting the expression of marker genes in the indicated subtypes of myeloid cells. The dot size indicates the fraction of expressing cells, and the dots are colored based on average expression levels. (D) Box plot representing the fraction of myeloid subgroups in tumor and adjacent liver tissues. Significance was determined by unpaired Wilcoxon test. (E) Violin plot showing the expression level of TREM2 in myeloid subgroups derived from tumor and adjacent liver tissues. (F) Representative images of immunofluorescence staining of TREM2 and CD163 in HCC tissues, showing the infiltration of TREM2+CD163+ macrophages. The scale bar represents 50 μm. (G) Volcano plot showing differentially expressed genes between TREM2+ macrophages derived from tumor samples and those derived from adjacent liver tissues. Significance was determined by Benjamini-Hochberg adjusted two-sided Wilcoxon test.
High Expression of TREM2 Correlates With High Infiltrating Macrophage Abundance and Poor Prognosis
To address the significance of our findings that TREM2 was predominantly expressed by a macrophage subpopulation enriched in tumor tissues, we first analyzed TREM2 protein expression by immunohistochemical staining of tissue microarrays containing matched adjacent liver and tumor specimens obtained from 113 HCC patients (Validation cohort 2). The accumulation of TREM2+ cells was confirmed in virtually all tumor samples, while TREM2 staining was scant or absent in adjacent liver tissues (Figure 3A), suggesting that TREM2 may be a particularly attractive therapeutic target. The number of TREM2+ cells in HCC tissues was significantly higher than that in adjacent liver tissues (Figure 3B). We next explored the association between TREM2 expression and clinical outcomes in patients from publicly available datasets. Upregulated TREM2 expression levels in liver cancer compared to nontumor tissues were validated in the TCGA-LIHC and GSE14520 datasets (Figure 3C and Supplementary Figure 3A). In the TCGA-LIHC cohort, TREM2 expression correlated with inferior overall and disease-specific survival (Figure 3D). To infer the relationship between TREM2 expression and immune cell characteristics, we performed Spearman’s correlation analysis of the enrichment scores of 24 immune-related cells calculated by ssGSEA. The TREM2 expression level showed the strongest positive correlation with macrophages and Th2 cells (Figure 3E, Supplementary Figure 3B). A simple categorization system, namely classically activated M1 and alternatively activated M2 macrophage polarization, has been previously used to describe the in vitro activation phenotypes of macrophages (26). We also explored the association between TREM2 expression and immune cell infiltration abundance deconvoluted by CIBERSORT to assess immune functions. A higher proportion of M2 and M0 macrophages but fewer monocytes and CD4+ memory resting T cells were observed in tumors with high TREM2 expression in both the TCGA-LIHC and GSE14520 cohorts (Figure 3F, Supplementary Figure 3C).
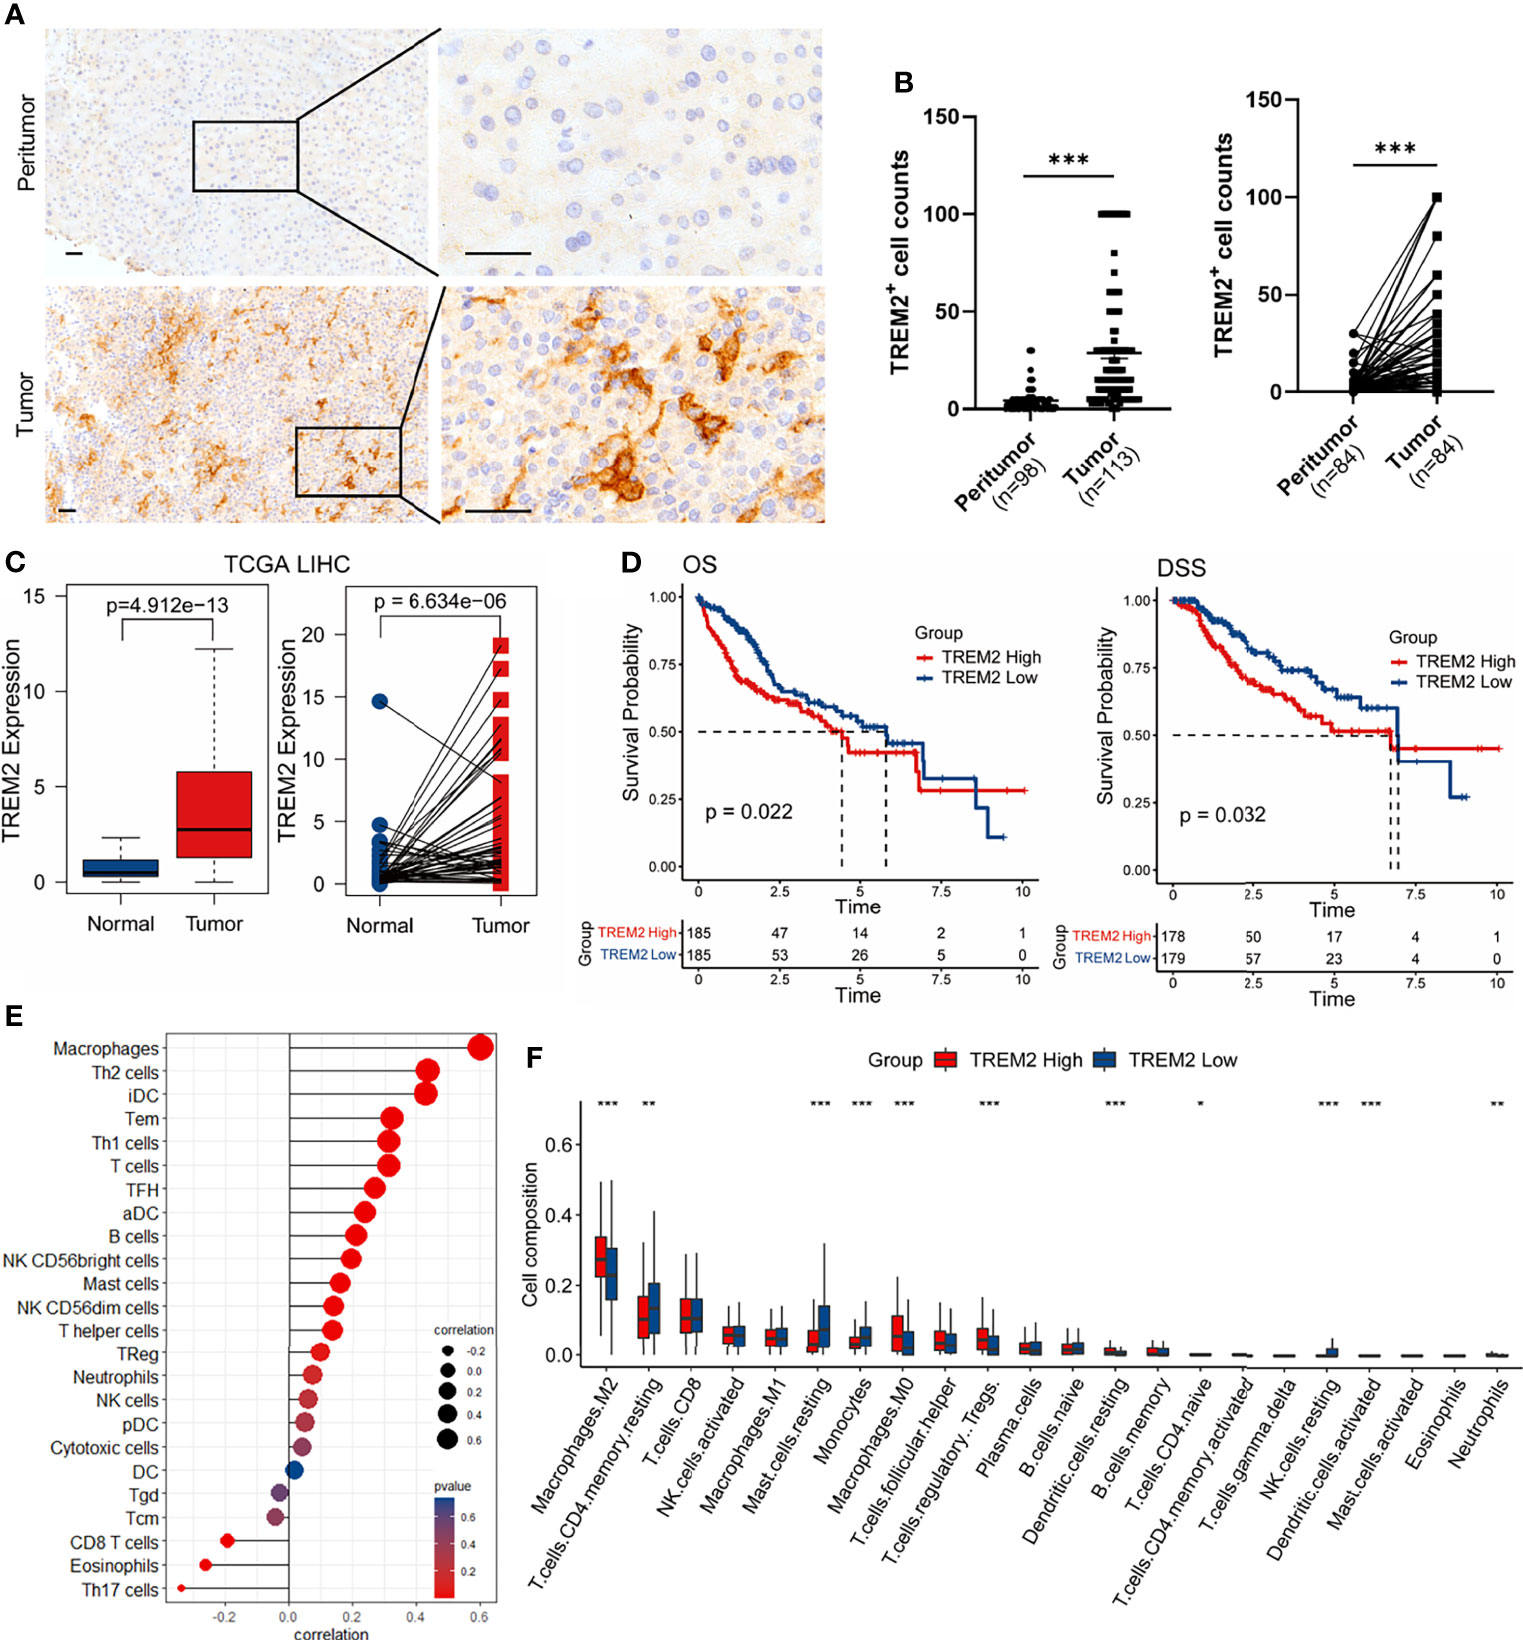
Figure 3 TREM2 is upregulated in HCC and correlates with worse outcomes. (A) Representative images of immunohistochemical staining of TREM2 expression in HCC samples and peritumor tissues. The scale bar represents 50 μm. (B) Statistical analysis of TREM2+ cell counts in all (left) or paired (right) tumors and peritumor tissues from Validation cohort 2. Significance was determined by unpaired or paired Wilcoxon tests. (C) Box plots comparing TREM2 expression between all (left) or paired (right) tumor and normal samples from the TCGA-LIHC cohort. P values were determined by unpaired or paired Wilcoxon test. (D) Kaplan-Meier curves for overall survival (OS) and disease-specific survival (DSS). Patients were divided into high and low TREM2 expression groups using the median value as the cutoff. P values were calculated using the log-rank test. (E) Lollipop plot depicting Spearman’s correlation coefficients between TREM2 expression and 24 immune cell types calculated by ssGSEA in the TCGA-LIHC cohort. (F) Box plot illustrating the infiltration of 22 immune cell types estimated by CIBERSORT in patients with high and low TREM2 expression levels. Significance was determined by unpaired Wilcoxon test. *P < 0.05, **P < 0.01, ***P < 0.001.
State Transition of TREM2+ LAM-Like Cells
To explore the cell fate transition of infiltrating TREM2+ LAM-like cells in HCC, we inferred cell trajectories by using Monocle3. Pseudotime analysis showed that the TREM2+ LAM-like cells originated from S100A8+ monocytes, which had the lowest pseudotime value, and developed through an intermediate state of C1QA+ macrophages (Figures 4A–C). To delineate the functional profile of the TREM2+ macrophage subtype, we assessed angiogenesis/phagocytosis-, M1/M2 polarization-, and metabolism-associated signature genes. As expected, TREM2+ LAM-like cells showed preferential expression of genes involved in angiogenesis and higher M2 polarization scores (Figure 4D). However, there is a limitation for the in vitro M1/M2 dualistic model to fully discriminate TREM2+ LAM-like cells from C1QA+ macrophages, suggesting more complex phenotypes of macrophages in the TME. Analysis of energy metabolism pathways showed that the TREM2+ macrophage subtype exhibited the highest expression scores for glutamine metabolism and lipolysis (Figures 4D), indicating that metabolic disorders might contribute to macrophage dysfunction, consistent with glutamine promoting M2 macrophage polarization (35). GSEA revealed that genes involved in hypoxia, glycolysis, and angiogenesis were significantly enriched in TREM2+ LAM-like cells (Figure 4E), which was confirmed in Validation cohort 1 (Supplementary Figure 2G). On the other hand, TREM2- macrophages were significantly enriched in interferon response pathways and oxidative phosphorylation pathways (Figure 4E), further confirming the proangiogenic phenotype and immunosuppressive state of TREM2+ LAM-like cells.
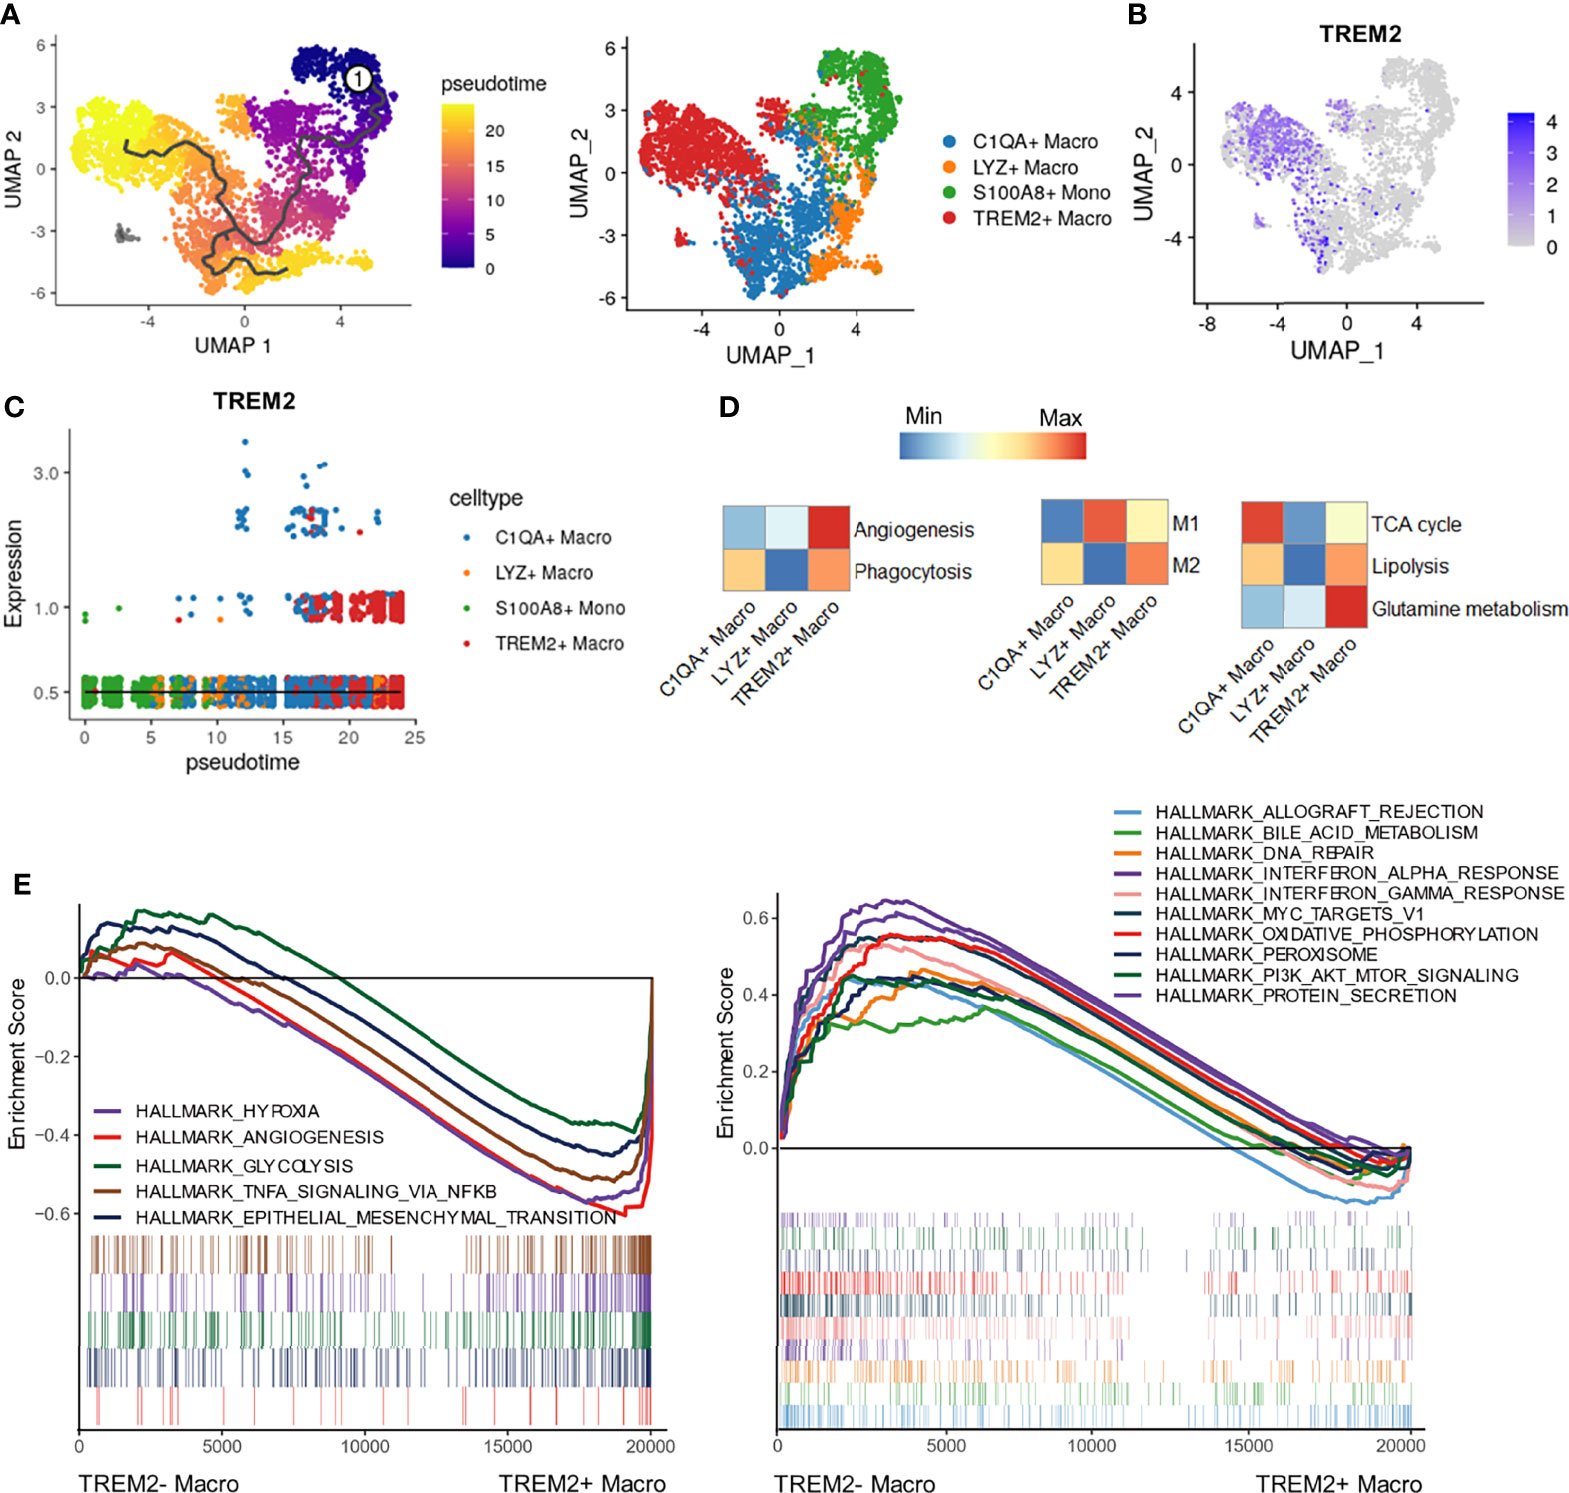
Figure 4 Cellular trajectory and functional phenotypes of TREM2+ macrophages. (A) Pseudotime trajectory analysis of TREM2+ macrophages. (B) UMAP plot showing the expression of TREM2 in macrophage subpopulations and monocytes. (C) 2D pseudotime graph showing the dynamic change in TREM2 expression. Cell subtypes are labeled by colors. (D) Heatmaps showing different expression patterns of the indicated signature genes among macrophage subtypes calculated by GSVA. (E) Enrichment plots of significantly enriched hallmark gene sets in TREM2+ and TREM2- macrophages.
Interaction Network of TREM2+ LAM-Like Cells
Based on the above signature analysis, we employed CellPhoneDB (36) to identify potential ligand-receptor pairs between TREM2+ LAM-like cells, endothelial cells, and T cells, thus deciphering the intercellular communications in the HCC TME. We observed 627 ligand-receptor interactions in adjacent liver tissues and 763 interactions in tumors (Figure 5A). More interactions between TREM2+ LAM-like cells and T cells (CD4+, CD8+, and Treg cells) were detected in the microenvironment of tumors than in adjacent liver tissues (Figures 5B, C). Interactions between TREM2+ LAM-like cells and CD4+ and CD8+ T cells in HCC were mainly associated with immune-related ligands and receptors (CD40LG : CD40 and CD28:CD86 for CD4+ T cells; CD86:CTLA4 for CD8+ T cells). Notably, TREM2+ LAM-like cells displayed obviously more immunosuppressive interactions with Treg cells in tumors than in adjacent liver tissues, which might dampen the function of effector T cells. TREM2+ LAM-like cells were also found to interact with Treg cells via the CCL20/CXCL9/CXCL10/CXCL12–CXCR3 axes, suggesting that TREM2+ LAM-like cells attract Treg cells via migration-related chemokines. These results highlight that TREM2+ LAM-like cells can regulate multiple T cell subsets, especially by recruiting suppressive Treg cells, which may induce a compromised antitumor immune response in HCC. Remarkably, we observed that FOXP3+ Treg cells and TREM2+CD163+ macrophages colocalized within the tumor ecosystem by employing multicolor immunofluorescence staining (Figures 5D, E). Taken together, these findings demonstrate that TREM2+ LAM-like cells can contribute to microenvironment remodeling and facilitate an immunosuppressive tumor ecosystem.
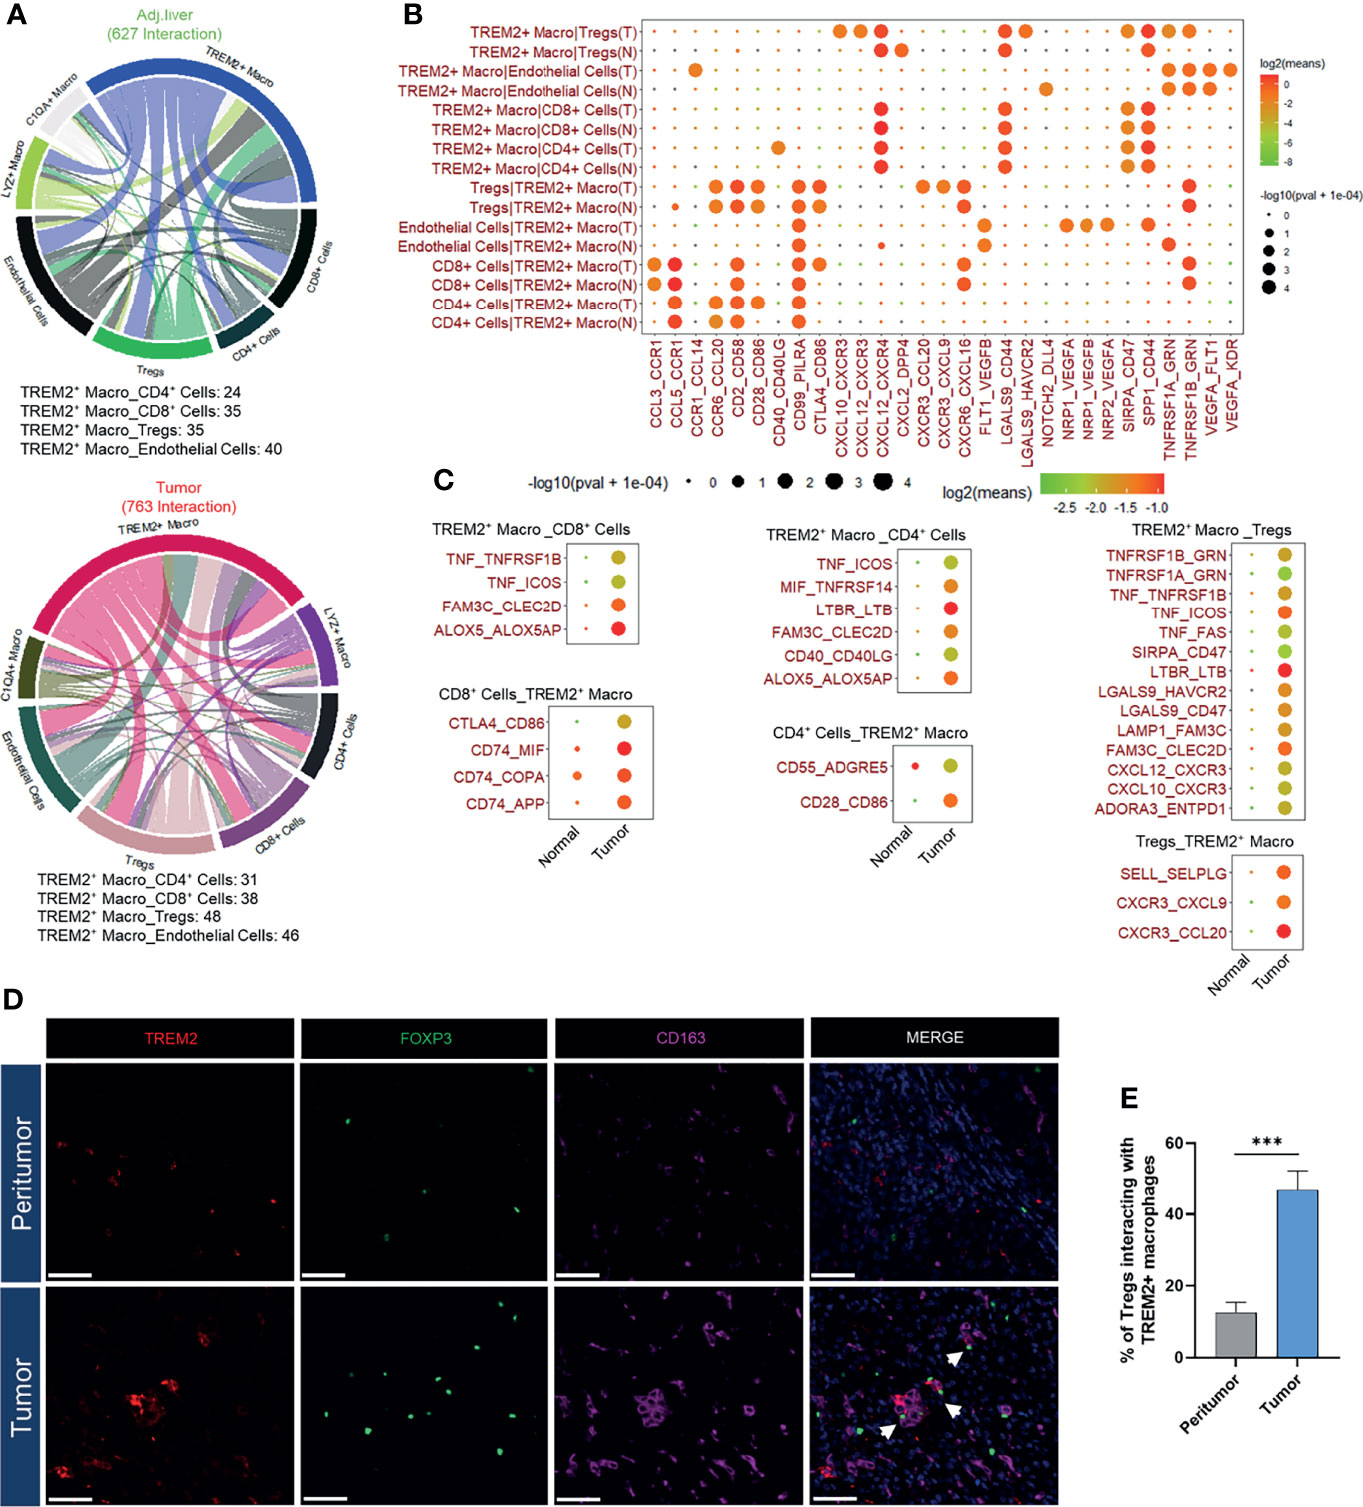
Figure 5 Characterization of the TREM2+ macrophage-based cellular interactome. (A) Chord diagrams of the cellular interactome between TREM2+ macrophages, T cells, and endothelial cells in adjacent liver and tumor tissues constructed by CellPhoneDB. (B) Bubble plot showing ligand-receptor interactions between TREM2+ macrophages, T cells, and endothelial cells in adjacent liver and tumor samples. Rows represent each cell-cell interaction pair, and columns define ligand-receptor pairs. The sizes of the bubbles indicate the significance of the interactions, as calculated by CellPhoneDB. (C) Dot plot of HCC-specific ligand-receptor interactions of TREM2+ macrophages with T cells. (D) Representative immunofluorescence images of TREM2, CD163, and FOXP3 staining in HCC and peritumor tissues. Arrows denote the proximity of TREM2+CD163+ macrophages and FOXP3+ Treg cells. The scale bar represents 50 μm. (E) Quantification of FOXP3+ Tregs interacting with TREM2+ macrophages in tumors and peritumor tissues. Significance was determined by Student’s t-tests.
Identification of Specific Regulators of TREM2+ LAM-Like Cells
To identify potential transcriptional regulators of TREM2+ LAM-like cells, we employed SCENIC to decipher the gene regulatory network modules specific to each myeloid subtype. Eight major modules were identified across myeloid cells, and TREM2+ LAM-like cells were associated with module 5 (Figure 6A). We observed specific activation of the module-5-associated transcriptional factors NR1H3 (LXR-α), MAF, and HIF1A in TREM2+ LAM-like cells, but this activation was relatively absent in other monocyte–macrophage subsets (Figure 6B). We then ranked regulons in TREM2+ LAM-like cells according to their specificity score, which was defined based on the Jensen-Shannon divergence (37). NR1H3, MAF, and HIF1A were identified by network analysis as the most specific regulons associated with TREM2+ LAM-like cells (Figure 6C). To evaluate the accuracy of the regulon prediction, we applied SEEK analysis for GEO dataset data mining. The results indicated that the target genes in the NR1H3, MAF, and HIF1A regulons were significantly coexpressed in TREM2+ macrophage-related datasets (Figures 6D–F). We next employed in vitro assays to test the assumption that NR1H3 and HIF1A may facilitate the reprogramming of TREM2+ LAM-like cells. Activation of LXR with the synthetic agonists GW3965 and T0901317 triggered a significant increase in TREM2 expression levels in human macrophages. In addition, exposure to LXR agonists resulted in marked induction of HIF1A and downstream target genes related to hypoxia, glycolysis, and angiogenesis (GLUT1, HK2, and VEGFA; Figure 6G). In contrast, silencing NR1H3 or HIF1A with siRNA significantly reduced TREM2 expression (Figure 6H). Furthermore, analysis of publicly available datasets revealed that GW3965 augmented LXR-α binding peaks associated with the Trem2 gene locus in mouse macrophages (Supplementary Figure 4). These results highlight the potential role of LXR signaling in the establishment of a specific transcription program in TREM2+ LAM-like cells.
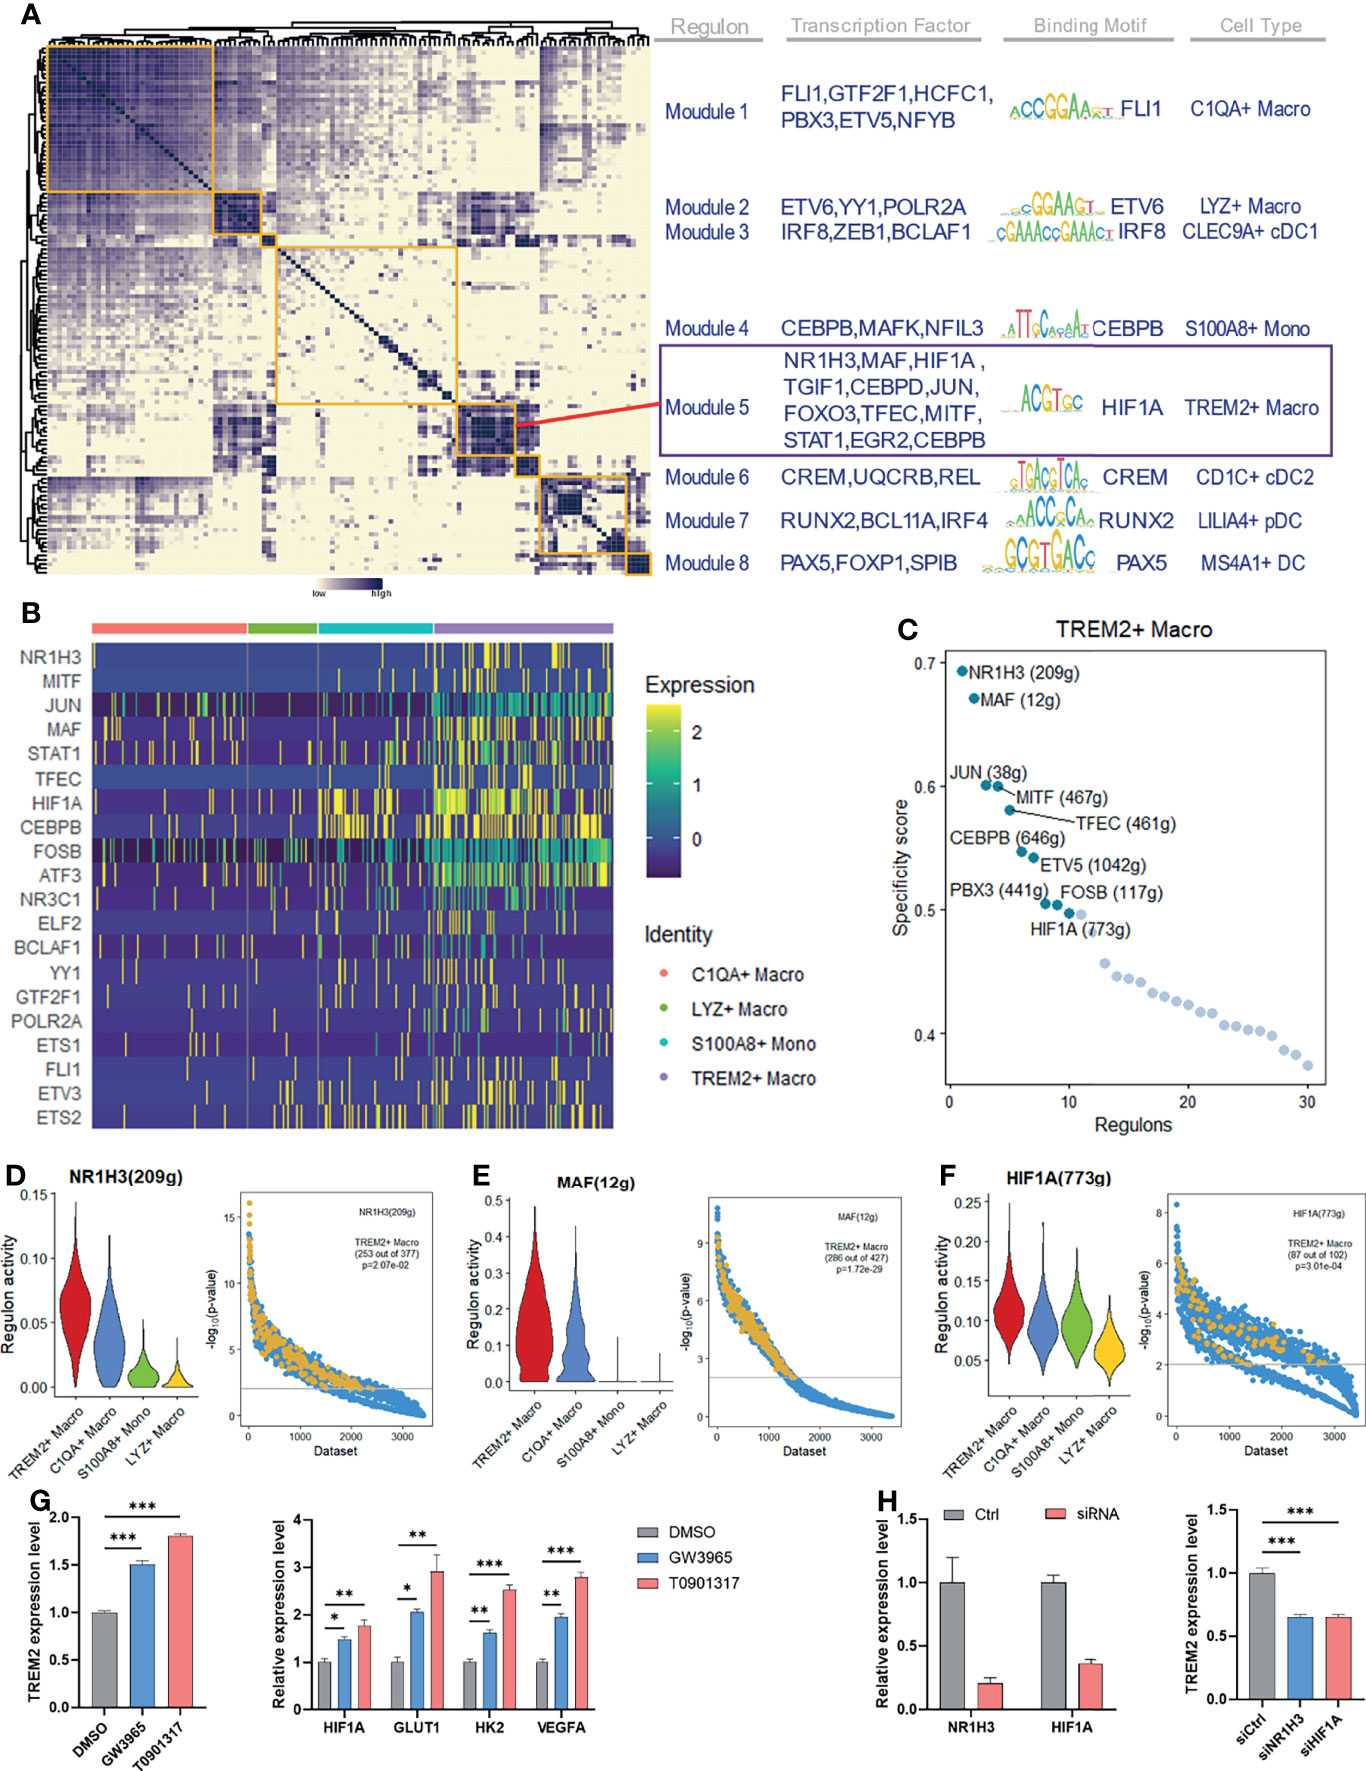
Figure 6 Identified specific regulators of the maintenance of TREM2+ macrophage identity. (A) Identification of regulon modules based on the regulon connection specificity index matrix in myeloid cells, along with representative transcription factors, corresponding binding motifs, and associated cell subtypes. (B) Heatmap showing the expression of the selected transcription factors across monocyte–macrophage subtypes. Columns denote cells; rows denote genes. (C) Rank of the regulons in TREM2+ macrophages based on the regulon specificity score. The g within the bracket indicates genes. (D–F) Violin plots showing the regulon activity in TREM2+ macrophages (left) and SEEK coexpression results for target genes of the indicated regulon in different GEO datasets. TREM2+ macrophage-related datasets with a significant correlation (P < 0.01) are highlighted by yellow dots. (G, H) PMA-induced THP-1 cells were treated with LXR agonists (G) or siRNAs (H). The relative expression levels of the indicated genes were determined by qRT-PCR. Significance was assessed using one-way ANOVA with Tukey’s post hoc test. *P < 0.01; **P < 0.01; ***P < 0.001.
Infiltration of TREM2+ LAM-Like Cells Is Associated With Worse Prognosis
To evaluate the relative abundance of the TREM2+ LAM-like subtype and its clinical relevance in liver cancer patients, a signature matrix was first created from human HCC scRNA-seq data (Figure 7A) using CIBERSORTx (31), providing a reference atlas for the deconvolution of bulk RNA-seq profiles. We assessed the hepatic monocyte–macrophage composition in the TCGA-LIHC cohort and found that the fraction of infiltrating TREM2+ LAM-like cells was significantly increased in tumor samples compared to normal tissues (Figure 7B). We also investigated the possible correlations between TREM2+ macrophage frequency and clinical features. The strip chart showed that the high TREM2+ macrophage group was significantly more likely to have advanced tumor grade, pathologic stage, and T stage (Figure 7C). On the other hand, patients with advanced tumor grade, pathologic stage, and T stage were significantly associated with increased accumulation of TREM2+ LAM-like cells (Figure 7D). Notably, Kaplan-Meier survival analysis demonstrated an apparent association between a higher fraction of TREM2+ LAM-like cells and unfavorable overall survival, progression-free interval, disease-free interval, and disease-specific survival in patients from TCGA-LIHC (Figure 7E, Supplementary Figures 5A–C). Moreover, univariate and multivariate Cox regression analyses indicated that TREM2+ macrophage frequency was an independent prognostic factor for survival prediction after adjusting for clinical factors, including age, sex, grade, and stage (Figure 7F, Supplementary Figures 5D–F).
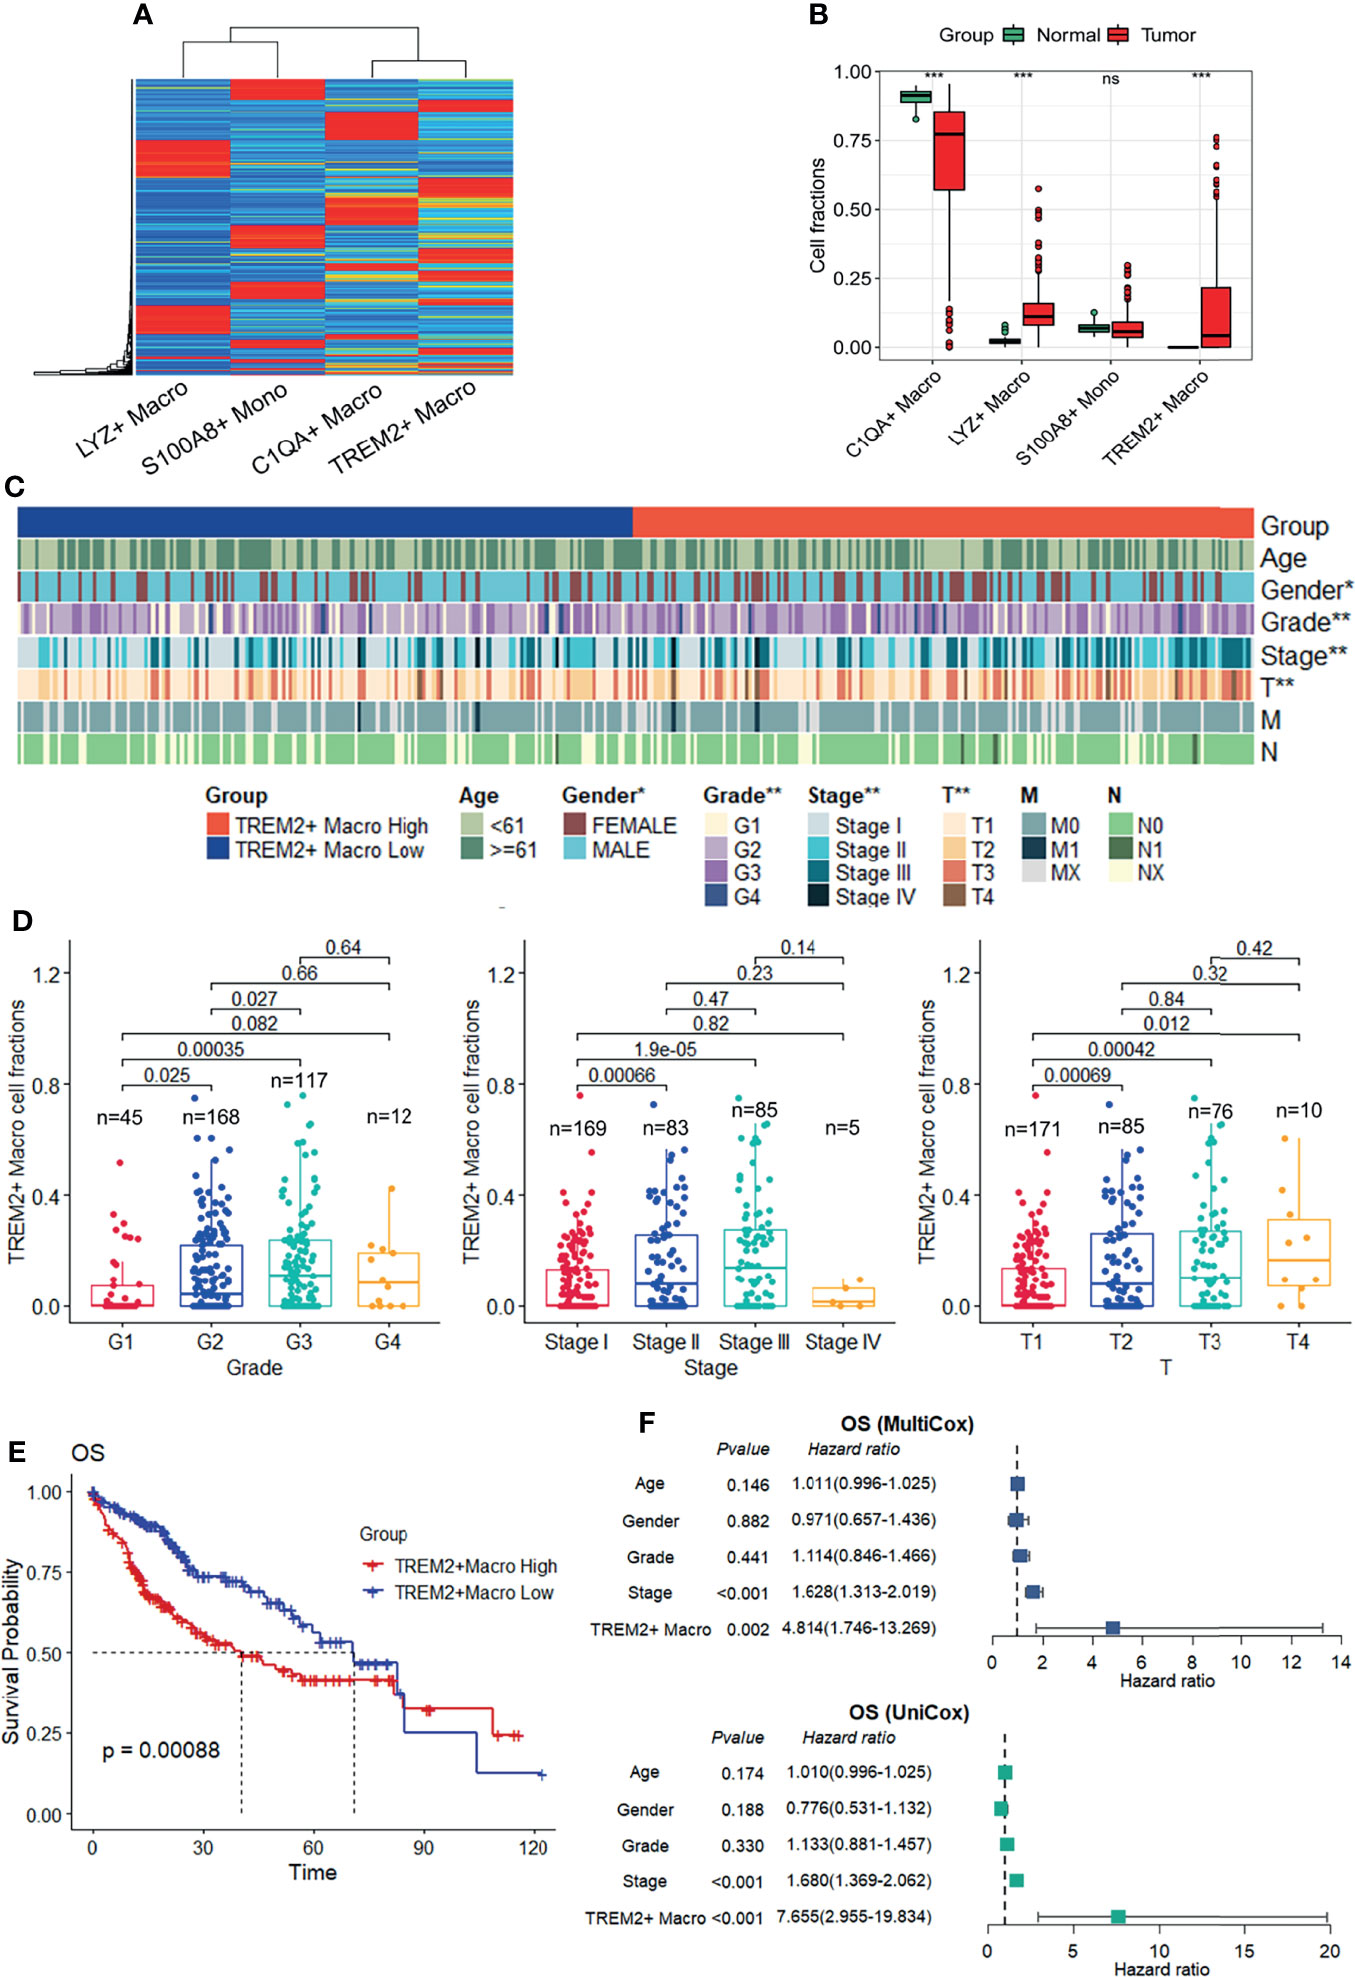
Figure 7 Prognostic role of the TREM2+ macrophage subtype in the TCGA-LIHC cohort. (A) The signature matrix created by CIBERSORTx. (B) Box plot showing the relative frequency of macrophage subtypes and monocyte infiltration calculated by CIBERSORTx with the default relative mode, which normalizes all cell fractions of the cell types in the signature matrix to 100%. Significance was determined by unpaired Wilcoxon test. (C) Strip chart showing the distribution of common clinical features, including tumor grade, AJCC pathologic stage, AJCC pathologic T, AJCC pathologic N, and AJCC pathologic M, in patients with a high or low fraction of TREM2+ macrophages. *P < 0.05, **P < 0.01. (D) Frequency of TREM2+ macrophages in patients with different tumor grades, pathologic stages, and T stages. P values were determined by chi-square tests. (E) Kaplan-Meier survival curves showing the overall survival (OS) of patients in the TCGA-LIHC cohort according to the frequency of TREM2+ macrophages. P-values were calculated using log-rank tests. (F) Univariate (top) and multivariate (bottom) Cox hazard ratio analyses of OS.
Discussion
The heterogeneity of the tumor ecosystem considerably reduces the efficacy of clinical treatments and makes prognostic prediction quite complicated in HCC (38). In recent years, the research community has focused on the central role of myeloid cells in diverse pathologies, with TREM2 being highlighted as a major pathology-induced immune signaling hub (7). In this study, we analyzed scRNA-seq data to explore the expression pattern and function of TREM2 in human HCC. We defined a group of macrophages that highly express TREM2 with a proangiogenic phenotype and an immunosuppressive state. Although these TREM2+ macrophages exhibited a transcriptome most similar to hepatic LAMs and were hence termed LAM-like cells, they share expression of a subset of genes associated with SAMs, consistent with the recent study (13). It is worth noting that the gene expression profile of TREM2+ LAM-like cells also showed some overlap with that of Kupffer cells but lacked the expression of TIMD4, MARCO, CD5L, and VCAM1. Further work is required to better understand the overlap with LAMs/SAMs and Kupffer cells and the precise nature of these TREM2+ LAM-like cells.
Functional enrichment analysis indicated the enrichment of angiogenesis, hypoxia, and glycolysis signaling pathways in TREM2+ LAM-like cells. The results are consistent with a prior study showing that Trem2 promotes the transition of proinflammatory macrophages to restorative macrophages and the emergence of endothelial cells during recovery from liver injury (39). A TREM2 loss-of-function mutation (T66M) impairs microglial function and causes a significant reduction in brain glucose metabolism (40). Indeed, TREM2-deficient microglia show decreased expression of glycolytic genes and impairment of cell energetic and biosynthetic metabolism in Alzheimer’s disease (41).
Intriguingly, ligand-receptor interaction analysis demonstrated that TREM2+ LAM-like cells could mediate VEGF signaling to promote angiogenesis. TREM2+ LAM-like cells were predicted to interact with endothelial cells using angiogenesis-related ligands and receptor pairs (VEGFA : KDR, VEGFA : NRP1, VEGFA : NRP2, VEGFA : FLT1, and VEGFB : NRP1) in the TME (Supplementary Figure 6A), in concordance with the single-cell atlas of cirrhotic human livers (12). We also identified the VEGF signaling pathway network via CellChat analysis and confirmed that TREM2+ LAM-like cells were prominent sources of VEGF ligands interacting with receptors expressed on endothelial cells (Supplementary Figure 6B), suggesting the importance of TREM2+ macrophage-mediated VEGF signaling in promoting angiogenesis in HCC.
TREM2 transmits intracellular signals in various contexts, leading to significant changes in cellular phenotypes and functions, including phagocytosis induction, lipid metabolism, and metabolic shift (7). Variation analysis of regulons with high expression levels between TREM2+ LAM-like cells and other monocyte–macrophage subgroups illustrated that NR1H3, HIF1A, and MAF were potential transcriptional regulators of TREM2+ LAM-like cells. In addition, our trajectory inference analysis showed that TREM2+ LAM-like cells would derive from monocytes, consistent with the origination of TREM2+ LAMs and SAMs (12–14). NR1H3 (LXR-α) stimulation in macrophages differentiated from human monocytic THP-1 cells showed increased TREM2, HIF1A, and downstream target genes related to hypoxia, glycolysis, and angiogenesis, suggesting that the LXR-α signaling would facilitate the reprogramming of TREM2+ LAM-like cells. Studies with primary human monocytes will further validate the role of LXR-α in acquiring TREM2 and other genes associated with the LAM-like phenotype. In line with these results, LXR-α represents an essential link between cholesterol accumulation and negative regulation of the inflammatory response in macrophages (42). The cholesteryl ester accumulation caused by TREM2 deficiency in microglia can be reversed by the LXR agonist GW3965 (43). In addition, LXR-α activation can potentiate HIF-1α signaling and glycolysis in human macrophages (44), and there is a positive feedback circuit connecting the activation of HIF-1α and LXR-α in foam cell formation (45). Furthermore, Maf, Atf3, and Hif1a are potential regulators of regulatory myeloid (Mreg) cells, while Hif1a is a potential regulator of tumor-associated macrophages in MCA205 mouse tumors; these two myeloid subpopulations share the expression of Arg1 and Trem2 (Arg1+Trem2+) (46). It has been suggested that anti-inflammatory TREM2 signaling may interfere with intrinsic mechanisms to combat neoplasia and promote profibrotic responses following liver damage (7). The TREM2+CD9+ subset of macrophages that differentiate from circulating monocytes expands during liver cirrhosis and contributes to fibrosis (12). Moreover, a nonalcoholic steatohepatitis (NASH)-related diet induces the collaboration of Atf3 with LXRs to induce Trem2 and Cd9 expression, promoting the establishment of the SAM and/or LAM phenotypes (47). Regulatory factors including ATF3 (increased in TREM2+ LAM-like cells; Figure 6B) might also collaborate with NR1H3 to modulate the reprogramming of human TREM2+ LAM-like cells. LXR-α,βDko mice develop M1 macrophage-predominant chronic lung inflammation and eventually peripheral lung squamous cell carcinoma-like lesions (48). The precise delineation of mechanistic regulators is warranted to understand better how the TREM2+ LAM-like cells are established in HCC.
TREM2 possesses immunosuppressive activities and promotes immune evasion in HCC. Survival analysis further showed that HCC patients with TREM2+ macrophage enrichment in tumor tissues had significantly shorter survival. TREM2+ macrophage frequency could serve as an independent predictor of prognosis, suggesting TREM2 as a promising therapeutic target to reverse the myeloid cell-derived immune-suppressive environment. In contrast, strategies employing agonistic compounds that enhance TREM2 signaling to boost the healing activities of macrophages and microglia are adopted for Alzheimer’s disease. Given that TREM2 was found to play a protective role in hepatocarcinogenesis in a mouse model, we hypothesize that TREM2+ LAM-like cells are a double-edged sword: they restrict inflammatory injury and tumorigenesis in the early stage but suppress the antitumor immune response and promote cancer progression in the later period.
In summary, our comprehensive characterization of TREM2+ LAM-like cells uncovered their potential as a novel prognostic biomarker and therapeutic target for HCC (Supplementary Figure 7). A further mechanistic understanding of TREM2 expression regulators and their downstream signaling pathways is expected to enable the development of effective immunotherapies targeting these myeloid mediators in cancers, including HCC.
Data Availability Statement
The data sets analyzed during this study are available in public, open access repositories listed in this article.
Ethics Statement
The studies involving human participants were reviewed and approved by the Ethics Committee of the First Affiliated Hospital, Shihezi University School of Medicine. The patients/participants provided their written informed consent to participate in this study.
Author Contributions
LW and JH conceived the study. LZ, MW, HG, YZ, and ML searched and analyzed the data. LZ, MW, and HG wrote the draft of the paper. JH, XW, XC, and LW revised the manuscript. All authors have read and approved the final manuscript.
Funding
This work was supported by the Science and Technology Cooperation Program of Xinjiang Production and Construction Corps (2021BC002), the Youth Science and Technology Innovation Leading Talents Project of Xinjiang Production and Construction Corps (2020CB015), the Youth Innovation Talents Project of Shihezi University (CXBJ201907), and the Non-profit Central Research Institute Fund of Chinese Academy of Medical Sciences (2020-PT330-003).
Conflict of Interest
The authors declare that the research was conducted in the absence of any commercial or financial relationships that could be construed as a potential conflict of interest.
Publisher’s Note
All claims expressed in this article are solely those of the authors and do not necessarily represent those of their affiliated organizations, or those of the publisher, the editors and the reviewers. Any product that may be evaluated in this article, or claim that may be made by its manufacturer, is not guaranteed or endorsed by the publisher.
Acknowledgments
We thank Xiaoqi Wu (Genergy Biotechnology Shanghai Co., Ltd) for his help in bioinformatics analysis.
Supplementary Material
The Supplementary Material for this article can be found online at: https://www.frontiersin.org/articles/10.3389/fimmu.2022.848367/full#supplementary-material
References
1. Sung H, Ferlay J, Siegel RL, Laversanne M, Soerjomataram I, Jemal A, et al. Global Cancer Statistics 2020: GLOBOCAN Estimates of Incidence and Mortality Worldwide for 36 Cancers in 185 Countries. CA: Cancer J Clin (2021) 71(3):209–49. doi: 10.3322/caac.21660
2. Zhou J, Sun H, Wang Z, Cong W, Wang J, Zeng M, et al. Guidelines for the Diagnosis and Treatment of Hepatocellular Carcinoma (2019 Edition). Liver Cancer (2020) 9(6):682–720. doi: 10.1159/000509424
3. Cabibbo G, Enea M, Attanasio M, Bruix J, Craxì A, Cammà C. A Meta-Analysis of Survival Rates of Untreated Patients in Randomized Clinical Trials of Hepatocellular Carcinoma. Hepatol (Baltimore Md) (2010) 51(4):1274–83. doi: 10.1002/hep.23485
4. Llovet JM, Montal R, Sia D, Finn RS. Molecular Therapies and Precision Medicine for Hepatocellular Carcinoma. Nat Rev Clin Oncol (2018) 15(10):599–616. doi: 10.1038/s41571-018-0073-4
5. Suárez-Calvet M, Araque Caballero M, Kleinberger G, Bateman RJ, Fagan AM, Morris JC, et al. Early Changes in CSF Strem2 in Dominantly Inherited Alzheimer's Disease Occur After Amyloid Deposition and Neuronal Injury. Sci Trans Med (2016) 8(369):369ra178. doi: 10.1126/scitranslmed.aag1767
6. Hamerman JA, Jarjoura JR, Humphrey MB, Nakamura MC, Seaman WE, Lanier LL. Cutting Edge: Inhibition of TLR and FcR Responses in Macrophages by Triggering Receptor Expressed on Myeloid Cells (TREM)-2 and DAP12. J Immunol (Baltimore Md 1950) (2006) 177(4):2051–5. doi: 10.4049/jimmunol.177.4.2051
7. Deczkowska A, Weiner A, Amit I. The Physiology, Pathology, and Potential Therapeutic Applications of the TREM2 Signaling Pathway. Cell (2020) 181(6):1207–17. doi: 10.1016/j.cell.2020.05.003
8. Ulland TK, Colonna M. TREM2 - A Key Player in Microglial Biology and Alzheimer Disease. Nat Rev Neurol (2018) 14(11):667–75. doi: 10.1038/s41582-018-0072-1
9. Wu K, Byers DE, Jin X, Agapov E, Alexander-Brett J, Patel AC, et al. TREM-2 Promotes Macrophage Survival and Lung Disease After Respiratory Viral Infection. J Exp Med (2015) 212(5):681–97. doi: 10.1084/jem.20141732
10. Perugorria MJ, Esparza-Baquer A, Oakley F, Labiano I, Korosec A, Jais A, et al. Non-Parenchymal TREM-2 Protects the Liver From Immune-Mediated Hepatocellular Damage. Gut (2019) 68(3):533–46. doi: 10.1136/gutjnl-2017-314107
11. Esparza-Baquer A, Labiano I, Sharif O, Agirre-Lizaso A, Oakley F, Rodrigues PM, et al. TREM-2 Defends the Liver Against Hepatocellular Carcinoma Through Multifactorial Protective Mechanisms. Gut (2021) 70(7):1345–61. doi: 10.1136/gutjnl-2019-319227
12. Ramachandran P, Dobie R, Wilson-Kanamori JR, Dora EF, Henderson BEP, Luu NT, et al. Resolving the Fibrotic Niche of Human Liver Cirrhosis at Single-Cell Level. Nature (2019) 575(7783):512–8. doi: 10.1038/s41586-019-1631-3
13. Remmerie A, Martens L, Thone T, Castoldi A, Seurinck R, Pavie B, et al. Osteopontin Expression Identifies a Subset of Recruited Macrophages Distinct From Kupffer Cells in the Fatty Liver. Immunity (2020) 53(3):641–57.e14. doi: 10.1016/j.immuni.2020.08.004
14. Daemen S, Gainullina A, Kalugotla G, He L, Chan MM, Beals JW, et al. Dynamic Shifts in the Composition of Resident and Recruited Macrophages Influence Tissue Remodeling in NASH. Cell Rep (2021) 34(2):108626. doi: 10.1016/j.celrep.2020.108626
15. Guilliams M, Bonnardel J, Haest B, Vanderborght B, Wagner C, Remmerie A, et al. Spatial Proteogenomics Reveals Distinct and Evolutionarily Conserved Hepatic Macrophage Niches. Cell (2022) 185(2):379–96.e38. doi: 10.1016/j.cell.2021.12.018
16. Zhang X, Wang W, Li P, Wang X, Ni K. High TREM2 Expression Correlates With Poor Prognosis in Gastric Cancer. Hum Pathol (2018) 72:91–9. doi: 10.1016/j.humpath.2017.10.026
17. Zhang H, Sheng L, Tao J, Chen R, Li Y, Sun Z, et al. Depletion of the Triggering Receptor Expressed on Myeloid Cells 2 Inhibits Progression of Renal Cell Carcinoma via Regulating Related Protein Expression and PTEN-PI3K/Akt Pathway. Int J Oncol (2016) 49(6):2498–506. doi: 10.3892/ijo.2016.3740
18. Wang XQ, Tao BB, Li B, Wang XH, Zhang WC, Wan L, et al. Overexpression of TREM2 Enhances Glioma Cell Proliferation and Invasion: A Therapeutic Target in Human Glioma. Oncotarget (2016) 7(3):2354–66. doi: 10.18632/oncotarget.6221
19. Tang W, Lv B, Yang B, Chen Y, Yuan F, Ma L, et al. TREM2 Acts as a Tumor Suppressor in Hepatocellular Carcinoma by Targeting the PI3K/Akt/β-Catenin Pathway. Oncogenesis (2019) 8(2):9. doi: 10.1038/s41389-018-0115-x
20. Sharma A, Seow JJW, Dutertre CA, Pai R, Blériot C, Mishra A, et al. Onco-Fetal Reprogramming of Endothelial Cells Drives Immunosuppressive Macrophages in Hepatocellular Carcinoma. Cell (2020) 183(2):377–94.e21. doi: 10.1016/j.cell.2020.08.040
21. Zhang Q, He Y, Luo N, Patel SJ, Han Y, Gao R, et al. Landscape and Dynamics of Single Immune Cells in Hepatocellular Carcinoma. Cell (2019) 179(4):829–45.e20. doi: 10.1016/j.cell.2019.10.003
22. Butler A, Hoffman P, Smibert P, Papalexi E, Satija R. Integrating Single-Cell Transcriptomic Data Across Different Conditions, Technologies, and Species. Nat Biotechnol (2018) 36(5):411–20. doi: 10.1038/nbt.4096
23. Trapnell C, Cacchiarelli D, Grimsby J, Pokharel P, Li S, Morse M, et al. The Dynamics and Regulators of Cell Fate Decisions Are Revealed by Pseudotemporal Ordering of Single Cells. Nat Biotechnol (2014) 32(4):381–6. doi: 10.1038/nbt.2859
24. Subramanian A, Tamayo P, Mootha VK, Mukherjee S, Ebert BL, Gillette MA, et al. Gene Set Enrichment Analysis: A Knowledge-Based Approach for Interpreting Genome-Wide Expression Profiles. Proc Natl Acad Sci USA (2005) 102(43):15545–50. doi: 10.1073/pnas.0506580102
25. Hänzelmann S, Castelo R, Guinney J. GSVA: Gene Set Variation Analysis for Microarray and RNA-Seq Data. BMC Bioinf (2013) 14:7. doi: 10.1186/1471-2105-14-7
26. Cheng S, Li Z, Gao R, Xing B, Gao Y, Yang Y, et al. A Pan-Cancer Single-Cell Transcriptional Atlas of Tumor Infiltrating Myeloid Cells. Cell (2021) 184(3):792–809.e23. doi: 10.1016/j.cell.2021.01.010
27. Azizi E, Carr AJ, Plitas G, Cornish AE, Konopacki C, Prabhakaran S, et al. Single-Cell Map of Diverse Immune Phenotypes in the Breast Tumor Microenvironment. Cell (2018) 174(5):1293–308.e36. doi: 10.1016/j.cell.2018.05.060
28. Jin S, Guerrero-Juarez CF, Zhang L, Chang I, Ramos R, Kuan CH, et al. Inference and Analysis of Cell-Cell Communication Using CellChat. Nat Commun (2021) 12(1):1088. doi: 10.1038/s41467-021-21246-9
29. Aibar S, González-Blas CB, Moerman T, Huynh-Thu VA, Imrichova H, Hulselmans G, et al. SCENIC: Single-Cell Regulatory Network Inference and Clustering. Nat Methods (2017) 14(11):1083–6. doi: 10.1038/nmeth.4463
30. Zhu Q, Wong AK, Krishnan A, Aure MR, Tadych A, Zhang R, et al. Targeted Exploration and Analysis of Large Cross-Platform Human Transcriptomic Compendia. Nat Methods (2015) 12(3):211–4. doi: 10.1038/nmeth.3249
31. Steen CB, Liu CL, Alizadeh AA, Newman AM. Profiling Cell Type Abundance and Expression in Bulk Tissues With CIBERSORTx. Methods Mol Biol (Clifton NJ) (2020) 2117:135–57. doi: 10.1007/978-1-0716-0301-7_7
32. Bindea G, Mlecnik B, Tosolini M, Kirilovsky A, Waldner M, Obenauf AC, et al. Spatiotemporal Dynamics of Intratumoral Immune Cells Reveal the Immune Landscape in Human Cancer. Immunity (2013) 39(4):782–95. doi: 10.1016/j.immuni.2013.10.003
33. Chen P, Zhao D, Li J, Liang X, Li J, Chang A, et al. Symbiotic Macrophage-Glioma Cell Interactions Reveal Synthetic Lethality in PTEN-Null Glioma. Cancer Cell (2019) 35(6):868–84.e6. doi: 10.1016/j.ccell.2019.05.003
34. Kim SS, Harford JB, Moghe M, Rait A, Pirollo KF, Chang EH. Targeted Nanocomplex Carrying siRNA Against MALAT1 Sensitizes Glioblastoma to Temozolomide. Nucleic Acids Res (2018) 46(3):1424–40. doi: 10.1093/nar/gkx1221
35. Viola A, Munari F, Sánchez-Rodríguez R, Scolaro T, Castegna A. The Metabolic Signature of Macrophage Responses. Front Immunol (2019) 10:1462. doi: 10.3389/fimmu.2019.01462
36. Efremova M, Vento-Tormo M, Teichmann SA, Vento-Tormo R. CellPhoneDB: Inferring Cell-Cell Communication From Combined Expression of Multi-Subunit Ligand-Receptor Complexes. Nat Protoc (2020) 15(4):1484–506. doi: 10.1038/s41596-020-0292-x
37. Suo S, Zhu Q, Saadatpour A, Fei L, Guo G, Yuan GC. Revealing the Critical Regulators of Cell Identity in the Mouse Cell Atlas. Cell Rep (2018) 25(6):1436–45.e3. doi: 10.1016/j.celrep.2018.10.045
38. Zhang Q, Lou Y, Yang J, Wang J, Feng J, Zhao Y, et al. Integrated Multiomic Analysis Reveals Comprehensive Tumour Heterogeneity and Novel Immunophenotypic Classification in Hepatocellular Carcinomas. Gut (2019) 68(11):2019–31. doi: 10.1136/gutjnl-2019-318912
39. Coelho I, Duarte N, Barros A, Macedo MP, Penha-Gonçalves C. Trem-2 Promotes Emergence of Restorative Macrophages and Endothelial Cells During Recovery From Hepatic Tissue Damage. Front Immunol (2020) 11:616044. doi: 10.3389/fimmu.2020.616044
40. Kleinberger G, Brendel M, Mracsko E, Wefers B, Groeneweg L, Xiang X, et al. The FTD-Like Syndrome Causing TREM2 T66M Mutation Impairs Microglia Function, Brain Perfusion, and Glucose Metabolism. EMBO J (2017) 36(13):1837–53. doi: 10.15252/embj.201796516
41. Ulland TK, Song WM, Huang SC, Ulrich JD, Sergushichev A, Beatty WL, et al. TREM2 Maintains Microglial Metabolic Fitness in Alzheimer's Disease. Cell (2017) 170(4):649–63.e13. doi: 10.1016/j.cell.2017.07.023
42. Joseph SB, Castrillo A, Laffitte BA, Mangelsdorf DJ, Tontonoz P. Reciprocal Regulation of Inflammation and Lipid Metabolism by Liver X Receptors. Nat Med (2003) 9(2):213–9. doi: 10.1038/nm820
43. Nugent AA, Lin K, van Lengerich B, Lianoglou S, Przybyla L, Davis SS, et al. TREM2 Regulates Microglial Cholesterol Metabolism Upon Chronic Phagocytic Challenge. Neuron (2020) 105(5):837–54.e9. doi: 10.1016/j.neuron.2019.12.007
44. Ménégaut L, Thomas C, Jalil A, Julla JB, Magnani C, Ceroi A, et al. Interplay Between Liver X Receptor and Hypoxia Inducible Factor 1α Potentiates Interleukin-1β Production in Human Macrophages. Cell Rep (2020) 31(7):107665. doi: 10.1016/j.celrep.2020.107665
45. Na TY, Lee HJ, Oh HJ, Huh S, Lee IK, Lee MO. Positive Cross-Talk Between Hypoxia Inducible Factor-1α and Liver X Receptor α Induces Formation of Triglyceride-Loaded Foam Cells. Arteriosc Thromb Vasc Biol (2011) 31(12):2949–56. doi: 10.1161/ATVBAHA.111.235788
46. Katzenelenbogen Y, Sheban F, Yalin A, Yofe I, Svetlichnyy D, Jaitin DA, et al. Coupled scRNA-Seq and Intracellular Protein Activity Reveal an Immunosuppressive Role of TREM2 in Cancer. Cell (2020) 182(4):872–85.e19. doi: 10.1016/j.cell.2020.06.032
47. Seidman JS, Troutman TD, Sakai M, Gola A, Spann NJ, Bennett H, et al. Niche-Specific Reprogramming of Epigenetic Landscapes Drives Myeloid Cell Diversity in Nonalcoholic Steatohepatitis. Immunity (2020) 52(6):1057–74.e7. doi: 10.1016/j.immuni.2020.04.001
Keywords: HCC, scRNA-seq, Treg, NR1H3, prognosis
Citation: Zhou L, Wang M, Guo H, Hou J, Zhang Y, Li M, Wu X, Chen X and Wang L (2022) Integrated Analysis Highlights the Immunosuppressive Role of TREM2+ Macrophages in Hepatocellular Carcinoma. Front. Immunol. 13:848367. doi: 10.3389/fimmu.2022.848367
Received: 04 January 2022; Accepted: 21 February 2022;
Published: 14 March 2022.
Edited by:
Yochai Wolf, Sheba Medical Center, IsraelReviewed by:
Charlotte Scott, Flanders Institute for Biotechnology, BelgiumPaul Collins, Ghent University, Belgium, in collaboration with reviewer CS
Alexander David Barrow, The University of Melbourne, Australia
Copyright © 2022 Zhou, Wang, Guo, Hou, Zhang, Li, Wu, Chen and Wang. This is an open-access article distributed under the terms of the Creative Commons Attribution License (CC BY). The use, distribution or reproduction in other forums is permitted, provided the original author(s) and the copyright owner(s) are credited and that the original publication in this journal is cited, in accordance with accepted academic practice. No use, distribution or reproduction is permitted which does not comply with these terms.
*Correspondence: Lianghai Wang, lh_wang@shzu.edu.cn; Xueling Chen, chenxueling@shzu.edu.cn
†These authors have contributed equally to this work