The Azores Confluence Zone
 Rui M. A. Caldeira1,2,3*
  Jesus C. Reis1
- 1Oceanic Observatory of Madeira, Agência Regional para o Desenvolvimento da Investigação Tecnologia e Inovação, Funchal, Portugal
- 2CIIMAR - Interdisciplinary Centre of Marine and Environmental Research, Porto, Portugal
- 3CIIMAR-Madeira: Centro Interdisciplinar de Investigação Marinha e Ambiental da Madeira, Funchal, Portugal
The goal of this study is to characterize the meteorological and oceanographic conditions affecting the Azores Archipelago, and explore their biological implications. The Mid-Atlantic region of the Azores Archipelago is under the permanent influence of the Azores high pressure system, thereby providing sustained Ekman transport that facilitates the convergence in regional oceanography. The west and central island groups are affected by incoming meanders and filaments originating in the Gulf Stream, whereas the east island group is most affected by westward propagating eddies pinching-off from the Azores Current. Output from the European Centre for Medium-Range Weather Forecasts are combined with altimetry data to study the dynamic oceanographic processes affecting the archipelago. Satellite-derived sea surface temperature and sea surface chlorophyll data are used as proxies to examine the biological enrichment processes. Climatological data analysis permits differentiation of the oceanographic systems that reach the west vs. those that affect the east island groups. This is the first study to document the Azores as an oceanic confluence zone and demonstrate the associated biological impacts.
Introduction
The oceanographic conditions in the Mid-Atlantic Ridge (MAR) region adjacent to the Azores Archipelago has been the subject of many scientific studies (e.g., Gould, 1985; Mailly et al., 1997; Alves and Verdière, 1999; Pingree et al., 1999; Alves et al., 2002; Juliano and Alves, 2007; Søliland et al., 2008; Barbosa et al., 2011; Lázaro et al., 2013). Fewer studies however, center on the oceanographic processes affecting the Azores Islands per se. Lafon et al. (2004) focused on the optimal processing of Sea Surface Temperature (SST) data derived from the National Oceanic and Atmospheric Administration's (NOAA) Advanced Very High Resolution Radiometer (AVHRR) for highly contaminated cloud regions such as the Mid-Atlantic, where the Azores islands are located (36°–39° N; 25°–31°W). Applying the methodology of Lafon et al. (2004), Bashmachnikov et al. (2004) used limited SST fields (2001–2002) to show that the Azores Current influences SST south of the archipelago. A significant isotherm tilt representing a sub-tropical frontal region was mentioned, but not subjected to further analysis.
Most recently, Silva et al. (2013) studied the seasonal differences of the nearshore phytoplankton communities and their probable relationship with a “southward intrusion of cold water,” and with a “northward incursion of sub-tropical warm water.” Nonetheless, there were no attempts to relate these different observations to the regional ocean circulation patterns.
To the best of our knowledge, Sala et al. (2015) was the most recent work attempting to link the island-induced biological productivity (particles/larvae) to the regional oceanographic phenomena of the NE Atlantic. An ocean circulation model, partially validated with ARGO data, was used to study the transport of particles in the upper 500 m of the water column. The study focused on the ability of the archipelago to capture the particles and organisms transported by the incoming currents and eddies. The regional oceanographic patterns were characterized using historical analysis of altimetry (Eddy Kinetic Energy—EKE) and Lagrangian Coherent Structures (LCSs). Results suggested that the west group of islands was mostly affected by north and eastward flow i.e., Gulf Stream; whereas the east group was strongly affected by a westward propagating flow. The latter is hypothesized to be the westward propagating eddies pinching-off from the Azores Current (previously reported by Pingree et al., 1999; Sangrá et al., 2009; Barbosa et al., 2011).
Building on the findings of Sala et al. (2015), our study dissects the predominant meteorological and oceanographic conditions affecting the Azores Archipelago. The island chain, in this perspective, is located in between two confluent systems that render the region rich in turbulent ocean features such as filaments and eddies. Thus, the islands act as natural “sieves” to these (far-field) incoming features, which can also contribute to the enhancement of local productivity. The methodology used in the study is presented in section Methods and Data Analysis; in section Results and Discussion the results are discussed; while the main conclusions and future work are detailed in section Conclusions.
Methods and Data Analysis
Volume Transport Calculation
Climate reanalysis data (ERA-Interim) from the European Center for Medium-Range Weather Forecasts (ECMWF), was used to characterize the seasonal wind conditions affecting the Azores Archipelago (Dee et al., 2011). A 10-year dataset (January-2004–December-2014) with a horizontal resolution of about 14 km (0.125°) was considered. The sea level pressure and the “u” and “v” wind components were extracted from the daily means before calculating the seasonal averages. Mean surface wind stress (τwind) was calculated as:
where, ρair is the density of the air (1.2 kg m−3), CD is a dimensionless quantity representing the wind-drag coefficient (0.0013) and Uh is the wind speed at 10 m above the sea surface (Gill, 1982). Considering the wind stress, one can compute the horizontal components of the total mass transport integrated over the oceanic Ekman Layer. The Ekman transport (Mek) was calculated according to Smith (1968) and Bakun (1973):
where τwind is the wind stress, ẑ is a unitary vector and f is the Coriolis parameter; ρsw represents the reference seawater density (1024 kg m-3).
A useful dynamical quantity is the vertical motion associated with the curl of the wind (Ekman pumping velocity):
where ∇ × τwind is the curl of the wind stress vector (Smith, 1968).
Under Sverdrup (1947) dynamics (ignoring islands), the predicted meridional transport is:
whereas the zonal transport is found from the continuity equation. Integrating the meridional divergence from the eastern boundary (EB) westward we can estimate Mx:
Thus, the Sverdrup transport was calculated with similar formulae used by Kessler and Gourdeau (2006); where β = ∂f/∂y; and the volume transport is in units of Sverdrup (1 Sv = 106 m3 s−1). Positive / negative sign means northward / southward or eastward / westward transports, respectively. Considering that the Sverdrup Transport represents the total transport in the wind-influenced layer, including both Ekman (Mek) and Geostrophic transports (MG), one can roughly estimate MG, by subtracting Mek from the Sverdrup transport.
Sea Surface Currents
Sea surface currents were characterized using NOAA's Ocean Surface Current Analysis—Real Time product (OSCAR). OSCAR combines geostrophic and Ekman transport components derived from the combination of altimetry and scatterometer wind data (Lagerloef et al., 1999) and is partially validated by global drifters and moored buoys. A 5-day mean product for a 10-year period (2004–2014) with a horizontal resolution of about 37 km, was used to compile the mean and seasonal surface currents. Figure 1 shows the overall mean sea surface circulation patterns for the region.
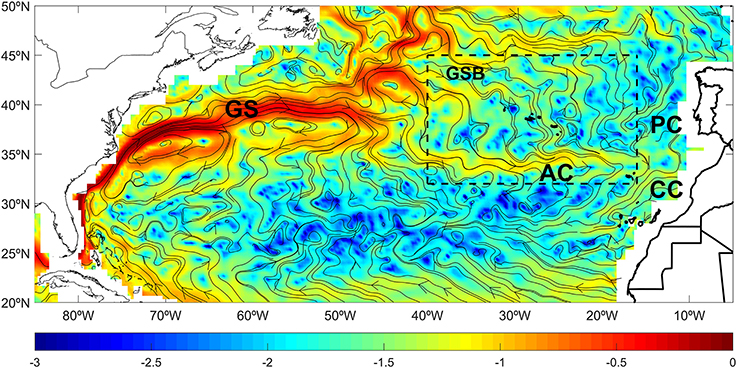
Figure 1. Large-scale circulation of the North-Atlantic depicted by OSCAR-derived mean (2004–2014) sea surface currents are represented as isolines over log10 of the current velocity in order to improve the representation of the extremes. The known ocean circulation currents are marked: GS, Gulf Stream; GSB, Gulf Stream Bifurcations; AC, Azores Current; PC, Portugal Current; CC, Canary Current; the dashed-line box is centered around the Azores and depicts the region where most of the historical analysis were carried out.
Mesoscale Eddies Reaching the Azores
Most recently, Chelton and Schlax (http://wombat.coas.oregonstate.edu/eddies/) used a nonlinear methodology (Williams et al., 2011) to produce an updated eddy tracking dataset from the newly released AVISO, Mean Sea Level Anomaly fields (DT-2014 MSLA). The altimetry data reprocessing included new sensor-specific instrumental and atmospheric corrections, new inter-calibration of the various altimeters, a new tide model and a longer reference period of 20 years for mean sea level (Pujol et al., 2016).
A total of 459 mesoscale eddies were detected in the Azores sub-region (dashed box surrounding the archipelago of Figure 4) between 1992 and 2012 (20-years). On the new DT-2014 SSH fields, the trajectories are available at 1-day time steps and interpolated directly to a ¼° grid. Thus, all 1-day eddies (or older) were considered, and eddies had larger amplitudes, smaller radii and higher rotational speeds when compared to the previous analysis. They were also more nonlinear and had a higher eddy kinetic energy than those detected in previous datasets (Chelton et al., 2011). Statistically, the eddies in the new dataset have longer lifetimes and propagate over greater distances. These differences from the eddy characteristics in the previous datasets are mostly attributable to the changes in the new AVISO processing schemes used to produce the DT-2014 MSLA dataset (http://wombat.coas.oregonstate.edu/eddies/).
Sea Surface Temperature and Chlorophyll Enrichment
Sea surface temperature data was extracted from a merged satellite data product, the “Multi-scale Ultrahigh Resolution SST” (MUR SST). With a daily temporal frequency, and an original horizontal resolution of 1 km. MUR fills the gaps left by high cloud density using a “Battle-Lemarie” wavelet technique without statistical synthesis of the wavelet coefficients. That is, all coefficients are derived from the SST data in order to avoid data contamination with the interpolation (Chin et al., 1998).
Chlorophyll-a concentration is from weekly Moderate Resolution Imaging Spectroradiometer (MODIS) data installed onboard the Aqua satellite and processed by the “CoastWatch processing scheme” using the SeaWiFS Data Analysis System (SeaDAS) software (Fu et al., 1998). An atmospheric correction was applied to the data to yield a measurement of water leaving radiance (Shettle and Fenn, 1979; Gordon and Wang, 1994). These radiances are processed to obtain chlorophyll-a concentration using the NASA OC3M algorithm (described in O'Reilly et al., 2000). This algorithm is analogous to the OC4v4 algorithm used in the processing of SeaWiFS data, but is adjusted for the specific bands available on the MODIS sensor. Validation of the processing schemes is accomplished by comparison with in situ ocean color measurements gathered by buoys as part of the Marine Optical Characterization Experiment (MOCE). The data are mapped to an equal angle grid with a resolution of about 6 km (0.05 × 0.05° longitude) using simple arithmetic means to produce composite images of various durations (8-day in this particular case).
Water Masses and Nutrient Profiles
Taking profiles of temperature and salinity data from the World Ocean Atlas (WOA) 2013 (Locarnini et al., 2013; Zweng et al., 2013), and accounting for the weak seasonal variability of the ocean's interior, the annual water mass distribution for each island group was represented on a Theta-S diagram.
Nutrient profiles for the Azores were extracted from the WOCE Global Climatology (Gouretski and Koltermann, 2004). The WOCE Global Hydrographic Climatology has been derived using World Ocean Atlas data 1998. Data quality checks, cruise bias corrections, averaging on isopycnal surfaces, and optimal interpolation on 45 standard levels was used to determine the climatologies and error estimates of salinity and temperature and a suite of nutrients (Gouretski and Koltermann, 2004).
Results and Discussion
Figure 1A summarizes the mean sea surface ocean circulation system of the NE Atlantic composed of: (i) the Gulf Stream (GS) and Gulf Stream bifurcations (GSB). As the Gulf Stream moves northward, it veers to the right due to the Coriolis effect. As it weakens, it meanders and bifurcates and several of these bifurcations reach the Azores from the northwest, north and northeast; (ii) the Azores current (AC), south of the archipelago, moves eastward but is populated with eddies—most of which propagate westward (WE). For completeness, the Portugal (PC) and Canary Currents (CC) are also represented in Figure 1.
The sea-surface currents represented herein are consistent with the sub-tropical Gyre circulation of the North Atlantic discussed in depth in Dohan and Maximenko (2010). The basin-scale Gyre circulation comprises an intense western boundary current (Gulf Stream) with a set of narrower and weaker re-circulation cells (bifurcations) populated by eddies, filaments and other turbulent features (see also Bryden et al., 2014; Elken, 2016). The Azores is affected by these filaments and eddies that converge at the archipelago. Whereas, the global wind patterns drive the basin-scale circulation, the local winds are expected to force local Ekman currents, surface waves, and turbulent features (Elken, 2016).
A schematic representation of the local sea surface circulation is shown in Figure 2. Westward propagating eddies from the Azores Current converge at the Azores and meet eddies and filaments from the Gulf Stream. As is apparent from Figures 2, 3, the archipelago is bounded northward by incoming eddies and meanders originating in the Gulf Stream and southward by the westward propagating eddies pinching-off from the Azores Current. Simultaneously, the leeward side of the islands has weaker currents. The analysis also suggests a convergence of several incoming systems windward of the archipelago, particularly north of the Central group. In agreement with Sala et al. (2015), altimetry data analysis of the mean eddy kinetic energy bracketed the archipelago with two regions of intense EKE activity: the Gulf Stream (GS), northward; and the Azores Current (AC), southward (Figure 2).
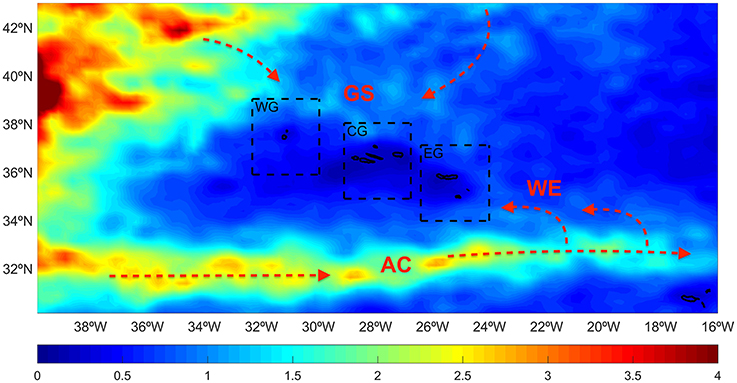
Figure 2. Overall mean (2004–2014) of Eddy Kinetic Energy (EKE) emphasizing the main regional oceanographic processes: AC, Azores Current; WE, Westward propagating Eddies; GS, Gulf Stream. EKE in cm2 s−2.
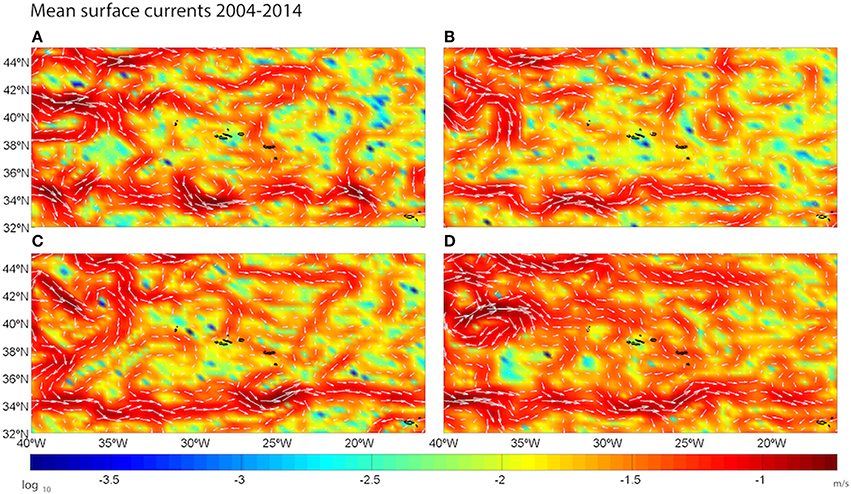
Figure 3. Seasonal mean surface currents for the Azores sub-region (2004–2014) extracted from OSCAR data for (A) spring; (B) summer; (C) autumn; (D) winter. Color scale represent log10 of current speed and white-arrows the current vectors.
Regarding the eddy distribution, the analysis of the Chelton and Schlax North Atlantic dataset revealed the pathway of 459 eddies, of which 140 came to the Azores from afar (“far-field”) and 319 were generated inside the Azores confluence zone (“near-field”). The far-field eddies were the largest (~80 km radius) and longer-lived (~51 days); whereas younger near-field eddies, lived between 2 and 10 days and reached slightly smaller (mean) sizes (70 km radius). From the total number of eddies 46% were cyclonic whereas 54% were anticyclonic. As expected, most eddies (403) propagated westward. In general, westward propagating eddies lived longer and reached larger sizes when compared to their eastward propagating counterparts.
From the 140 eddies that reached the archipelago from abroad: 32 entered from the north and 31 from the northeast; 14 entered from the south, 6 from the southeast and 1 from the southwest; 50 eddies entered at the eastern boundary; and only 6 entered at the western boundary; thus we hypothesize that most of the incoming eddies reaching the Azores followed either the Gulf Stream southward path (entering through the north / west quadrants, see Figure 1) or via the Azores Current propagating flow (entering the east / south quadrants). About 70% of the eddies entering the confluence zone lose their identity either through dissipation, by merging with other eddies or simply breaking down into smaller eddies. In fact, confluence zones are typical merging spots for meanders, eddies and filaments. At any given time, there could be tens of mesoscale eddies interacting with each other as well as with other sub-mesoscale eddies. Much research is going into the study of these high energy turbulent mixing zones, but it is still early to fully understand the “transforming nature” of these mesoscale processes (see e.g., Tikinaga et al., 2005).
Table 1 summarizes the physical characteristics of the far-field eddies that reached the archipelago. Although the eddy characteristics compare well with those calculated by Barbosa et al. (2011), the Chelton and Schlax dataset has higher spatial (1/4°) and temporal resolution (daily) when compared with the 1 × 1° results that are calculated every 4-days by Barbosa et al. (2011). This resulted in the visual detection of 152 “loopers” (eddies), using Lagrangian drifters for a period of 18 years in a much broader region (Barbosa et al., 2011), compared with 459 eddies that reach the Azores detected using the newly processed altimetry data (Chelton and Schlax). Nevertheless, the Barbosa et al. (2011) Lagrangian analysis (1990–2008) can be considered as a representative sub-sample of the altimetry data (1992–2012) since it overlaps in time (16 years) and in space.
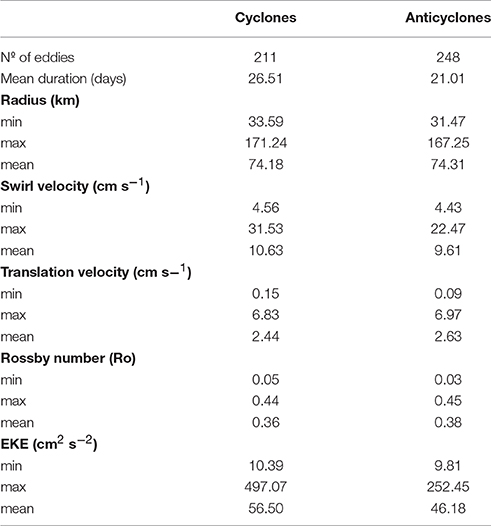
Table 1. Physical characteristics of the far-field eddies that reached the Azores Archipelago between 1992 and 2012 (dashed box in Figure 4).
From the 459 eddies that reached the Azores, 211 were cyclones (C) and 248 were anticyclones (AC). Their mean duration was approximately the same (C 26.51; AC 21.01 days). Their radius and, therefore, their diameter was also very similar and of the same order of magnitude of that calculated by Barbosa et al. (2011). Contrary to Barbosa et al. (2011), however, Cyclonic eddies rotated and also propagated faster than anticyclones. As in Barbosa et al. (2011), the local “vortex Rossby number” (Ro) was calculated as a function of ζ/f redefined by Lazar et al. (2013) as Ro = Vmax/frmax; where ζ is the vortex core vorticity; f is the Coriolis parameter; Vmax is the maximum “swirl velocity” of the eddy; and rmax is the radius corresponding to the maximum velocity. Rossby numbers were slightly higher but of the same order of magnitude as of those previously reported, indicating a strong influence of planetary rotation (Barbosa et al., 2011). However, using the altimetry dataset the maximum EKE was much higher for cyclones (497 cm−1 s−2), than it was for anticyclones (252.45 cm−1 s−2). By contrast, in Barbosa et al. (2011) they had indistinguishable EKE values.
Figure 4 shows the trajectories of the eddies that reach the Azores coming from afar. The main patterns are similar to the representation of all eddies, however this filter substantially reduced the “chaotic” trajectories of the locally born ones. The far-field eddy trajectories remained unchanged with the filtering. As expected, two main pathways have emerged: (i) eddies that reach the Archipelago from the north and north-west (Gulf Stream pathways); and (ii) eddies that reach the islands from the east. Only one eddy (considering the full dataset) entered the Azores sub-region from the west. South-entering eddies are expected to have the same dynamical origin as the ones entering at the eastern boundary i.e., westward-propagating eddies pinching off from the Azores Current.
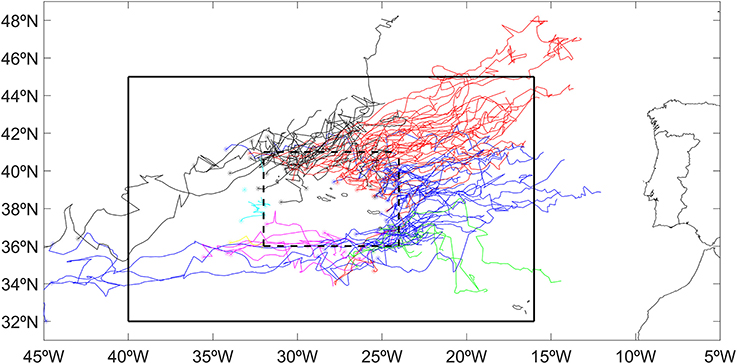
Figure 4. Eddy trajectories from Chelton and Schlax 20-year dataset (1992–2012; http://wombat.coas.oregonstate.edu/eddies/). All far-field eddies (140) that reached the Azores Archipelago (box with dashed line) were considered. Asterisks (*) represent the final position of the eddies. Locally generated eddies were filtered out.
We hypothesize that local wind-induced transport is responsible for the confluence of these regional mesoscale processes in the Azores region. The characteristic of the confluence in the Azores is not so much the merging of intense surface currents, such as in the Brazil-Falklands region, but rather the confluence of eddies, meanders and filaments originating from different ocean regions, with different dynamical qualities.
The predominant meteorological patterns are depicted in Figure 5, highlighting the dominance of the Azores high pressure system. The strongest pressure gradients occur during summer (Figure 5B) and winter (Figure 5D). Due to its positioning over the archipelago, the west group of islands are often under the influence of eastward winds, whereas at the east group (34° N; 20°W) the wind veers northward. These wind patterns result in different Ekman transport regimes affecting west and east island groups. These Ekman transport patterns can also contribute to the tendency of Gulf Stream bifurcation filaments and eddies to veer south and/or east toward the Azores, whereas the westward-propagating eddies pinching off the Azores Current are advected westward throughout the year. The analysis also shows that on the leeward (southwest) side of the archipelago, the wind, and therefore the Ekman transport, is very weak i.e., wind wake. This is also a region with weak EKE and very few eddies detected. In general, the southward Ekman transport is stronger during the winter months (DJF; Figure 5D), whereas the northward Ekman transport is stronger during the summer (JJA, Figure 5B), in alignment with the wind stress gradient.
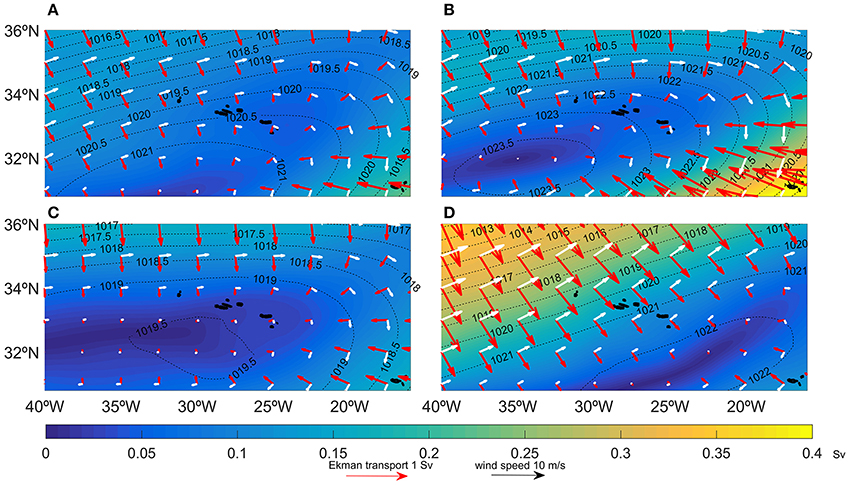
Figure 5. Representation of the mean seasonal variability of the sea surface pressure (mb) (2004–2014); (A) spring (MAM: March; April; May); (B) summer (JJA: June; July and August); (C) autumn (SON: September; October; November); (D) winter (DJF: December; January and February). Wind vectors are represented as white arrows; calculated Ekman transport is represented as red arrows (1 Sv = 106 m3 s−1). The color legend shows wind stress (N m−2); reference vectors are also shown.
Although it is hard to measure in situ the influence of wind stress gradient in influencing and steering fields of eddies, numerical models have documented the role of wind stress in generating surface-intensified eddies in other regions. Calil et al. (2008) has shown that sufficient wind forcing is important in reproducing the observed mesoscale vortices in the lee of the Hawaiian Archipelago. Subsequently, Yoshida et al. (2010) noted that the eddies observed in the southwest section of Hawaii were generated by the local wind stress curl associated with the blocking of the trade winds by the island. Kersalé et al. (2011) emphasized the need to consider the use of high resolution wind products, i.e., QuikSCAT, in conjunction with accurate representation of the regional currents and topography in an ocean circulation model of the Hawaiian Archipelago. Couvelard et al. (2012) studied the generation and confinement of mesoscale eddies in the lee of Madeira Island. Sea surface EKE also responds to wind forcing. Most recently, Hogg et al. (2015) showed a decadal increase in EKE most likely due to the continuing increase in wind stress over the Southern Ocean. Moreover, the authors showed that the Antarctic Circumpolar Current transport correlates well with wind stress on interannual timescales.
The Ekman vertical velocity calculation is shown in Figure 6. Here the negative values represent downward velocities (“Ekman pumping”) and positive values represent surface divergence i.e., “Ekman suction.” Ekman pumping is strongest during spring (−0.08 Sv) and weaker during winter months (north of the archipelago). By contrast, Ekman suction is strongest (0.1 Sv) during winter and weaker during spring.
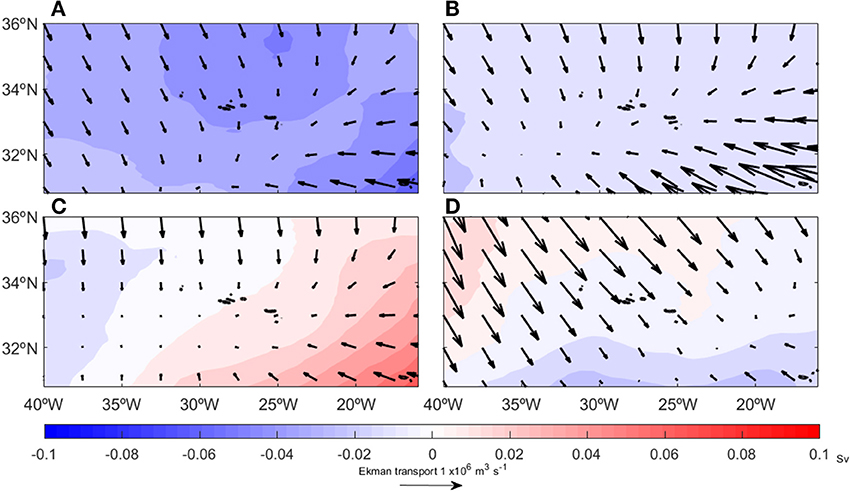
Figure 6. Calculated seasonal mean Ekman transport divergence (2004–2014); (A) spring; (B) summer; (C) autumn; (D) winter. Ekman transport arrows are represented as black arrows. Reference vector included.
Figure 7 shows the result of the Sverdrup transport calculation for the Azores sub-region, overlaid onto the instances when eddies reached the archipelago (red vertical lines, as identified in Chelton and Schlax dataset). Meridional (My; Figure 7A) and zonal (Mx; Figure 7B) transport components are shown separately. The meridional transport, which is integrated over the whole of the northern boundary (~1200 km wide), shows a dominant geostrophic transport mostly toward the north (positive) and a southward Ekman transport (negative). Zonally, the westward (negative) transport is almost exclusively Ekman induced. The geostrophic-induced transport is stronger in the zonal direction (Mx) than it is in the meridional (My). This suggests that incoming eddies and filaments that enter the archipelago sub-region from the north and/or from the west are likely to be advected by wind-induced transport (i.e., Ekman). Thus, we hypothesize that the Azores High Pressure system plays a major role in the formation of the oceanic convergence zone centered on the archipelago.
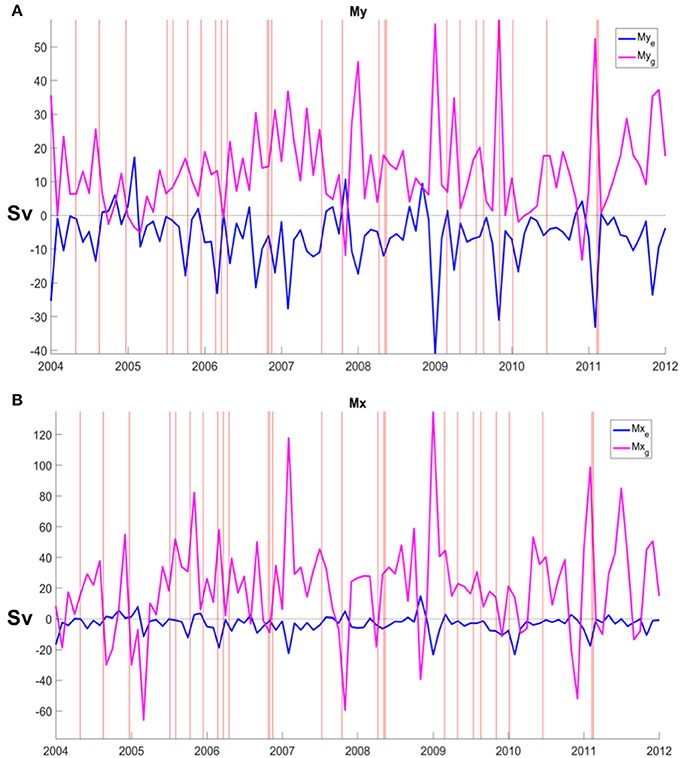
Figure 7. Sverdrup volume transport components: (A) Meridional Transport (My); (B) Zonal Transport (Mx); Ekman (Me) and Geostrophic (Mg) transports are represented separately for (A,B). Vertical lines represent the instances of occurrence of incoming far-field eddies between 2004 and 2012.
Recently, the self-induced Ekman pumping mechanisms in the interior of mesoscale ocean eddies were investigated (Gaube et al., 2015; Byrne et al., 2016). On average, eddy-induced Ekman pumping velocities approach 10 cm per day (Gaube et al., 2015). SST-induced Ekman pumping is often presented as secondary to the current-induced mechanisms. But in mid-latitudinal regions strongly affected by western boundary currents and with strong SST gradients (as is the case in the Azores), all mechanisms for eddy-induced Ekman pumping are of comparable magnitude (Gaube et al., 2015). Because the polarity of current-induced curl of the surface stress opposes that of the eddy, the associated Ekman pumping often attenuates the eddies (Gaube et al., 2015). Nevertheless, Byrne et al. (2016) proposed a thermodynamic pathway of energy compensation for this loss. Local variations in atmospheric temperatures might in turn generate local wind stress gradients that contribute to injecting kinetic energy back into these mesoscale eddies, acting as a net enhancement of the mesoscale field (Byrne et al., 2016). Future studies of the Azores region should not only consider the geostrophic circulation patterns but also the wind-induced transports as well as the eddy response to the local atmospheric phenomena (see also Small et al., 2008).
Analysis of the spatial distribution of SST anomalies (not shown) indicates that the region is warmer than the seasonal mean temperature (2–3°C) during summer and autumn; and colder during spring and winter (3–4°C). As previously documented by Bashmachnikov et al. (2004), the archipelago is also located in a frontal region affected by sub-tropical (warmer) waters (22–24°C) during summer and autumn, and temperate colder waters (17–18°C) during spring and winter. In fact, the tilting of the isotherm associated with this front might be a response to the eddy-induced circulation that affects the region. The same temperature ranges were also measured by Lafon et al. (2004). Analyzing the mean temperatures of each group of islands (boxes marked in Figure 2), each containing the same area, it is noticeable that the colder waters affect the EG (east group) during winter and spring (Figure 8A). During summer months the west group (WG) of islands have the warmest waters.
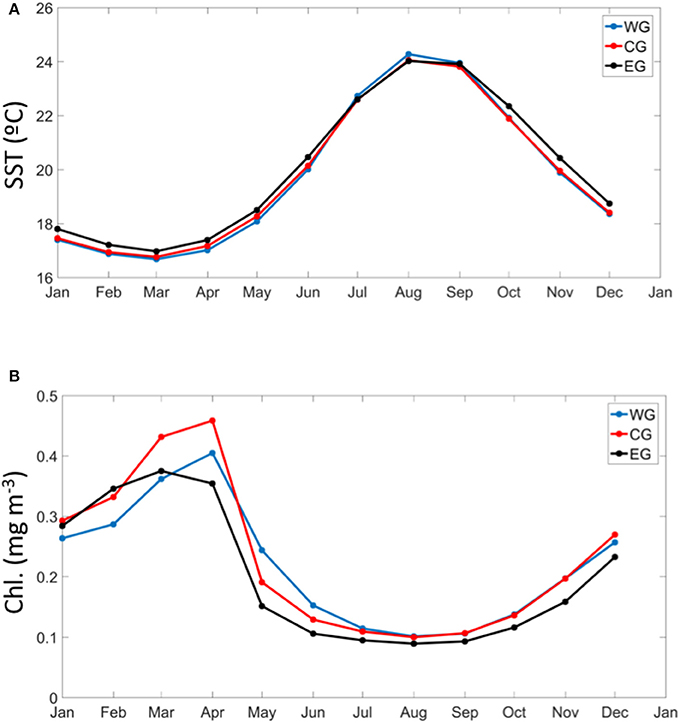
Figure 8. Time-series of the (A) SST and (B) Sea Surface Chlorophyll for each island group: WG, West Group; CG, Central Group; EG, East Group.
Volkov and Fu (2011) considered 20-years of satellite altimetry and reanalysis data (winds) to demonstrate that the primary contribution to the frontogenesis at the Azores Current is provided by the meridional Ekman-induced current convergence that always acts to tilt the near-surface isopycnals—thereby enhancing the front. In fact, this result also agrees with previous studies of subtropical frontal zones in the North Pacific (Kazmin and Rienecker, 1996; Qiu and Chen, 2010). Volkov and Fu (2011) have also discussed the possibility of the associated high EKE of the AC to be modulated by Ekman convergence. According to that study, the effects of the surface Ekman convergence at the front can be translated deeper, beyond the mixed layer, and influence the EKE generation. Adding to this discussion, our results suggest that it might be the westward propagating eddies, which in turn are highly affected by Ekman-induced transport (indirect effect), that promote the tilting of the Azores Front.
The mean chlorophyll concentration is highest during the spring months in the Central Group (CG) (Figure 8B). The least productive group during the spring bloom is the East Group (EG), suggesting that local nutrient / biological enrichment is highly dependent on the interactions of the islands with the incoming oceanographic features—i.e., meanders and filaments from the Gulf Stream. The East Group (EG) is also the least productive during winter. In order to better understand the spatial origin of the nutrient enrichment, and associated increase in phytoplankton growth around the Azores, the spatial means of chlorophyll concentration were calculated. Figure 9 shows the seasonal maps of chlorophyll concentration derived from satellite data. The spring enrichment has its origins in the Gulf Stream (up north), however during winter the chlorophyll-rich surface waters reach the archipelago from the east. The mean eastern sea surface chlorophyll is approximately half (~0.3 mg m−3) the mean chlorophyll concentration during the spring bloom (~0.6 mg m−3). The Central island group shows the highest concentration of sea surface chlorophyll; thus we suggest the CG to be the center of the proposed confluence zone. These confluence zones are often presented as major atmospheric carbon sinks due to the amount of primary production that takes place there.
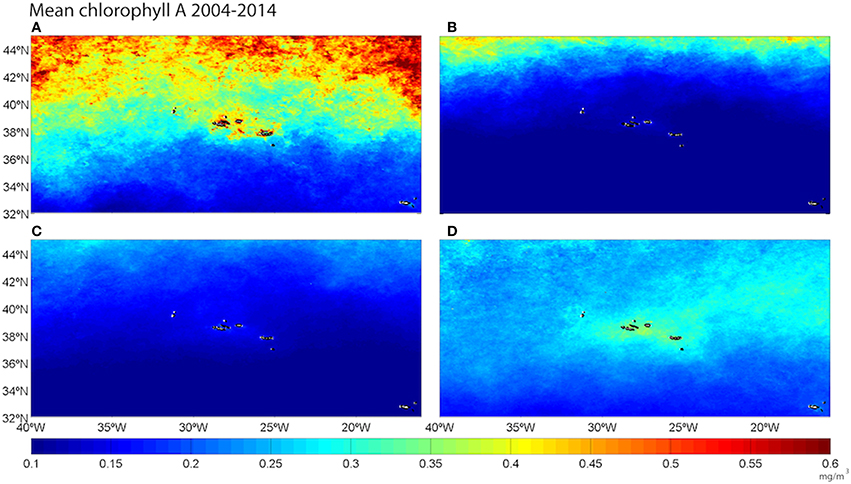
Figure 9. Spatial distribution of the mean seasonal (2004–2014) sea chlorophyll concentration; (A) spring; (B) summer; (C) autumn; (D) winter.
As expected, satellite-derived sea surface chlorophyll of the Azores follows an inverse pattern to that of SST; nutrient rich waters are often colder when they reach the surface compared with their surroundings. Therefore, the seasonal peaks of chlorophyll are coincident with the seasonal lows of SST, and the seasonal maximums of SST coincide with the seasonal lows of sea surface chlorophyll concentration. Typical of open-ocean oligotrophic (sub-tropical) regions (such as the Azores) where light is not a limiting factor, most nutrients are expected to surface via a dynamic process, such as an oceanic filament or an eddy, which acts to raise the nutricline to the euphotic zone.
There are quite a few examples of Gulf Stream vs. westward-propagating eddy enrichment scenarios. Figure 10 shows maps of sea surface chlorophyll concentration for April 2009 and April 2010 (Figures 10B,C) as two cases where the enrichment reached the Azores from the northwest; whereas during March 2006 and April 2011 the enrichment reached the archipelago from the east. In contrast with the seasonal means, monthly sea surface chlorophyll means in the region can surpass 1 mg m−3. Thus, we predict that in daily cloud free images, the local productivity will reach higher values.
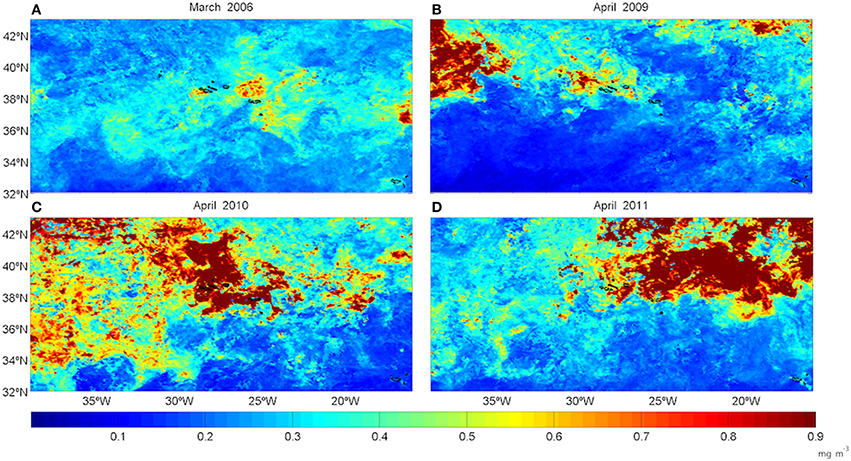
Figure 10. Maps of sea surface chlorophyll concentration representing examples of westward and eastward penetration of productivity for monthly means: (A) March 2006; (B) April 2009; (C) April 2010; (D) April 2011.
The “island mass effect” (Doty and Oguri, 1956) or “island stirring” (Mann and Lazier, 1991) is the topographic disturbance of oceanic flow by an island, and its linked nutrient and biological impacts. This is certainly the case for other Macaronesian islands such as Madeira (e.g., Caldeira et al., 2002) and the Canaries (Hernandez-Leon, 1991; Aristegui et al., 1997). The island mass effect is often generated when the island has space to interact with the incoming flow and thereby generate its own wake and thus creating its own eddies. In an archipelago setting where individual islands are close to each other and separated by deep-water channels, the “individual island effect” (wake) is strongly constricted (Caldeira and Sangra, 2012), thus enhancing the multiple-island (archipelago) phenomena.
The current study supports the hypothesis that the group of islands (not individual islands), is responsible for the interaction with the incoming flow—thereby in the aggregate inducing the observed nutrient and/or biological enrichment. This ability of a group of seamounts (or islands) to retain properties of the incoming flow was coined by Wolanski (1994) as the “sticky water effect.” This effect explains an increase in the retention capacity (i.e., anisotropic turbulence) of the recirculation of currents around and away from regions of high reef density (i.e., closely aggregated reefs or seamounts). At the archipelago scale, recent studies suggest mathematical interpretations for this increased retention by “chaotic advection” processes (Rypina et al., 2010).
Persistent and dynamical localized oceanographic phenomena can lead to the creation and/or modification of the water masses composition, therefore it is important to examine the water masses that comprise the region. As can be seen in Figure 11, the east group, being most exposed to westward-propagating flow, has a strong signal of high salinity waters—a.k.a. Mediterranean Intermediate Waters (MIW: T: 6–11.9°C; S: 35.3–36.5 PSU). However, the MIW was diluted in the central group and not present at all in climatological profiles extracted near the west group. The North Atlantic Deep Water (NADW: T: 3–4°C; S: 34.9–35.0 PSU) and the North Atlantic Central Surface Waters (NACSW: T: 4–20°C; S: 35–36.8 PSU) were present in all island groups. This east-west difference in water mass distribution, developing over a 1000 km ocean region, is also consistent with the Azores being a confluence /convergence zone between the incoming Gulf Stream tropical waters and the westward-propagating eddies from the Azores Current, which transport MIW within.
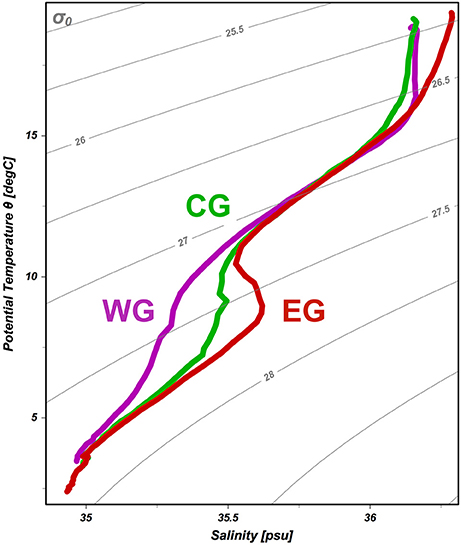
Figure 11. Theta-Salinity diagram representing the main water masses present in each island group: WG, West Group; CG, Central Group; EG, East Group. Density (kg m−3), sigma-t lines are also shown in the diagram for reference.
Phosphate profiles extracted from climatology near the west and east groups also reveal some significant differences (Figure 12). In the Gulf Stream waters that often reach the West Group (WG), there is a two-layer, two-cline configuration: one nutricline below the surface (0–200 m) followed by a nutristad (200–350 m), and a second nutricline formed between 300 and 1000 m. This structure implies the presence of Subtropical Mode Water reaching the west group. In the profiles extracted in the vicinity of the East Group (EG) there is no two-layer configuration—i.e., no nutristad present in the profile. The maximum value of phosphate concentration is located at a slightly shallower depth (800 m). This E-W asymmetry can also help explain the differences in phytoplankton organisms observed by Silva et al. (2013), as well as suggest the incursion of sub-tropical warm waters (via filaments and/or eddies) from the Gulf Stream into the archipelago.
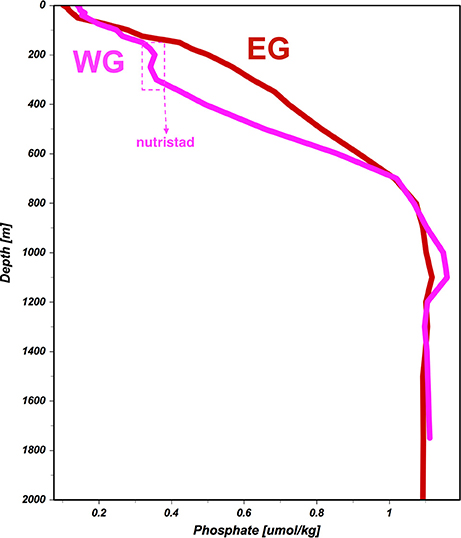
Figure 12. Climatological profiles (0–2000 m) of phosphate concentration for the WG, West Group, and EG, East Group.
Subtropical Mode Water (STMW), is formed by convection each winter in an east-west band at the northern edge of the subtropical gyre, just south of the Gulf Stream (McCartney, 1982; Talley and Raymer, 1982). As pointed out by Palter et al. (2005), the presence of STMW inserts a sub-surface layer of nutrient-depleted water (nutristad) as observed in the west group profiles. As stated by Palter et al. (2005), in regions and years with a strong STMW signature, low-nitrate waters reside beneath the euphotic zone. During times when the characteristic STMW thermostad is lacking, the nutricline is no longer depressed and there exists a steep and nearly linear gradient between the base of the euphotic zone and the remineralized nutrients at depth.
Conclusions
Although the MAR has been the focus of many scientific studies, few concentrated their analysis and synthesis on the characterization of the oceanographic processes that affect the Azores Archipelago. To the best of our knowledge, this is one of the few discussions, together with Sala et al. (2015), on the dynamical oceanographic features that specifically affect the Azores Archipelago. The most striking results from this study were that: (i) the west group of islands are affected mostly by the Gulf Stream (bifurcation) filaments, meanders and eddies; whereas (ii) the east group is affected by westward-propagating eddies, most likely the ones pinching off from the Azores current. This also helps explain the different phytoplankton communities observed in the northern vs. southern islands as reported by Silva et al. (2013); (iii) regional Ekman transport seems to be responsible for the confluence of these mesoscale phenomena in the Azores Archipelago; (iv) the differing physical nature of the dominant oceanographic processes that affect the west and the east groups are imprinted in their water mass composition as well as in their nutrient (climatological) profiles. At the surface, a tilted frontal region denotes the asymmetry between the dominant processes that affect both ends—i.e., west and east island groups; (v) the biological enrichment is very seasonal and very dependent on the shallowing of the nutricline; it often reaches the islands from the north from the Gulf Stream, or from the east (Azores Current); far-field enrichment strongly surpasses the intensity of the observed local enrichment. Moreover, the intensity of northern domain enrichment seems to surpass that of the east, in agreement with the higher intensity of the north-west incoming features. The Central Group of islands has the largest oceanic imprint (in size and number of islands). Thus, it has higher capacity to stir the incoming flow, inducing a shallowing of the nutricline and/or “capturing” the biologically enriched incoming system of eddies and fronts.
Due to the convergence of oceanographic processes that manifest in the Azores Archipelago in combination with the highly energetic eddy field, we propose its designation as a confluence zone between the west and the east North Atlantic. Much remains to be studied and resolved. For instance, how can we unambiguously distinguish the dynamic characteristics of Gulf Stream eddies from westward-propagating eddies? Does the erosion of the MIW occur in the confluence region due to intense (local) vertical mixing induced by the mesoscale eddies that reach (and/or live) in the Azores Archipelago? Or do westward-propagating features carrying the MIW simply not reach the west group of islands?
The Azores Archipelagic region is of great interest to the scientific community because it plays an important role in the ocean circulation and biological enrichment of the Mid- and North Atlantic Regions. Yet the characterization and impacts of its oceanographic patterns has been under-studied. Hopefully future efforts will help clarify some of the hypotheses proposed herein.
Author Contributions
Both authors contributed to the data analysis and RC assembled most of the writing. Both authors are aware of its full content and agree to submit it in its present form for scientific review.
Conflict of Interest Statement
The authors declare that the research was conducted in the absence of any commercial or financial relationships that could be construed as a potential conflict of interest.
Acknowledgments
Special thanks to Dudley Chelton and Michael Schlax for making the eddy tracking data freely available. The altimeter products were produced by SSALTO/DUACS and distributed by AVISO with support from CNES (http://www.aviso.oceanobs.com/duacs/). The chlorophyll satellite data was provided by NOAA “CoastWatch” Program and NASA's Goddard Space Flight Center, “OceanColor Web.” This study was partially supported by the Oceanic Observatory of Madeira (M1420-01-0145-FEDER-000001- Observatório Oceânico da Madeira-OOM). Comments from reviewers contributed to substantially improve the previous versions of the manuscript. Julie Pullen made important editorial comments, improving the (close to) final version of the manuscript.
References
Alves, M., Gaillard, F., Sparrow, M., Knoll, M., and Giraud, S. (2002). Circulation patterns and transport of the Azores Front-Current system. Deep Sea Res. I 49, 3983–4002. doi: 10.1016/s0967-0645(02)00138-8
Alves, M., and Verdière, A. C. (1999). Instability dynamics of a subtropical jet and applications to the Azores Front Current System: eddy–driven mean flow. J. Phys. Oceanogr. 29, 837–864. doi: 10.1175/1520-0485(1999)029<0837:IDOASJ>2.0.CO;2
Aristegui, J., Tett, P., Hernandez-Guerra, A., Basterretxea, G., Montero, M. F., Wild, K., et al. (1997). The influence of island-generated eddies on chlorophyll distribution: a study of meso- scale variation around Gran Canaria. Deep Sea Res. I 44, 71–96. doi: 10.1016/S0967-0637(96)00093-3
Bakun, A. (1973). Coastal Upwelling Indices, West Coast of North America, 1946–71, Tech. Rep. NMFS SSRF-671, Seattle, WA: National Oceanic and Atmospheric Administration, 103.
Barbosa, A. A. C., Peliz, A. J., Cordeiro, A., and Le Cann, B. (2011). Zonal structure of the mean flow and eddies in the Azores Current system. J. Geophys Res. 116:C0212, doi: 10.1029/2010JC006538
Bashmachnikov, I., Lafon, V., and Martins, A. (2004). Sea surface temperature distribution in the Azores region. Part II: space-time variability and underlying mechanisms. Life Mar. Sci. 21A, 19–32.
Bryden, H. L., King, B. A., McCarthy, G. D., and McDonagh, E. L. (2014). Impact of a 30% reduction in Atlantic meridional overturning during 2009–2010. Ocean Sci. 10, 683–691. doi: 10.5194/os-10-683-2014
Byrne, M. D., Münnich, M., Frenger, M. I., and Gruber, N. (2016). Mesoscale atmosphere ocean coupling enhances the transfer of wind energy into the ocean. Nat. Commun. 7:11867. doi: 10.1038/ncomms11867
Caldeira, R. M. A., Groom, S., Miller, P., and Nezlin, N. (2002). Sea-surface signatures of the island mass effect phenomena around Madeira Island, Northeast Atlantic. Remote Sens. Environ. 80, 336–360. doi: 10.1016/S0034-4257(01)00316-9
Caldeira, R., and Sangra, P. (2012). Complex geophysical wake flows. Ocean Dyn. 62, 785–797. doi: 10.1007/s10236-012-0528-6
Calil, P. H., Richards, K. J., Jia, Y., and Bidigare, R. R. (2008). Eddy activity in the lee of the Hawaiian islands. Deep Sea Res. II 55, 1179–1194. doi: 10.1016/j.dsr2.2008.01.008
Chelton, D. B., Schlax, M. G., and Samelson, R. M. (2011). Global observations of nonlinear mesoscale eddies. Prog. Oceanogr. 91, 167—216. doi: 10.1016/j.pocean.2011.01.002
Chin, T. M., Milliff, R. F., and Large, W. G. (1998). Basin-scale, high-wavenumber sea surface wind fields from a multiresolution analysis of scatterometer data. J. Atmos. Ocean. Technol. 15, 741–763. doi: 10.1175/1520-0426(1998)015<0741:BSHWSS>2.0.CO;2
Couvelard, X., Caldeira, R. M. A., Araújo, I. B., and Tomé, R. (2012). Wind mediated vorticity-generation and eddy-confinement, leeward of the Madeira Island: 2008 numerical case study. Dyn. Atmos. Oceans. 58, 128–149. doi: 10.1016/j.dynatmoce.2012.09.005
Dee, D. P., Uppala, S. M., Simmons, A. J., Berrisford, P., Poli, P., Kobayashi, S., et al. (2011). The ERA-Interim reanalysis: configuration and performance of the data assimilation system. Q. J. R. Meteorol. Soc. 137, 553–597. doi: 10.1002/qj.828
Dohan, K., and Maximenko, N. (2010). Monitoring ocean currents with satellite sensors. Oceanography 23, 94–103. doi: 10.5670/oceanog.2010.08
Doty, M. S., and Oguri, M. (1956). The island mass effect. J. Conseil Conseil Int. Pour Explor. Mer 22, 33–37. doi: 10.1093/icesjms/22.1.33
Elken, J. (2016). “Currents”, in Encyclopedia of Marine Geosciences (Springer Science+Business Media Dordrecht). doi: 10.1007/978-94-007-6644-0_158-3
Fu, G., Baith, K. S., and McClain, C. R. (1998). “SeaDAS: the SeaWiFS Data Analysis System,” in The 4th Pacific Ocean Remote Sensing Conference (Qingdao), 73–79.
Gaube, P., Chelton, D. B., Samelson, R. M., Schlax, M. G., and O'Neill, L. W. (2015). Satellite observations of mesoscale eddy-induced Ekman pumping. J. Phys. Oceanogr. 45, 104–132. doi: 10.1175/JPO-D-14-0032.1
Gordon, H. R., and Wang, M. (1994). Retrieval of waterleaving radiance and aerosol optical thickness over the oceans with SeaWiFS: a preliminary algorithm. Appl. Opt. 33, 443–452. doi: 10.1364/AO.33.000443
Gould, W. J. (1985). Physical oceanography of the Azores Front. Prog. Oceanogr. 14, 167–190. doi: 10.1016/0079-6611(85)90010-2
Gouretski, V. V., and Koltermann, K. P. (2004). WOCE Global Hydrographic Climatology. 35/2004, Berichte des Bundesamtes fur Seeschifffahrt und Hydrographie, 52 pp.
Hernandez-Leon, S. (1991). Accumulation of mesozooplankton in a wake area as a causative mechanism of the “island-mass effect”. Mar. Biol. 109, 141–147. doi: 10.1007/BF01320241
Hogg, A. M., Meredith, M. P., Chambers, D. P., Abrahamsen, E. P., Hughes, C., et al. (2015). Recent trends in the Southern Ocean eddy field. J. Geophys. Res. Oceans 120, 257–267. doi: 10.1002/2014JC010470
Juliano, M. F., and Alves, M. L. R. (2007). The Atlantic sub-tropical Front/Current Systems of Azores and St. Helena. J. Phys. Oceanogr. 37, 2573–2598. doi: 10.1175/2007JPO3150.1
Kazmin, A. S., and Rienecker, M. M. (1996). Variability and frontogenesis in the large-scale frontal zones. J. Geophys. Res. 101, 907–921. doi: 10.1029/95JC02992
Kersalé, M., Doglioli, A. M., and Petrenko, A. A. (2011). Sensitivity study of the generation of mesoscale eddies in a numerical model of Hawaii islands. Ocean Sci. 7, 277–291. doi: 10.5194/os-7-277-2011
Kessler, W., and Gourdeau, L. (2006). Wind-driven zonal jets in the South Pacific Ocean. Geophys. Res. Lett. 33:L03608. doi: 10.1029/2005gl025084
Lafon, V., Martins, A., Figueiredo, M., Melo Rodrigues, M. A., Bashmachnikov, I., Mendoça, A., et al. (2004). Sea surface temperature distribution in the Azores region Part I: AVHRR imagery and in situ data processing. Arquipélago. Life Mar. Sci. 21A, 1–18.
Lagerloef, G. S. E., Mitchum, G., Lukas, R., and Niiler, P. (1999). Tropical Pacific near-surface currents estimated from altimeter, wind and drifter data. J. Geophys. Res. 104, 313–326. doi: 10.1029/1999jc900197
Lazar, A., Stegner, A. A., and Heiftz, E. (2013). Inertial instability of intense stratified anticyclones. Part 1. Generalized stability criterion. J. Fluid Mech. 732, 457–484. doi: 10.1017/jfm.2013.412
Lázaro, C., Juliano, M. F., and Fernandes, M. J. (2013). Semi-automatic determination of the Azores Current axis using satellite altimetry: application to the study of the current variability during 1995–2006. Adv. Space Res. 51, 2155–2170. doi: 10.1016/j.asr.2012.12.021
Locarnini, R. A., Mishonov, A. V., Antonov, J. I., Boyer, T. P., Garcia, H. E., Baranova, M. M., et al. (2013). World Ocean Atlas 2013, Volume 1., Temperature, ed S. Levitus, Mishonov Technical Edn.; NOAA Atlas NESDIS 73, 40.
Mailly, T., Blayo, E., and Verron, J. (1997). Assessment of the ocean circulation in the Azores region as predicted by a numerical model assimilating altimeter data from Topex/Poseidon and ERS-1 satellites. Ann. Geophys. 15, 1354–1368. doi: 10.1007/s00585-997-1354-x
Mann, K., and Lazier, J. (1991). Dynamics of Marine Ecosystems: Biological–Physical Interactions in the Oceans. London: Blackwell.
O'Reilly, J. E., Maritorena, S., O'Brien, M. C., Siegel, D. A., Toole, D., Menzies, D., et al. (2000). “SeaWiFS postlaunch calibration and validation analyses, Part 3,” in SeaWiFS Postlaunch Technical Report Series, Vol. 11, eds B. Stanford Hooker and R. Elaine Firestone, NASA/TM-2000-206892, NASA Goddard Space Flight Center, 49.
Palter, J. B., Lozier, M. S., and Richard Barber, T. (2005). The effect of advection on the nutrient reservoir in the North Atlantic subtropical gyre. Nature 437, 687–692. doi: 10.1038/nature03969
Pingree, R. D., Garcia-Soto, C., and Sinha, B. (1999). Position and structure of the Subtropical/Azores Front region from combined Lagrangian and remote sensing (IR/altimeter/SeaWiFS) measurements. J. Mar. Biol. Assoc. UK 79, 769–792. doi: 10.1017/S002531549900096X
Pujol, M.-I., Faugère, Y., Taburet, G., Dupuy, S., Pelloquin, C., Ablain, M., et al. (2016). DUACS DT2014: the new multi-mission altimeter dataset reprocessed over 20 years. Ocean Sci. 12, 1067—1090. doi: 10.5194/os-12-1067-2016
Qiu, B., and Chen, S. (2010). Interannual variability of the North Pacific Subtropical Countercurrent and its associated mesoscale eddy field. J. Phys. Oceanogr. 40, 213–225. doi: 10.1175/2009JPO4285.1
Rypina, I. I., Lawrence, P. J., Julie, P., Julia, L., and Arnold, G. L. (2010). Chaotic Advection in an archipelago. J. f Phys. Oceanogr. 40, 1988–2006. doi: 10.1175/2010JPO4336.1
Sala, I., Harrison, C. S., and Caldeira, R. M. A. (2015). The role of the Azores Archipelago in capturing and retaining incoming particles. J. Mar. Syst. 154(Pt B), 146–156. doi: 10.1016/j.jmarsys.2015.10.001
Sangrá, P., Ananda, P., Ángel, R., Francisco, M., Evan, M., James, C. M., et al. (2009). The canary eddy corridor: a major pathway for long-lived eddies in the subtropical North Atlantic. Deep Sea Res. I 56, 2100–2114. doi: 10.1016/j.dsr.2009.08.008
Shettle, E. P., and Fenn, R. W. (1979). Models for the Aerosols of the Lower Atmosphere and the Effects of Humidity Variations on their Optical Properties. Hanscom, MA: Air Force Geophysics Lab, Rep. AFGL-TR-79–0214.
Silva, A., Brotas, V., Valente, A., Sá, C., Diniz, T., Patarra, R. F., et al. (2013). Coccolithophore species as indicators of surface oceanographic conditions in the vicinity of Azores islands. Estuarine Coast. Shelf Sci. 118, 50–59. doi: 10.1016/j.ecss.2012.12.010
Small, R. J., de Szoeke, S. P., Xie, S. P., O'Neill, L., Seo, H., Song, Q., et al. (2008). Air–sea interaction over ocean fronts and eddies. Dyn. Atmos. Oceans 45, 274–319. doi: 10.1016/j.dynatmoce.2008.01.001
Søliland, H., Budgell, W. P., and Knutsen, Ø. (2008). The physical oceanographic condition along the Mid-Atlantic Ridge north of the Azores in June-July 2004. Deep Sea Res. I 55, 29–44. doi: 10.1016/j.dsr2.2007.09.015
Sverdrup, H. U. (1947). Wind-driven currents in a baroclinic ocean: with application to the equatorial currents of the eastern Pacific. Proc. Natl. Acad. Sci. U.S.A. 33, 318–326. doi: 10.1073/pnas.33.11.318
Talley, L. D., and Raymer (1982). M. E. Eighteen Degree Water variability. J. Mar. Res. 40(Suppl.), 757–775.
Tikinaga, H., Tanimoto, Y., and Xie, S.-P. (2005). SST-Induced surface Wind Variations over the Brazil-Malvinas Confluence: satellite and in situ observations. J. Clim. 18, 3470–3482. doi: 10.1175/JCLI3485.1
Volkov, D. L., and Fu, L. L. (2011). Interannual variability of the Azores Current strength and eddy energy in relation to atmospheric forcing. J. Geophys. Res. 116:C11011. doi: 10.1029/2011JC007271
Williams, S., Petersen, M. P. Bremer, T., Hecht, M., Pascucci, V., Ahrens, J., et al. (2011). Adaptive extraction and quantification of geophysical vortices. IEEE Trans. Vis. Comput. Graph. 17, 2088—2095. doi: 10.1109/TVCG.2011.162
Wolanski, E. (1994). Physical Oceanographic Processes of the Great Barrier Reef. Boca Raton, FL: CRC Press.
Keywords: gulf stream, ekman transport, eddy-corridor, mesoscale eddies, wake, Sverdrup model
Citation: Caldeira RMA and Reis JC (2017) The Azores Confluence Zone. Front. Mar. Sci. 4:37. doi: 10.3389/fmars.2017.00037
Received: 01 April 2016; Accepted: 30 January 2017;
Published: 13 February 2017.
Edited by:
Mónica Almeida Silva, MARE–Marine and Environmental Sciences Centre, PortugalCopyright © 2017 Caldeira and Reis. This is an open-access article distributed under the terms of the Creative Commons Attribution License (CC BY). The use, distribution or reproduction in other forums is permitted, provided the original author(s) or licensor are credited and that the original publication in this journal is cited, in accordance with accepted academic practice. No use, distribution or reproduction is permitted which does not comply with these terms.
*Correspondence: Rui M. A. Caldeira, rui.caldeira@oom.arditi.pt