Satellite Telemetry Reveals Spatial Overlap Between Vessel High-Traffic Areas and Humpback Whales (Megaptera novaeangliae) Near the Mouth of the Chesapeake Bay
 Jessica M. Aschettino1*
  Daniel T. Engelhaupt1
  Amy G. Engelhaupt2 Andrew DiMatteo3 Todd Pusser4 Michael F. Richlen1 Joel T. Bell5
- 1HDR Inc., Virginia Beach, VA, United States
- 2Amy Engelhaupt Consulting, Virginia Beach, VA, United States
- 3CheloniData, Berthoud, CO, United States
- 4Independent Researcher, West End, NC, United States
- 5Naval Facilities Engineering Command Atlantic, Norfolk, VA, United States
During winter months, humpback whales (Megaptera novaeangliae) frequent the coastal waters of Virginia near the mouth of the Chesapeake Bay. Located within the Bay is Naval Station Norfolk, the world’s largest naval military installation, and the Port of Virginia, the sixth busiest container port in the United States. These large seaports, combined with the presence of recreational boaters, commercial fishing vessels, and sport-fishing boats, result in a constant heavy flow of vessel traffic through the mouth of the Chesapeake Bay and adjacent areas. From December 2015 to February 2017, 35 satellite tags were deployed on humpback whales to gain a better understanding on the occurrence, movements, site-fidelity, and overall behavior of this species within this high-traffic region. The tags transmitted data for an average of 13.7 days (range 2.7–43.8 days). Location data showed that at some point during tag deployment, nearly all whales occurred within, or in close proximity to, the shipping channels located in the study area. Approximately one quarter of all filtered and modeled locations occurred within the shipping channels. Hierarchical state-space modeling results suggest that humpback whales spend considerable time (82.0%) engaged in foraging behavior at or near the mouth of the Chesapeake Bay. Of the 106 humpback whales photo-identified during this research, nine individuals (8.5%) had evidence of propeller strikes. One whale that had previously been tagged and tracked within shipping channels, was found dead on a local beach; a fatality resulting from a vessel strike. The findings from this study demonstrate that a substantial number of humpback whales frequent high-traffic areas near the mouth of the Chesapeake Bay, increasing the likelihood of injurious vessel interactions that can result in mortalities.
Introduction
The humpback whale (Megaptera novaeangliae) is a cosmopolitan species that undergoes long-distance seasonal migrations between high-latitude feeding grounds and low-latitude breeding and calving grounds. Many regional populations, having recovered from decades of commercial whaling (e.g., Stevick et al., 2003), were recently downgraded from “Endangered” to “Threatened” status under the United States Endangered Species Act (ESA) and some populations have been removed entirely from ESA listing (Federal Register, 2016). Globally, they are listed as ‘least concern’ under the IUCN (Cooke, 2018). Humpback whales in the North Atlantic, considered part of the West Indies distinct population segment (Bettridge et al., 2015) and removed from ESA listing (Federal Register, 2016), migrate from northern feeding grounds in the Gulf of Maine and off the coasts of Canada, Greenland, Iceland, and Norway to the waters of the West Indies during the winter months to mate and give birth (Katona and Beard, 1990; Christensen et al., 1992; Palsbøll et al., 1997). An unknown portion of the population does not migrate to Caribbean waters, but instead uses the coastal waters between New Jersey and North Carolina as a supplemental winter feeding ground (Swingle et al., 1993; Barco et al., 2002). Wiley et al. (1995) hypothesized that it could be an adaptive strategy for juvenile humpback whales to remain in the Mid-Atlantic region during winter months rather than migrating to breeding areas.
Ship strikes are a major cause of mortality for humpback whales worldwide (Bettridge et al., 2015; Hill et al., 2017). A database of global large whale ship strike records, compiled by Jensen and Silber (2004), found humpback whales to be the second most commonly struck species. In April 2017 the United States National Oceanic and Atmospheric Administration (NOAA) declared an unusual mortality event (UME) for humpback whales along the Atlantic east coast from Maine to Florida due to a larger-than-normal number of deaths (n = 93) between January 2016 through April 2019 (NOAA, 2019). The Mid-Atlantic states, including Virginia and North Carolina, account for roughly one third (n = 32) of that mortality. Approximately half of the humpback whales examined as part of the UME had evidence of human interaction, either from ship strikes or entanglement with fishing gear (NOAA, 2019). Historically, this region has documented numerous occurrences of ship strikes. The East Coast recorded the highest number of confirmed and possible ship strikes in North America, with the mid-Atlantic ranking second globally (Jensen and Silber, 2004). Wiley et al. (1995) determined that six of 20 (30%) humpback whales that stranded off the United States Mid-Atlantic and Southeast from 1985 to 1992 had serious injuries likely attributable to vessel strikes. These injuries ranged from propeller cuts to evidence of blunt force trauma, including a disarticulated skull, a fractured mandible, and areas of hemorrhage and extensive skeletal damage (Wiley et al., 1995). Another five of the 20 humpback whales from that study had injuries consistent with entanglement in fishing gear (Wiley et al., 1995).
Along the eastern seaboard of the United States, in the Mid-Atlantic region, is the entrance to the largest estuary in the country, the Chesapeake Bay (Figure 1). Located just inside the bay is the world’s largest naval installation, Naval Station Norfolk, as well as the Port of Virginia, the sixth busiest container port in the United States (U.S. Army Corps of Engineers, 2017). These active seaports, combined with the presence of recreational boaters, as well as high numbers of commercial and recreational fishing vessels, result in a constant and often heavy flow of vessel traffic through the mouth of the Chesapeake Bay and adjacent waterways (Figure 2). From November through April there are ship-speed reduction rules in effect as part of a Seasonal Management Area (SMA) set up to protect ESA-listed North Atlantic right whales (Eubalaena glacialis) (NOAA, 2008). These speed restrictions are established along the entire eastern seaboard and require all vessels 65 feet (19.8 m) or longer to travel at 10 knots (18.5 km/h) or less when the whales are most likely to be present. The SMA in this study area begins at the mouth of the Chesapeake Bay and extends outwards to 37 km (Figure 1).
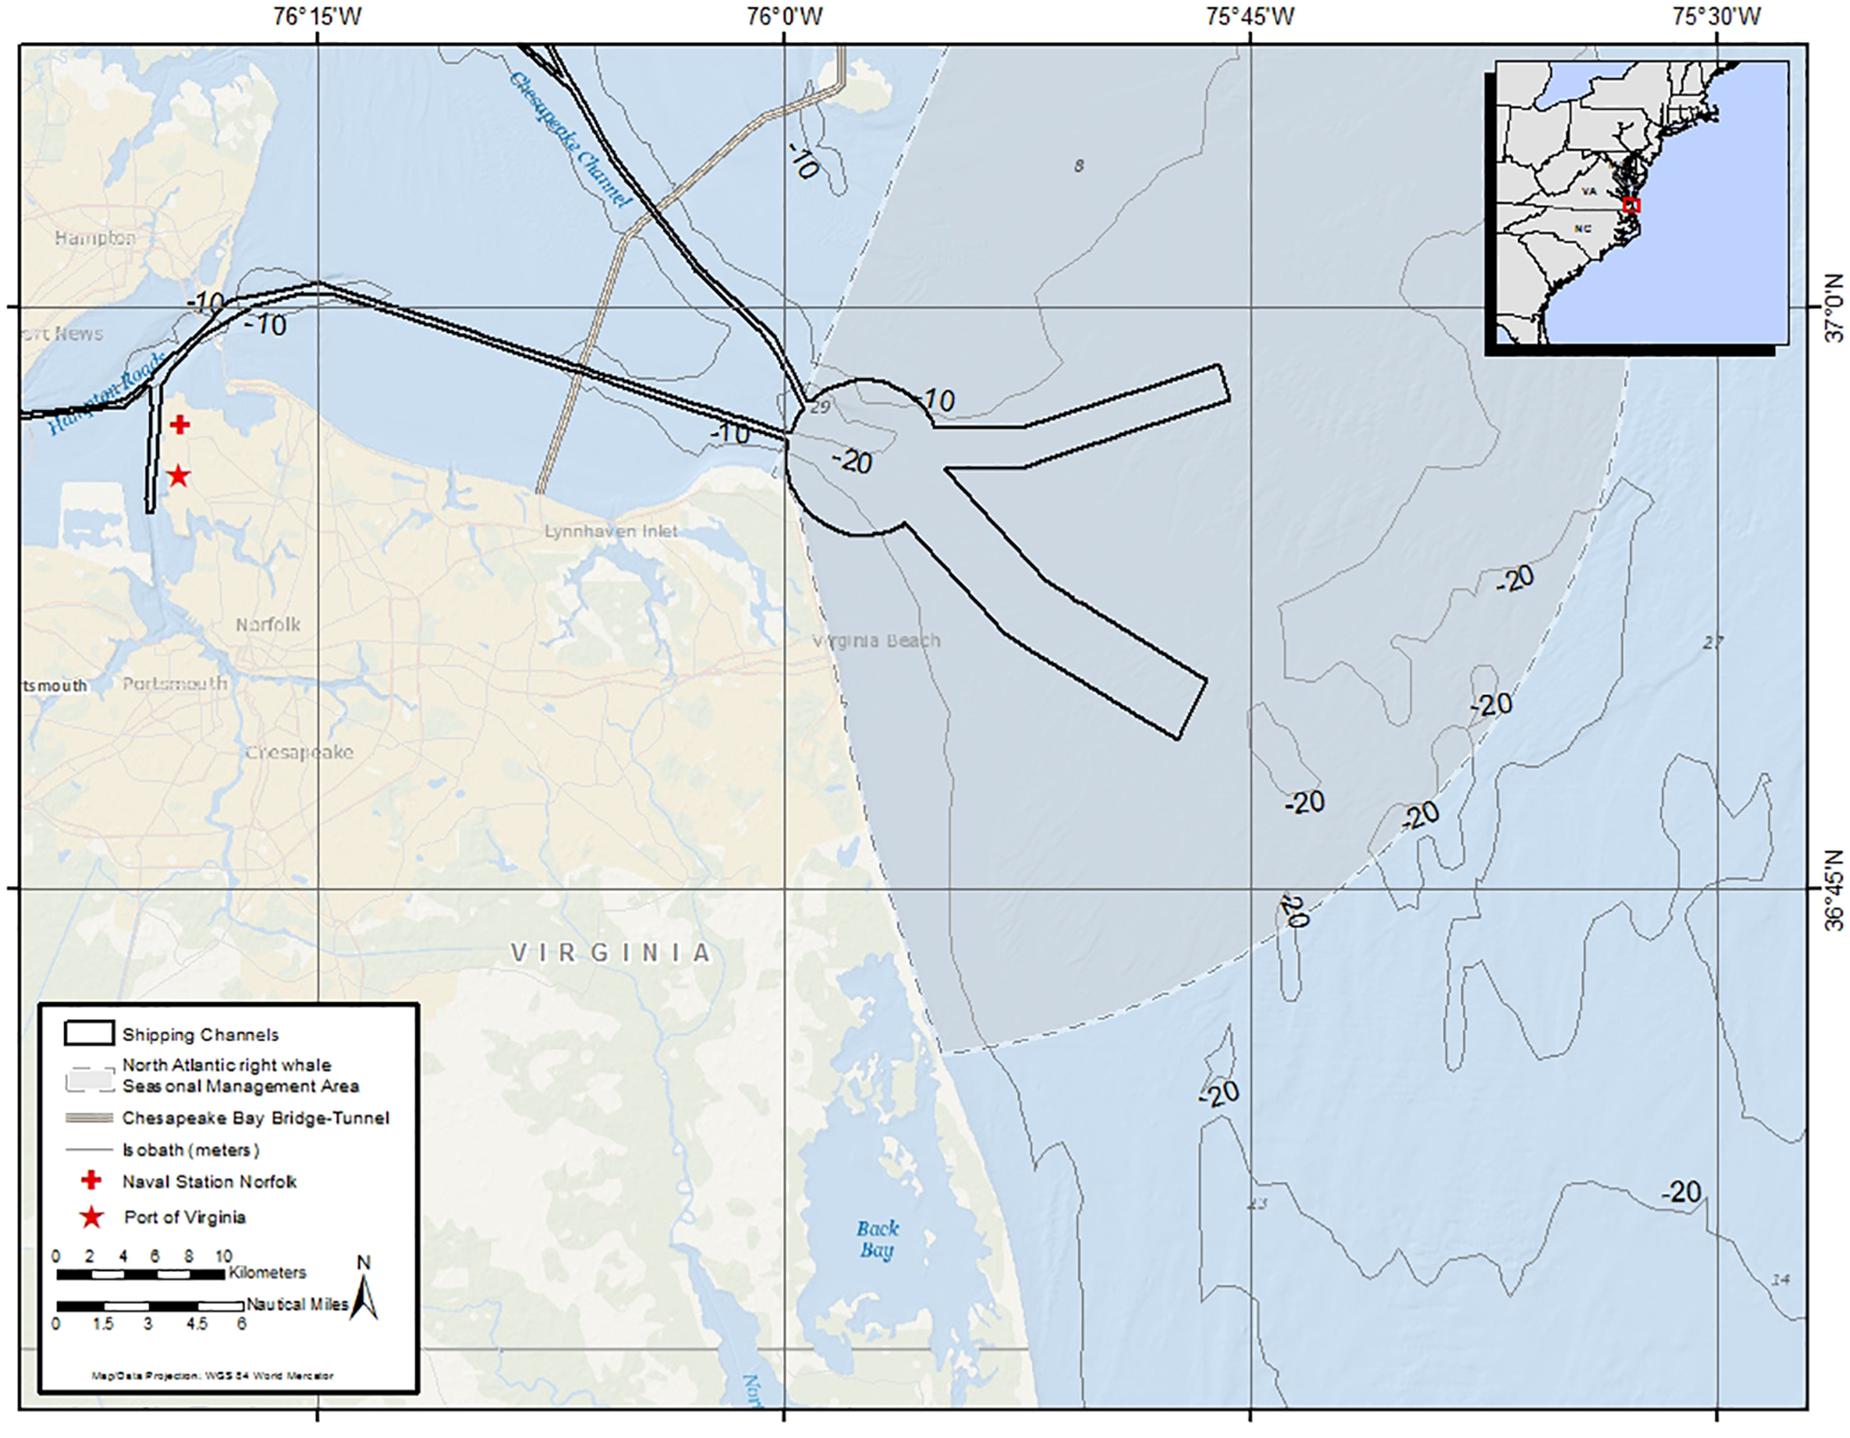
Figure 1. Map of the primary study area, which includes waters in and around the mouth of the Chesapeake Bay off Virginia Beach, Virginia as well as the Port of Virginia and Naval Station Norfolk. Shipping channels are outlined in black and the North Atlantic right whale Seasonal Management Area is shaded. The 37-km Chesapeake Bay Bridge-Tunnel spanning the mouth of the Bay is also shown.
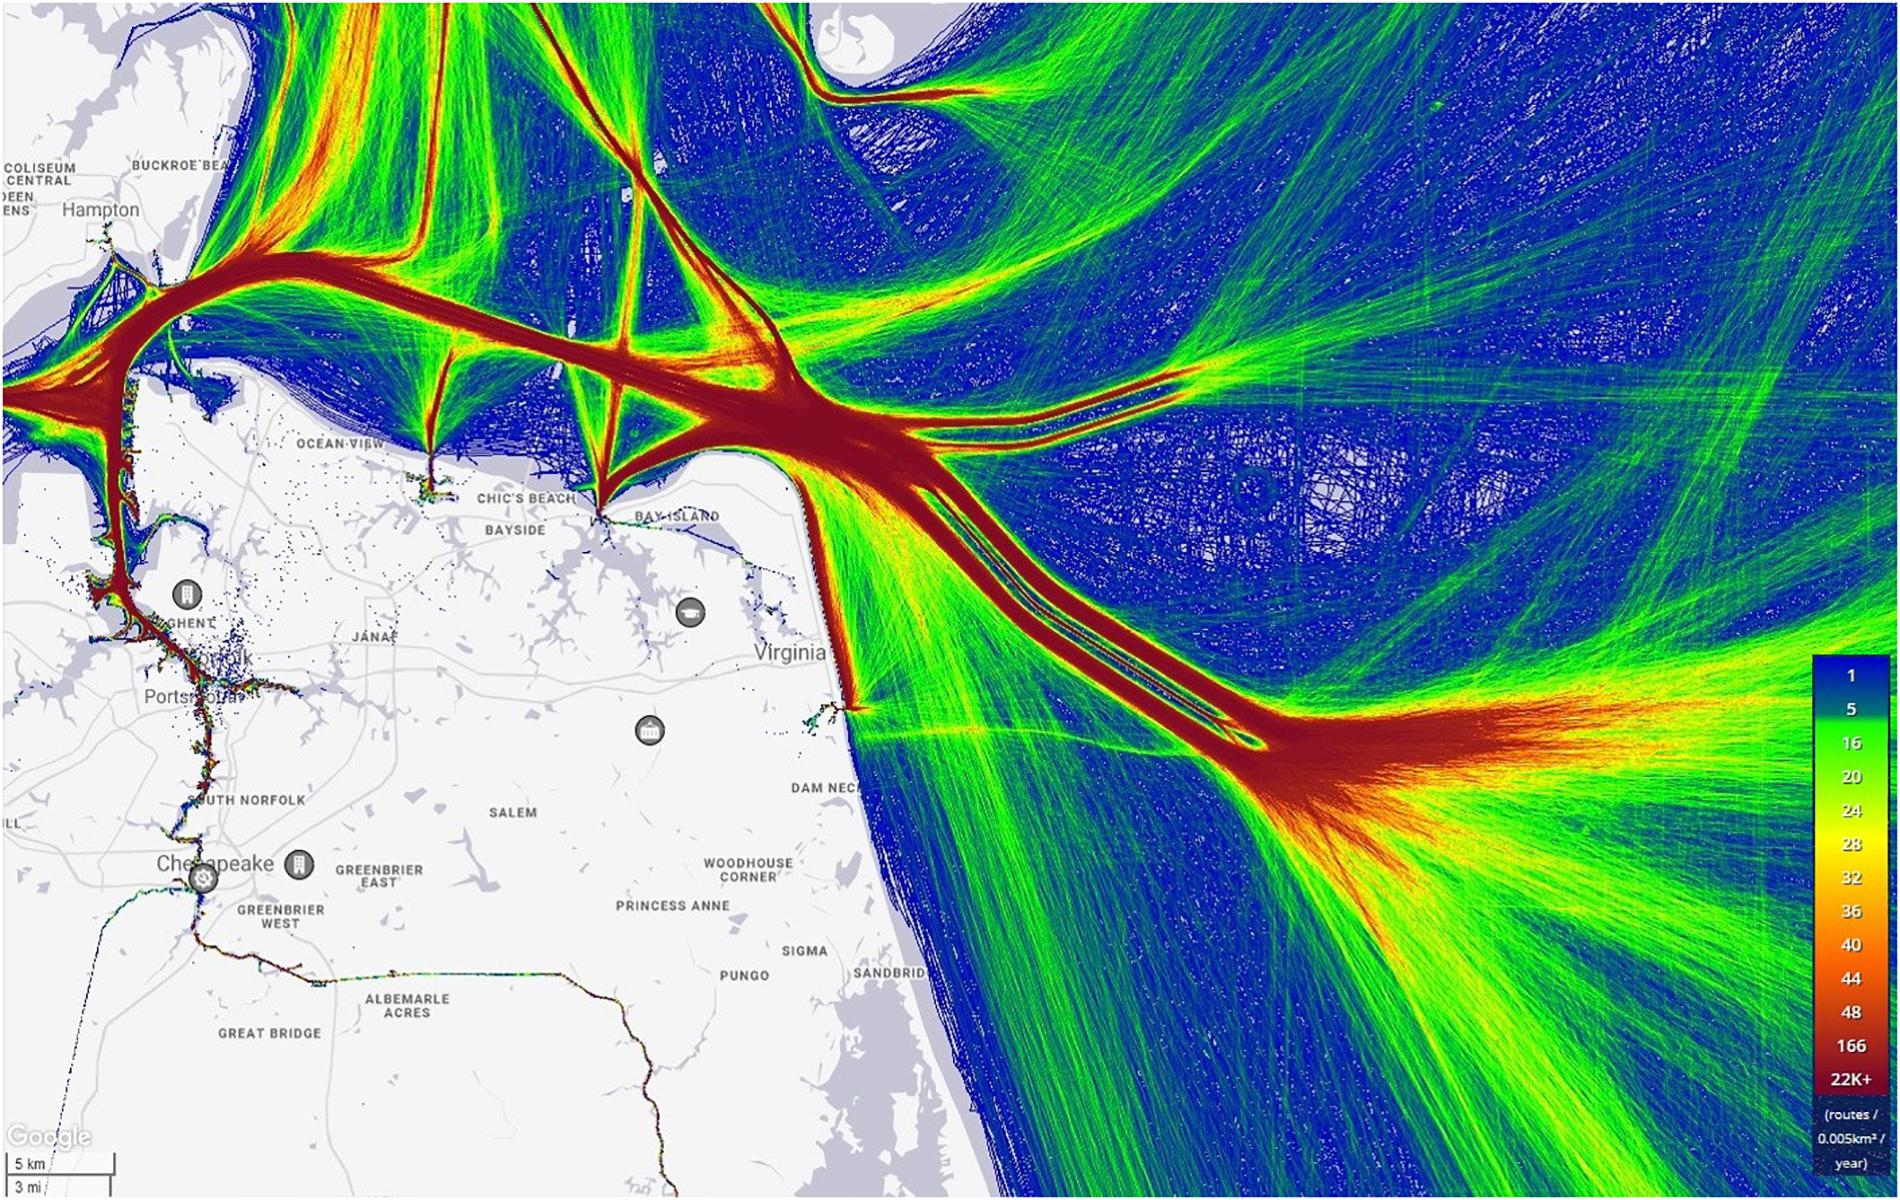
Figure 2. Heat map showing vessel traffic movement in and out of the Chesapeake Bay for the year 2016. The red color indicates the highest density of vessel traffic. Yellow indicates a moderate volume of vessel traffic, and blue indicates the lowest density of vessel traffic. Image provided by www.MarineTraffic.com.
Understanding the occurrence and behavior of humpback whales within the Chesapeake Bay’s high-traffic region is critical to mitigating potentially harmful impacts on the species. Funded through the United States Navy Marine Species Monitoring Program, in 2015 scientists at HDR Inc. began a long-term study of humpback whales that utilize the waters in and around the mouth of Chesapeake Bay to address questions of habitat use and identify potential conflicts associated with anthropogenic activities. Specifically, this project sought to document the behavior and movements of humpback whales, the level of overlap with high-traffic areas, evaluate site fidelity, and examine any discernable movement and habitat use patterns while taking into account age class and gender.
Materials and Methods
Study Area and Field Methods
From January 2015 to February 2017, field effort occurred in each of the 3 years during the winter and early spring. Each field season is referred to herein as, e.g., the 2015/2016 season. Surveys were conducted using an 8.2-m fiberglass hybrid-foam-collar vessel that departed from Lynnhaven Inlet in Virginia Beach, Virginia. Field days were chosen based on optimal sea conditions (Beaufort Sea State of 3 or less and swell height less than 2 m) and time of year (November–March), when sightings of humpback whales in the area are most numerous. Field effort was conducted during daylight hours although start and end time varied based on suitable weather. The primary area of interest was in and around the mouth of the Chesapeake Bay (Figure 1). This area is relatively shallow, 30 meters (m) or less in depth in the shipping lanes and precautionary areas (although most range from 12 to 18 m), and 11 to 15 m outside of the shipping channels (provided by NOAA Office of Coast Survey1, charts US5VA13M and US5VA19M). The mouth of the bay is approximately 120 km from the continental shelf break, and it is only east of the break that depth increases beyond 100 m. When no whales were observed within the primary study area, the field team would extend their search farther offshore (up to 70 km) or to the south near the North Carolina border. Surveys were non-systematic and no transect lines were followed. The vessel operated at a speed of approximately 25–40 km/h, with three to five observers scanning 360 degrees noting the presence of all marine mammal species.
All baleen whales observed were approached to confirm species and record group size, behavioral state, estimated age class, and GPS location. Age class for humpback whales was approximated by using the 8.2 m vessel as a reference. When approaching broad side to a whale, whales that were estimated to be a similar-size (± approximately 2 m) to the vessel were considered to be juveniles. Those estimated to be >2 m longer than the vessel were categorized as non-juveniles (i.e., either sub-adults or adults). Although subjective, these length estimates are in line with a study by Clapham and Mead (1999) who found males > 11.5 m and females > 11.9 m to be sexually mature. Whenever possible, identification photos – “photo-IDs” – of tail flukes and dorsal fins, using Canon DSLR cameras and 100–400-mm telephoto lenses, were obtained for all humpback whales encountered. Many humpback whales do not regularly lift their tail flukes above the surface in the study area, likely due to the shallow water depth. Photo-IDs were compared to HDR’s catalog of unique individuals, which was kept on-board. Individual humpback whales were identified using unique markings on the dorsal fin (e.g., Wells and Scott, 1990; Würsig and Jefferson, 1990) and pigmentation and serration patterns on the ventral surface of the tail flukes (e.g., Katona et al., 1979). Based on a whale’s identification (ID), previous encounter history, overall behavior, and health assessment, a determination was made if biopsy sampling and/or satellite tagging would be attempted. Individuals with known sighting histories were the preferred candidates for tagging, however, this was only possible about half of the time, and any animal deemed to be in good body condition was considered a potential candidate for tagging. Tissue samples were collected from tagged animals, whenever possible, as well as from individuals that were not tagged using either a 68-kg pull Barnett compound crossbow (Barnett Outdoors, LLC, Tarpon Springs, FL, United States) or a Paxarms biopsy rifle (Paxarms New Zealand Ltd., Cheviot, New Zealand). Skin samples were processed for gender determination at Duke University following the methods described in Waples (2017).
Satellite Tagging
Argos satellite-linked tags from Wildlife Computers (Redmond, Washington) in the Low Impact Minimally Percutaneous External-electronics Transmitter (LIMPET) configuration (Andrews et al., 2008) were used, with location-only Smart Position and Temperature (SPOT-240) tags comprising the majority (32) of tags deployed. A small number (3) of SPLASH10-F-333 tags, which, in addition to collecting location data also collected depth data, with a depth sensor resolution of 0.5 m, in pre-defined bins, were trialed in 2017. These anchored tags with the electronics package external to the skin (see Andrews et al., 2019) were remotely deployed using a modified air rifle DAN-INJECT JM25 pneumatic projector2. Two 6.8-cm surgical-grade titanium sub-dermal darts with six backward-facing petals were used to attach tags to the dorsal fin or just below the dorsal fin. Given existing information on attachment durations of these tags on humpback whales (e.g., Schorr et al., 2013), tags were expected to function over a period of a few days to weeks. Therefore, tags were programmed to maximize the number of transmissions and locations received during attachment rather than to extend battery life. Additionally, based on satellite availability in the area, tags were programmed to transmit continuously 20–22 h per day with the exception of one tag that was limited to 250 transmissions per day. Once a tag ceased transmitting, location and dive data were downloaded via the tag portal accessible on the Wildlife Computers website3. Locations of tagged individuals were approximated by the Argos system using the Kalman filtering location algorithm (CLS, 2016) and all Argos location classes were retained except for class Z. Additional filtering to remove locations corresponding to unrealistic swimming speeds was performed using the Douglas Argos Filter package provided within Movebank4, where maximum swimming speed was set at 15 km/h (e.g., Noad and Cato, 2007). Unrealistic locations (i.e., those on land) were manually removed using tools provided within Movebank. For the tag data collected from each individual whale, the PTT ID (a unique six digit serial number) of the tag will be used for the purposes of identification in this study.
Using the Argos locations obtained post-filtering, a ‘total distance’ was calculated for each tagged whale by summing the cumulative distances between each Argos location. This distance was then divided by the number of days the tag transmitted to provide an ‘average distance per day’ that an individual whale traveled. The ‘max distance from initial location’ was calculated as the furthest straight line distance between the first location and the farthest location, and the ‘mean distance from initial location’ was calculated as the mean distance of all Argos locations from the first tag location.
For the three SPLASH10-F-333 tags, the number of dives recorded were binned according to pre-determined depths. The dive-depth bins were defined as <5, 5–10, 10–15, 15–20, 20–25, 25–30, 30–35, and 35–50 m. Dive duration was also categorized in pre-determined 30 s time bins when greater than 1 min and less than 7 min. Dives shorter than 1 min and longer than 7 min were their own bin. Given these parameters, a dive to 22 m that lasted 4 min and 10 s would be logged in the 20–25 m depth bin and the 4–4.5 min duration bin. One histogram message was generated daily via Argos that contained the information for each of the dive-depth and dive duration bins.
Data Processing, Analysis, and State-Space Modeling
Photo sorting and matching were performed in ACDSee Pro v. 7 and 95. Photos for each sighting were cropped and sorted by separating photos of different animals and matching all duplicates of the same individual in order to choose the best images for cataloging. Each unique whale was assigned an individual catalog ID. For each subsequent sighting, images were first compared to previously cataloged individuals to see if they matched before designating as a new individual and assigning a new ID. Any potential matches found were also verified by a second experienced reviewer. A spreadsheet was used to track additional details, such as sighting location (latitude and longitude); date and time of the sighting; whether dorsal fin or fluke photos or both were obtained; within-season or between-season re-sightings; age-class estimation; and whether the individual was tagged or biopsied. Within-season re-sights are defined as re-sightings of the same individual during the same winter season – e.g., an animal sighted in December 2016 and re-sighted in January 2017 would be considered the same season, despite occurring in different calendar years. Between-season re-sights are defined as re-sightings of the same individual during different winter seasons – e.g., an animal sighted in March 2017 and re-sighted in December 2017, although observed in the same calendar year, would be classified as a between-season re-sight.
A hierarchical state-space model (hSSM) was applied to the tag data from all tagged whales in order to gain inference on animal behavior and residency. As with other state-space approaches, the track is smoothed into equal time intervals, with the estimated locations taking Argos location error into account. The R package ‘bsam’ (Jonsen et al., 2005; Jonsen, 2016) was selected as it allows for hierarchical modeling of tag locations. This method estimates movement parameters for all animals jointly, as well as an individual effects parameter for each tag. This can be advantageous as it may allow shorter deployments that could not have been modeled individually to give realistic results, as was the case here. The model assumes that animal movement patterns are broadly similar. We suggest that this is reasonable as all tags were from the same species and region. Though it is possible that factors such as age, sex, and inter-annual environmental variability may affect movement patterns, our objective was to gain as much inference as possible on short deployments, which meant grouping tags together as much as possible.
To determine the appropriate time interval for the hSSM predictions, the average time between received locations amongst all tags was calculated. This average time was the smallest interval considered between predicted locations in candidate models. Tag deployments shorter than 4 days (n = 2) were not analyzed given the low number of reported locations and lack of discernable behavior.
Model diagnostics were examined to ensure that Monte Carlo Markov chains (MCMC) were mixing and that all movement and individual effect parameters were converging as expected. Tracks were examined post hoc and dropped from subsequent analysis if issues were identified with the output.
The model attempted to assign estimated locations into one of two behavioral states based on the two-dimensional movement of the animal, travel and area restricted search. Travel is characterized by faster movement and fewer direction changes whereas area restricted search (ARS) is characterized by slower movement and frequent turns. Area restricted search is often associated with foraging activity, and in this study behavioral observations of feeding whales, as well as their proximity to prey aggregations, support this assumption. Behavioral states were assigned following Jonsen et al. (2007) from the mean predicted behavioral state of all samples. Values less than 1.25 were classified as traveling. Values greater than 1.75 were classified as ARS.
Animal locations, both filtered Argos and modeled hSSM locations, were overlaid with major shipping lanes to determine the degree of overlap as a proxy for risk of ship strike. Initially, the “shipping lane study area” was defined by the Traffic Separation Scheme which defines inbound and outbound commercial traffic boundaries for the Chesapeake Bay. However, as tag locations showed movements out of the defined area but still within other shipping channels around the Bay, the area was extended using additional nautical charts and datasets, including the Traffic Separation Scheme, Coastal Maintained Channels in United States Waters (United States Army Corps of Engineers), and Shipping Fairways, Lanes, and Zones for United States Waters (National Oceanic and Atmospheric Administration) as guidelines. These revised boundaries are, hereafter, collectively referred to as shipping channels and were used to determine the percentage of animal locations that occurred within and outside of them.
Results
Field Effort and Tagging Results
Seventy-two field days were conducted between January 02, 2015 and March 21, 2017 (Table 1 and Figure 3). In total, there were 305 sightings of 442 humpback whales; 106 unique humpback whales were cataloged, 51 individuals were biopsied, and 35 satellite tags (32 SPOT-240 and 3 SPLASH10-F-333) were deployed. Humpback whale behavior was most often categorized as traveling (43.6%), followed by milling (24.2%), feeding (16.4%), socializing (2.6%), and resting (1.3%). Behavioral state was unknown in the remaining 11.8% of observations, primarily due to groups not being approached. Most tags were deployed at the mouth of the Chesapeake Bay with 16 of the deployments occurring in shipping channels, one deployment occurring inside the Bay, and one deployment occurring south of the primary study area near the North Carolina border (Figure 4). Satellite tags transmitted data for an average of 13.7 days (range = 2.7–43.8). In addition to humpback whales, fin whales (Balaenoptera physalus) were observed in the study area during the 2014/2015 and 2015/2016 season (8 sightings of 11 individuals across both seasons) and minke whales (Balaenoptera acutorostrata) were observed during the 2016/2017 season (3 sightings of 3 individuals). Sightings of minke whales occurred at the mouth of the Bay, just outside shipping channels and the SMA. Fin whale sightings occurred at the mouth of the Bay and slightly to the south, with half occurring within the shipping channels inside the SMA and half occurring just outside of shipping channels and the SMA (Figure 3).
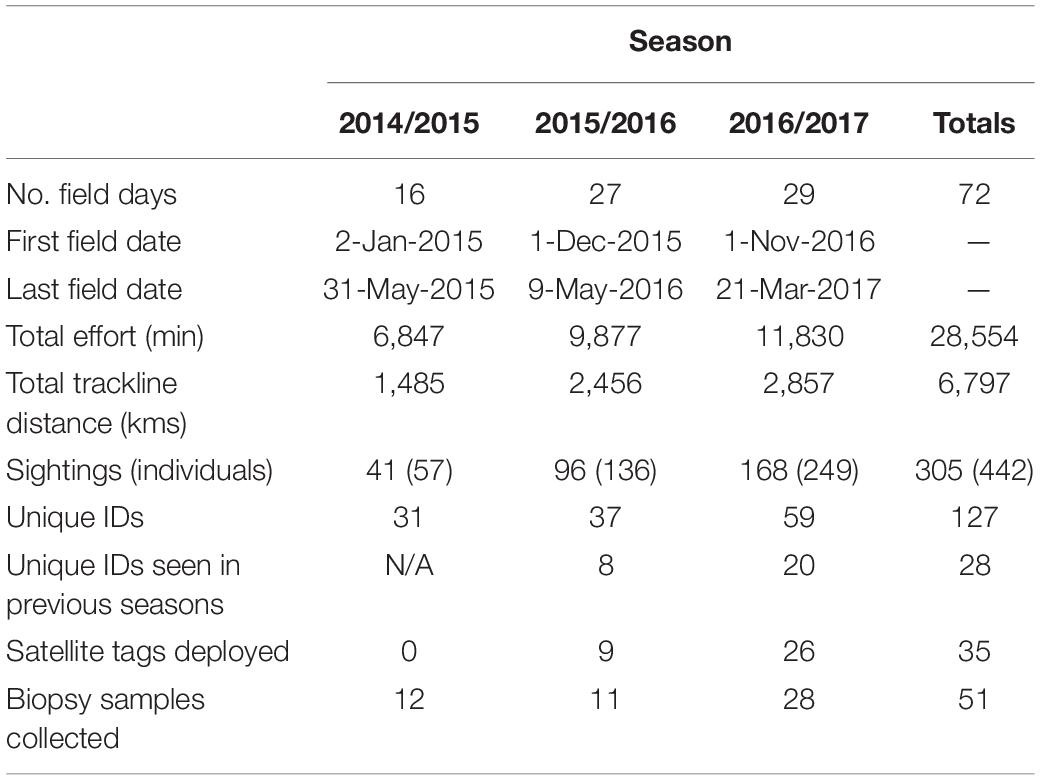
Table 1. Summary of field effort and humpback whales sighted, photo-identified, satellite-tagged, and biopsied over three consecutive field seasons from 2015 to 2017.
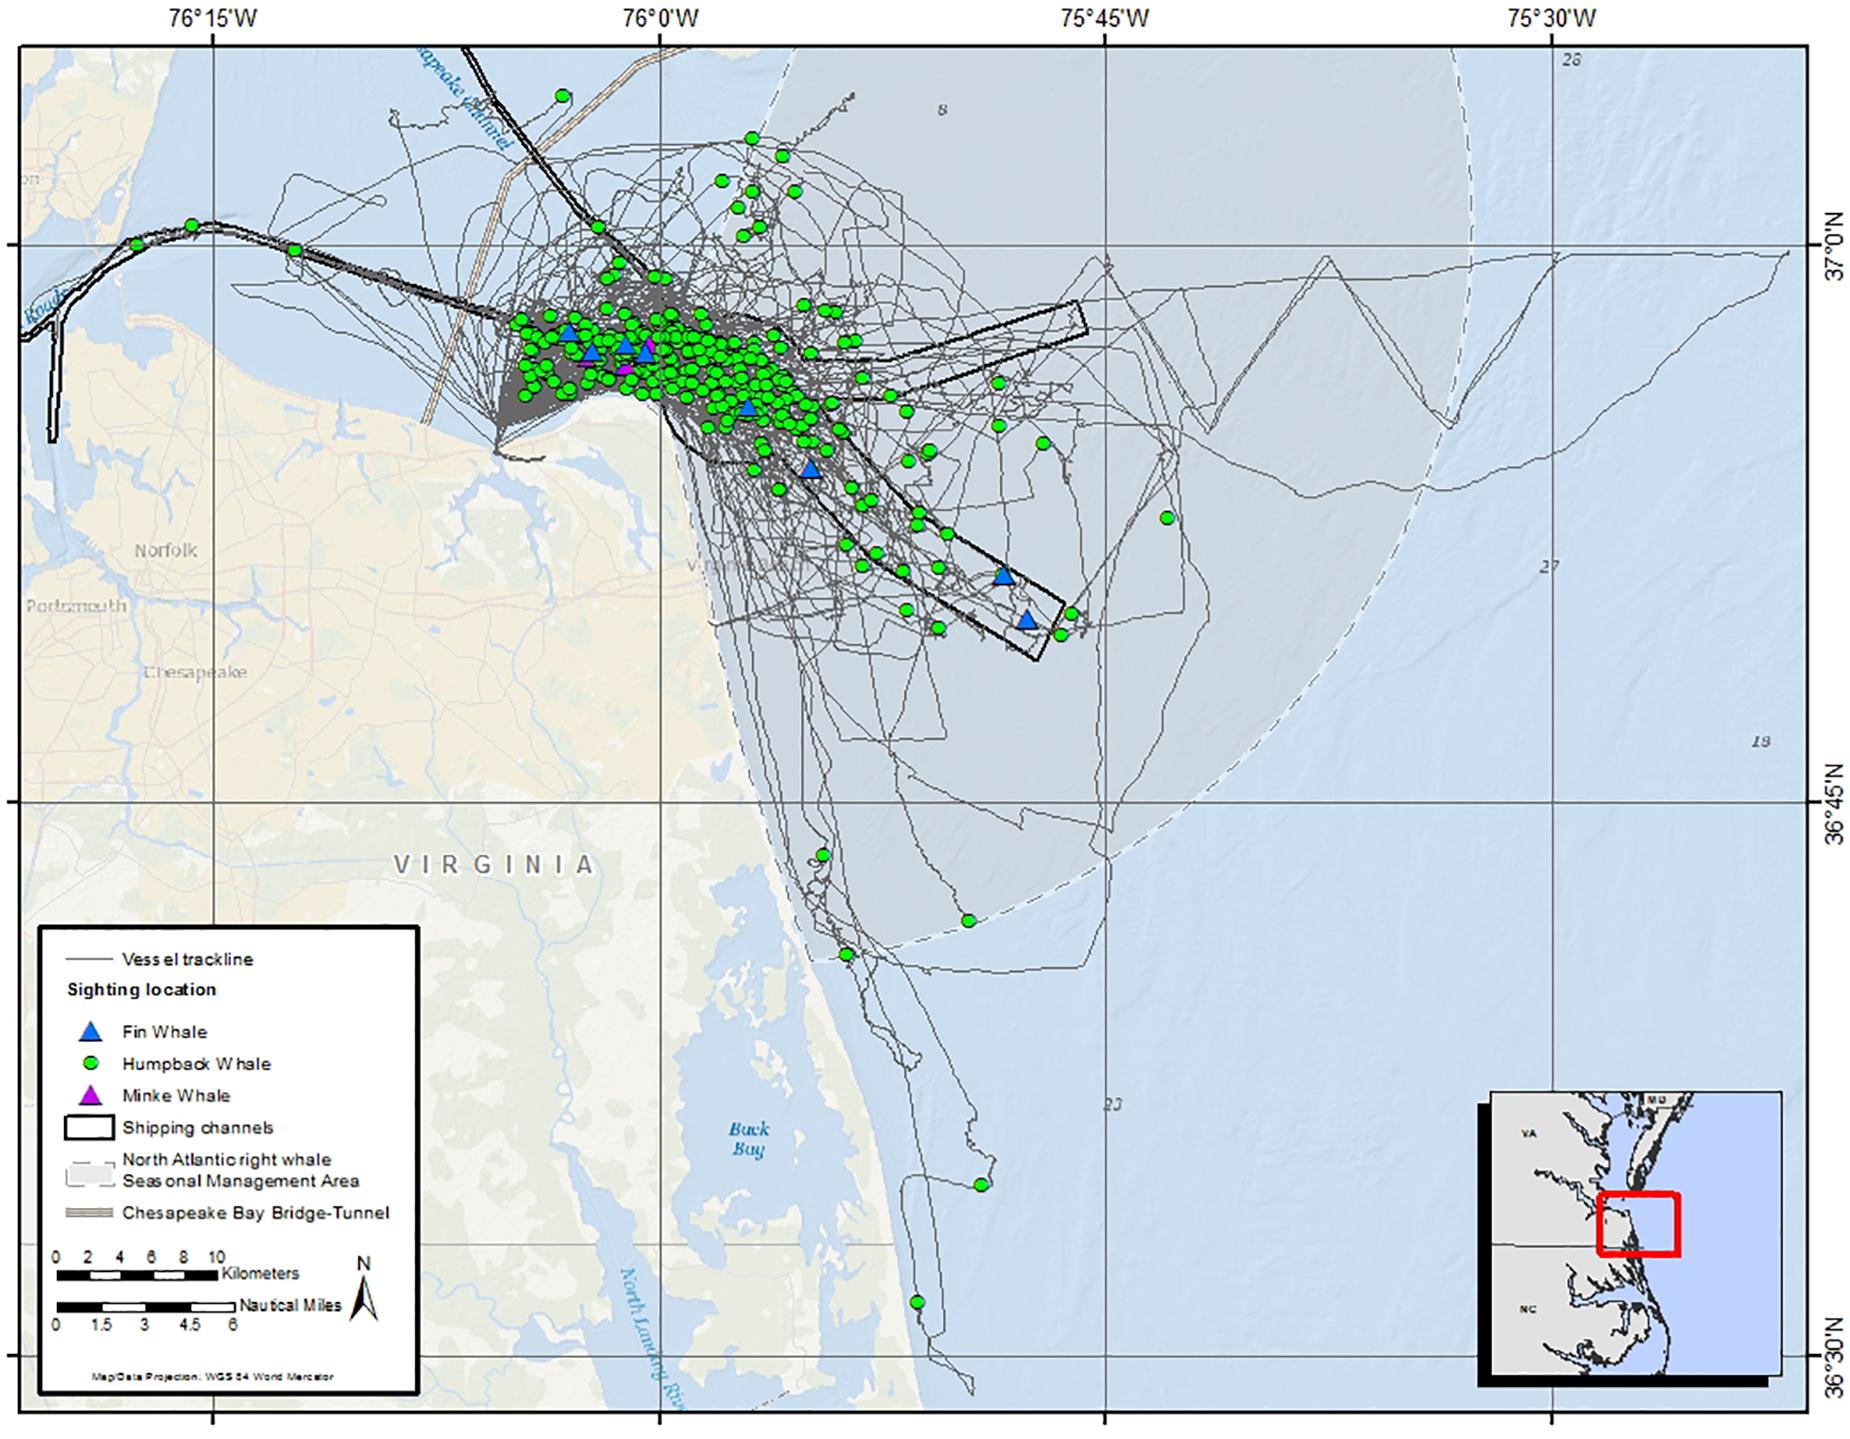
Figure 3. Survey vessel trackline (gray line) and sightings of baleen whales for all field effort from December 2015 to February 2017, with humpback whales shown as green dots, minke whales shown as purple triangles, and fin whales shown as blue triangles.
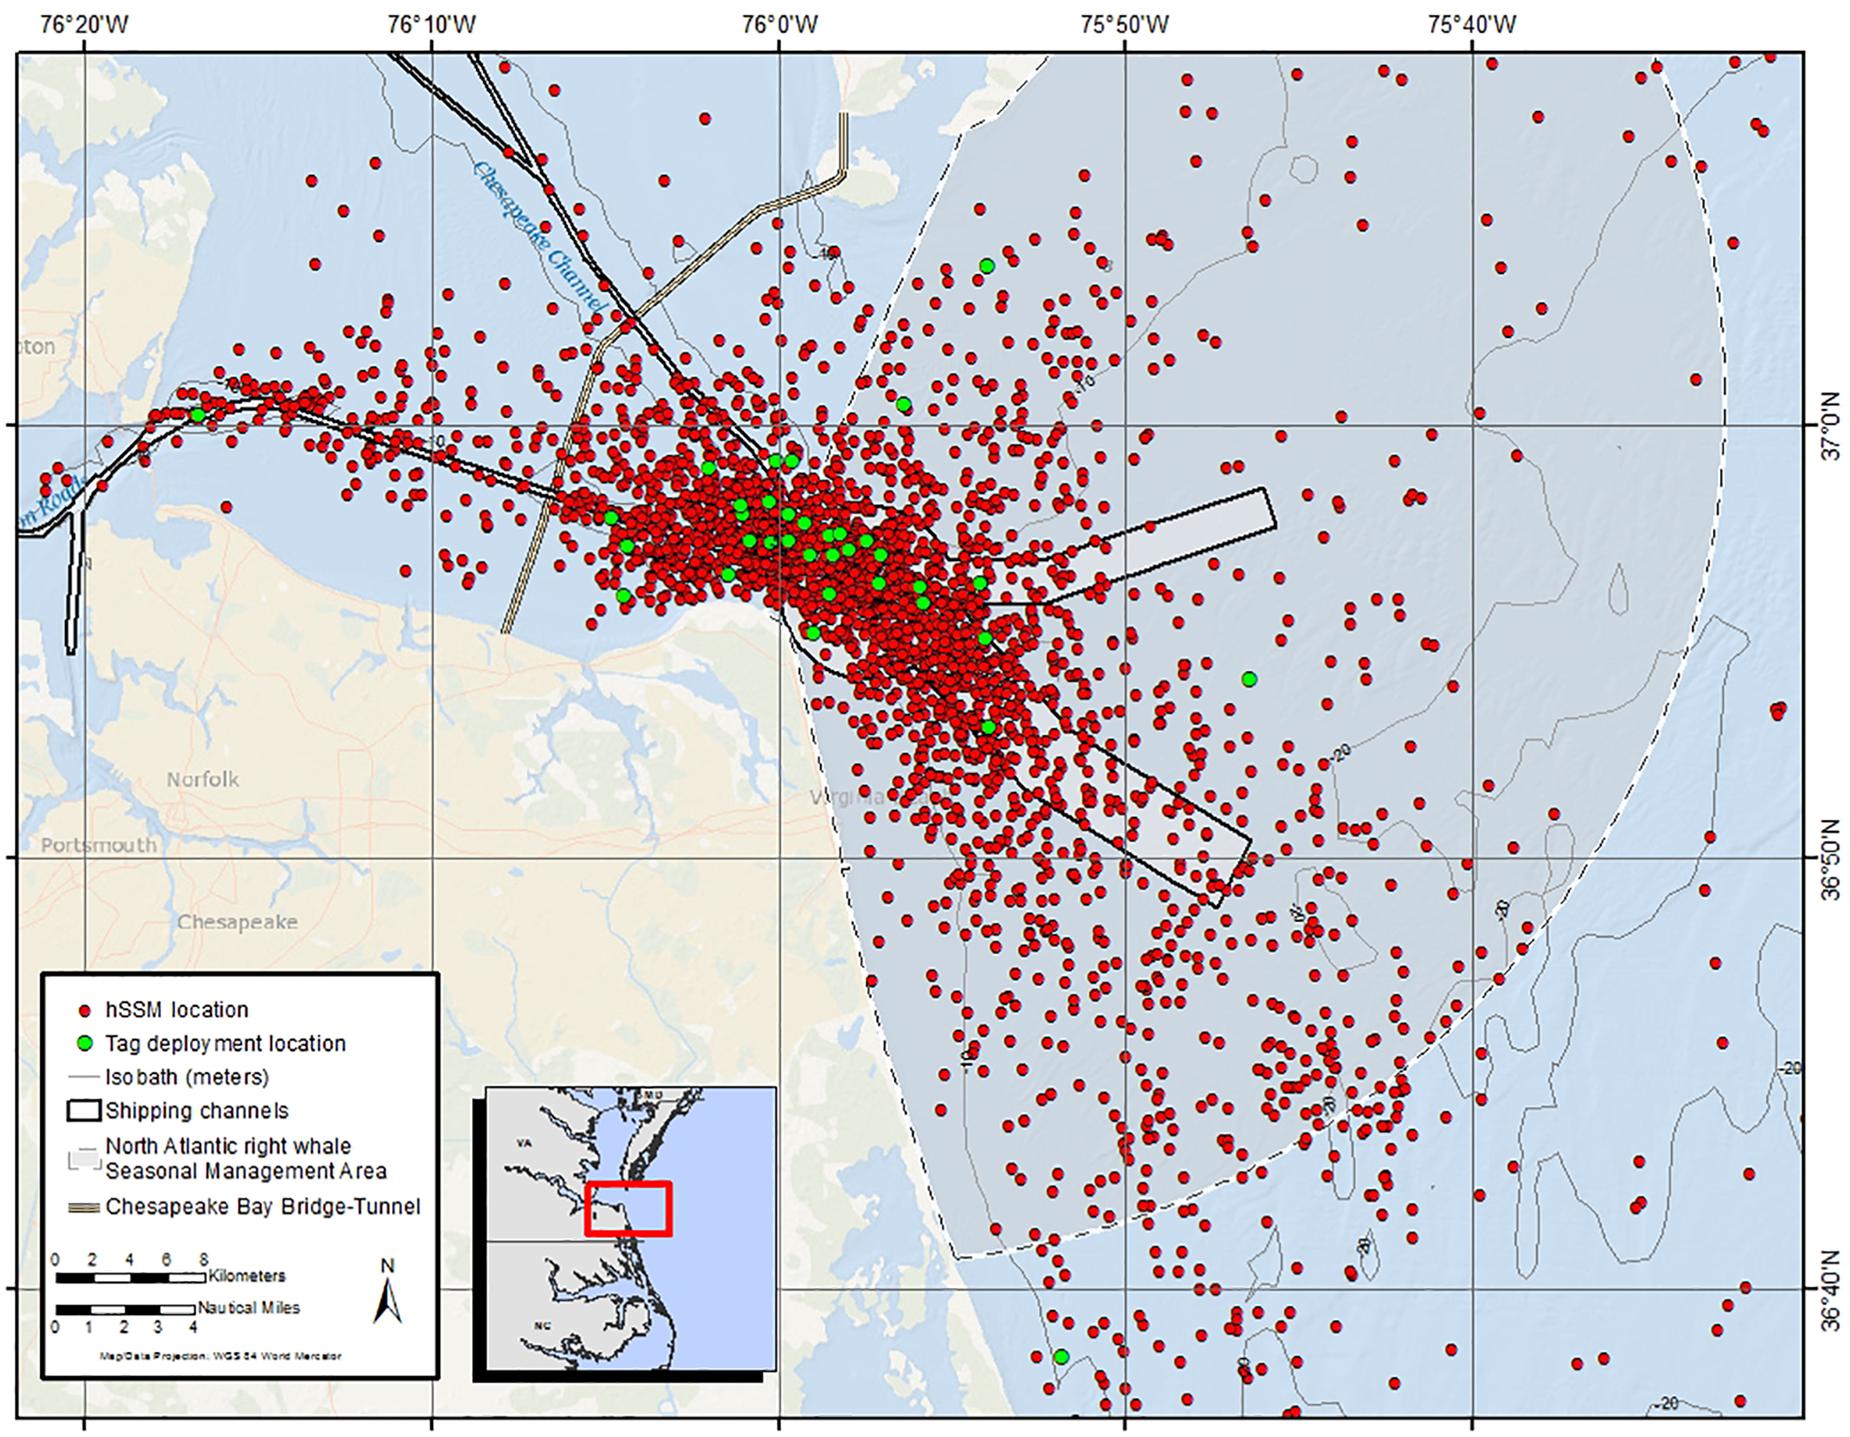
Figure 4. All hierarchical state-space model (hSSM) locations (red dots) in the immediate vicinity of the shipping channels at the mouth of the Chesapeake Bay from 33 satellite tagged humpback whales included in the hSSM. Green dots show tag deployment locations from all 35 tagged whales.
Based on size estimates, all tagged humpback whales were judged to be juveniles or sub-adults and none were associated with a calf. Of the 51 biopsies obtained, 30 were collected from whales that were satellite tagged. Gender analysis was performed on a subset (n = 29) of the 51 samples and showed roughly equal gender ratios (14 females; 15 males) (Waples, 2017). Of the whales that were satellite tagged, eight individuals were females, 11 individuals were males (Table 2), and the remaining 15 samples are awaiting gender analysis. Tags deployed on males (n = 11) transmitted longer (mean = 12.0 days) than females (n = 8; mean = 7.3 days). For whales determined to be juveniles, the tags transmitted longer than tags deployed on whales classified as sub-adults. Tags deployed on juvenile males (n = 7) transmitted for the longest (mean = 13.3 days) and tags deployed on sub-adult females (n = 3) transmitted for the shortest duration (mean = 4.9 days). The SPLASH10-F tags deployed (n = 3) transmitted for shorter durations (mean = 7.7 days) than the SPOT-240C tags (n = 32; mean = 14.2 days).
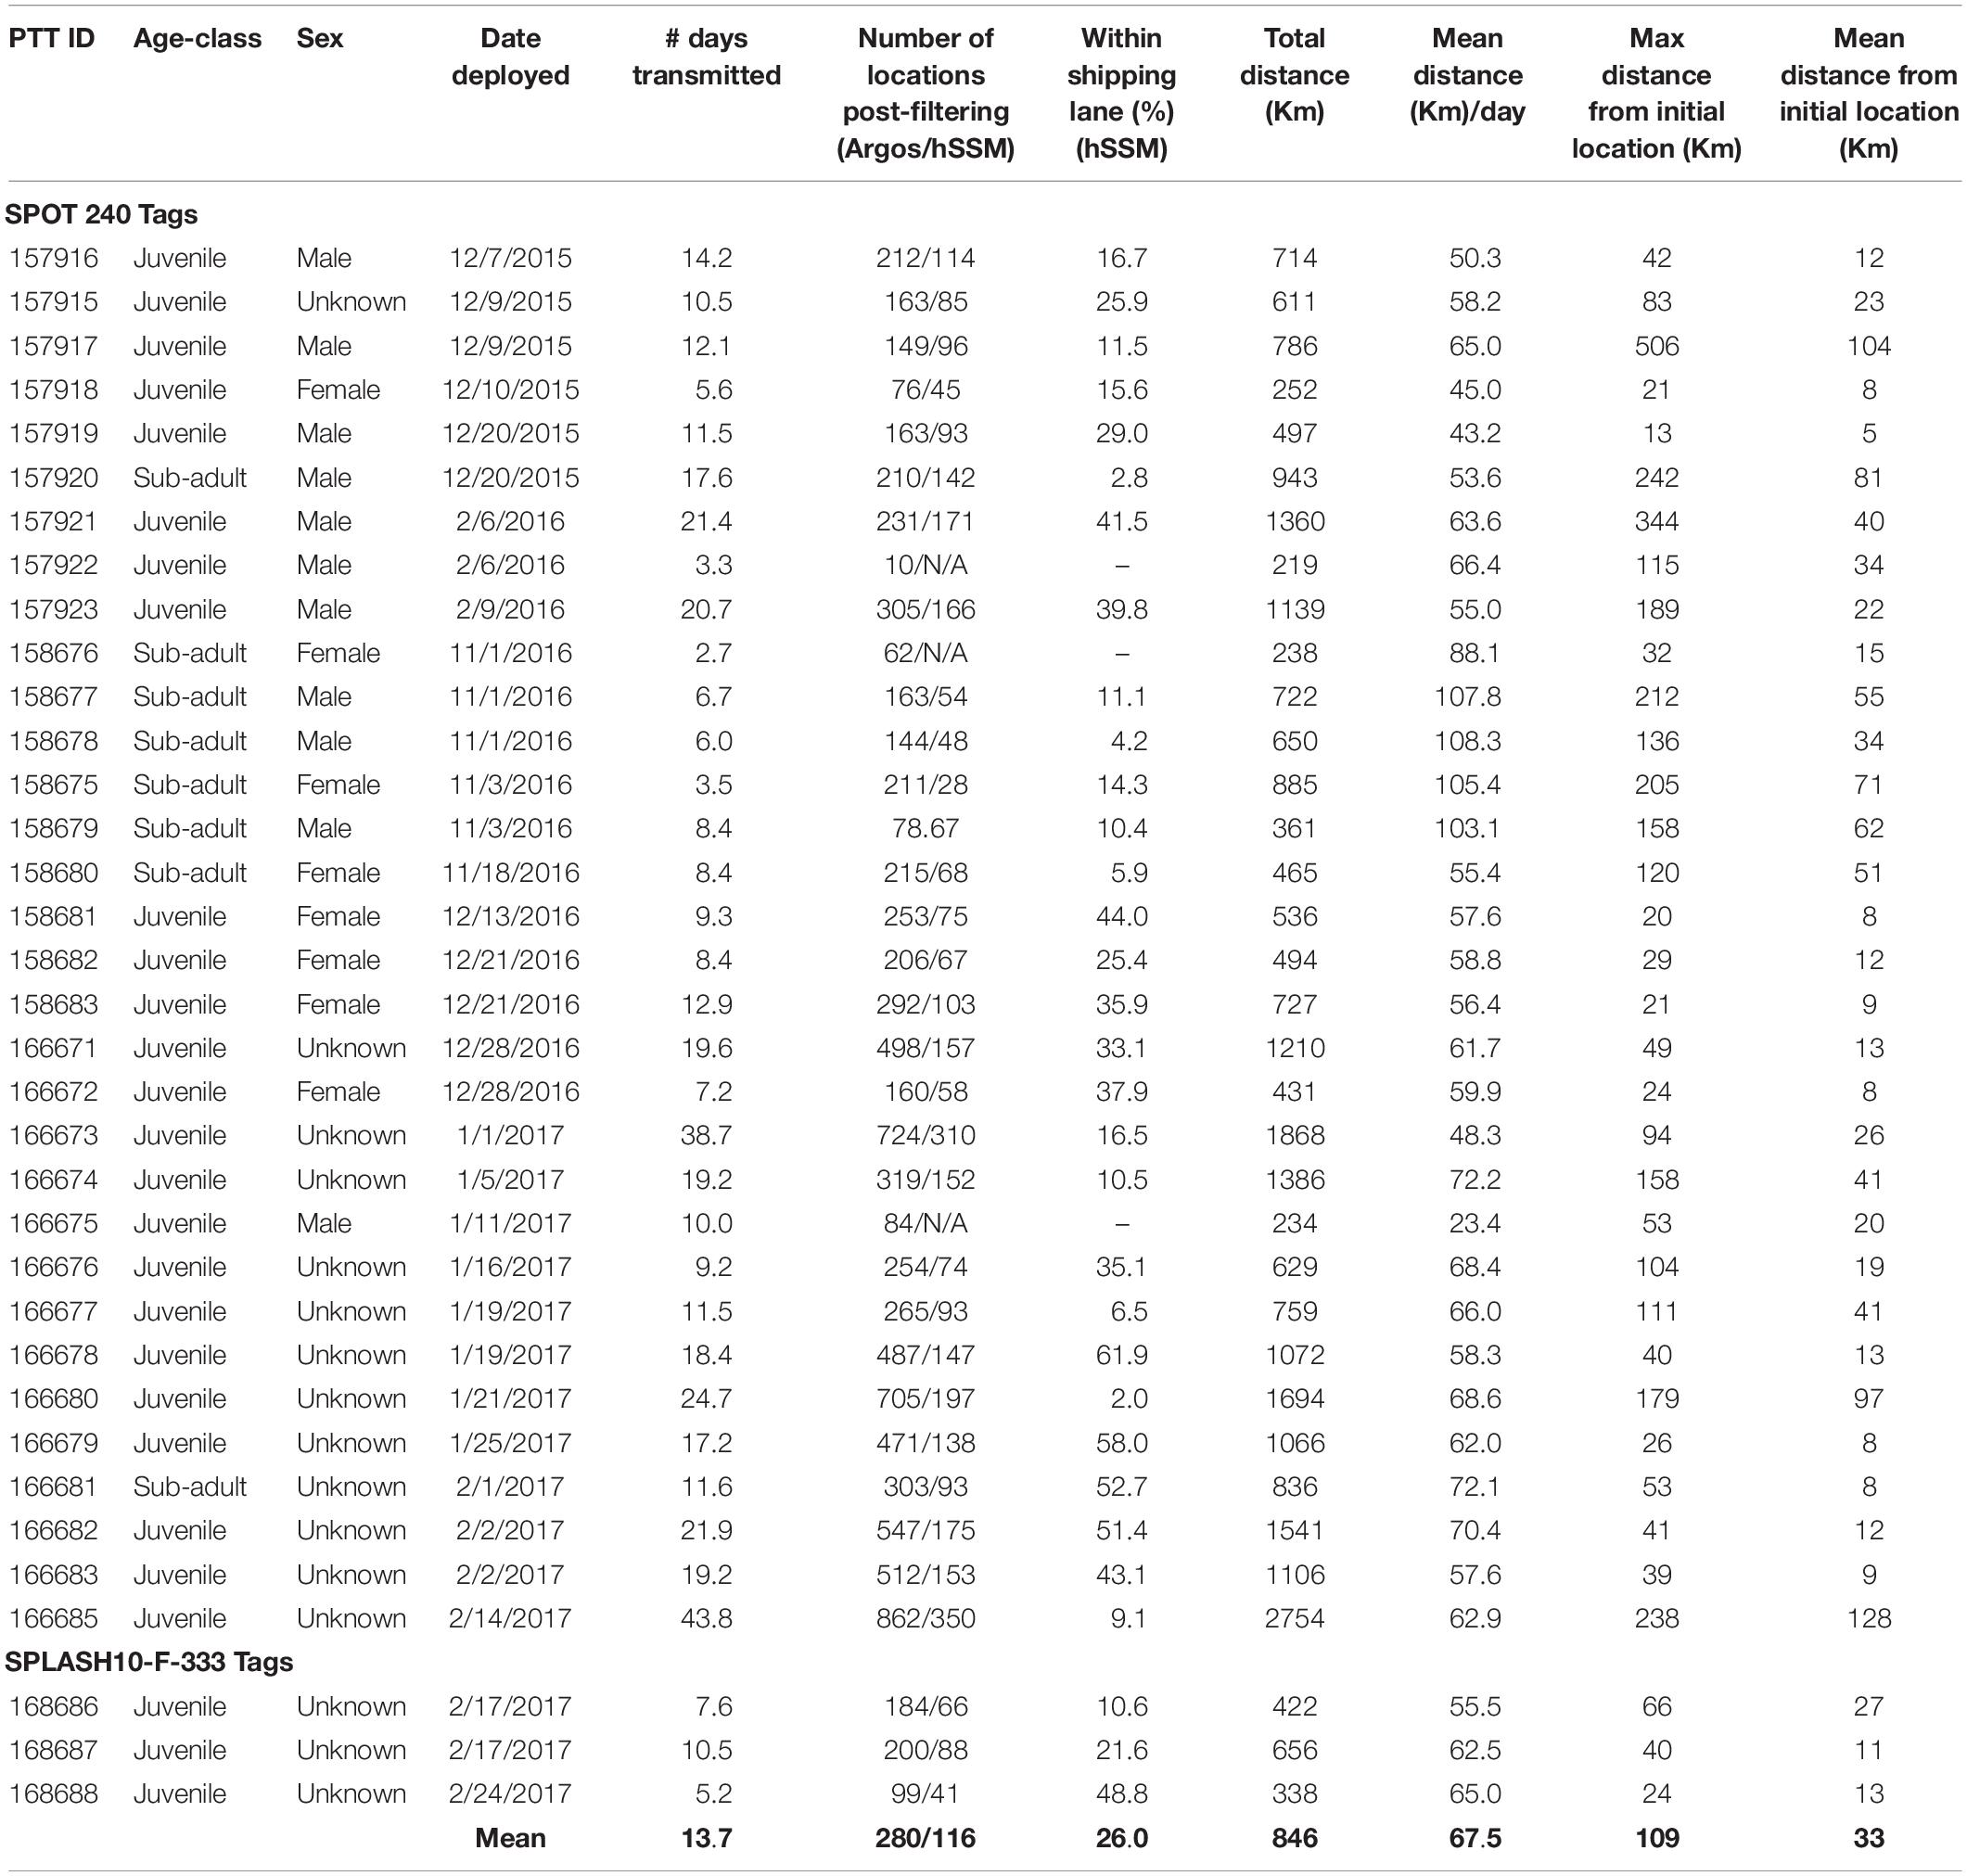
Table 2. Details of satellite tag deployments and results from GIS and hSSM analysis of 35 humpback whales from 2015 to 2017.
The number of Argos locations obtained post-filtering ranged from 10 to 862 (mean = 280) per tag (Table 2). Whales, in general, remained close to their tagging location (mean = 33 km), but individual movements varied within and between years (Table 2). One whale (157917) traveled a maximum distance of 506 km from the initial tagging location over a 12.1-day period, whereas another whale (158683), tagged 3.6 km away 1 year later traveled a maximum distance of only 21 km from the initial tagging location during approximately the same amount of time (12.9 days). The average distance traveled per day ranged from 23.4 km–108.3 km (mean = 65.0 km). Juvenile whales traveled, on average, shorter distances (58.6 km/day) than sub-adults (86.7 km/day) and their maximum and mean distance traveled from initial tagging location was less (98.9 km; 28.3 km) than those of sub-adults (144.8 km; 47.1 km) (Table 2).
All 35 tagged whales had filtered Argos locations within the shipping channels at the mouth of Chesapeake Bay. Approximately one quarter of all locations were within the shipping channels (Figure 4). Four individuals (166678, 166679, 166681, and 168688) had more than half of their Argos locations occur within the shipping channels over periods of 18.4, 17.2, 11.6, and 21.9 days, respectively. On average, juveniles had more locations occur in shipping lanes (29.3%) than sub-adults (14.5%). Number of locations within the shipping channels by males and females were similar (Table 2).
Fifteen of the 26 (57.7%) tagged animals from the 2016/2017 season had Argos locations inside the Chesapeake Bay [west of the Chesapeake Bay Bridge-Tunnel (CBBT), a 37-km man-made structure that spans the mouth of the Chesapeake Bay with portions above and below water] (Figure 1). This was an increase when compared to the 2015/2016 field season where only two of nine (22.2%) tagged whales had locations west of the CBBT. Of the two individuals with locations west of the CBBT in 2015/2016, only one, 157923, spent considerable time in that area– approximately 2.4 days over the course of the 20.7 day February deployment. During the 2016/2017 season, five individuals spent > 2 days west of the CBBT during the months of January and February; 166671 (2.1 days), 166687 (2.4 days), 166675 (2.9 days), 166679 (3.8 days), and 166686 (5.2 days). The last location from 166686 was 37 km N of the CBBT (the farthest location recorded inside the bay during this study, 50 km N of the CBBT was from the same individual).
Movements out of the primary study area included offshore travel to the north (New York), south (North Carolina), and east (offshore to 178 km), where whales spent time in both the shallow waters over the continental shelf as well as deeper waters (>3,100 m) east of the continental shelf break (Figure 5).
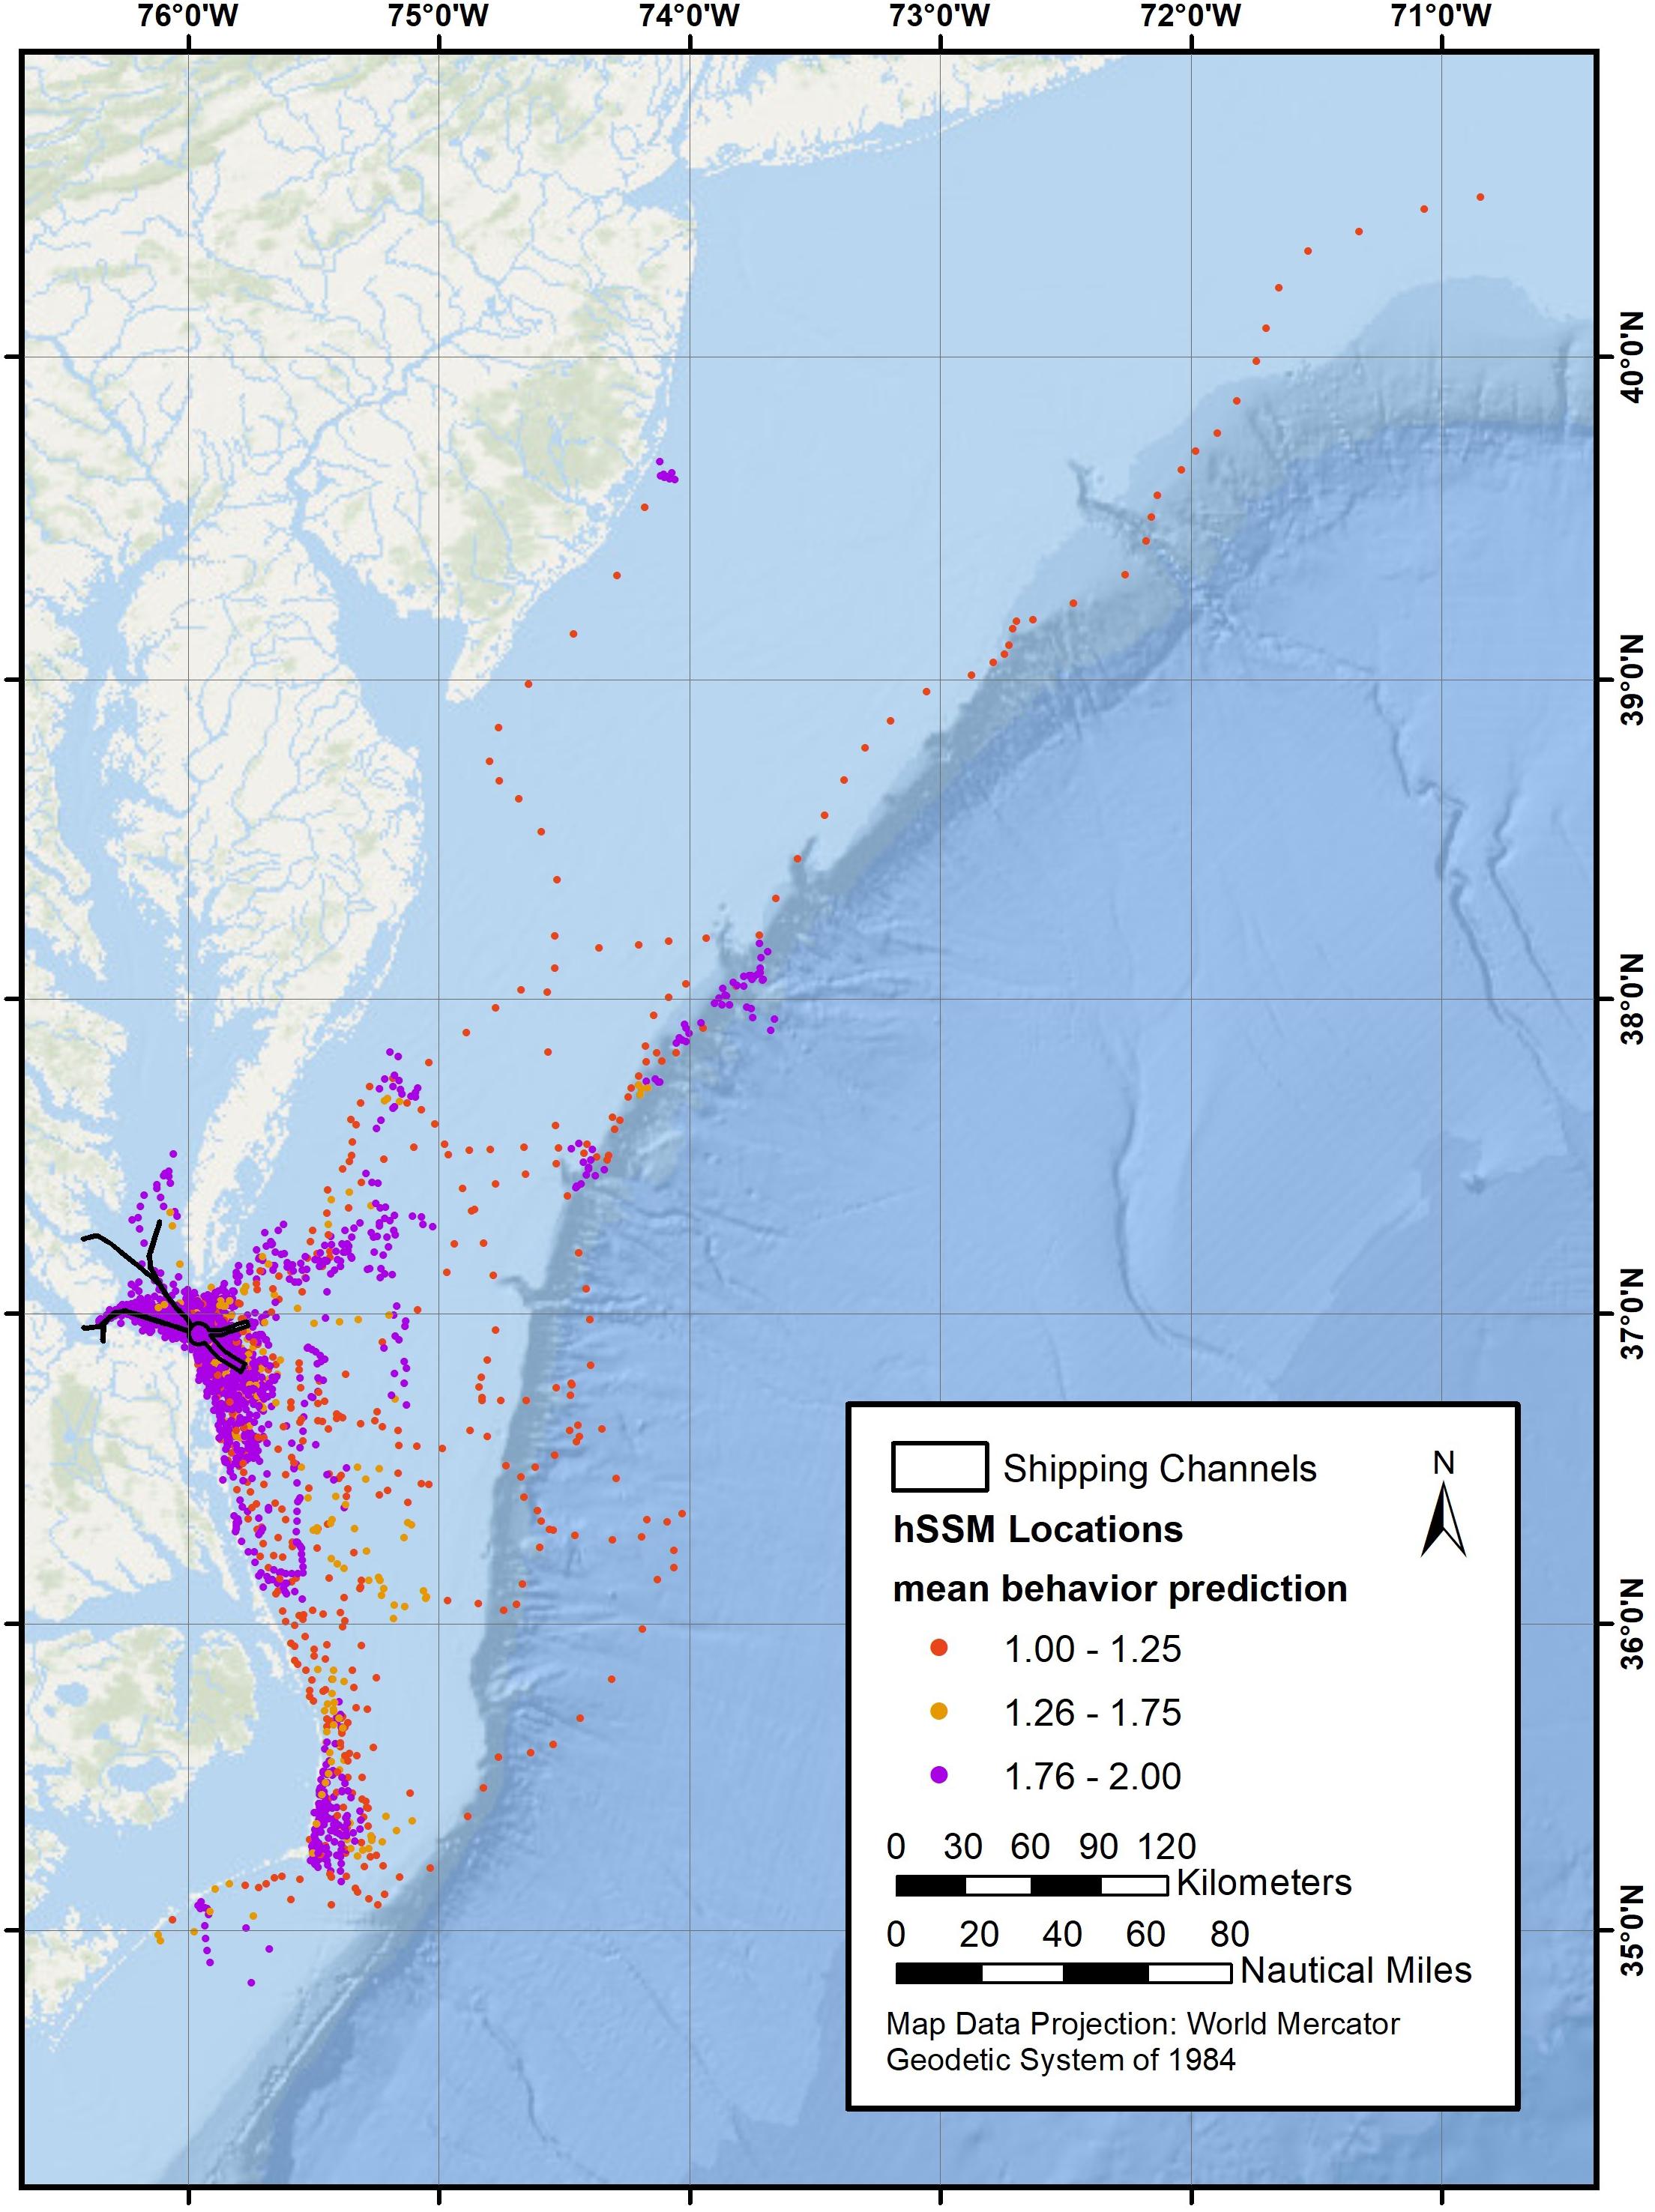
Figure 5. Mean predicted behavioral state from the hSSM for 33 tagged whales along the eastern seaboard from Cape Hatteras, North Carolina to Long Island, New York, showing travel (red dots), area-restricted search (purple dots), and indeterminate behavior (orange dots).
A total of 9,781 dives were recorded from the three SPLASH tags. Nearly all (96.4%) dives were to depths of 20 m or less, with the majority (87.2%) to 15 m or less (Figure 6). Only one dive was recorded in the 30–35 m range. Dive durations were short and the majority (88.6%) were less than 3 min (Figure 7).
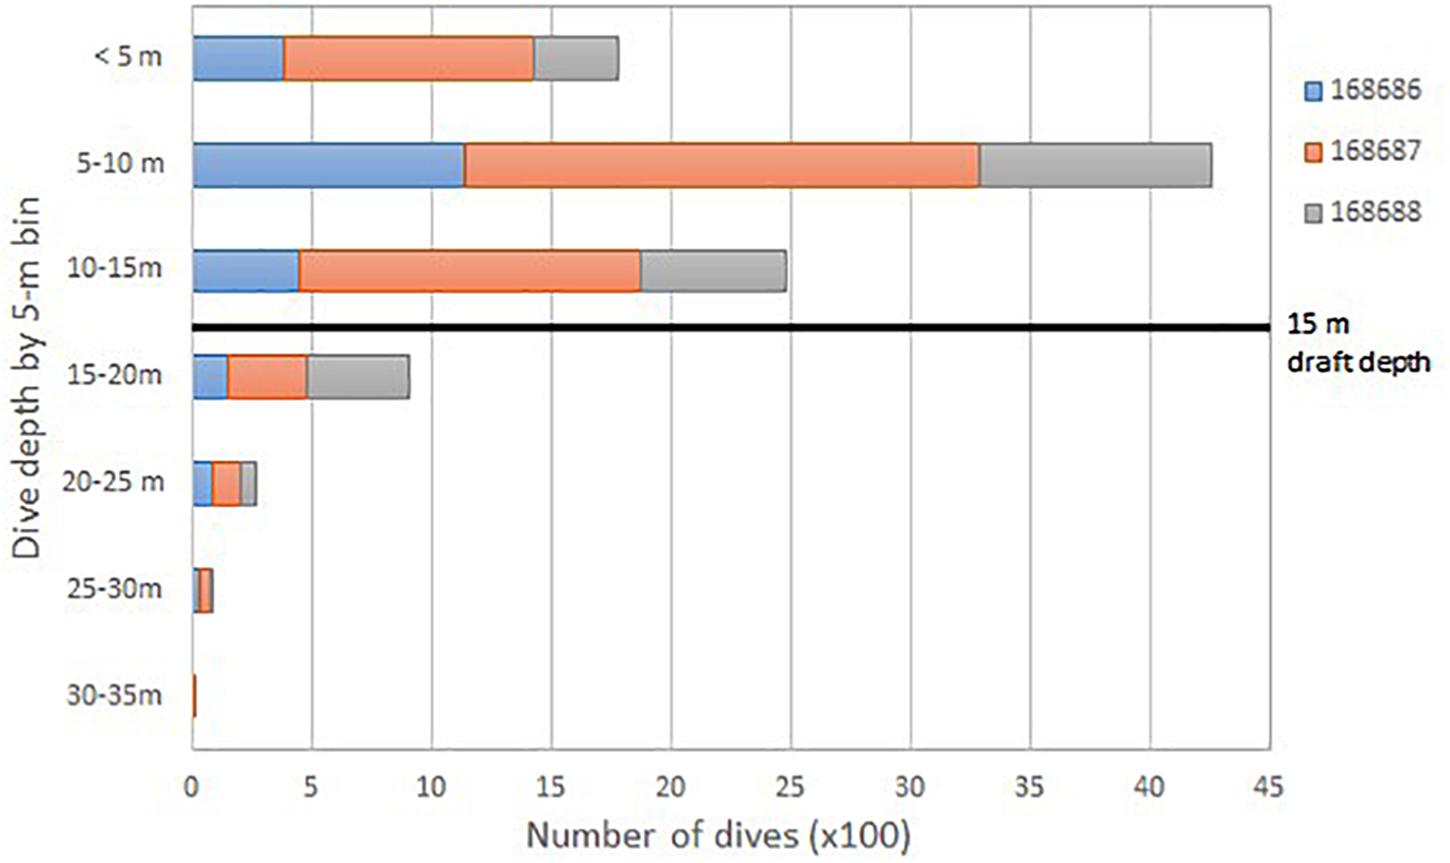
Figure 6. Total number of dives (100×) for three satellite-tagged humpback whales (identified by PTT ID) grouped by 5-m depth bins. Maximum large-ship draft is noted by the black line.
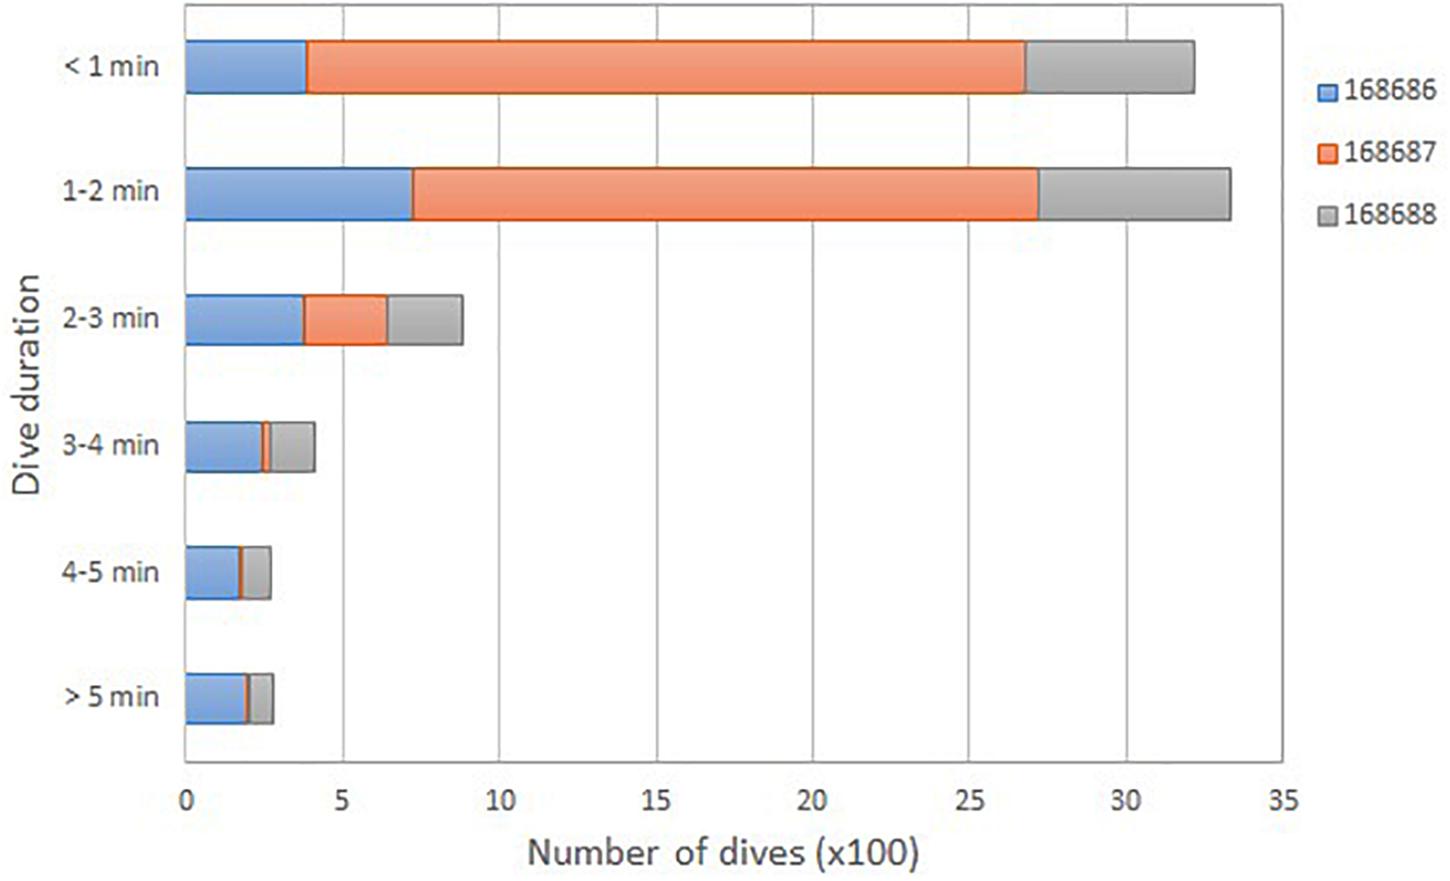
Figure 7. Total number of dives (100×) for three satellite-tagged humpback whales (identified by PTT ID) grouped into 1-min dive duration bins.
Re-sightings of humpback whales were noted both within- and between-seasons. Of the 106 cataloged individuals, 66 were seen on more than one occasion (excluding same-day re-sightings). Of those seen more than once, within-season re-sightings (from the 1st day observed to the last day observed) ranged from 1 to 94 days (mean = 29; median = 25). Eight individuals were re-sighted between the 2014/2015 and 2015/2016 seasons, and 20 individuals observed during the 2016/2017 season were seen in previous seasons. Using photographs obtained from the cataloging effort, obvious evidence of vessel interaction, such as propeller scarring, was apparent on at least nine of the 106 (8.5%) cataloged humpback whales.
State-Space Modeling Results
Two tags were omitted from the hSSM analyses completely (157922 and 158676) due to deployment durations of less than 4 days, a low number of reported locations, and no discernable behavior. On average 62 min passed between received locations, with the maximum gap being almost 1 day. As such, 1 h was the minimum time interval considered for an hSSM. However, the finest temporal scale model that converged successfully was a 3-h model. The selected model converged using 30,000 burn in samples and 15,000 samples. The 15,000 samples were thinned to retain 1,000 in total. A qualitative review of the tracks did not show excessive smoothing between Argos locations, with one exception. One tag, 166675, was also removed from the analysis after reviewing the results and the hierarchical model was rerun without it. This tag had a different duty cycle and few reported locations with long gaps between, which resulted in a modeled track that was artificially over-smoothed. Diagnostics for the updated model performed similarly to the one with the dropped tag. Overall the final model performed acceptably: all parameters converged, MCMCs were mixing, and autocorrelation between chains was low.
Visual inspection of hSMM results was also used to validate the outputs. Generally, the model predicted the behavior that would be expected from reviewing the Argos data qualitatively. Despite the study area being a complex estuarine system, location predictions did not cut across land significantly; as such, no locations were dropped from the model output. Indeterminate locations were most often found as animals were transitioning between traveling and ARS behaviors. Of 3,714 modeled locations, 458 (12.3%) were identified as traveling, 211 (5.7%) were indeterminate, and the remaining 3,045 (82.0%) were identified as ARS (Figure 5), which likely represented foraging based on numerous observations of feeding observed during field work. In addition to obvious feeding (i.e., lunges, which were observed during one third of all foraging observations), aggregations of prey, stunned fish at the surface, and diving Northern gannets (Morus bassanus) were other indications of likely foraging activity. The ARS locations were primarily centered around the mouth of the Chesapeake Bay, with 30.8% of ARS locations occurring within shipping channels. A smaller percentage (6.8%) occurred inside the Chesapeake Bay (west of the CBBT). Additional ARS locations also occurred outside of the primary study area, farther offshore and to the south. Modeled locations identified as travel were minimal in the primary study area, with only 1.2% occurring in shipping lanes, and less than 0.25% occurring inside the Chesapeake Bay.
Visual Observations of Presumed Vessel Interactions
On January 02, 2016 a humpback whale was observed and photographed within the shipping channels without any apparent injuries (Figure 8A). One week later, on January 09, 2016, the same individual was encountered, 6.3 km from its previous location, still within the shipping channels, but with a severe laceration across its back (Figure 8B). The deep wound, which appeared to have been caused by a large propeller, had sliced through the blubber layer and into the musculature of the whale. The injury was most likely life threatening, and this whale was not seen again.
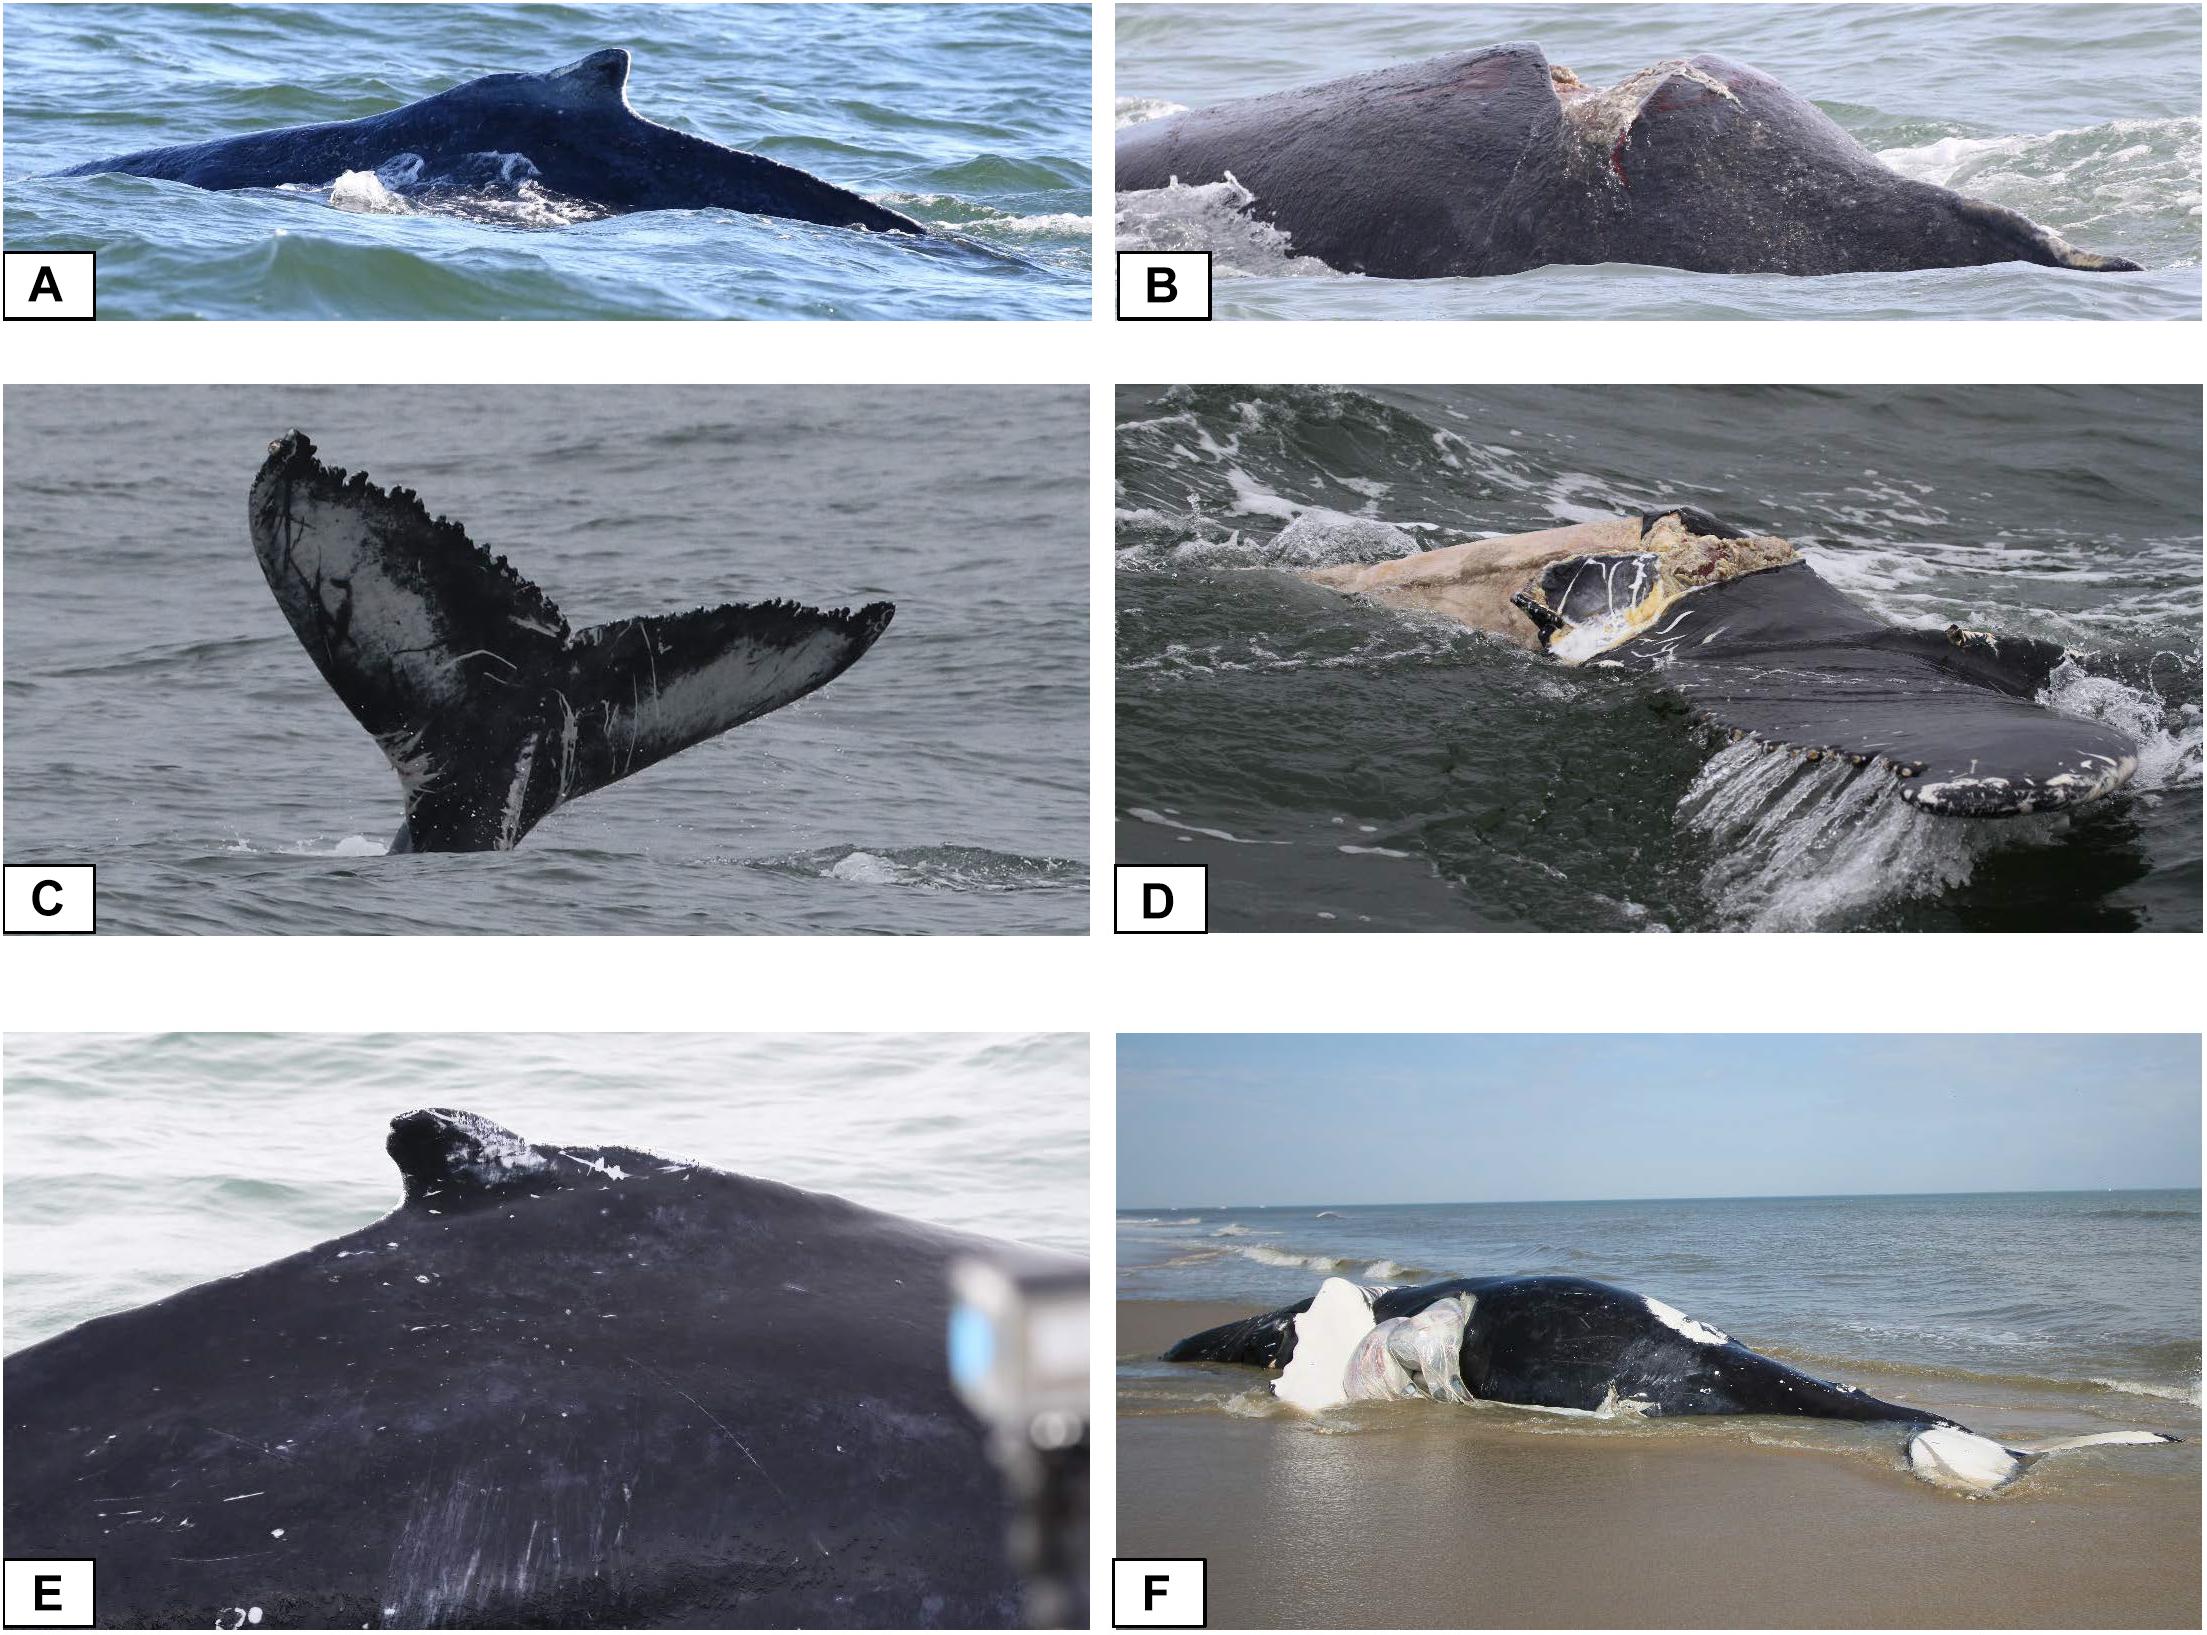
Figure 8. (A) Humpback whale observed January 02, 2016 with no apparent injuries, and (B) again on January 09, 2016 with severe laceration across its back; (C) humpback whale observed fluking on Decmber 30, 2015 without injury, and (D) again on March 03, 2016 with nearly severed tail fluke; (E) humpback whale photographed and tagged on January 11, 2017, and (F) dead on a Virginia Beach with large incisions and exposed organs on February 12, 2017.
A second humpback whale was first observed and tagged (157919) on December 20, 2015 (Figure 8C). During the 11.5-day deployment, this individual stayed within the primary study area and did not move farther than 13 km from the initial tag location (Table 2). On December 30, 2015, he was re-sighted and fluke photographs were obtained (Figure 8C). The individual was re-sighted four more times; on 15 January, 20 January, 6 February, and finally on March 03, 2016 when the tail flukes were photographed again, this time with severe left fluke lacerations and visible tissue that was clearly necrotic (Figure 8D). These injuries are consistent with a propeller strike. Elsewhere, humpback whales have been documented with portions or all of their tail flukes missing (e.g., Steiger et al., 2008), however, this individual was never re-sighted after the March 03, 2016 encounter, even when reviewing photo-ID effort beyond the timeframe of this project through 2019.
A third humpback whale was first observed and tagged (166675) on January 11, 2017 (Figure 8E) and during the 10-day deployment, spent time around the mouth of the Chesapeake Bay and up to 23 km west of the CBBT. This individual was re-sighted twice, on 21 and 25 of January 2017 east of the CBBT. On February 12, 2017 the whale washed ashore dead in Virginia Beach. A large incision across its back exposing internal organs suggested a propeller strike from a large ship (Figure 8F). Post-mortem examination supported this determination (National Marine Fisheries Service [NMFS], 2017).
Discussion
Results from satellite tagging and photo-ID during 3 years of effort show both within-season and between-season site fidelity in the study area for individual whales and a high level of occurrence within the shipping channels. Because Argos satellite locations have error associated with them, ranging from <250 m to >1,500 m (CLS, 2016), the hSSM locations were also examined to reduce bias and determine risks associated with humpback whale presence/absence within the high traffic shipping channels. Results from both were nearly identical, further supporting the high use of this particular habitat by humpback whales.
The hSSM analysis provided valuable insight regarding the behavior of all but the shortest (or sparsely reporting) tagged humpback whales in this study. Humpback whales showed variable movement patterns, though the most common was ARS centered around the mouth of Chesapeake Bay, highlighting that this is an important foraging area for this population. This is where most of the tags were deployed and it may also be that tags were shed before significant movement was undertaken. Other movement strategies observed when examining all tracks included looping down near the Outer Banks of North Carolina to presumably feed and then returning north, foraging further inside the bay, and long-distance directed movements northwards along the coast and the shelf break before engaging in ARS in other locations.
Because tag deployments were on the order of days to weeks, it is important to take into account the potential for tagging bias with these results. Whales may be more likely to occur in close proximity to where they were tagged, at least initially (e.g., Kennedy et al., 2013). In this study, whales with the shortest tag durations were omitted from the hSSM analyses to help reduce this bias. One shortfall of LIMPET tags is that they tend to have shorter retention times on large whales than tags designed to anchor in the muscle below the facia layer. For comparison, Kennedy et al. (2013) deployed 28 transdermal ‘consolidated’ tags (see Andrews et al., 2019) on humpback whales in the North Atlantic. The mean tag longevity was 26 days for these consolidated tags, almost twice the mean tag retention of 13.7 days in this study. However, prior to commencing this effort, the authors felt that the greater depth penetration by consolidated tags was not preferred for a variety of reasons, including the fact that the vast majority of whales in the area were known to be juveniles or sub-adults (Swingle et al., 1993; Barco et al., 2002). Because the goal of this study was to assess where humpback whales are spending their time while in the study area, rather than where they go once they leave the area, the shorter retention time of the LIMPET tags was not considered prohibitive in addressing the primary study objectives and bias due to shorter retention times is considered nominal.
Many humpback whale sightings, and subsequently tag locations, occurred within the deeper shipping channels suggesting these may be areas of preferred prey aggregations. A fishery for Atlantic menhaden (Brevoortia tyrannus) exists in and around the Chesapeake Bay (Smith and O’Bier, 2011). During this study approximately one third of humpback whale feeding observations were accompanied by lunging and the presence of small schooling fish species, including Atlantic menhaden. At times, these observations were in close proximity to the commercial fishing fleet, although this was not systematically recorded during the initial survey years. Whale defecations were regularly observed, further supporting that foraging is actively occurring in the region. An analysis of stable isotope signatures from biopsied skin samples collected from humpback whales near the mouth of the Chesapeake bay during this project by Waples (2017) found that the mean δ15N value for humpback whales were comparable to those collected from humpback whales in the Gulf of St. Lawrence, a well-known foraging habitat, during summer months (Gavrilchuk et al., 2014). In the Gulf of St. Lawrence humpback whales were believed to primarily be feeding on American sand lance (Ammodytes americanus), northern krill (Meganyctiphanes norvegica), capelin (Mallotus villosus) and Atlantic herring (Clupea harengus) (Gavrilchuk et al., 2014). Although not conclusive, the similarity in stable isotope values implies that whales in both locations are feeding at similar trophic levels and lends support that the humpback whales biopsied during this study are feeding during winter months.
Dive data from the three SPLASH10-F-333 tagged whales revealed that the majority of dives were to depths of 15 m or less. The current maximum draft for commercial and military vessels extends to 15 m. The spatial overlap of humpback whales in this study area with transiting ships, results in an increased likelihood for interactions (Figure 6). McKenna et al. (2015) noted blue whale behavior in commercial shipping lanes off southern California and found that whales showed no horizontal movements away from oncoming ships, rather they exhibited a shallow dive response in 55% of the recorded observations in close proximity to transiting commercial vessels. Even if humpback whales in the mouth of the Chesapeake Bay dive to avoid ships, there is minimal water depth between the vessel and the seafloor where a collision can be avoided.
During the winter months, when humpback whales are most likely present, large ships moving into and out of the Chesapeake Bay are required to reduce their speed to 10 knots in order to be compliant with the North Atlantic right whale SMA guidelines (NOAA, 2008). A review of historical records by Laist et al. (2001) concluded that lethal collisions of whales with ships sharply increased when ships were moving at speeds of 10–14 knots (18.5–25.9 km/h) and were rare at speeds below 10 knots. However, the speed restrictions within the SMA do not apply outside of those boundaries (Code of Federal Regulations 33 [Cfr] § 165.501, 2018), which, as this study has shown, are areas humpback whales are still actively foraging within (Figure 4). This may put whales at an increased risk for ship strike by faster-moving vessels transiting into or out of the Bay, outside the SMA. Laist et al. (2001) also found that whales are typically not seen prior to collision, or are seen too late to be avoided. In the coastal waters at the mouth of the Chesapeake Bay, with already poor visibility in turbid water, it is unlikely transiting ship crews would be able to see or avoid humpback whales. Silber et al. (2010) also found whales submerged at one to two times the depth of a ship’s draft were at an increased probability of coming into contact with the hull or propeller of a ship. In other regions where ship-strike risks are high, such as southern California (e.g., Berman-Kowalewski et al., 2010) and Sri Lanka (Priyadarshana et al., 2016), studies showed or suggest that re-routing ship traffic has the potential to reduce ship strikes. However, re-routing vessel traffic into the mouth of the Chesapeake Bay is not practical; thus leaving speed reductions of transiting vessels as the primary mechanism for reducing humpback whale strike in this region. Speed restrictions from the SMAs have proven to reduce deaths of both North Atlantic right whales and humpback whales (Laist et al., 2014). Based on the results of this study, if the mid-Atlantic SMA was extended further into the Chesapeake Bay, it may reduce ship strikes in this region.
Approximately half of the humpback whales examined to date as part of the UME had evidence of human interaction, either due to ship strike or entanglement (NOAA, 2019). Prior to the UME, the Gulf of Maine humpback whale injury rate was calculated to be 9/year (Henry et al., 2015). The actual number of vessel-related injuries on large whales is most likely under-reported due to a proportion of dead individuals that do not wash ashore, animals that are too decomposed or otherwise inaccessible for assessment, and interactions that go unreported (Laist et al., 2001; Henry et al., 2015). One complication with stranding data is that it is often impossible to determine the location where the interaction occurred, especially for animals that undertake long-distance movements or migrations. Within-season re-sightings of humpback whales occurred, on average, over the course of 29 days during this study, often allowing for multiple opportunities to re-sight, and “monitor” the same individual throughout the season. We documented three instances of injuries and a fatality observed from whales that had been previously seen unharmed. This level of monitoring has the potential to significantly augment data gaps that can occur when strandings are the only source of information on mortalities and injuries.
In total, nine of the 106 (8.5%) humpback whales in our humpback whale catalog have scars or injuries indicative of propeller or vessel strikes. While it is impossible to conclude if these injuries occurred outside of the study area, the evidence from this study highlights different instances where humpback whales were observed in the study area without injuries and re-sighted within the same season with vessel-related injuries. Such examples support the notion that those injuries likely occurred in the primary study area near the mouth of the Chesapeake Bay and suggests that animals are at an increased risk of deleterious interactions with localized shipping traffic.
More than three-quarters of the humpback whales identified and satellite tagged during the first 3 years of this study were estimated to be juveniles. The large percentage of juveniles observed matches both historic stranding data (e.g., Wiley et al., 1995) and observational data (e.g., Swingle et al., 1993; Barco et al., 2002) for this area. In this study, juvenile humpback whales spent more time (i.e., had more tag locations) in shipping channels and stayed closer to their initial tag location when compared to sub-adults. Laist et al. (2001) noted that eight of ten humpback whales struck by ships were juveniles, estimated to be 3 years of age or less, suggesting this is a particularly vulnerable age class for this species. It is possible that these younger animals, with less experience, have not yet learned to avoid ships, whereas older, presumably more experienced animals, have better acquired that ability. Based on the gender analysis to-date, humpback whales were approximately equal ratios of male and female (Waples, 2017) suggesting both sexes are equally vulnerable to potential vessel interactions.
Interactions with vessels, both large and small, are a significant cause for concern for humpback as well as other baleen whale species encountered in the study area. Although the satellite tagging effort focused on humpback whales, other baleen whale species, including minke whales and ESA-listed fin whales, were also documented in the study area. ESA-listed North Atlantic right whales are also known to occur near the mouth of the Chesapeake Bay (Mallette et al., 2017; Hayes et al., 2018) and although the SMA’s are in place for this region, the results of this study underscores the need to consider additional protections for other baleen whale species utilizing these waters each winter.
While much of the tagging data corroborates sighting location ‘hot spots’ in and around the shipping channels, the amount of time some tagged individuals spent west of the CBBT was somewhat unexpected. This is an area where live observations of humpback whales have not previously been reported in the literature, and only occasional sightings have been anecdotally reported by local fisherman or tour operators. The extensive network of bridge pilings appear to create a physical barrier with regards to passage by whales to waters west of the CBBT. Observations of whales passing through the unobstructed non-pile shipping channel openings directly over the CBBT tunnels are not unexpected given their preference to remain in the deeper channels to forage. Although less field effort was conducted in waters west of the CBBT, it should be considered an area of interest in future years given the high traffic rate of large vessels, reduced speed restrictions, and extent of marine-based military training exercises occurring in this part of the Bay. Increased presence of humpback whales west of the CBBT may be attributed to a combination of possible factors, including, but not limited to: a short-term distributional shift related to overall oceanographic conditions causing prey to become more concentrated farther into the Bay than in previous years, better documentation of whale presence through increased field effort or an increased number of deployed satellite tags, or simply an overall increase in the number of humpback whales in the study area.
Conclusion
The number of sightings of humpback whales and other baleen whales (including ESA-listed fin whales), as well as the level of interaction between whales and vessel traffic to-date, support the need for further documenting habitat use and movement patterns in this region. Satellite-tag data have signified that the mouth of the Chesapeake Bay is an important habitat for humpback whales during winter months. The hSSM results suggest that many of the modeled locations centered at the mouth of the Bay represent foraging behavior for these whales, which is further supported from visual observations and stable isotope analyses. This segment of the population clearly engages in diverse feeding and movement strategies, which also needs to be taken into account when mitigating anthropogenic impacts and determining effective management actions. At the time of deployments, the SPLASH10-F-333 tags used in this study were programed to collect only binned depth data. Research is ongoing, and future tagging effort will incorporate behavioral dive profiles to give a more detailed picture of how humpback whales spend time beneath the shallow waters of the Chesapeake Bay. A small unmanned aerial system has also been added to the study with the goal of obtaining more precise length estimates and therefore improving and validating age class estimations. Future hSSM analyses will focus on temporal patterns of use, increasing sample size with more tag deployments, simulating longer tracks, and exploring individual space use further. Additional United States Navy-funded collaborative efforts will also involve deploying digital acoustic recording tags to collect information on received levels of ship noise, as well as determining behavioral states and assess possible avoidance responses. All of this information will provide a better understanding of the occurrence and behavior of humpback whales within these heavily transited waters.
The waters around the mouth of the Chesapeake Bay are a busy area for transiting commercial and military ships, as well as recreational boats. Seasonal speed restrictions established as part of the North Atlantic right whale SMA limit the speed of large vessels only at the mouth of the Bay, but speed restrictions are not in place in other areas that humpback whales actively utilize nor do they pertain to vessels <19.8 m. Extending the SMA farther into the Bay and farther offshore has the potential to improve protection for humpback whales, as well as other baleen whale species utilizing this habitat.
Data Availability Statement
Data generated by this study are represented or included as summarized data in the article/supplementary material. Sighting data is available through OBIS SEAMAP and tag location data are available for viewing through both Movebank and the Animal Telemetry Network.
Ethics Statement
All tagging and survey methods were conducted under a scientific research permit #16239 issued to Dan Engelhaupt by the National Marine Fisheries Service under the Marine Mammal Protection Act. Prior to tagging, procedures were reviewed and approved by an Institutional Animal Care and Use Committee as part of the Animal Welfare Act.
Author Contributions
JA, DE, and AE: field work, analysis, and writing. AD: analysis and writing. TP, MR, and JB: field work and writing.
Funding
This project was funded by the United States Fleet Forces Command and managed by the Naval Facilities Engineering Command Atlantic as part of the United States Navy’s Marine Species Monitoring Program.
Conflict of Interest
JA, DE, and MR were employed by HDR Inc. AE was self-employed via Amy Engelhaupt Consulting. AD was self-employed via CheloniData. TP was self-employed. JB was employed by NAVFAC.
Acknowledgments
We thank personnel from Naval Facilities Engineering Command for their assistance in the field, including Jackie Bort Thornton, Danielle Jones, Cara Hotchkin, Brittany Bartlett, and Jamie Gormley. Will Cioffi of Duke University performed the humpback whale gender analysis. We thank Alexis Rabon and Sarah Mallette from the Virginia Aquarium along with the captains and crew of the Atlantic Explorer, as well as Kristin Rayfield and the captains and crew of Rudee Flipper Tours for coordination of real-time humpback whale sightings. Grant Miller-Francisco assisted with GIS. Ladd Irvine, Aldo Pacheco, and Bob Kenney provided valuable reviews of this manuscript. We thank the Wildlife Computers team for product support and assistance. All research activities were conducted under National Marine Fisheries Service Scientific Permit 16239 held by DE, with the exception of tagging effort in December 2015 which was conducted under Scientific Permit 14450 held by Keith Mullin of Southeast Fisheries Science Center.
Footnotes
- ^ www.nauticalcharts.noaa.gov
- ^ www.dan-inject.com
- ^ www.my.wildlifecomputers.com
- ^ www.movebank.org
- ^ www.acdsee.com
References
Andrews, R. D., Baird, R. W., Calambokidis, J., Goertz, C., Gulland, F. M. D., Heide-Jørgensen, M. P., et al. (2019). Best practice guidelines for cetacean tagging. J. Cetacean Res. Manage 20, 27–66.
Andrews, R. D., Pitman, R. L., and Ballance, L. T. (2008). Satellite tracking reveals distinct movement patterns for Type B and Type C killer whales in the southern Ross Sea. Antarctica. Polar Biol. 31, 1461–1468. doi: 10.1007/s00300-008-0487-z
Barco, S. G., McLellan, W. A., Allen, J. M., Asmutis-Silvia, R. A., Mallon-Day, R., Meagher, E. M., et al. (2002). Population identity of humpback whales (Megaptera novaeangliae) in the waters of the US mid-Atlantic states. J. Cetacean Res. Manage. 4, 135–141.
Berman-Kowalewski, M., Gulland, F. M. D., Wilkin, S., Calambokidis, J., Mate, B., Cordaro, J., et al. (2010). Association between blue whale (Balaenoptera musculus) mortality and ship strikes along the California coast. Aq. Mamm. 36, 59–66. doi: 10.1578/am.36.1.2010.59
Bettridge, S., Baker, C. S., Barlow, J., Clapham, P. J., Ford, M., Gouveia, D., et al. (2015). “Status review of the humpback whale (Megaptera novaeangliae) under the endangered species act,” in NOAA Technical Memorandum NMFS-SWFSC-540 (La Jolla, CA: National Marine Fisheries Service), 263.
Christensen, I., Haug, T., and Øien, N. (1992). Seasonal distribution, exploitation and present abundance of stocks of large baleen whales (Mysticeti) and sperm whales (Physeter macrocephalus) in Norwegian and adjacent waters. ICES J. Mar. Sci. 49, 341–355. doi: 10.1093/icesjms/49.3.341
CLS (2016). Argos user’s manual, Vol. 62. Avaliablr at: http://www.argos-system.org/manual/ (accessed 15 June, 2016).
Code of Federal Regulations 33 [Cfr] § 165.501 (2018). Chesapeake Bay Entrance and Hampton Roads, VA and Adjacent Waters – Regulated Navigation Area. Avaliable at: https://www.govinfo.gov/content/pkg/CFR-2018-title33-vol2/xml/CFR-2018-title33-vol2-sec165-501.xml (accessed 23 May 2019).
Cooke, J. G. (2018). Megaptera Novaeangliae. The IUCN Red List of Threatened Species 2018: e.T13006A50362794. Avaliable at: doi: 10.2305/IUCN.UK.2018-2.RLTS.T13006A50362794.en (accessed 22 October, 2019).
Federal Register (2016). Endangered and threatened species; identification of 14 distinct population segments of humpback whale (Megaptera novaeangliae) and revision of species-wide listing. 8 September. J. U. S. Gov. 81, 62260–62320.
Gavrilchuk, K., Lesage, V., Ramp, C., Sears, R., Berube, M., Bearhop, S., et al. (2014). Trophic niche partitioning among sympatric baleen whale species following the collapse of groundfish stocks in the Northwest Atlantic. Mar. Ecol. Prog. Ser. 407, 285–301. doi: 10.3354/meps10578
Hayes, S. A., Josephson, E., Maze-Foley, K., Rosel, P. E., Byrd, B., Chavez-Rosales, S., et al. (2018). TM 245 us atlantic and gulf of mexico marine mammal stock assessments - 2017. NOAA Tech Memo NMFS NE 245:371.
Henry, A. G., Cole, T. V. N., Hall, L., Ledwell, W., Morin, D., and Reid, A. (2015). Mortality and Serious Injury Determinations for Baleen Whale Stocks Along the Gulf of Mexico, United States east coast and Atlantic Canadian provinces, 2009-2013. Washington, DC: United States Department of Commerce.
Hill, A. N., Kanriski, C., Robbins, J., Pitchford, T., Todd, S., and Asmutis-Silvia, R. (2017). Vessel collision injuries on live humpback whales, Megaptera novaeangliae, in the southern Gulf of Maine. Mar. Mamm. Sci. 33, 558–573. doi: 10.1111/mms.12386
Jensen, A. S., and Silber, G. K. (2004). Large Whale Ship Strike Database. Silver Spring, MA: NOAA Tech Memo.
Jonsen, I., Myers, R., and James, M. (2007). Identifying leatherback turtle foraging behaviour from satellite telemetry using a switching state-space model. Mar. Ecol. Prog. Ser. 337, 255–264. doi: 10.3354/meps337255
Jonsen, I. D. (2016). Joint estimation over multiple individuals improves behavioural state inference from animal movement data. Sci. Rep. 6:20625. doi: 10.1038/srep20625
Jonsen, I. D., Mills Flemming, J., and Myers, R. A. (2005). Robust state-space modeling of animal movement data. Ecology 86, 2874–2880. doi: 10.1890/04-1852
Katona, S., Baxter, B., Brazier, O., Kraus, S., Perkins, J., and Whitehead, H. (1979). “Identification of humpback whales by fluke photographs,” in Behavior of Marine Animals. Vol. 3. Cetaceans, eds H. E. Winn and B. L. Olla (New York, NY: Plenum Press), 33–44. doi: 10.1007/978-1-4684-2985-5_2
Katona, S. K., and Beard, J. A. (1990). Population size, migrations, and feeding aggregations of the humpback whale (Megaptera novaeangliae) in the western North Atlantic Ocean. Rep. Int. Whal. Comm., Spec. Iss. 12, 295–306.
Kennedy, A. S., Zerbini, A. N., Vasquez, O. V., Gandilhon, N., Clapham, P. J., and Adam, O. (2013). Local and migratory movements of humpback whales (Megaptera novaeangliae) satellite-tracked in the North Atlantic Ocean. Can. J. Zool. 92, 9–18. doi: 10.1139/cjz-2013-0161
Laist, D. W., Knowlton, A. R., Mead, J. G., Collet, A. S., and Podesta, M. (2001). Collisions between ships and whales. Mar. Mamm. Sci. 17, 35–75. doi: 10.1111/j.1748-7692.2001.tb00980.x
Laist, D. W., Knowlton, A. R., and Pendleton, D. (2014). Effectiveness of mandatory vessel speed limits for protecting North Atlantic right whales. Endang. Spec. Res. 23, 133–147. doi: 10.3354/esr00586
Mallette, S. D., McAlarney, R. J., Lockhart, G. G., Cummings, E. W., Pabst, D. A., McLellan, W. A., et al. (2017). “Aerial Survey Baseline Monitoring In The Continental Shelf Region Of the VACAPES OPAREA: 2016 annual progress report,” in Prepared for U.S. Fleet Forces Command. Submitted to Naval Facilities Engineering Command Atlantic (Virginia: HDR, Inc.).
McKenna, M. F., Calambokdis, J., Oleson, E. M., Laist, D. W., and Goldbogen, J. A. (2015). Simultaneous tracking of blue whales and large ships demonstrates limited behavioral responses for avoiding collision. Endang. Spec. Res. 27, 219–232. doi: 10.3354/esr00666
National Marine Fisheries Service [NMFS] (2017). Marine Mammal Health and Stranding Response Database. Avaliable at: http://www.nmfs.noaa.gov/pr/health/db_public.html (accessed 15 April 2018).
NOAA (2008). Final rule to implement speed restrictions to reduce the threat of ship collisions with North Atlantic right whales. Fed. Reg. 73, 60173–60191.
NOAA (2019). NOAA. https://www.fisheries.noaa.gov/national/marine-life-distress/2016-2019-humpback-whale-unusual-mortality-event-along-atlantic-coast (accessed 10 May 2019).
Noad, M. J., and Cato, D. H. (2007). Swimming speeds of singing and non-signing humpback whales during migration. Mar. Mamm. Sci. 23, 481–495. doi: 10.1111/j.1748-7692.2007.02414.x
Palsbøll, P. J., Allen, J., Bérubé, M., Clapham, P., Feddersen, T., Hammond, P., et al. (1997). Genetic tagging of humpback whales. Nature 388, 767–769.
Priyadarshana, T., Randage, S. M., Alling, A., Calderan, S., Gordon, J., Leaper, R., et al. (2016). Distribution patterns of blue whale (Balaenoptera musculus) and shipping off southern Sri Lanka. Reg. Stud. Mar. Sci. 3, 181–188. doi: 10.1016/j.rsma.2015.08.002
Schorr, G., Falcone, E., and Calambokidis, J. (2013). “Summary of Tag Deployments on Cetaceans off Washington, May 2010 to May 2013,” in Prepared for Commander, U.S. Pacific Fleet, Pearl Harbor, Hawaii. Submitted to Naval Facilities Engineering Command Pacific (NAVFAC PAC) (Pearl Harbor)
Silber, G. K., Slutsky, J., and Bettridge, S. (2010). Hydrodynamics of a ship/whale collision. J. Exp. Mar. Bio. Ecol. 391, 10–19. doi: 10.1016/j.jembe.2010.05.013
Smith, J. W., and O’Bier, W. B. (2011). The bait purse-seine fishery for atlantic menhaden, brevoortia tyrannus, in the virginia portion of chesapeake bay. 2011. Mar. Fish. Rev 73, 1–12.
Steiger, G. H., Calambokidis, J., Straley, J. M., Herman, L. M., Cerchio, S., Salden, D. R., et al. (2008). Geographic variation in killer whale attacks on humpback whales in the North Pacific: implications for predation pressure. Mar. Ecol. Prog. Ser. 4, 247–256. doi: 10.3354/esr00078
Stevick, P. T., Allen, J., Clapham, P. J., Friday, N., Katona, S. K., Larsen, F., et al. (2003). North Atlantic humpback whale abundance and rate of increase four decades after protection from whaling. Mar. Ecol. Prog. Ser. 258, 263–273. doi: 10.3354/meps258263
Swingle, W. M., Barco, S. G., and Pitchford, T. D. (1993). Appearance of juvenile humpback whales feeding in the nearshore waters of Virginia. Mar. Mamm. Sci. 9, 309–315. doi: 10.1111/j.1748-7692.1993.tb00458.x
U. S. Army Corps of Engineers (2017). Principal ports of the United States. Avaliable at: https://usace.contentdm.oclc.org/digital/collection/p16021coll2/id/1415/rec/1 (accessed 13 May 2019).
Waples, D. (2017). Stable isotope analysis of humpback and fin whales off Virginia Beach. Virginia. Mid-Atlantic Humpback Whale Monitoring, Virginia Beach, Virginia: 2016/17 Annual Progress Report. Final Report. Prepared for U.S. Fleet Forces Command. Submitted to Naval Facilities Engineering Command Atlantic, Norfolk, Appendix A in Aschettino, J. M., Engelhaupt, D., Engelhaupt, A., and Richlen, M. 2017.
Wells, R. S., and Scott, M. D. (1990). Estimating bottlenose dolphin population patterns from individual identification and capture-recapture techniques. Rep. Int. Whal. Comm., Spec. Iss. 12, 407–415.
Wiley, D. N., Asmutis, R. A., Pitchford, T. D., and Gannon, D. P. (1995). Stranding and mortality of humpback whales, Megaptera novaeangliae, in the mid-Atlantic and southeast United States, 1985–1992. Fish. Bull. 93, 196–205.
Keywords: humpback whale, satellite telemetry, tagging, state-space modeling, ship strike, Megaptera novaeangliae, Chesapeake Bay
Citation: Aschettino JM, Engelhaupt DT, Engelhaupt AG, DiMatteo A, Pusser T, Richlen MF and Bell JT (2020) Satellite Telemetry Reveals Spatial Overlap Between Vessel High-Traffic Areas and Humpback Whales (Megaptera novaeangliae) Near the Mouth of the Chesapeake Bay. Front. Mar. Sci. 7:121. doi: 10.3389/fmars.2020.00121
Received: 24 May 2019; Accepted: 14 February 2020;
Published: 12 March 2020.
Edited by:
David Peel, Commonwealth Scientific and Industrial Research Organisation (CSIRO), AustraliaReviewed by:
Aldo S. Pacheco, National University of San Marcos, PeruLadd M. Irvine, Oregon State University, United States
Copyright © 2020 Aschettino, Engelhaupt, Engelhaupt, DiMatteo, Pusser, Richlen and Bell. This is an open-access article distributed under the terms of the Creative Commons Attribution License (CC BY). The use, distribution or reproduction in other forums is permitted, provided the original author(s) and the copyright owner(s) are credited and that the original publication in this journal is cited, in accordance with accepted academic practice. No use, distribution or reproduction is permitted which does not comply with these terms.
*Correspondence: Jessica M. Aschettino, jessica.aschettino@hdrinc.com