Trophic Niche and Diversity of a Pelagic Squid (Dosidicus gigas): A Comparative Study Using Stable Isotope, Fatty Acid, and Feeding Apparatuses Morphology
 Yi Gong
 Yunkai Li
 Xinjun Chen2,3,4,5
  Wei Yu
- 1School of Ocean and Earth Science, Tongji University, Shanghai, China
- 2College of Marine Sciences, Shanghai Ocean University, Shanghai, China
- 3Key Laboratory of Sustainable Exploitation of Oceanic Fisheries Resources, Ministry of Education, Shanghai, China
- 4National Engineering Research Centre for Oceanic Fisheries, Shanghai Ocean University, Shanghai, China
- 5Key Laboratory of Oceanic Fisheries Exploration, Ministry of Agriculture and Rural Affairs, Shanghai, China
Commercially important pelagic squid such as jumbo squid Dosidicus gigas play a key role in energy and nutrient transfer in marine ecosystem. Geographic variations in the foraging strategy of D. gigas can provide valuable information on cephalopod trophic diversification and adaption to natural and anthropogenic impacts. Here, we used a novel combination of stable isotope (SI) and fatty acid (FA) analyses of muscle tissues and morphometric measurements of feeding apparatuses to evaluate spatial patterns of habitat and resource use of D. gigas collected from three main fishing grounds in the tropical and southern temperate Pacific Ocean. Results showed that the δ13C and δ15N values were different among geographic stocks within D. gigas, possibly because of site-specific dietary sources and isotopic baseline values. Spatial variabilities in FA profiles/biomarkers, combined with SI results, suggests two foraging patterns: utilization of resources mainly from oceanic food webs or from both neritic and oceanic food webs. This behavior likely promotes the site-specific trophic niche width, increases adaptation to inhabiting oceanographic conditions, and could be driven by differences in feeding apparatuses morphology, body size, and trophic position. These results emphasize the dietary flexibility of D. gigas and their important ecological roles in ecosystems as cross-biome trophic linkages. Trophic diversification of pelagic squid like D. gigas may have important implications for their population dynamics, ecological associations, and subsequent management.
Introduction
Assessment of trophic dynamics is a prerequisite for ecosystem-based fisheries management and provides a means for evaluating natural and anthropogenic impacts on target species. Since 1950, capture production of cephalopods have continued to grow (Hunsicker et al., 2010; Doubleday et al., 2016), with total commercial annual catches varying between 3.5 and 4.9 million tonnes in 2008–2017 (FAO, 2019), which was almost 4.6 times higher than that of the 1950s. As main target species, cephalopods on average support approximately 15 and 20% of marine fishery landings and landed values, respectively (Hunsicker et al., 2010; FAO, 2019). Cephalopods, except for nautiluses, have unique life history characteristics, including rapid growth, short lifespan, and semelparous reproductive strategy, giving them both sensitivity and resilience to anthropogenic exploitation and oceanographic variability (Rodhouse et al., 2014). The species within the family Ommastrephidae support approximately 33.8% of the global cephalopods landings (FAO, 2019). These species are considered highly migratory, undertake diel vertical migrations of several hundred meters and seasonal migrations between the shelf and open ocean (Gilly et al., 2006; Stewart et al., 2013). They can thus act as important linkages between both neritic and oceanic food webs (Arkhipkin, 2013; Alegre et al., 2014). Moreover, they are recognized as voracious and adaptable predators of a broad range of prey including small crustaceans and fishes at early life stages and shift to micronekton, larger fishes, and cephalopods (including cannibalism) as they grow (Nigmatullin et al., 2001; Alegre et al., 2014). Ontogenetic changes in the morphology of the capture apparatus (e.g., arms and beaks) seem to reflect the increasing capacity to seize or bite different size spectrum of prey (Franco-Santos and Vidal, 2014; Gong et al., 2018b; Hanlon and Messenger, 2018). They are also the main prey items of a variety of predators such as tunas, sharks, and whales (Ruiz-Cooley et al., 2004). These factors give Ommastrephidae a structuring role to link different trophic levels and in energy transfer between the neritic and oceanic food webs. Thus, as fisheries continue to increase their capture production of ommastrephid squid, more information on their trophic ecology (e.g., trophic niche and diversity) would facilitate better management of these species and exploitation of marine ecosystems (de la Chesnais et al., 2019).
Jumbo squid Dosidicus gigas is the target of the world’s largest cephalopod fishery and supports important commercial fisheries off the coasts of western South and Central America and the Gulf of California (FAO, 2019). This species is the largest and most abundant ommastrephid squid in tropical and subtropical regions of the Eastern Pacific Ocean (Nigmatullin et al., 2001). Like other ommastrephid, D. gigas preys on a broad range of mesopelagic fishes, crustaceans, and squids (Alegre et al., 2014; Pardo-Gandarillas et al., 2014), and is a food source for large pelagic fish (e.g., tuna, billfish, and shark) and marine mammals (Nigmatullin et al., 2001; Ruiz-Cooley et al., 2004). Several studies demonstrated that they can respond quickly to environmental change, such as abnormal warm surface temperatures and decreased prey availability, due to plasticity in life-history strategy. For example, environment-driven switch in distribution, size-at-maturity, and prey selectivity may allow D. gigas to rapidly cope with El Niño events, resulting in unpredictable interannual fluctuations in population size and biomass (Zeidberg and Robison, 2007; Hoving et al., 2013; Portner et al., 2019). However, given the large-scale distribution of D. gigas, knowledge of their trophic niche divergence and ecological diversification is still incomplete. This lack of knowledge may threaten the sustainability of this valuable species, especially given the rapid rise in squid landings.
Biochemical tracers, such as stable isotope (SI) and fatty acid (FA), have proven to be a powerful indicator for understanding trophic ecology of ommastrephid squid (including D. gigas) (Ruiz-Cooley et al., 2006, 2010; Pethybridge et al., 2012, 2013). The advantage of these tracers is that they provide insights into nutrients assimilated into the tissues of squid over ecologically relevant timescales, rather than a snapshot of recognizable prey items recently ingested. For example, carbon and nitrogen stable isotope ratios (δ13C and δ15N, respectively) and FA profiles of squid muscle tissue can reveal diet over the previous weeks (Ruiz-Cooley et al., 2006; Stowasser et al., 2006). δ13C values change little after trophic transfer and can be used to determine carbon source. δ15N values exhibit stepwise enrichment across trophic levels and can be used to identify trophic position (Post, 2002). Thus, integrating δ13C and δ15N values from muscle or other tissues (e.g., gladius or beak) of D. gigas can reflect complex dynamics of trophic relationships within food webs (Ruiz-Cooley et al., 2006; Espinoza et al., 2017) and also ontogenetic changes in diet and/or habitat (Ruiz-Cooley et al., 2010; Gong et al., 2018b; Hu et al., 2019). However, spatial variabilities in biogeochemical processes affect the baseline isotopic values which propagated up to D. gigas through feeding (Argüelles et al., 2012; Ruiz-Cooley and Gerrodette, 2012). Therefore, interpretation of D. gigas tissue isotopic values can be confounded by variation in baseline isotopic values and by overlapping values among potential prey items. FA analysis is increasingly being applied to high trophic level marine organisms, and extensively useful for detecting intraspecific variations in the diet (Pethybridge et al., 2012, 2013; Sardenne et al., 2016). This approach is based on the concept that FAs are transferred with little change from prey to predator, and a subset of FAs (e.g., essential FAs) can only be assimilated by predators through their diet, meaning that dietary sources can be identified from adipose tissue samples (Arts et al., 2001; Parrish, 2013). These FAs are biosynthesized by specific primary or secondary producers, such as diatoms, dinoflagellates, and macroalgae (Patil et al., 2007; Parrish, 2013), making them suitable for use as biomarkers, particularly long (>20) carbon chain polyunsaturated FAs (PUFAs), e.g., arachidonic acid (ARA; C20:4n6), eicosapentaenoic acid (EPA; C20:5n3) and docosahexaenoic acid (DHA; C22:6n3). Overall, FAs are more specific to dietary sources compared to SIs. Combining SI and FA datasets can alleviate some of the ambiguities that result from using SI analysis alone (Antonio and Richoux, 2014; Sardenne et al., 2016). For example, spatial variations in δ13C and δ15N values of D. gigas tissues elucidate differences in baseline values as well as trophodynamics (Argüelles et al., 2012; Ruiz-Cooley and Gerrodette, 2012). Biochemical tracers have also been used to provide a quantitative niche width based on geometric approaches. For example, the SI niche is often based on the range of δ13C and δ15N values seen in a population (Cucherousset and Villéger, 2015). Although FAs have been used to investigate trophic ecology of ommastrephid squid (e.g., Pethybridge et al., 2012, 2013), and are recognized as efficient tracers for elucidating geographic origins of D. gigas (Gong et al., 2018a), their utility for assessing trophic niche has not yet been determined.
Morphological traits of squid feeding apparatuses (such as arms, tentacles, and beaks) can be a complementary approach for understanding trophic niche and diversity because they can shape diet through their influence on feeding capability (Hanlon and Messenger, 2018). The squid prehensile arms and tentacles are associated with its pulling force, and long arms and tentacles may increase the potential to seize and restrain large prey items from greater distances (Gong et al., 2018b; Hanlon and Messenger, 2018). Squid use beak, the main feeding apparatus inside the mouth, bite their prey and represents a feeding-related morphological indicator for elucidating dietary changes (Franco-Santos and Vidal, 2014). Therefore, evaluating the functional niche (i.e., trophic niche) through the quantification of morphological traits based on feeding apparatuses is possible (Villéger et al., 2017). The relationships between feeding apparatuses morphometric measurements (FDMs) and the trophic ecology have not been studied extensively in marine invertebrates including pelagic cephalopods.
In this study, we combined the analyses of trophic biochemical tracers (SI and FA) and morphologic indicators (FDM) to estimate and compare trophic niches of D. gigas from three fishing grounds in the southeastern Pacific Ocean. Our goals were (1) to characterize the spatial patterns of feeding and habitat use of D. gigas, and (2) to assess the potential complementarity among these biochemical tracers and morphological traits of feeding apparatuses.
Materials and Methods
Sample Collection and Preparation
Dosidicus gigas was collected from nighttime jigging operations by scientific observers during annual commercial cruises in 2015 (July to August) and 2017 (July to November). Specimens were obtained from three main fishing grounds that range across the tropical and southern temperate Pacific Ocean: the waters off the Ecuadorian, Peruvian and Chilean Exclusive Economic Zone (ECU, PER, and CHI, respectively) (Figure 1). D. gigas were collected fresh and immediately frozen at −20°C on board to prevent tissue degradation and lipid oxidation. In the laboratory, individuals were processed soon after thawed enough to allow dissection. The mantle length (ML) of each squid was measured and maturity stage was determined according to Lipiñski and Underhill (1995). A sample of muscle tissue was taken from the anterior dorsal region and cleaned using ultrapure water (Milli-Q-Water). Muscle samples were lyophilized for 30 h and then ground into a fine powder using a ball mill. A total of 83 individuals (ML: range 22.0 to 44.2 cm, 29.87 ± 4.79 cm, mean ± SD) were used in the subsequent analyses (see Supplementary Table S1 for detailed sampling information).
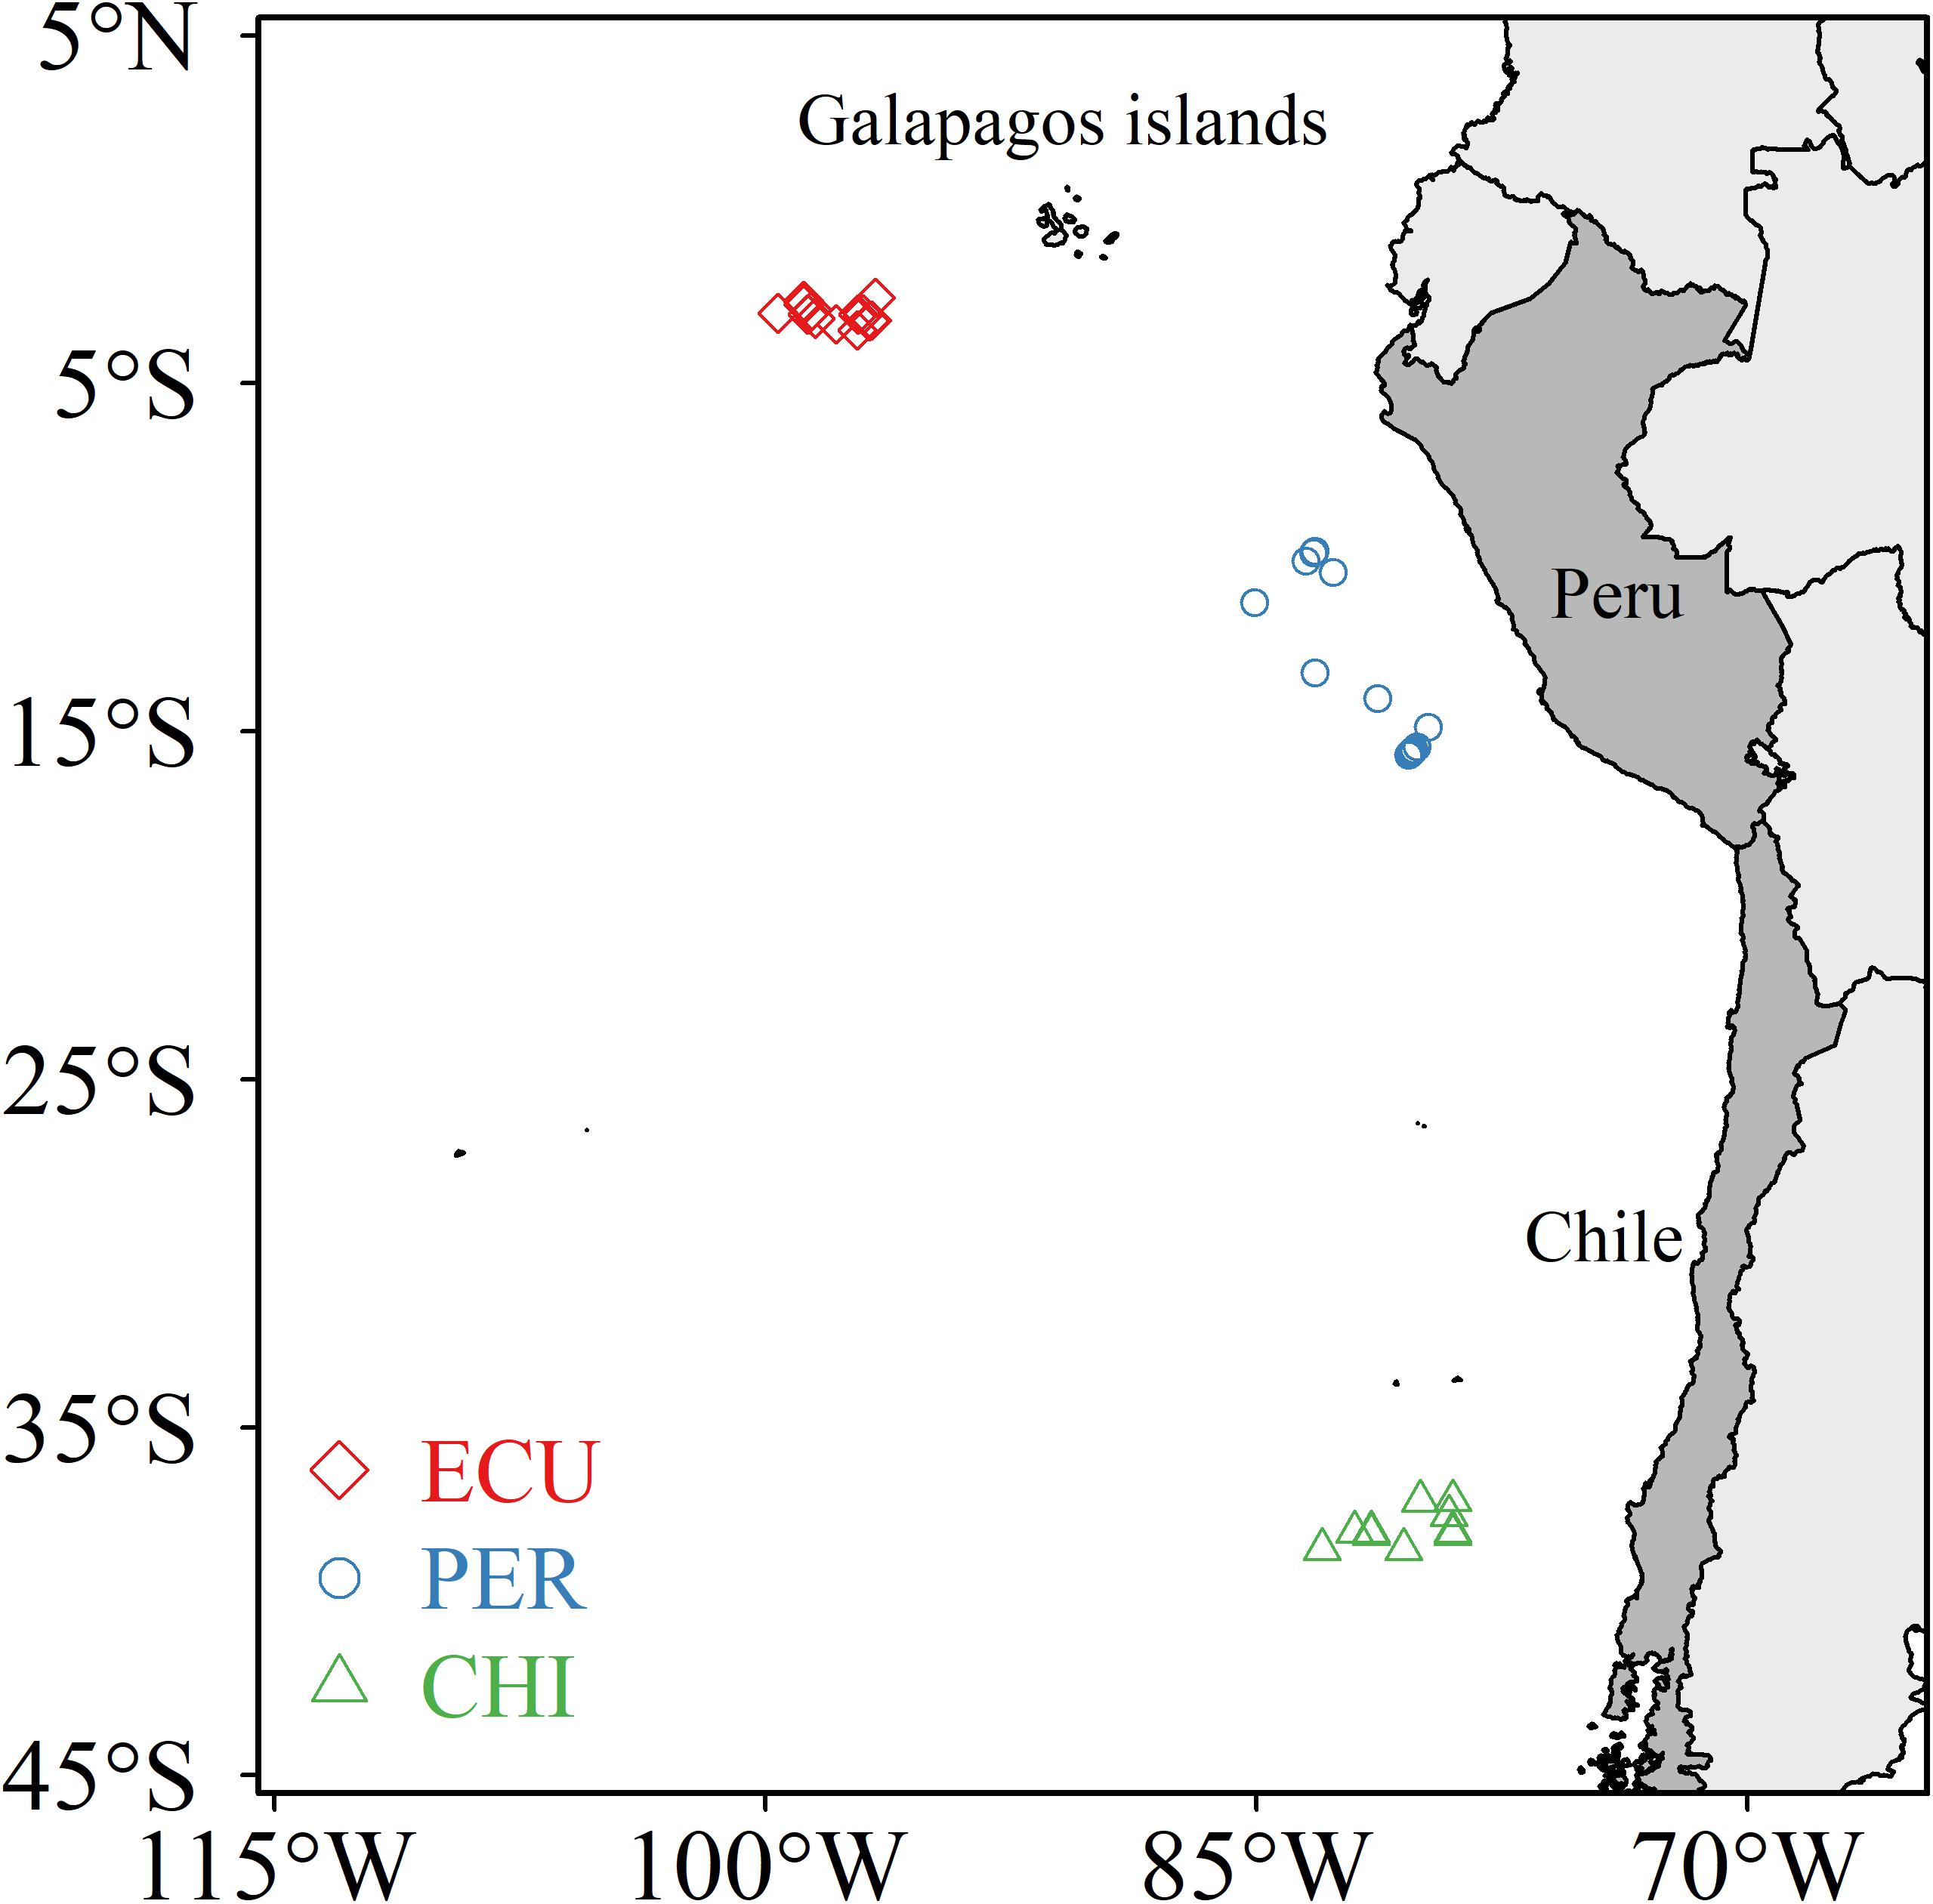
Figure 1. Sampling locations of Dosidicus gigas from three areas in the southeastern Pacific Ocean: the waters off the Ecuadorian, Peruvian and Chilean Exclusive Economic Zone (ECU, PER, and CHI, respectively).
Stable Isotope and Fatty Acid Analyses
Dried, homogenized subsamples of muscle tissue were directly utilized for the nitrogen stable isotope analysis, while lipid-extracted powder was used for carbon isotope analysis to remove the potential impacts of 13C depleted lipid (Logan et al., 2008). A minimum of 1 mg of powder was weighed in tin cups for combustion in a vario ISOTOPE cube elemental analyzer (Elementar Analysensysteme GmbH), which were then analyzed with an IsoPrime 100 isotope ratio mass-spectrometer (Isoprime Corporation). The results were expressed with δ-notation in parts per thousand (%) relative to international standards of Vienna PeeDee Belemnite for δ13C values and atmospheric N2 for δ15N values. During analysis, protein (δ13C = −26.98% and δ15N = 5.94%) was used as a laboratory working standard. Precision for each run was 0.08 and 0.09% for δ13C and δ15N, respectively.
Powdered muscle tissues were prepared and analyzed for FA profiles followed by the procedure outlined by our previous research (Gong et al., 2018a). Briefly, lipid samples were extracted from approximately 200 mg of dried powders using a mixture of chloroform and methanol. Lipids were then transesterified with boron trifluoride-methanol and analyzed as FA methyl esters (FAMEs). FAMEs were separated and quantified by gas chromatography/mass selective detector (7890B/5977A, Agilent Technologies) and equipped with a HP-88 capillary column (60 m × 0.25 mm × 0.2 μm, Agilent Technologies). Individual FAME was identified by retention times and mass spectra with a known concentration internal standard (GLC 37, Nu-Chek Prep, Inc.). The results are calculated as a percentage of the total FAs in the sample. FAs accounting each for less than 1% of total FAs in at least one sample were excluded from further analyses.
Morphometric Analysis
Morphometric analysis of D. gigas feeding apparatuses (arms, tentacles, and beaks) was performed according to Clarke (1986) and Moltschaniwskyj (1995). Six morphometric measurements of squid arms and tentacles [the length of each of the four arms (R1-R4), tentacle length (TL) and tentacular club length (CL)] were taken on the right-hand side of each specimen (Supplementary Figure S1). In addition, eight morphometric measurements of the squid beak [upper hood length (UHL), upper crest length (UCL), upper rostrum length (URL), upper wing length (UWL), lower hood length (LHL), lower crest length (LCL), lower rostrum length (LRL), and lower wing length (LWL)] were measured with a vernier caliper (Supplementary Figure S1). To remove the allometric effects of body size and improve normality, all morphometric data were standardized by using the following formula prior to analysis (Lleonart et al., 2000):
where M is one of the morphometric measurements of feeding apparatuses, MSI is the standardized value for the individual I, MI and MLI are the observed values of M and mantle length for the individual I, respectively, and ML0 is the mean value for the study population. a can be calculated from the following formulas:
where b is the parameter to be estimated.
Statistical Analysis
Analysis of variance (ANOVA) with post hoc Tukey’s honestly significant difference (HSD) test was performed on δ13C and δ15N values, mean values of the major classes of total FAs (i.e., saturated fatty acid, SFA; monounsaturated fatty acid, MUFA; PUFA) and untransformed FA and FDM data. Similarity percentages (SIMPER) analysis were used to further investigate differences in FA profiles among sampling areas and determine which FA(s) contributed most to the observed differences. Results were visualized by non-metric multidimensional scaling (NMDS) based on the Euclidean distance matrix using the Vegan package (Oksanen et al., 2019) in R Version 3.5.3 (R Core Team, 2019). NMDS was also done to compare the morphometric data among areas. NMDS can summarize the information provided by the multivariate data structure and allows visualization of sample units in a low-dimensional space.
In this study, niche metrics were measured as the two-dimension bivariate aspect of niche, niche area (as for SIs) and the multivariate niche space (as for FAs and FDMs). Trophic niche was evaluated using isotopic values (δ13C and δ15N), and coordinates in the two dimensions of the NMDS of FA profiles or FDM data. Because of the large difference between range values of stable isotopes and NMDS coordinates of FA profiles or FDM data, we scaled them as suggested by Cucherousset and Villéger (2015), resulting in a unitless, multidimensional space. In the scaled bidimensional plot, both axes have the same range (i.e., 0 to 1) and thus contribute equally to quantify the niche width (Cucherousset and Villéger, 2015), and enabled comparisons of trophic niches derived from the three methods (SI, FA, and FDM analyses). Using the SIAR package in R, the trophic niche width and overlap were calculated using the standard ellipse corrected area (SEAc) to minimize the uncertainty when comparing small and/or unbalanced sample sizes (Jackson et al., 2011).
To evaluate the degree of association between biochemical tracers, Spearman’s rank correlation was applied to test for the presence of any relationships between isotopic values and FAs that contributed to the most dissimilarity among areas (where rs is Spearman’s rank correlation coefficient). Correlation analysis was also done to evaluate the relationship between squid ML and biochemical tracers. All statistical analyses and graphics were carried out in software OriginPro Version 2020 (OriginLab Corp., Northampton, MA, United States) and R.
Results
Stable Isotopes
No difference in ML was observed between individuals from ECU (27.31 ± 3.87, range 22.00 to 35.40 cm) and PER (29.59 ± 5.00 cm, range 23.30–44.20 cm, ANOVA, F1,60 = 402.99, p = 0.07), while larger ML was observed in CHI squid (34.38 ± 2.06 cm, range 29.2–37.5 cm, ANOVA, F2,80 = 20.77, p < 0.01). Nonetheless, the maturity stages of specimens were estimated to be stages I to III, with the majority (81.93%) being stages I to II, indicating that D. gigas examined in this study were all juveniles. The δ13C range for all individuals was −17.45 to −15.45% (−16.71 ± 0.35%), while D. gigas had a much wider range of δ15N values, from 7.97 to 18.40% (12.46 ± 1.17%). Significant spatial variations were found in δ13C and δ15N values of D. gigas muscle tissues among areas (ANOVA, δ13C: F2,80 = 36.61, p < 0.01; δ15N: F2,80 = 375.18, p < 0.01). Post hoc Tukey’s HSD tests indicated that values for δ13C were significantly lower in ECU (−16.98 ± 0.20%) followed by CHI and PER (−16.80 ± 0.35% and −16.32 ± 0.38%, respectively, p < 0.01). In addition, individuals sampled from CHI (15.98 ± 1.19%) were more enriched in 15N than other areas (PER: 13.74 ± 1.02%), and ECU being the lowest (9.24 ± 0.64%, p < 0.01).
Fatty Acids
Considerable variability in proportions of the main FA classes was observed among studied areas (Table 1), while the dominant FAs were polyunsaturated fatty acids (PUFAs) in all individuals (range 56.19 to 72.15%). In contrast, saturated fatty acids (SFAs) accounted for 18.02 to 33.90% followed by minor monounsaturated fatty acids (MUFAs) ranged from 7.38 to 16.77%. D. gigas from CHI had higher amounts of PUFAs and lower amounts of SFAs than individuals from ECU and PER (Table 1). Of the 28 FAs detected, a total of 7 FAs had minimum proportions greater than 1%. These 7 FAs included SFAs C16:0 and C18:0; MUFAs C18:1n9 and C20:1n9; and PUFAs C20:4n6 (ARA), C20:5n3 (EPA), and C22:6n3 (DHA), and accounted for 69.46 to 90.05% of all FAs. Notably, the CHI squid had higher amounts of ARA and DHA, while the highest amounts of EPA were present in squid from ECU (Figure 2). Overall, significant spatial variations were found in FA profiles of D. gigas muscle tissues (Table 1 and Figure 2). NMDS ordination for the multivariate structure of FA profiles resulted in a two-dimensional solution (stress = 0.059, Supplementary Figure S2). Three groups of individuals are clearly distinguishable, corresponding to the sampling areas. According to the SIMPER analysis, the FAs contributing to these differences in the multivariate analysis varied according to the specific FA. C16:0, DHA, and EPA contributed to 71% of the differences between ECU and PER squid (Supplementary Figure S3), whereas differences between ECU and CHI individuals were primarily driven by C16:0, ARA, and DHA, contributing 72% of the dissimilarity (Supplementary Figure S3). DHA (33%) contributed to the greatest source of dissimilarity between PER and CHI squid, followed by ARA (27%) and C16:0 (16%).
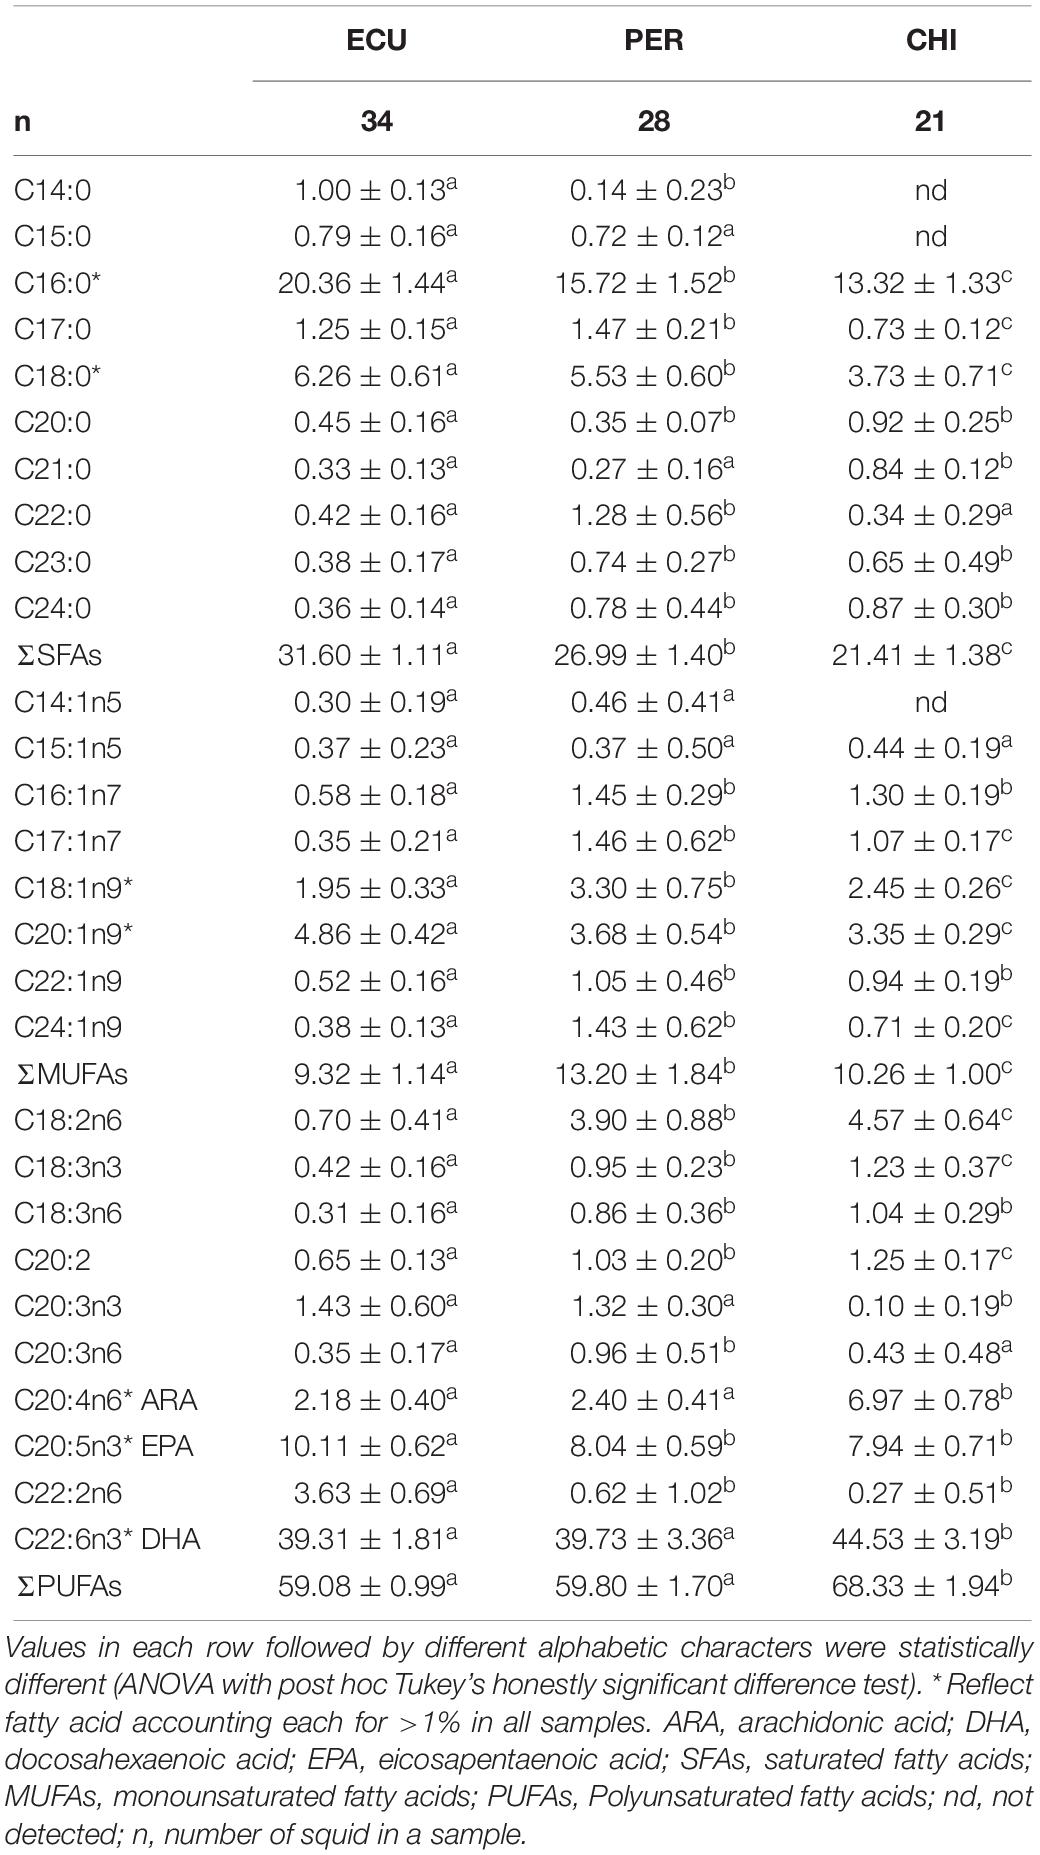
Table 1. Fatty acid profiles (%, mean ± SD) in muscle of Dosidicus gigas sampled from the waters off the Ecuadorian, Peruvian and Chilean Exclusive Economic Zone (ECU, PER, and CHI, respectively).
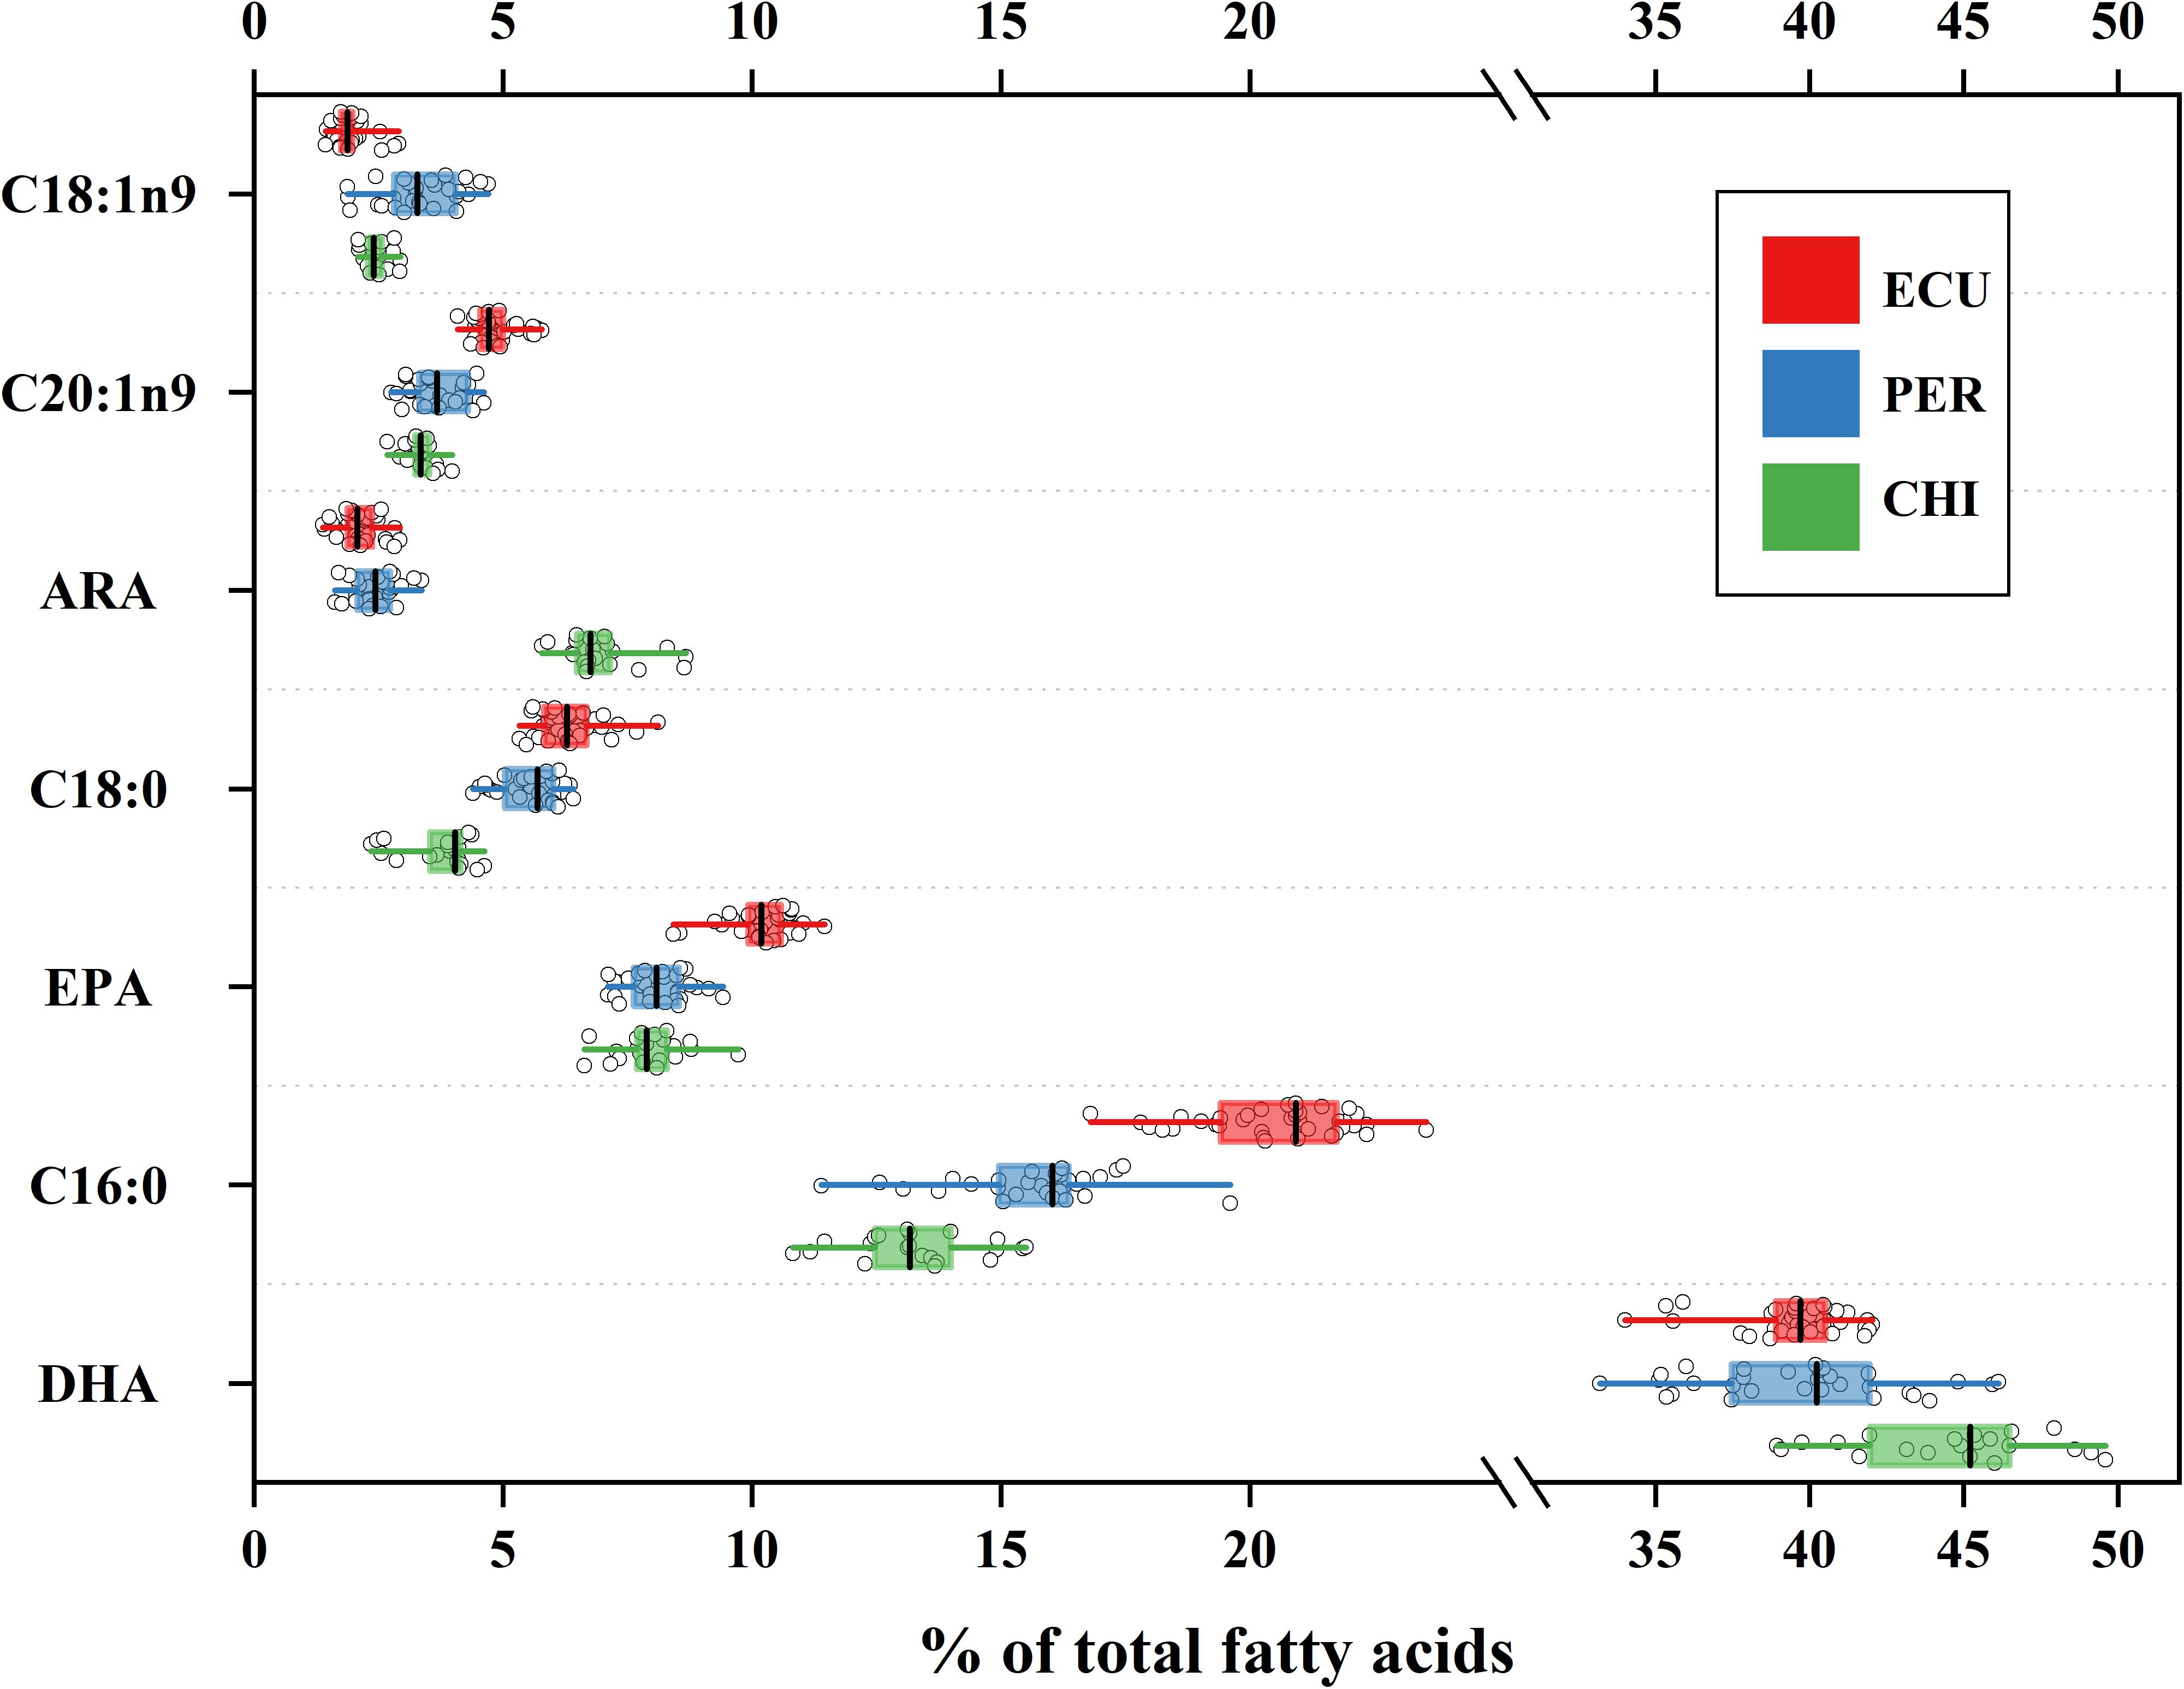
Figure 2. Variation in fatty acid profiles of Dosidicus gigas relative to three geographic areas. Mean values are shown with error bars of standard deviations. The box represents the interquartile range and vertical line within each box represents median value. Whiskers indicate minimum and maximum values. ARA, arachidonic acid; DHA, docosahexaenoic acid; EPA, eicosapentaenoic acid.
Morphometric Measurements
The values of 14 FDMs were summarized in Table 2. The ANOVA results showed that all the morphometric measurements were significantly influenced by geographic area. The highest FDMs values were present in squid from CHI, except for URL (Table 2). NMDS ordination of standardized morphometric data resulted in a two-dimensional solution (stress = 0.136, Supplementary Figure S2) revealed significant spatial variations in feeding apparatuses morphology, while a fair amount of overlap was observed between ECU and PER (Figure 3C).
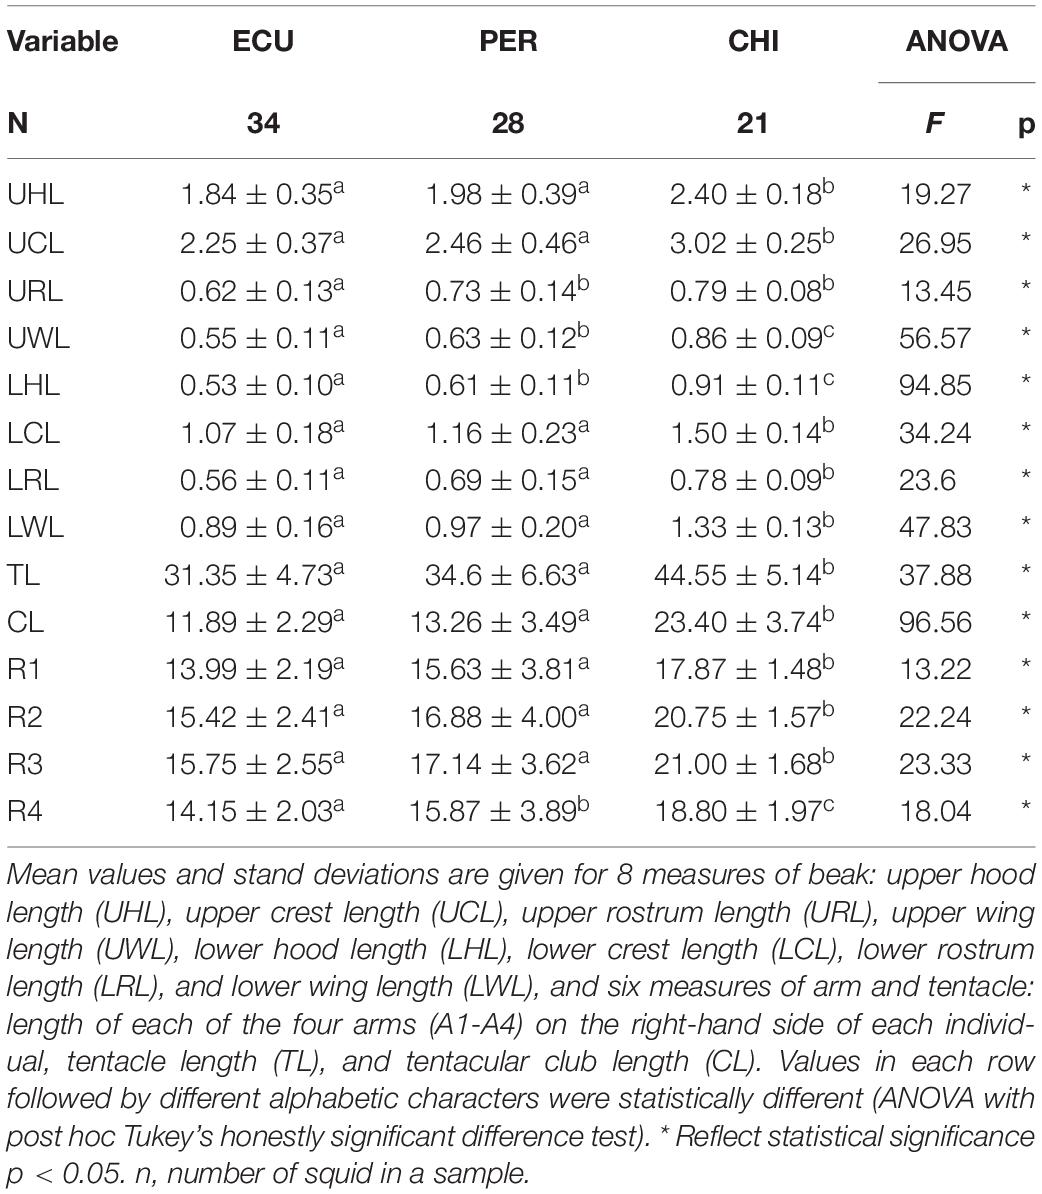
Table 2. Summary information of feeding apparatuses morphometric measurements (cm) of Dosidicus gigas relative to three geographic stocks.
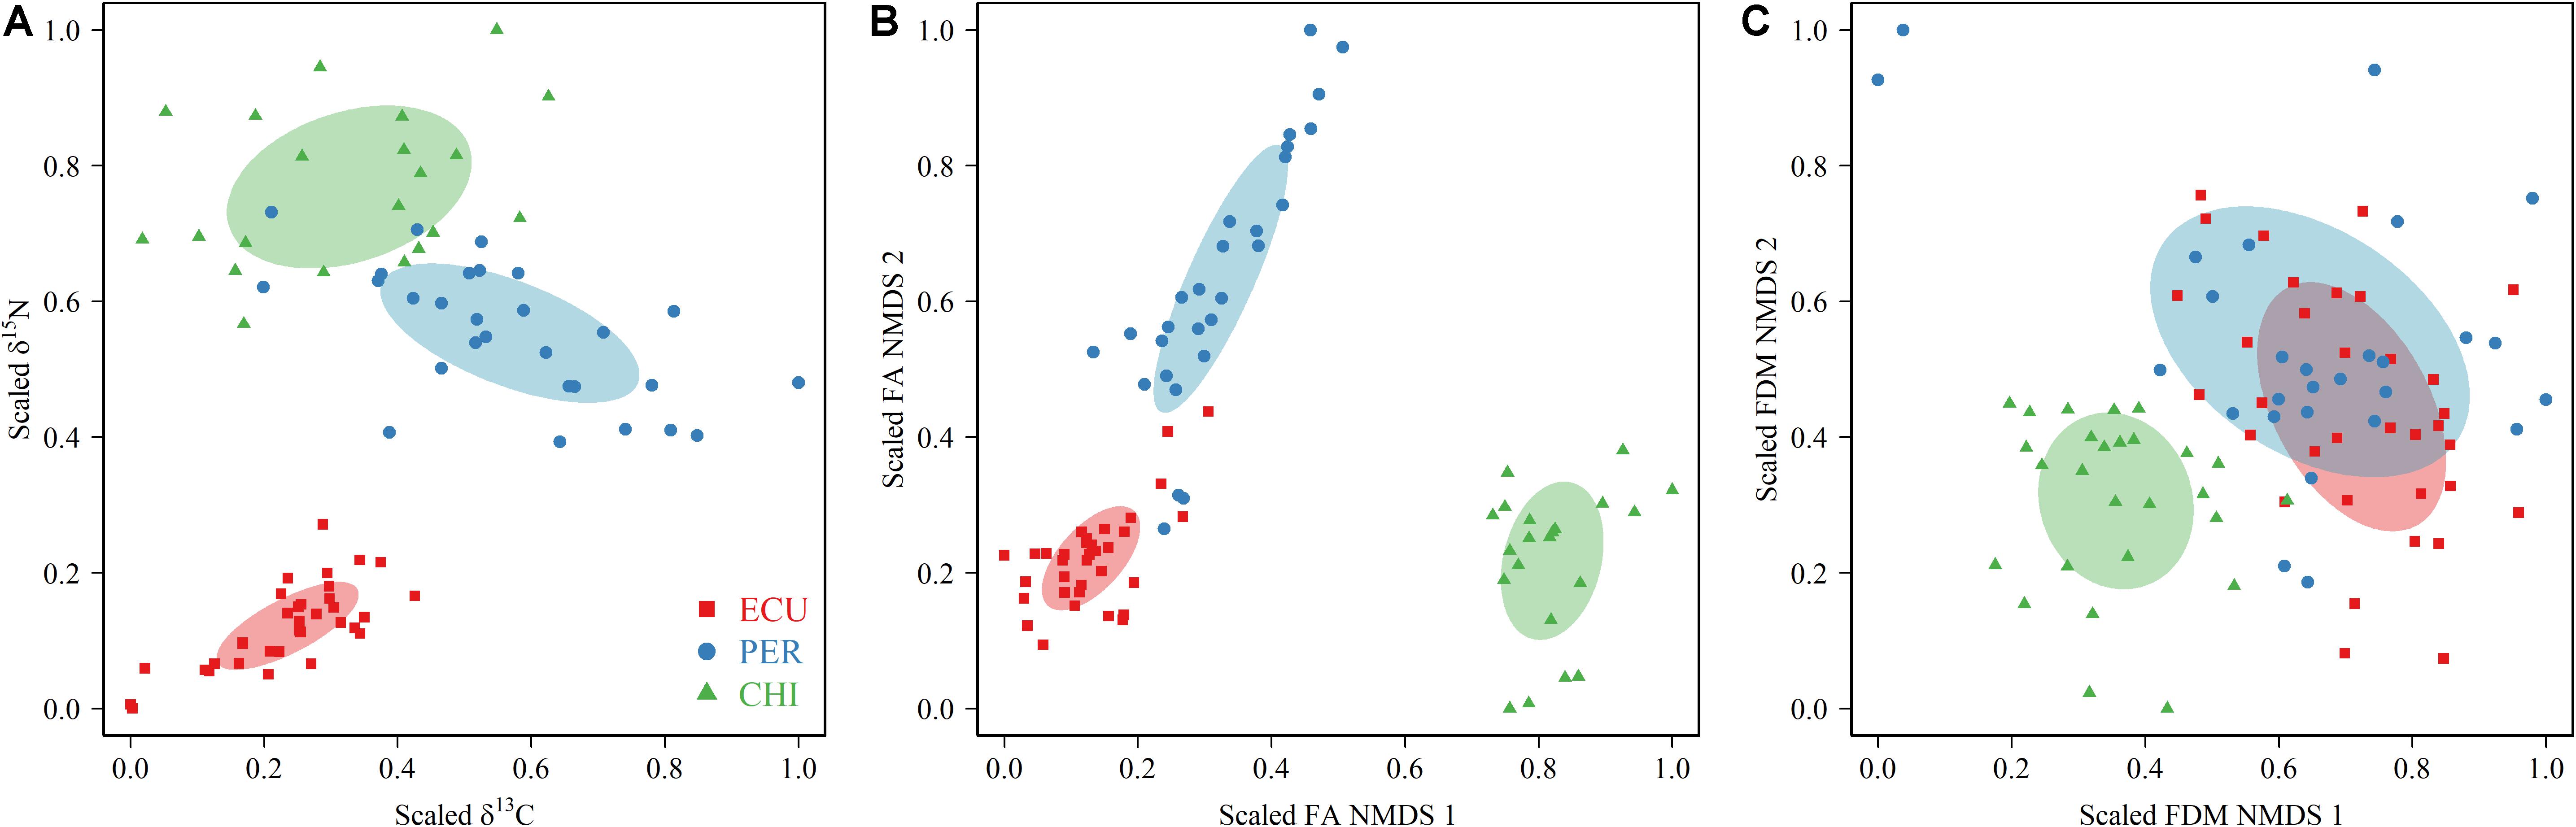
Figure 3. Estimation of trophic niches using scaled δ13C and δ15N values (A) and coordinates in the two dimensions of the non-metric multidimensional scaling (NMDS) of fatty acid (FA) (B) profiles and feeding apparatuses morphology (FDM) (C) data of squid of Dosidicus gigas sampled from the waters off the Ecuadorian, Peruvian and Chilean Exclusive Economic Zone (ECU, PER, and CHI, respectively). The area of the ellipses (calculated with SEAc) represents the (A) isotopic, (B) FA, and (C) FDM trophic niche of each geographic stock.
Trophic Niche Metrics
Trophic niches based on isotopic values, FA profiles, and FDMs were explored among geographic stocks. The isotopic niches, measured by the SEAc of scaled isotopic values, showed variations in niche width across the area. The largest isotopic SEAc occurred in CHI squid, followed by PER and ECU, with CHI indices being almost 1 to 4 times higher than that of PER and ECU (SEAc: 0.063, 0.048, and 0.014 for CHI, PER, and ECU, respectively, Figure 3A). No overlap was observed in isotopic niche metrics among areas. Unlike the isotopic niche width, FA niche based on scaled NMDS results indicated PER individuals had larger niche width of SEAc (0.032), followed by CHI and ECU (0.026 and 0.013, respectively, Figure 3B). Nonetheless, there was also no overlap in FA niches. Differences in niche metrics, including inter-area overlap, were apparent between the biochemical tracers (SI and FA) and FDMs. For SEAc of scaled FDMs, CHI (0.045) was lower than PER and ECU (0.134 and 0.071, respectively), with considerable niche overlap between the latter two areas (0.057, 81%) (Figure 3C). Overall, although some differences were observed between trophic niche metrics inferred by two biochemical tracers (SI and FA), the degree of overlap among areas agreed, with ECU squid had the lowest niche width (Figure 3). Conversely, niche metrics based on FDMs indicated ECU and PER individuals shared most of their niche space, while the CHI squid was clearly separated from other areas.
Correlations Between Stable Isotopes, Fatty Acids, and Mantle Length
The δ13C and δ15N values, FAs (i.e., C16:0, ARA, DHA, and EPA), and ML were in combination subjected to Spearman’s rank correlation test. Significant correlations were detected between δ15N and all other biomarkers (Figure 4). δ15N were positively correlated with δ13C, ARA and DHA (0.38 ≤ rs ≤ 0.62, p < 0.05). Conversely, δ15N was strongly and negatively correlated with C16:0 and EPA (rs < −0.70, p < 0.05). These negative correlations, to a lesser extent, were also found in δ13C (rs: −0.35 and −0.45 for C16:0 and EPA, respectively, p < 0.05, Figure 4). Squid ML was positively correlated with δ15N, ARA and DHA (rs ≥ 0.28, p < 0.05), while negatively correlated with C16:0 and EPA (rs ≤ −0.46, p < 0.05). In contrast, no correlation was observed between ML and δ13C (p > 0.05, Figure 4).
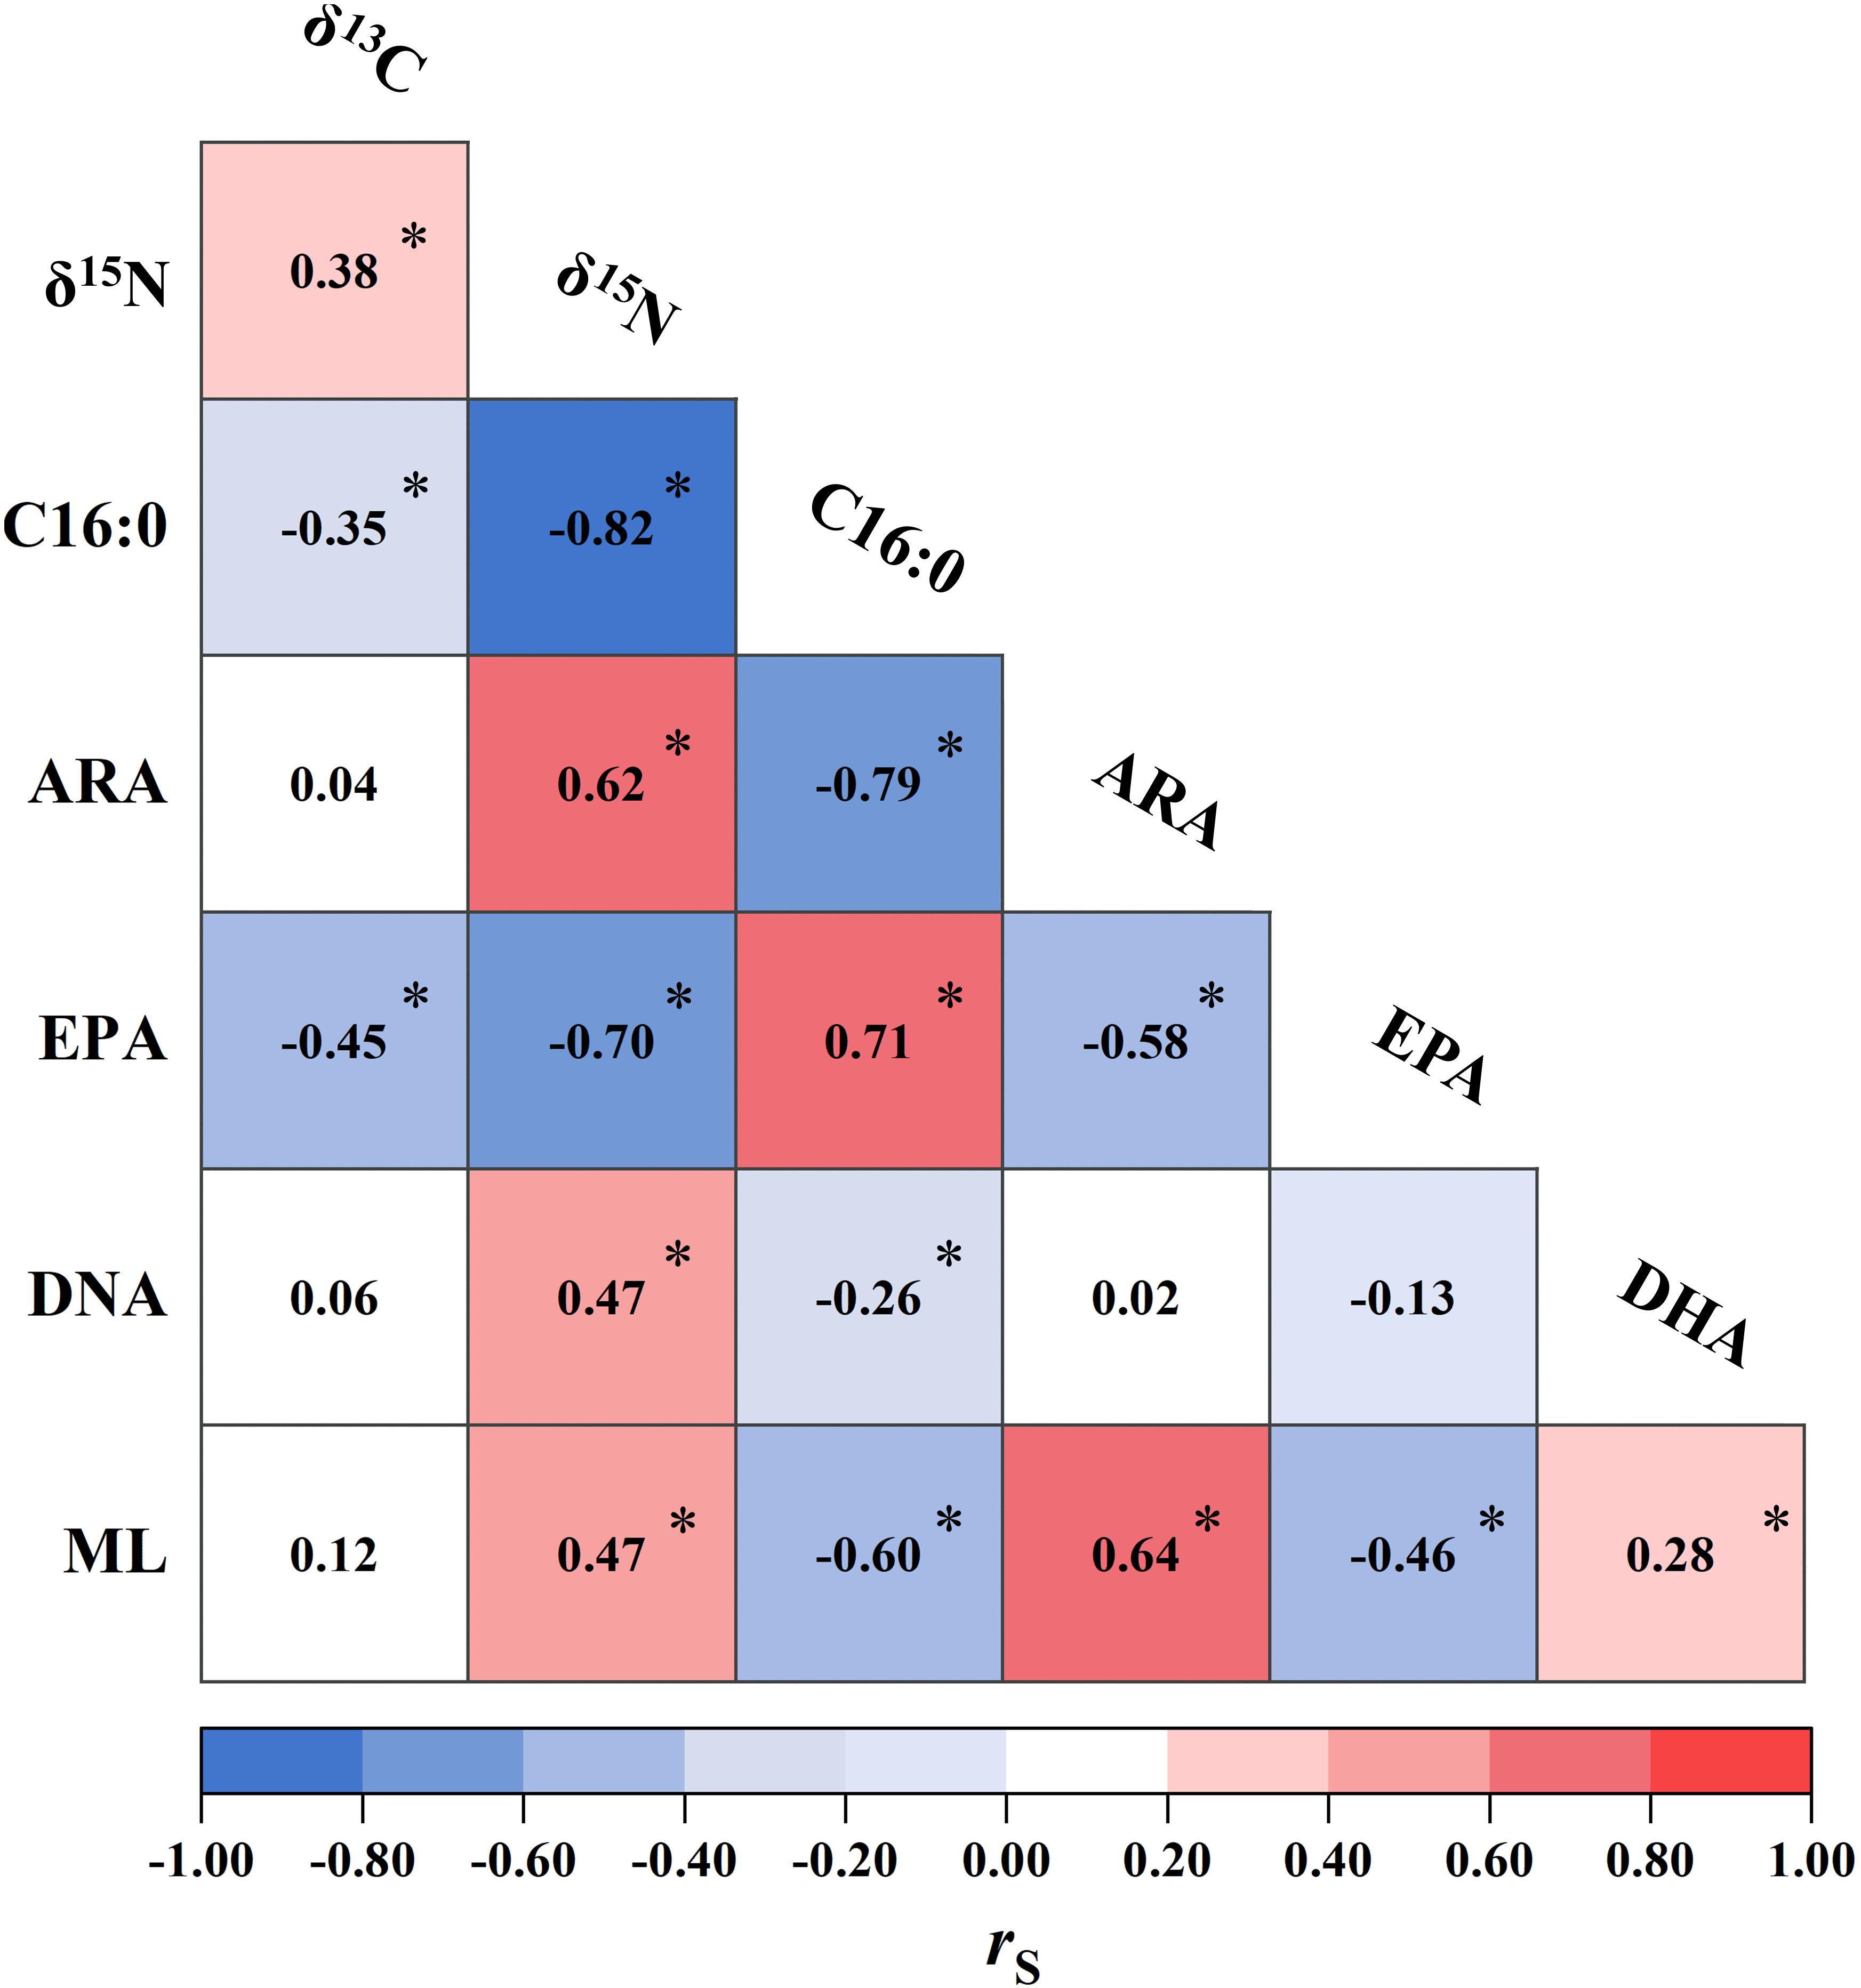
Figure 4. Correlations between isotopic values (δ13C and δ15N, %), fatty acids [palmitic acid (C16:0), arachidonic acid (ARA), docosahexaenoic acid (DHA), and eicosapentaenoic acid (EPA),% of total fatty acids], and mantle length (ML, cm) of Dosidicus gigas. The numbers inside grids are the associated Spearman’s rank correlation coefficient (rs) calculated for each pair. Statistical significance at ∗p < 0.05 is shown.
Discussion
Intraspecific differences in the diet of pelagic predators may maximize the utilization of available food resources and increase adaptation to diversified oceanographic environments. This foraging strategy is vital for the D. gigas that have an extensive distribution range in the eastern Pacific Ocean with high energetic requirements (Nigmatullin et al., 2001). By using a comparative investigation of multiple biochemical tracers (δ13C, δ15N, and FAs) and trophic morphological indicators (FDMs), we evaluated the trophic niche and diversity of D. gigas from the southeastern Pacific Ocean. Our results revealed significant differences in isotopic patterns and FA profiles among geographic stocks, possibly driven by site-specific dietary sources and biogeochemical processes, and size divergence in feeding apparatuses. Trophic niche metrics determined using isotopic values share some similarities with the results described by the FA profiles, while the difference was less pronounced based on FDMs niche metrics alone. This is likely due to differences in ecological views employed, including dietary (e.g., biochemical tracers) and foraging behavioral (e.g., FDMs) facets. Nonetheless, each method provides a complementary understanding of spatial variabilities in feeding and habitat use of D. gigas.
The considerable wide range of isotopic values in all specimens (2.0% for δ13C and 10.43% for δ15N), and generally moderate inter-individual variability in each area (Figure 3A), suggests a variety of dietary habits and sources both across and within the geographic stocks. These results correspond to previous studies using stomach content analysis in which D. gigas was found to consume a wide range of prey, including fish, crustaceans, and other cephalopods (Alegre et al., 2014; Pardo-Gandarillas et al., 2014). Differences in prey items have also been found in geographic stocks within D. gigas (e.g., PER and CHI). More than half of D. gigas stomach content collected off the coast of Chile consisted of fish species, especially Chilean jack mackerel Trachurus murphyi (Pardo-Gandarillas et al., 2014), while cephalopods and Panama lightfish Vinciguerria lucetia were the main prey items of D. gigas collected in the waters off Peru (Alegre et al., 2014). Although the diet composition of ECU individuals was not identified in this study, the low δ13C and δ15N values presented here indicate they might have specific dietary sources. Indeed, it was reported that the diet of D. gigas in Ecuadorian waters (the eastern waters of ECU) was mainly composed of myctophids and cephalopods (Rosas-Luis and Chompoy-Salazar, 2016). Isotopic niche differentiation corroborates the presence of diversified dietary sources among geographic stocks (Figure 3A). Differences in the SI niche metrics appear to be largely driven by δ15N values, indicating that D. gigas possibly fed at the different trophic positions in each area (i.e., CHI > PER > ECU). These differences are likely due to the size divergence in feeding apparatuses. Our results indicate that feeding apparatuses of CHI squid were bigger/longer than those of ECU and PER squid. As functional feeding apparatuses, the observed size variations in the arm, tentacle, tentacular club, and beak suggest differences in feeding and resource use (Franco-Santos and Vidal, 2014; Hanlon and Messenger, 2018). It is likely that the bigger/longer feeding apparatuses favor CHI squid to capture prey of larger size or higher trophic positions than individuals from ECU and PER. This hypothesis is supported by the observed highest level of DHA in CHI squid (Figure 2), which is positively correlated with δ15N values and recognized as a characteristic of trophic position (Sardenne et al., 2017). This pattern could also result in a larger isotopic niche width in CHI squid since they might have a wider size spectrum of prey. Given the positive relationship between the δ15N values of muscle tissue and size of D. gigas (Ruiz-Cooley et al., 2006; this study), the higher trophic position and niche width of CHI individuals might also result from their larger ML, perhaps in relation to increasing swimming speed with body size (Alexander, 1990), and ultimately maximize feeding success of larger prey or prey at higher trophic positions. These findings contrast somewhat with the results of ECU and PER squid, in which they had similar ML and shared considerable FDM niche space indicating similar morphological traits of feeding apparatuses (Figure 3C), while the lower δ15N values and the narrower isotopic niche was observed in ECU.
Spatial variability in isotopic values may not only be driven by dietary divergence, but also from the changes in baseline values across different geographic areas. Latitudinal gradients in δ13C and δ15N values have been well recognized in the eastern Pacific Ocean and can be propagated up in the squid tissues through the diet (Argüelles et al., 2012; Ruiz-Cooley and Gerrodette, 2012). In this study, we found an increasing trend of δ15N values from equatorial Pacific waters (i.e., ECU) to the highest latitude region (i.e., CHI), indicating the potential effect of latitudinal variation in baseline values. These patterns are consistent with the previous studies in D. gigas gladii and muscle tissues using stable isotope analysis (Ruiz-Cooley et al., 2010; Argüelles et al., 2012; Ruiz-Cooley and Gerrodette, 2012). The latitudinal variation in δ13C values of D. gigas showed a bell-shaped trend with lower values in ECU and CHI and the highest values in PER. The results are also in agreement with the observed latitudinal patterns of δ13C values in D. gigas muscle tissues from the similar latitudinal range in the southeastern Pacific Ocean (Ruiz-Cooley and Gerrodette, 2012) and might be related to the highest productivity in nearshore waters off the coast of Peru (Echevin et al., 2008). The injection of nutrients into surface waters through upwelling results in high phytoplankton productivity which corresponds to high δ13C value of aqueous CO2, since the preferential uptake of 12C by phytoplankton during photosynthesis (Rau et al., 2001). Another possible explanation of such spatial variability in isotopic values could be the distance to the shelf break. Compared to oceanic waters (i.e., ECU), higher δ15N values were found in squid captured from nearshore waters (i.e., PER and CHI), which was similar with the documented decreasing trend of D. gigas δ15N values with distance to shelf break (Argüelles et al., 2012; Ruiz-Cooley and Gerrodette, 2012). These findings could also be related to the upwelling regions off Peru and Chile that are characterized by intense shallow oxygen minimum zones (Stramma et al., 2010). The hypoxic deep water is supplied to the surface and facilitate the denitrification process which preferentially consumes 14N-nitrate and increases the baseline δ15N value (Voss et al., 2001). Contrary to the previous findings that D. gigas δ13C values decreased with distance to shelf break (Ruiz-Cooley and Gerrodette, 2012), no difference in δ13C values was observed between individuals from ECU and CHI, possibly due to the utilization of more 13C-depleted carbon sources from oceanic food web in these two stocks (as discussed below).
Based on the analysis of D. gigas FA profiles/biomarkers, clear intraspecific differences in habitat use were apparent which mostly supported the results as indicated by isotopic values. The highest level of EPA in ECU individuals reflects the characteristic of marine food webs supported primarily by diatoms (Parrish, 2013). In contrast, D. gigas from CHI had distinct FA profiles which included relatively higher amounts of the PUFA containing 18 carbon atoms (ΣPUFA18), ARA, and DHA, which are characteristics of estuarine/coastal macroalgae or plants and marine dinoflagellates, respectively (Dalsgaard et al., 2003; Patil et al., 2007; Parrish, 2013). This suggests that CHI squid possibly moved and fed in different regions across the neritic to oceanic food webs. PER individuals also act as linkages between both food webs, which consisted of relatively high levels of ΣPUFA18 and C16:1n7, and low EPA and DHA, suggests a greater dietary intake of neritic than the oceanic prey (Kelly and Scheibling, 2012). This hypothesis is supported by the observed higher δ13C and δ15N values in PER and CHI squid, which is associated with the upwelling regions in nearshore waters. Such spatial dynamics was previously found in D. gigas of the northern Humboldt current system and ascribed to its ontogenetic migration from oceanic to neritic waters to feed, and then return to oceanic waters to spawn (Tafur et al., 2001; Argüelles et al., 2012; Alegre et al., 2014). Our results here indeed supported this hypothesis, however, it also indicated distinct basal source contributions that corresponded to sampling areas, an oceanic food web mainly based on marine primary producers (e.g., ECU), and a neritic/oceanic food web based on both estuarine/coastal and marine primary producers (e.g., PER and CHI). Namely, spatial patterns of dietary sources displayed by the site-specific FA biomarkers suggest diversified foraging strategies of D. gigas, which may maximize feeding success and increase adaptation to inhabiting oceanographic conditions. These foraging patterns are also consistent with the NMDS results of FA profiles, in which PER and CHI individuals had larger FA niche width than ECU squid (Figure 3B), suggesting that they assimilate a broader range of FA components, possibly due to more generalist foraging strategies based on both neritic and oceanic food webs (Antonio and Richoux, 2014). However, PER squid appears to preferentially uptake neritic prey items with high δ13C values, which could result in separation of niche metrics with other geographic stocks (i.e., low δ13C values in ECU and CHI). ECU squid occupied the narrowest FA niche and was clearly separated from other stocks, implying more specialist foraging strategies (e.g., mainly based on prey from oceanic food web) correspond to previous findings in the isotopic niche. SFAs also contributed to differences among geographic stocks, particularly C16:0. This FA is the basic SFA in D. gigas and documented as a predominant source of potential metabolic energy for growth (Tocher, 2003). It is therefore likely that the spatial variability in C16:0 is representing different energy demands of squid in a given area, perhaps in relation to the variations in body size and/or trophic position, since C16:0 was strongly correlated with squid ML and δ15N values (Figure 4).
This study was the first to use a combination of multiple trophic biochemical tracers and morphologic indicators to measure trophic niche metrics and explore spatial variability in foraging patterns of a pelagic squid, D. gigas. Differences in SI, FA, and FAM niche metrics highlighted the complementarity of such analyses. Geographic stocks of D. gigas exhibited diversified dietary sources and habitat use and occupied different trophic niche space in the southeastern Pacific Ocean. These spatial patterns could be driven by differences in trophic position, feeding apparatuses morphology, body size and different foraging strategies in a given area, particularly variability in the utilization of resources from neritic and oceanic food webs. Our results highlighted the dietary flexibility of D. gigas and their important ecological roles in ecosystems as trophic linkages. Future studies with site-specific prey items are needed to explore the spatial trophic patterns more precisely and comprehensively. Trophic diversification of a pelagic squid like D. gigas may have important implications for their adaptation to changing environmental conditions.
Data Availability Statement
The raw data supporting the conclusions of this article will be made available by the authors, without undue reservation.
Ethics Statement
The animal study was reviewed and approved by Institutional animal care and use Committee of Shanghai Ocean University.
Author Contributions
YG and YL conceived and designed the experiments. XC and YL provided the tissue samples. YG performed the experiments and analyzed the data with the help of YL and WY. YG wrote the manuscript with the advice of YL, XC, and WY. All authors provided editorial advice and agreed this version of the manuscript was acceptable for submission.
Funding
This work was supported by the National Key R&D Program of China (2019YFD0901404), National Natural Science Foundation of China (31900333, 31872573, and 41906073), and Natural Science Foundation of Shanghai (19ZR1423000).
Conflict of Interest
The authors declare that the research was conducted in the absence of any commercial or financial relationships that could be construed as a potential conflict of interest.
Acknowledgments
We thank all our colleagues at SHOU for their assistance with sample collection and to Xiaodi Gao, Chunxia Gao, and Huiqiong Wang for stable isotope and fatty acid preparation and analysis.
Supplementary Material
The Supplementary Material for this article can be found online at: https://www.frontiersin.org/articles/10.3389/fmars.2020.00642/full#supplementary-material
References
Alegre, A., Ménard, F., Tafur, R., Espinoza, P., Argüelles, J., Maehara, V., et al. (2014). Comprehensive model of jumbo squid Dosidicus gigas trophic ecology in the northern Humboldt current system. PLoS One 9:e0085919. doi: 10.1371/journal.pone.0085919
Alexander, R. M. (1990). Size, speed and buoyancy adaptations in aquatic animals. Integr. Comp. Biol. 30, 189–196. doi: 10.1093/icb/30.1.189
Antonio, E. S., and Richoux, N. B. (2014). Trophodynamics of three decapod crustaceans in a temperate estuary using stable isotope and fatty acid analyses. Mar. Ecol. Prog. Ser. 504, 193–205. doi: 10.3354/meps10761
Argüelles, J., Lorrain, A., Cherel, Y., Graco, M., Tafur, R., Alegre, A., et al. (2012). Tracking habitat and resource use for the jumbo squid Dosidicus gigas: a stable isotope analysis in the Northern humboldt current system. Mar. Biol. 159, 2105–2116. doi: 10.1007/s00227-012-1998-2
Arkhipkin, A. I. (2013). Squid as nutrient vectors linking Southwest Atlantic marine ecosystems. Deep. Res. Part II Top. Stud. Oceanogr. 95, 7–20. doi: 10.1016/j.dsr2.2012.07.003
Arts, M. T., Ackman, R. G., and Holub, B. J. (2001). “Essential fatty acids” in aquatic ecosystems: a crucial link between diet and human health and evolution. Can. J. Fish. Aquat. Sci. 58, 122–137. doi: 10.1139/f00-224
Clarke, M. R. (1986). A Handbook for The Identification of Cephalopod Beaks. Oxford: Clarendon Press.
Cucherousset, J., and Villéger, S. (2015). Quantifying the multiple facets of isotopic diversity: new metrics for stable isotope ecology. Ecol. Indic. 56, 152–160. doi: 10.1016/j.ecolind.2015.03.032
Dalsgaard, J., John, M. S., Kattner, G., Müller-Navarra, D., and Hagen, W. (2003). Fatty acid trophic markers in the pelagic marine environment. Adv. Mar. Biol. 46, 225–340. doi: 10.1016/s0065-2881(03)46005-7
de la Chesnais, T., Fulton, E. A., Tracey, S. R., and Pecl, G. T. (2019). The ecological role of cephalopods and their representation in ecosystem models. Rev. Fish Biol. Fish. 29, 313–334. doi: 10.1007/s11160-019-09554-2
Doubleday, Z. A., Prowse, T. A. A., Arkhipkin, A., Pierce, G. J., Semmens, J., Steer, M., et al. (2016). Global proliferation of cephalopods. Curr. Biol. 26, 387–407. doi: 10.1016/j.cub.2016.04.002
Echevin, V., Aumont, O., Ledesma, J., and Flores, G. (2008). The seasonal cycle of surface chlorophyll in the Peruvian upwelling system: a modelling study. Prog. Oceanogr. 79, 167–176. doi: 10.1016/j.pocean.2008.10.026
Espinoza, P., Lorrain, A., Ménard, F., Cherel, Y., Tremblay-Boyer, L., Argüelles, J., et al. (2017). Trophic structure in the northern Humboldt Current system: new perspectives from stable isotope analysis. Mar. Biol. 164:86. doi: 10.1007/s00227-017-3119-8
FAO (2019). FAO Yearbook: Fishery and Aquaculture Statistics 2017. Rome: Food and Agriculture Organization of the United Nations.
Franco-Santos, R. M., and Vidal, E. A. G. (2014). Beak development of early squid paralarvae (Cephalopoda: Teuthoidea) may reflect an adaptation to a specialized feeding mode. Hydrobiologia 725, 85–103. doi: 10.1007/s10750-013-1715-2
Gilly, W. F., Markaida, U., Baxter, C. H., Block, B. A., Boustany, A., Zeidberg, L., et al. (2006). Vertical and horizontal migrations by the jumbo squid Dosidicus gigas revealed by electronic tagging. Mar. Ecol. Prog. Ser. 324, 1–17. doi: 10.3354/meps324001
Gong, Y., Li, Y., Chen, X., and Chen, L. (2018a). Potential use of stable isotope and fatty acid analyses for traceability of geographic origins of jumbo squid (Dosidicus gigas). Rapid Commun. Mass Spectrom. 32, 583–589. doi: 10.1002/rcm.8071
Gong, Y., Ruiz-Cooley, R. I., Hunsicker, M. E., Li, Y., and Chen, X. (2018b). Sexual dimorphism in feeding apparatus and niche partitioning in juvenile jumbo squid Dosidicus gigas. Mar. Ecol. Prog. Ser. 607, 99–112. doi: 10.3354/meps12768
Hanlon, R. T., and Messenger, J. B. (2018). Cephalopod Behaviour. Cambridge: Cambridge University Press.
Hoving, H. J. T., Gilly, W. F., Markaida, U., Benoit-Bird, K. J., Brown, Z. W., Daniel, P., et al. (2013). Extreme plasticity in life-history strategy allows a migratory predator (jumbo squid) to cope with a changing climate. Glob. Chang. Biol. 19, 2089–2103. doi: 10.1111/gcb.12198
Hu, G., Boenish, R., Gao, C., Li, B., Chen, X., Chen, Y., et al. (2019). Spatio-temporal variability in trophic ecology of jumbo squid (Dosidicus gigas) in the southeastern Pacific: insights from isotopic signatures in beaks. Fish. Res. 212, 56–62. doi: 10.1016/j.fishres.2018.12.009
Hunsicker, M. E., Essington, T. E., Watson, R., and Sumaila, U. R. (2010). The contribution of cephalopods to global marine fisheries: can we have our squid and eat them too? Fish Fish. 11, 421–438. doi: 10.1111/j.1467-2979.2010.00369.x
Jackson, A. L., Inger, R., Parnell, A. C., and Bearhop, S. (2011). Comparing isotopic niche widths among and within communities: SIBER-stable isotope Bayesian ellipses in R. J. Anim. Ecol. 80, 595–602. doi: 10.1111/j.1365-2656.2011.01806.x
Kelly, J. R., and Scheibling, R. E. (2012). Fatty acids as dietary tracers in benthic food webs. Mar. Ecol. Prog. Ser. 446, 1–22. doi: 10.3354/meps09559
Lleonart, J., Salat, J., and Torres, G. J. (2000). Removing allometric effects of body size in morphological analysis. J. Theor. Biol. 205, 85–93. doi: 10.1006/jtbi.2000.2043
Logan, J. M., Jardine, T. D., Miller, T. J., Bunn, S. E., Cunjak, R. A., and Lutcavage, M. E. (2008). Lipid corrections in carbon and nitrogen stable isotope analyses: comparison of chemical extraction and modelling methods. J. Anim. Ecol. 77, 838–846. doi: 10.1111/j.1365-2656.2008.01394.x
Moltschaniwskyj, N. A. (1995). Changes in shape associated with growth in the loliginid squid Photololigo sp.: a morphometric approach. Can. J. Zool. 73, 1335–1343. doi: 10.1139/z95-157
Nigmatullin, C. M., Nesis, K. N., and Arkhipkin, A. I. (2001). A review of the biology of the jumbo squid Dosidicus gigas (Cephalopoda: Ommastrephidae). Fish. Res. 54, 9–19. doi: 10.1016/S0165-7836(01)00371-X
Oksanen, J., Blanchet, F. G., Friendly, M., Kindt, R., Legendre, P., McGlinn, D., et al. (2019). vegan: Community Ecology Package. R Package Version 2.5-4.
Pardo-Gandarillas, M. C., Lohrmann, K. B., George-Nascimento, M., and Ibáñez, C. M. (2014). Diet and parasites of the jumbo squid Dosidicus gigas in the humboldt current system. Molluscan Res. 34, 2–10. doi: 10.1080/13235818.2013.860870
Parrish, C. C. (2013). Lipids in marine ecosystems. ISRN Oceanogr. 2013, 1–16. doi: 10.5402/2013/604045
Patil, V., Källqvist, T., Olsen, E., Vogt, G., and Gislerød, H. R. (2007). Fatty acid composition of 12 microalgae for possible use in aquaculture feed. Aquac. Int. 15, 1–9. doi: 10.1007/s10499-006-9060-3
Pethybridge, H., Virtue, P., Casper, R., Yoshida, T., Green, C. P., Jackson, G., et al. (2012). Seasonal variations in diet of arrow squid (Nototodarus gouldi): stomach content and signature fatty acid analysis. J. Mar. Biol. Assoc. U.K. 92, 187–196. doi: 10.1017/S0025315411000841
Pethybridge, H. R., Nichols, P. D., Virtue, P., and Jackson, G. D. (2013). The foraging ecology of an oceanic squid, Todarodes filippovae: the use of signature lipid profiling to monitor ecosystem change. Deep. Res. Part II Top. Stud. Oceanogr. 95, 119–128. doi: 10.1016/j.dsr2.2012.07.025
Portner, E. J., Markaida, U., Robinson, C. J., and Gilly, W. F. (2019). Trophic ecology of Humboldt squid, Dosidicus gigas, in conjunction with body size and climatic variability in the Gulf of California, Mexico. Limnol. Oceanogr. 65, 732–748. doi: 10.1002/lno.11343
Post, D. M. (2002). Using stable isotopes to estimate trophic position: models, methods, and assumptions. Ecology 83, 703–718. doi: 10.1890/0012-9658(2002)083[0703:usitet]2.0.co;2
Rau, G. H., Chavez, F. P., and Friederich, G. E. (2001). Plankton 13C/12C variations in Monterey Bay, California: evidence of non-diffusive inorganic carbon uptake by phytoplankton in an upwelling environment. Deep. Res. Part I Oceanogr. Res. Pap. 48, 79–94. doi: 10.1016/S0967-0637(00)00039-X
R Core Team (2019). R: A Language and Environment for Statistical Computing. Vienna: R Foundation for Statistical Computing.
Rodhouse, P. G. K., Pierce, G. J., Nichols, O. C., Sauer, W. H. H., Arkhipkin, A. I., Laptikhovsky, V. V., et al. (2014). Environmental effects on cephalopod population dynamics. Adv. Mar. Biol. 67, 99–233. doi: 10.1016/b978-0-12-800287-2.00002-0
Rosas-Luis, R., and Chompoy-Salazar, L. (2016). Description of food sources used by jumbo squid Dosidicus gigas (D’Orbigny, 1835) in Ecuadorian waters during 2014. Fish. Res. 173, 139–144. doi: 10.1016/j.fishres.2015.08.006
Ruiz-Cooley, R. I., Gendron, D., Aguíñiga, S., Mesnick, S., and Carriquiry, J. D. (2004). Trophic relationships between sperm whales and jumbo squid using stable isotopes of C and N. Mar. Ecol. Prog. Ser. 277, 275–283. doi: 10.3354/meps277275
Ruiz-Cooley, R. I., and Gerrodette, T. (2012). Tracking large-scale latitudinal patterns of δ13C and δ15N along the E Pacific using epi-mesopelagic squid as indicators. Ecosphere 3:art63. doi: 10.1890/ES12-00094.1
Ruiz-Cooley, R. I., Markaida, U., Gendron, D., and Aguíñiga, S. (2006). Stable isotopes in jumbo squid (Dosidicus gigas) beaks to estimate its trophic position: comparison between stomach contents and stable isotopes. J. Mar. Biol. Assoc. U.K. 86, 437–445. doi: 10.1017/S0025315406013324
Ruiz-Cooley, R. I., Villa, E. C., and Gould, W. R. (2010). Ontogenetic variation of δ13C and δ15N recorded in the gladius of the jumbo squid Dosidicus gigas: geographic differences. Mar. Ecol. Prog. Ser. 399, 187–198. doi: 10.3354/meps08383
Sardenne, F., Bodin, N., Chassot, E., Amiel, A., Fouché, E., Degroote, M., et al. (2016). Trophic niches of sympatric tropical tuna in the Western Indian Ocean inferred by stable isotopes and neutral fatty acids. Prog. Oceanogr. 146, 75–88. doi: 10.1016/j.pocean.2016.06.001
Sardenne, F., Hollanda, S., Lawrence, S., Albert-Arrisol, R., Degroote, M., and Bodin, N. (2017). Trophic structures in tropical marine ecosystems: a comparative investigation using three different ecological tracers. Ecol. Indic. 81, 315–324. doi: 10.1016/j.ecolind.2017.06.001
Stewart, J. S., Gilly, W. F., Field, J. C., and Payne, J. C. (2013). Onshore-offshore movement of jumbo squid (Dosidicus gigas) on the continental shelf. Deep. Res. II Top. Stud. Oceanogr. 95, 193–196. doi: 10.1016/j.dsr2.2012.08.019
Stowasser, G., Pierce, G. J., Moffat, C. F., Collins, M. A., and Forsythe, J. W. (2006). Experimental study on the effect of diet on fatty acid and stable isotope profiles of the squid Lolliguncula brevis. J. Exp. Mar. Bio. Ecol. 333, 97–114. doi: 10.1016/j.jembe.2005.12.008
Stramma, L., Schmidtko, S., Levin, L. A., and Johnson, G. C. (2010). Ocean oxygen minima expansions and their biological impacts. Deep. Res. I Oceanogr. Res. Pap. 57, 587–595. doi: 10.1016/j.dsr.2010.01.005
Tafur, R., Villegas, P., Rabí, M., and Yamashiro, C. (2001). Dynamics of maturation, seasonality of reproduction and spawning grounds of the jumbo squid Dosidicus gigas (Cephalopoda: Ommastrephidae) in Peruvian waters. Fish. Res. 54, 33–50. doi: 10.1016/S0165-7836(01)00379-4
Tocher, D. R. (2003). Metabolism and functions of lipids and fatty acids in teleost fish. Rev. Fish. Sci. 11, 107–184. doi: 10.1080/713610925
Villéger, S., Brosse, S., Mouchet, M., Mouillot, D., and Vanni, M. J. (2017). Functional ecology of fish: current approaches and future challenges. Aquat. Sci. 79, 783–801. doi: 10.1007/s00027-017-0546-z
Voss, M., Dippner, J. W., and Montoya, J. P. (2001). Nitrogen isotope patterns in the oxygen-deficient waters of the Eastern Tropical North Pacific Ocean. Deep. Res. I Oceanogr. Res. Pap. 48, 1905–1921. doi: 10.1016/S0967-0637(00)00110-2
Keywords: Dosidicus gigas, trophic niche, stable isotope, fatty acid, feeding apparatuses, ecological diversification
Citation: Gong Y, Li Y, Chen X and Yu W (2020) Trophic Niche and Diversity of a Pelagic Squid (Dosidicus gigas): A Comparative Study Using Stable Isotope, Fatty Acid, and Feeding Apparatuses Morphology. Front. Mar. Sci. 7:642. doi: 10.3389/fmars.2020.00642
Received: 06 April 2020; Accepted: 13 July 2020;
Published: 31 July 2020.
Edited by:
Emanuele Di Lorenzo, Georgia Institute of Technology, United StatesReviewed by:
Brian Hayden, University of New Brunswick, CanadaAnwesha Ghosh, Indian Institute of Science Education and Research Kolkata, India
Copyright © 2020 Gong, Li, Chen and Yu. This is an open-access article distributed under the terms of the Creative Commons Attribution License (CC BY). The use, distribution or reproduction in other forums is permitted, provided the original author(s) and the copyright owner(s) are credited and that the original publication in this journal is cited, in accordance with accepted academic practice. No use, distribution or reproduction is permitted which does not comply with these terms.
*Correspondence: Yi Gong, ygong@shou.edu.cn; Yunkai Li, ykli@shou.edu.cn