Aerial Drones Reveal the Dynamic Structuring of Sea Turtle Breeding Aggregations and Minimum Survey Effort Required to Capture Climatic and Sex-Specific Effects
 Liam C. D. Dickson
 Hannah Tugwell
 Kostas A. Katselidis
 Gail Schofield
- 1School of Biological and Behavioural Sciences, Queen Mary University of London, London, United Kingdom
- 2National Marine Park of Zakynthos, Zakynthos, Greece
Quantifying how animals use key habitats and resources for their survival allows managers to optimise conservation planning; however, obtaining representative sample sizes of wildlife distributions in both time and space is challenging, particularly in the marine environment. Here, we used unoccupied aircraft systems (UASs) to evaluate temporal and spatial variation in the distribution of loggerhead sea turtles (Caretta caretta) at two high-density breeding aggregations in the Mediterranean, and the effect of varying sample size and survey frequency. In May–June of 2017 to 2019, we conducted 69 surveys, assimilating 10,075 inwater turtle records at the two sites. Optimal time interval between surveys to capture the dynamics of aggregations over the breeding period was <2-week intervals and >500 turtles (from the combined surveys). This minimum threshold was attributed to the core-area use of female turtles shifting across surveys in relation to wind direction to access warmer nearshore waters and male presence. Males were more widely distributed within aggregations than females, particularly in May when mating encounters were high. Most males were recorded swimming and oriented parallel to shore, likely to enhance encounter rates with females. In contrast, most females were generally stationary (resting on the seabed or basking), likely to conserve energy for reproduction, with orientation appearing to shift in relation to male numbers at the breeding area. Thus, by identifying the main factors regulating the movement and distribution of animals, appropriate survey intervals can be selected for appropriate home range analyses. Our study demonstrates the versatility of UASs to capture the fine-scale dynamics of wildlife aggregations and associated factors, which is important for implementing effective conservation.
Introduction
While conservation efforts typically focus on areas where wildlife aggregate (Prendergast et al., 1993; Myers et al., 2000), the zoning of such areas requires an understanding of what factors determine use, including resources, other animals and the environment in time and space (Margules and Pressey, 2000; Moilanen, 2005). Even within aggregations, animals continuously adjust their locations in relation to both extrinsic (e.g., weather and environment, Parrish and Edelstein-Keshet, 1999; Schofield et al., 2009; Melletti et al., 2010) and intrinsic (e.g., age and sex, Pardini et al., 2001; Bruce and Bradford, 2015) factors at fine-scales, influencing distribution patterns. For example, wind can have broad impacts across ecosystems, from improving the foraging efficiency of marine birds and cetaceans (e.g., blue whales, Gill et al., 2011; albatrosses, Weimerskirch et al., 2012; penguins, Dehnhard et al., 2013), to assisting the dispersal of terrestrial insects and plants (Nathan et al., 2002; Ahmed et al., 2009). In parallel, sex-specific responses to extrinsic factors can vary even within the same environment (e.g., elephant seals, Le Boeuf et al., 2000; bottlenose dolphins, Sprogis et al., 2016). For example, Lewis et al. (2015) found that European shags (Phalacrocorax aristotelis) exhibit sex-specific behavioural differences in foraging effort, with females investing more time than males when winds are higher and blowing onshore. Therefore, it is important to identify survey frequencies and scales that capture variation in the structuring of cohorts effectively to obtain relevant insights for ecology and protected area management (Stockwell and Peterson, 2002; Hernandez et al., 2006).
Surveying sufficient numbers of animals in a given population is challenging in the marine environment (Hussey et al., 2015), due to the difficulty of observing animals and/or the high costs of remote tracking financially limiting the number of individuals that can be monitored (Thomas et al., 2011; Hays et al., 2019). Consequently, tracking data of small numbers of animals over multiple years and/or from multiple sites are often assimilated to make generalised inferences of distributions, often with models (Block et al., 2011; Sequeira et al., 2018; Yates et al., 2018; Sequeira et al., 2019). Even when consolidating data from small numbers of individuals to generate home ranges to inform conservation zoning, the effects of parameters that change in time or space could be missed (or only partially captured), restricting the effectiveness of implemented legislation (Runge et al., 2014; O'Leary et al., 2018; Katsanevakis et al., 2020). However, the emergence of unoccupied aircraft systems (UASs) has provided a unique opportunity to acquire fine-scale information of 100s of individuals in single surveys. This makes it possible to evaluate how animals are distributed in relation to each other and the environment concurrently, with the added possibility of multiple surveys (Szantoi et al., 2017; Wang et al., 2019). As such, optimal operating protocols are being developed to standardise UAS surveys within and across taxa to allow comparisons (Raoult et al., 2020). However, the potential effects of survey frequency and sample size have yet to be explored for UASs. This directly contrasts with the wealth of studies exploring the effects of the number of animals and sampling frequency for remote tracking datasets, despite the potential for similar issues with frequency and sample size effects (Thomson et al., 2017; Sequeira et al., 2019; Shimada et al., 2020). For instance, home range size estimates are particularly impacted by sample size and bias towards individuals (Borger et al., 2006; Plotz et al., 2016; Thomson et al., 2017), therefore, it is essential to identify key parameters impacting the interpretation of UAS surveys.
As a case in point, 1000s of sea turtles have been individually GPS-tracked at breeding and foraging grounds globally (Hays and Hawkes, 2018). However, at given sites, only small numbers of animals (10s) are typically tracked, with a very strong bias towards adult females (Thomson et al., 2017; Lamont and Iverson, 2018). Yet, there is clear evidence that males and females use breeding sites differently and, often, dynamically (James et al., 2005; Arendt et al., 2011b; Schofield et al., 2013). Direct observations and remote tracking studies of sea turtles during the breeding period show that males are more active, swimming in search of mates, fighting other males for access to receptive females, and courting/mating females (Hays et al., 2001; James et al., 2005; Arendt et al., 2011b). In contrast, direct observations and remote tracking studies of females show that females primarily rest (basking or on the seabed), which has been attributed to conserving energy for egg development (Hays et al., 2000; Wallace et al., 2005; I-Jiunn, 2009; Fossette et al., 2012). Female avoidance behaviour of males has also been widely documented, potentially because encounters increase energetic expenditure, with the possible use of nearshore refuges at some sites (Booth and Peters, 1972; Lee and Hays, 2004). Males tend to depart the breeding area earlier than females (often at the onset of nesting) at many sites, possibly due to a decline in mating opportunities (Kokko and Rankin, 2006; Lee et al., 2018). Consequently, the way in which females use the breeding area might change when males are no longer present. For instance, Schofield et al. (2009) showed that female loggerhead sea turtles (Caretta caretta) at a site on the edge of the species breeding range exhibited highly dynamic, but synchronised, daily movement in response to wind direction to access warm waters. Wind also has a strong effect on fine-scale sea turtle distributions in relation to beach selection (Weishampel et al., 2006; Dickson et al., 2021), optimising body temperature (Fossette et al., 2012), and foraging habitat use (Shaver et al., 2017). Recent UAS studies have shown that the relative number of male and female turtles (operational sex ratio) shifts from being highly male-biased to highly female-biased across the breeding season (Schofield et al., 2017; Yaney-Keller et al., 2021), with behavioural differences observed in response to shifts in sex ratio, and potential effects on how the two sexes distribute over time (Schofield et al., 2006). Thus, UASs have the potential to capture the fine-scale variation in the distributions of multiple individuals in synchrony in response to intrinsic (sex-specific) and extrinsic (environmental) parameters (Schofield et al., 2019; Raoult et al., 2020). Information on the driving factors and changing structure of aggregations, within and across seasons, could improve home range calculations. This, in turn, could improve evaluations on the spatial and resource requirements that enable science-based conservation of marine wildlife (Jackson et al., 2008; Runge et al., 2014; Allen and Singh, 2016).
Here, we used UASs to evaluate temporal and spatial variation in the distribution of loggerhead sea turtles (Caretta caretta) at two high-density breeding aggregations in the Mediterranean. We also assessed the effect of varying survey frequency, and the sample size of individuals detected in surveys, on evaluations of aggregation structure. The study sites include Laganas Bay (Zakynthos Island) and Kyparissiakos Bay (western Greece), both of which support in-water turtle densities of >270 individuals per km2 (Dickson et al., 2021). We hypothesised that the aggregation structure would be highly dynamic due to both extrinsic (sea temperature and wind) and intrinsic (turtle sex) factors. Consequently, we expected the overall home range size to be strongly impacted by survey frequency (i.e., to capture all potential variability) and turtle numbers. We also hypothesised that male and female turtles would distribute and behave differently due to different strategies to optimise reproductive potential. Our results are expected to demonstrate the utility of UASs in capturing the fine-scale dynamics of aggregation structure, which could be used to design baseline protocols on minimal survey frequency and sample sizes for home range analysis using this technology.
Methods
Study Region and Species
This study was conducted in Laganas Bay (37°43′N, 20°52′E; Zakynthos Island) and in the southern part of Kyparissiakos Bay (37°26’N 21°37’E; Peloponnese) in the Ionian region of western Greece, Mediterranean Sea (Supplementary Figure S1). The two sites are situated about 85 km apart (Laganas to Kalo Nero), and are considered “major” (>100 nests/season) loggerhead sea turtle nesting areas in Greece, encompassing ~54% of average nests/season in Greece and ~26% of average nests/season in the Mediterranean (Casale and Margaritoulis, 2010; Dickson et al., 2021). In the study region, mating activity peaks from late-April to mid-May, with males departing in late-May to early June; females begin nesting in late-May until early August, with females departing from early July to early August (Schofield et al., 2013). Laganas Bay is south facing and is situated within the National Marine Park of Zakynthos. In comparison, Kyparissiakos Bay is west facing, and is situated within a European Union Natura 2000 habitat (Site Code: GR2330008) that is protected within the Kotychi–Strofylia Wetlands National Park, but it is not under active management.
Data Collection and Processing
UAS surveys were conducted using a DJI Phantom 3 Professional™ UAS (Shenzhen, China; http://www.dji.com). For all surveys, the UAS was flown at an altitude of 60 m, providing a 100 m wide field of view. From 2017 to 2019, the UAS was flown at regular intervals (between twice a week to once every 10 days) along pre-programmed (fixed) paths at the two sites (Supplementary Figure S2). Wind speed and direction during each survey was recorded by on-board sensors in the UAS and was extracted using web-based software (AirData UAV™). In Laganas Bay, the UAS was typically flown up to 400 m offshore along an 8 km stretch of coastline (based on Schofield et al., 2017), with intermittent checks to confirm the absence of turtles up to 800 m offshore. At Kyparissiakos Bay, the UAS was flown up to 800 m offshore along 8 km coastline (where the core nesting activity occurs; Margaritoulis and Rees, 2001). All UAS footage was reviewed manually by at least two independent observers. We recorded the longitude and latitude of each turtle detected on footage (accurate to within 55 cm; Dujon et al., 2021; Schofield et al., 2021), along with sex, behaviour, position in water column (i.e., seabed versus midwater, with midwater turtles having a shadow on the seabed), distance from shore and seabed depth. Previous field validation at the study site confirmed that the detection of turtles was reliably consistent at the surveyed depths and across surveys (Schofield et al., 2017). Repeated stationary UAS hover surveys at both sites (n = 19 surveys) across the season confirmed low displacement of turtles (0.17 m/s ± 0.12; n = 56), and negligible chance of being detected across multiple transects due to the high UAS speed (12.5 m/s). Male turtles were visually distinguished by the presence of a tail extending beyond the carapace (Figure 1) (Schofield et al., 2017).

Figure 1 Snapshot from UAS footage at 60 m altitude showing loggerhead sea turtles (Caretta caretta) along part of a pre-programmed transect at 0–100 m offshore. One male (left) and one female (right) are enlarged (4x, in circles), showing the tail of the male clearly protruding beyond the carapace. Sequential images along part of a path are also presented in Supplementary Figure S3.
Effect of Survey Frequency
To evaluate how survey frequency (number of surveys over time) impacted home range size, we examined how reducing survey frequency over the 2-month period changed the area and overlap of the 50% Kernel Utilisation Distribution (KUD) of the survey period compared to the baseline KUD for each site (Worton, 1989; Seaman and Powell, 1996). The 50% KUD was used over the 95% KUD, because it was preferentially used to assess protected area coverage in previous studies, with 95% KUDs tending to be too broad (March et al., 2010; Schofield et al., 2013; White et al., 2017). We evaluated the effects of 3-day, 7-day, 10-day, 14-day, 20-day, 30-day and 60-day survey intervals over the two-month breeding period for each year (3-day intervals were limited to Zakynthos 2017 only) (Supplementary Table S1). For each survey frequency period, the percentage of the 50% KUD that did not overlap with the baseline 50% KUD (50% KUD calculated from all surveys and all years combined, for each site) was quantified. We also evaluated the change to 50% KUD area calculated with varying number of turtles. All 50% KUDs were calculated using the adehabitatHR package (Calenge, 2006) and plotted in R (R Core Team, 2018), using the reference bandwidth as the chosen smoothing parameter. This package requires at least five locations to produce a KUD. To determine which factors most contributed to variation in the shape and size of the 50% KUD, particularly whether the number of surveys, year and site had a strong impact, we performed variance component analysis (VCA) using the R package VCA, which implements ANOVA and REML estimations of linear mixed models (Schuetzenmeister and Dufey, 2020). We used a residual maximum likelihood (REML) estimation, because the variables did not follow a normal distribution. The relationship between time interval between surveys and sample size was tested using Pearson’s product-moment correlation.
Stability of Aggregation Structure
To evaluate whether the structure of the aggregation was uniform or dynamic over the 2-month breeding period, we recorded the geographical position of the 50% KUD for each survey day at both sites across all three years. To test whether 50% KUDs were randomly distributed, a Bartlett test was used to test randomly generated KUDs against observed locations. Previously, Schofield et al. (2009) indicated wind-driven movement patterns of turtles on Zakynthos based on three tracked turtles and boat surveys. To examine whether this effect held at the population level, we correlated the prevailing wind direction for each survey with the 50% KUD. We used wind speeds and directions automatically recorded by the UAS during flight and validated them against local weather stations. UAS wind direction was evaluated using the openair package in R (Carslaw and Ropkins, 2019), and prevailing wind was calculated as the 30° angle that encompassed most wind records (Tošić et al., 2017). Days with strong competing winds (strong winds coming from two or more directions on the same day) were excluded. Both linear regression and circular-linear regression analyses were performed between the KUD centroid and prevailing mean wind direction for each survey, due to wind being a circular variable and the coastline linear. KUDs where there were insufficient numbers of individuals (i.e., <70 datapoints) resulting in a poorly defined core home range (spread over >95% of the survey area) were removed. The operational wind speed limit for the drone was 25 km/h; however, wind speed only exceeded this limit on 4% of potential survey days in May and June of the 3 survey years (n = 3, 0, and 4 out of 61 days/year, respectively), so the wind effects on turtles were considered representative. We recorded the longitude and latitude of each turtle detected on footage (accurate to within 55 cm; Dujon et al., 2021; Schofield et al., 2021), along with sex, behaviour, position in water column (determined by presence/absence of shadow on seabed), distance from shore and seabed depth.
Sex-Specific Home Range, Behaviour, and Orientation
The 50% KUD of males versus females was calculated for each year for Zakynthos and Kyparissiakos using comparable survey frequencies in each site (once per week and once every 10 days, respectively) for the three years combined. Because most males depart the breeding site by late May, except residents (Schofield et al., 2013), the 50% KUDs of males and females were calculated for May and June separately. To compare the 50% KUDs of males and females, we controlled for differences in sample size by sampling 100 random subsets of females in May and June of equal sample size to the number of males present in each month. The behaviour of turtles was extracted from UAS data, and grouped as mating/interacting, stationary (resting on seabed or basking) or swimming, based on visual observations of flipper beat (Hays et al., 2006). The position of turtles in the water column was determined by the presence or absence of a shadow on the seabed. Bathymetry and distance from shore were calculated from the UAS path. The orientation of turtles was measured using MB ruler (MB-Softwaresolutions ©2021), based on head direction, flipper position, and carapace shape. For our analyses, we only used turtles from the central 2-km section of both sites across the three years to allow comparison, due to both having extremely low frequency of human swimmers (Schofield et al., 2021), being situated over submerged sandbanks and backed by dunes. The orientation of non-interacting turtles (to exclude the effects of interacting/mating turtles) was evaluated in relation to wind direction, magnetic north (Begall et al., 2008), sea current and shore. The Hermans-Rasson test was used to determine if orientation was non-random, as this test has been shown to outperform the Rayleigh test when data departs from unimodality (Landler et al., 2019). Visual analysis of circular histograms identified the two modes as diametrically opposite. Circle plots were generated following the methods of Begall et al. (2008) and Buttarazzi et al. (2018) for circular data of bimodal distributions using r value and means.
Results
Data Overview
A total of 41 and 27 surveys were completed at Zakynthos and Kyparissiakos, respectively, in May and June of 2017 to 2019. Overall, 8,972 locations of 10,057 sea turtles were recorded at the two sites combined (mating pairs were counted as a single location). The number of female turtles increased across the survey period, peaking at 250 and 459 turtles in June at Zakynthos and Kyparissiakos, respectively. In contrast, male numbers peaked in May (survey max. n = 81 and n = 100 males at Zakynthos and Kyparissiakos, respectively) and dropped in June (survey max. n = 32 and n = 68 males at Zakynthos and Kyparissiakos, respectively).
Survey Frequency
The shape of the 50% KUD for the two-month period varied across the three years at both sites (Figures 2A, B), particularly in 2017 on Zakynthos compared to the other two years (Figure 2B), with the area being 23% larger compared to the other years (Figures 2A, B). Pearson’s product-moment correlation of the number of surveys showed a strong positive correlation with sample size (r = 0.84, t = 8.7461, df = 32, P < 0.0001), which was attributed to more frequent surveys containing more turtles, and so greater sample sizes. VCA showed that the number of surveys and year primarily contributed to variance in the percentage overlap of KUDs (14.5% and 26.5%, respectively), whereas site did not (0%). Interestingly, the combined effect of year and site was 51.95%, while that of the number of surveys was 25.5%. The effect of the number of surveys on the overlap with baseline KUD was supported by the linear regression analysis, which showed higher overlap with declining time interval (F1,32 = 11.32, P < 0.01; Figures 2C–E). Linear regression analysis also showed that there was higher overlap with baseline KUD with increasing number of turtles (F1,28 = 75, P < 0.001; Figure 2F). Thus, surveys spanning multiple years, and <2-week intervals (5 surveys over 11 weeks) with >500 turtles (from the combined surveys) are required to generate survey period home-ranges that capture the full area used by turtles.
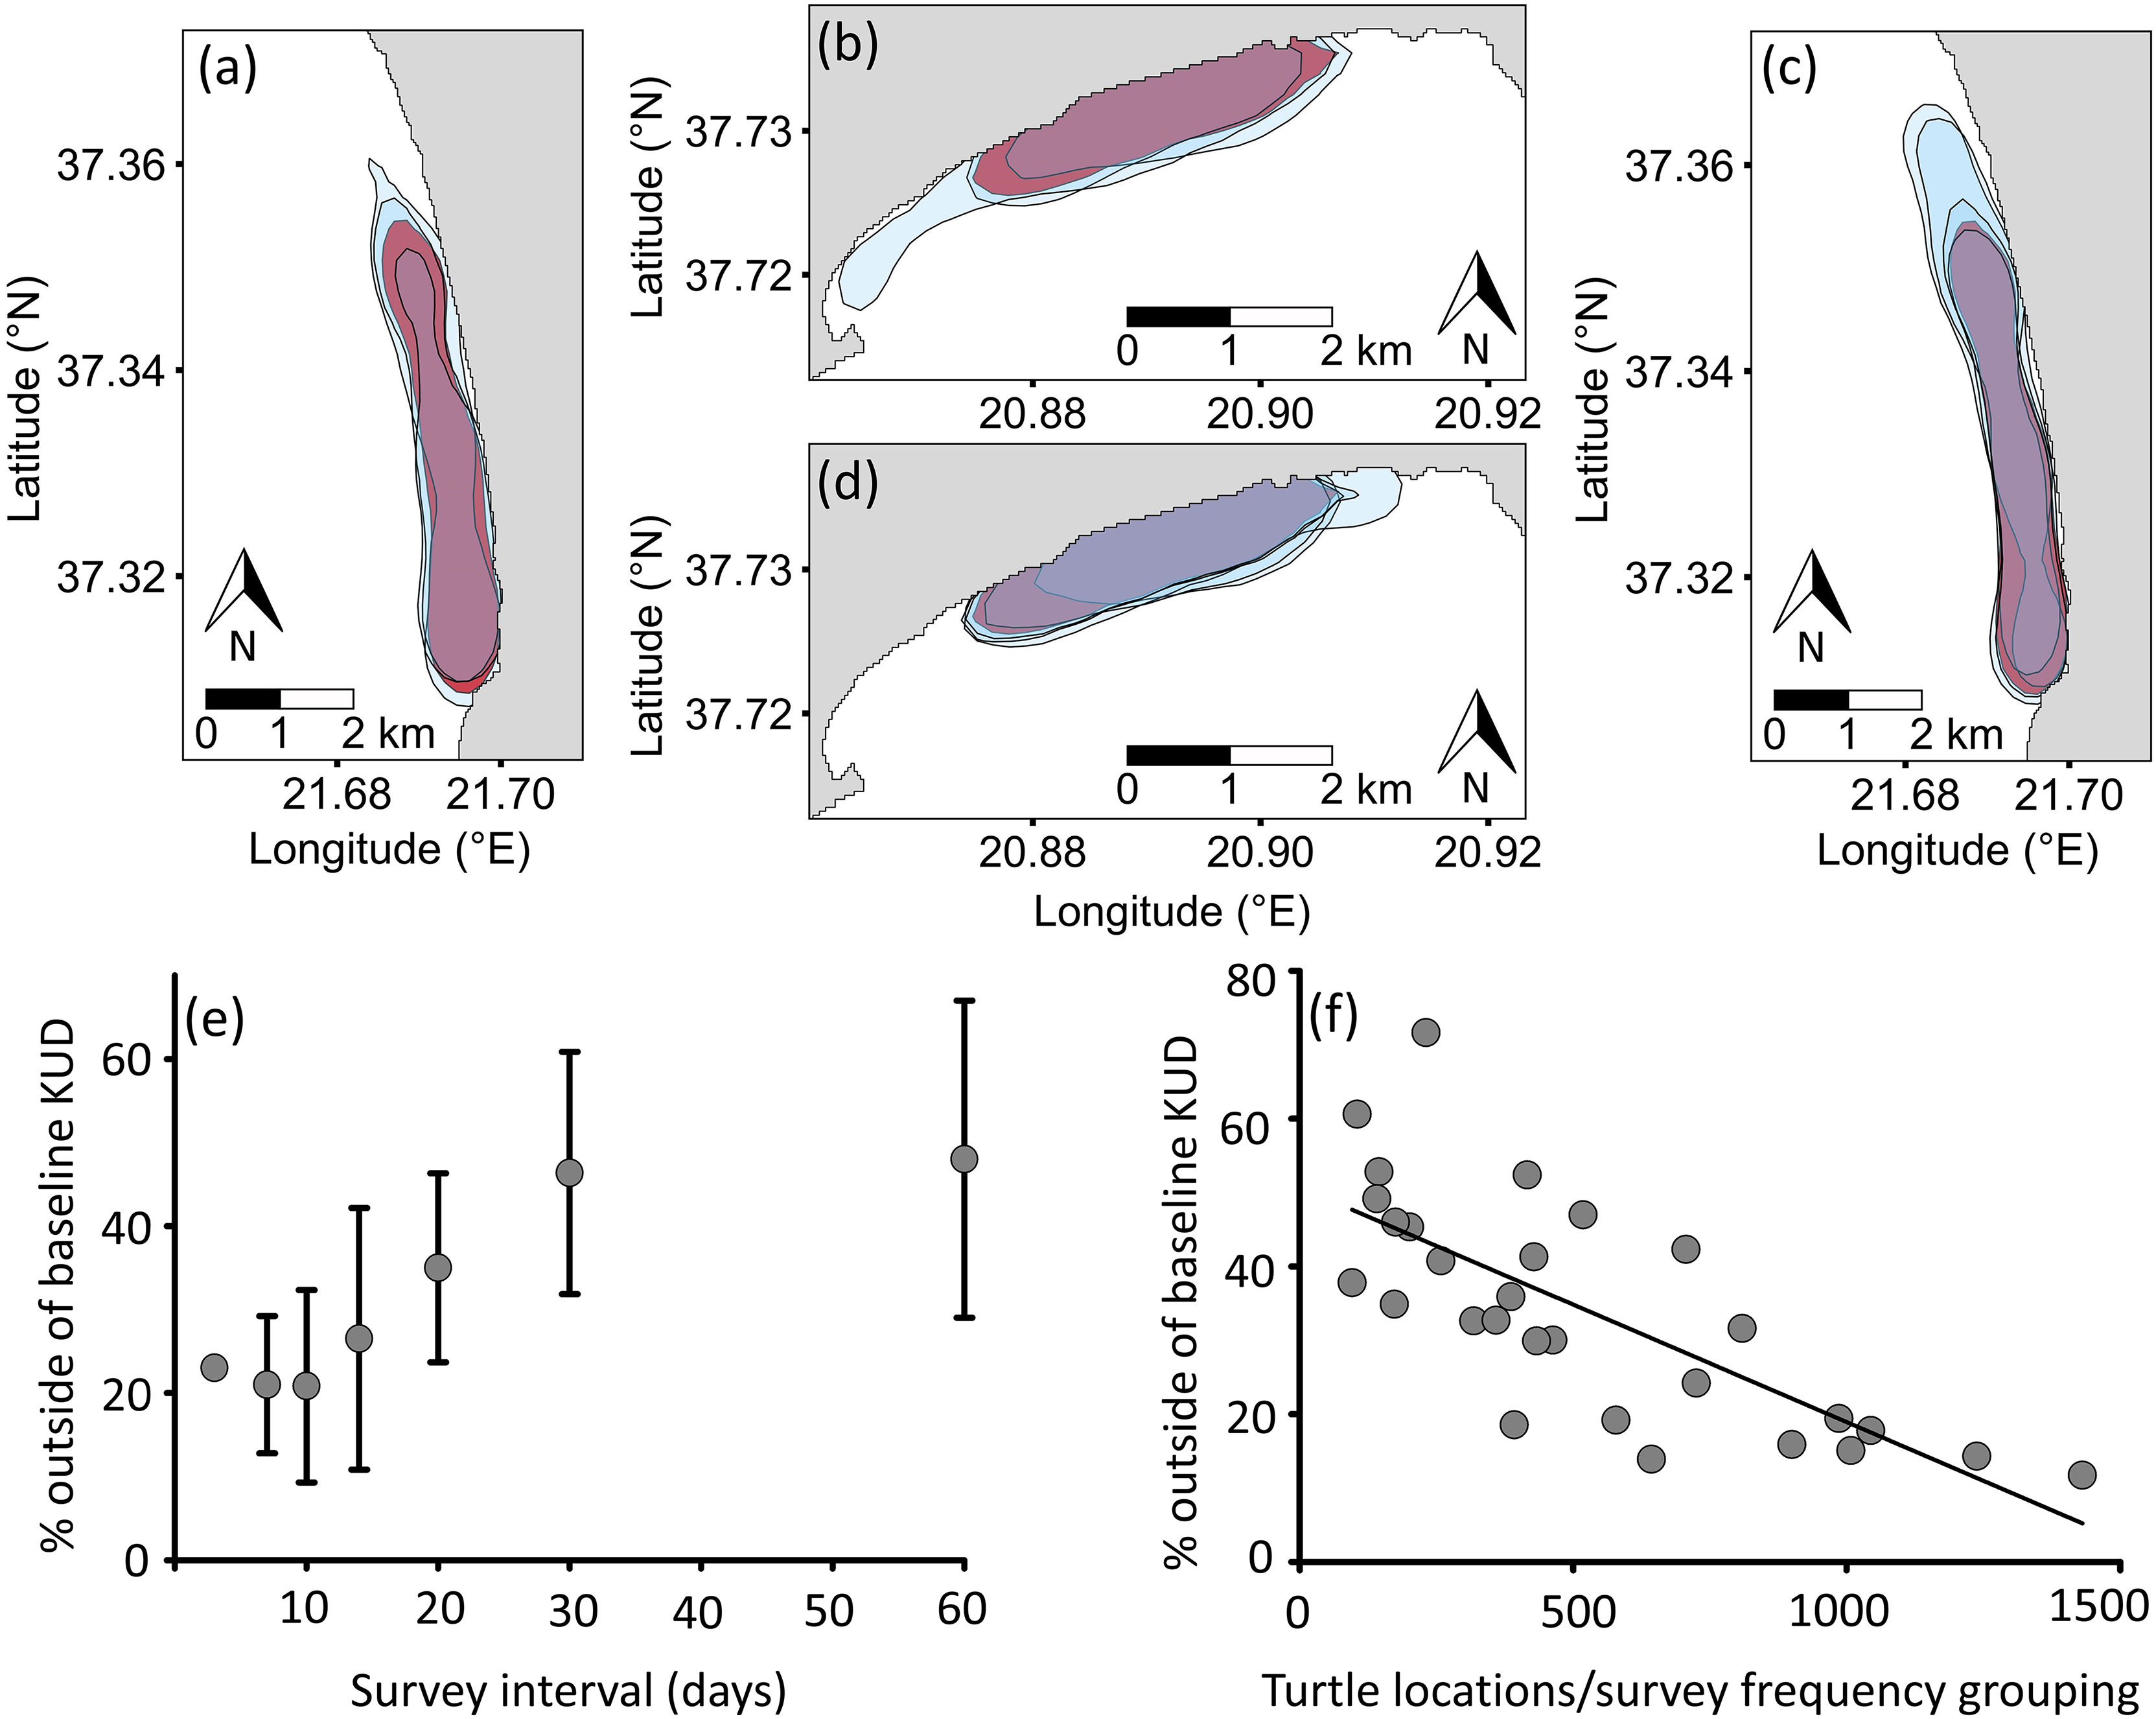
Figure 2 Variability in 50% Kernel Utilization Distribution (KUD) of loggerhead sea turtles (Caretta caretta) during the breeding period (May-June) with respect to (A, B) year and baseline and (C, D) sampling frequency within years and baseline at Kyparissiakos (A, C) and Zakynthos (B, D). Blue shading represents 50% KUDs of the three survey years (900-1470 locations Kyparissiakos; 815-1431 locations Zakynthos); red shading represents the combined 50% KUD of the three years (used as baseline; 3608 locations Kyparissiakos; 3232 locations Zakynthos). (C, D) Blue shading represents 50% KUDs of the tested survey frequencies (E), and red shading represents baseline. (E) Within year sampling frequency impacted the representativeness of KUDs, along with (F) the number of turtle locations recorded across surveys (F1,28 = 75, P < 0.001).
Stability of Aggregation Structure
At both Zakynthos and Kyparissiakos, the fine-scale positioning of daily aggregations was highly dynamic, with KUD centroid shifting with mean prevailing wind direction (linear regression; Zakynthos: n = 3131 turtles on 27 days, F1,25 = 16.18, P < 0.001; Kyparissiakos: n = 3805 turtles on 18 days, F1,16 = 10.64, P < 0.001) (Figures 3A–F). This association between core aggregation centroid and wind held for both sites when run with a circular-linear regression model (Zakynthos: t = 6.349, P < 0.001; Kyparissiakos: t = 8.052, P < 0.001). Specifically, at Zakynthos, when prevailing wind was from the north, the core part of the aggregation shifted to the southwest part of the survey area, whereas when prevailing wind was from the south, the core aggregation shifted to the northeast part of the survey area. The same pattern was detected at Kyparissiakos. Thus, wind direction correlates with the fine-scale distribution of turtles within breeding aggregations.

Figure 3 (A, B) Wind-associated shifts in the fine-scale positioning of sea turtle aggregations (50% KUD centroid) along the 8-km coastal areas of Laganas Bay on Zakynthos Island (n = 3131 turtles on 27 days, F1,25 = 16.18, P < 0.001) and Kyparissiakos Bay on mainland Greece (n = 3805 turtles on 18 days, F1,16 = 10.64, P < 0.001) based on UAS surveys in 2017–2019. Examples show the 50% KUD (red shading) of sea turtle aggregations (green dots) on two days with different wind directions for (C, E) Laganas Bay and (D, F) southern Kyparissiakos Bay.
Sex-Specific Home Range, Behaviour, and Orientation
At both sites, the 50% KUD of males were similar in May and June, despite lower male numbers in June, whereas that of females in June contracted by 20% and 16% at Zakynthos and Kyparissiakos, respectively, compared to the 50% KUD area in May (Figures 4A, B; Supplementary Figure S4). Males were consistently more widely distributed than females, and the male 50% KUD (50% KUDzak = 2.456 km2; 50% KUDkyp = 5.148 km2) was outside the 95% distribution of the theoretical 50% KUD of females in both months (95% distribution KUDzakmay = 2.015 – 2.177 km2; 95% distribution KUDzakjune = 1.665 – 2.223 km2; 95% distribution KUD kypmay = 4.517 – 4.936 km2; 95% distribution KUDkypjune = 4.254 - 4.773 km2), even when differences in sample size between males and females were controlled for. Over 70% of turtles (males and females combined) were recorded within 200 m of shore on Zakynthos, while the equivalent percentage was more spread over the first 400 m of shore at Kyparissiakos, in May and June of all three years. Most females were stationary and were observed resting on the seabed or basking at both sites in both months, whereas most males were recorded swimming (x2 = 4457.8, P < 0.0001). Of the stationary females, ~60% primarily rested on the seabed on Zakynthos, whereas 75-95% of females at Kyparissiakos were basking (x2 = 2077.8, P < 0.0001). Despite these differences in resting strategies at the two sites, females appeared to be oriented in a similar way, switching from being predominantly diagonal to shore in May to more widely spread in June. Female orientation had a slight tendency to be parallel to shore (Figures 4D, E) and was statistically non-random in both months (May: T = 14.19, P < 0.001, n=727; June: T = 25.18, P < 0.001, n=1540). Sufficient numbers of solitary males (not mating or interacting) were only detected in May, and were oriented parallel to shore at both sites, with a statistically non-random bimodal orientation (Figure 4C; T = 10.97, P < 0.01). No correlation was detected with wind direction, magnetic north, or sea current.
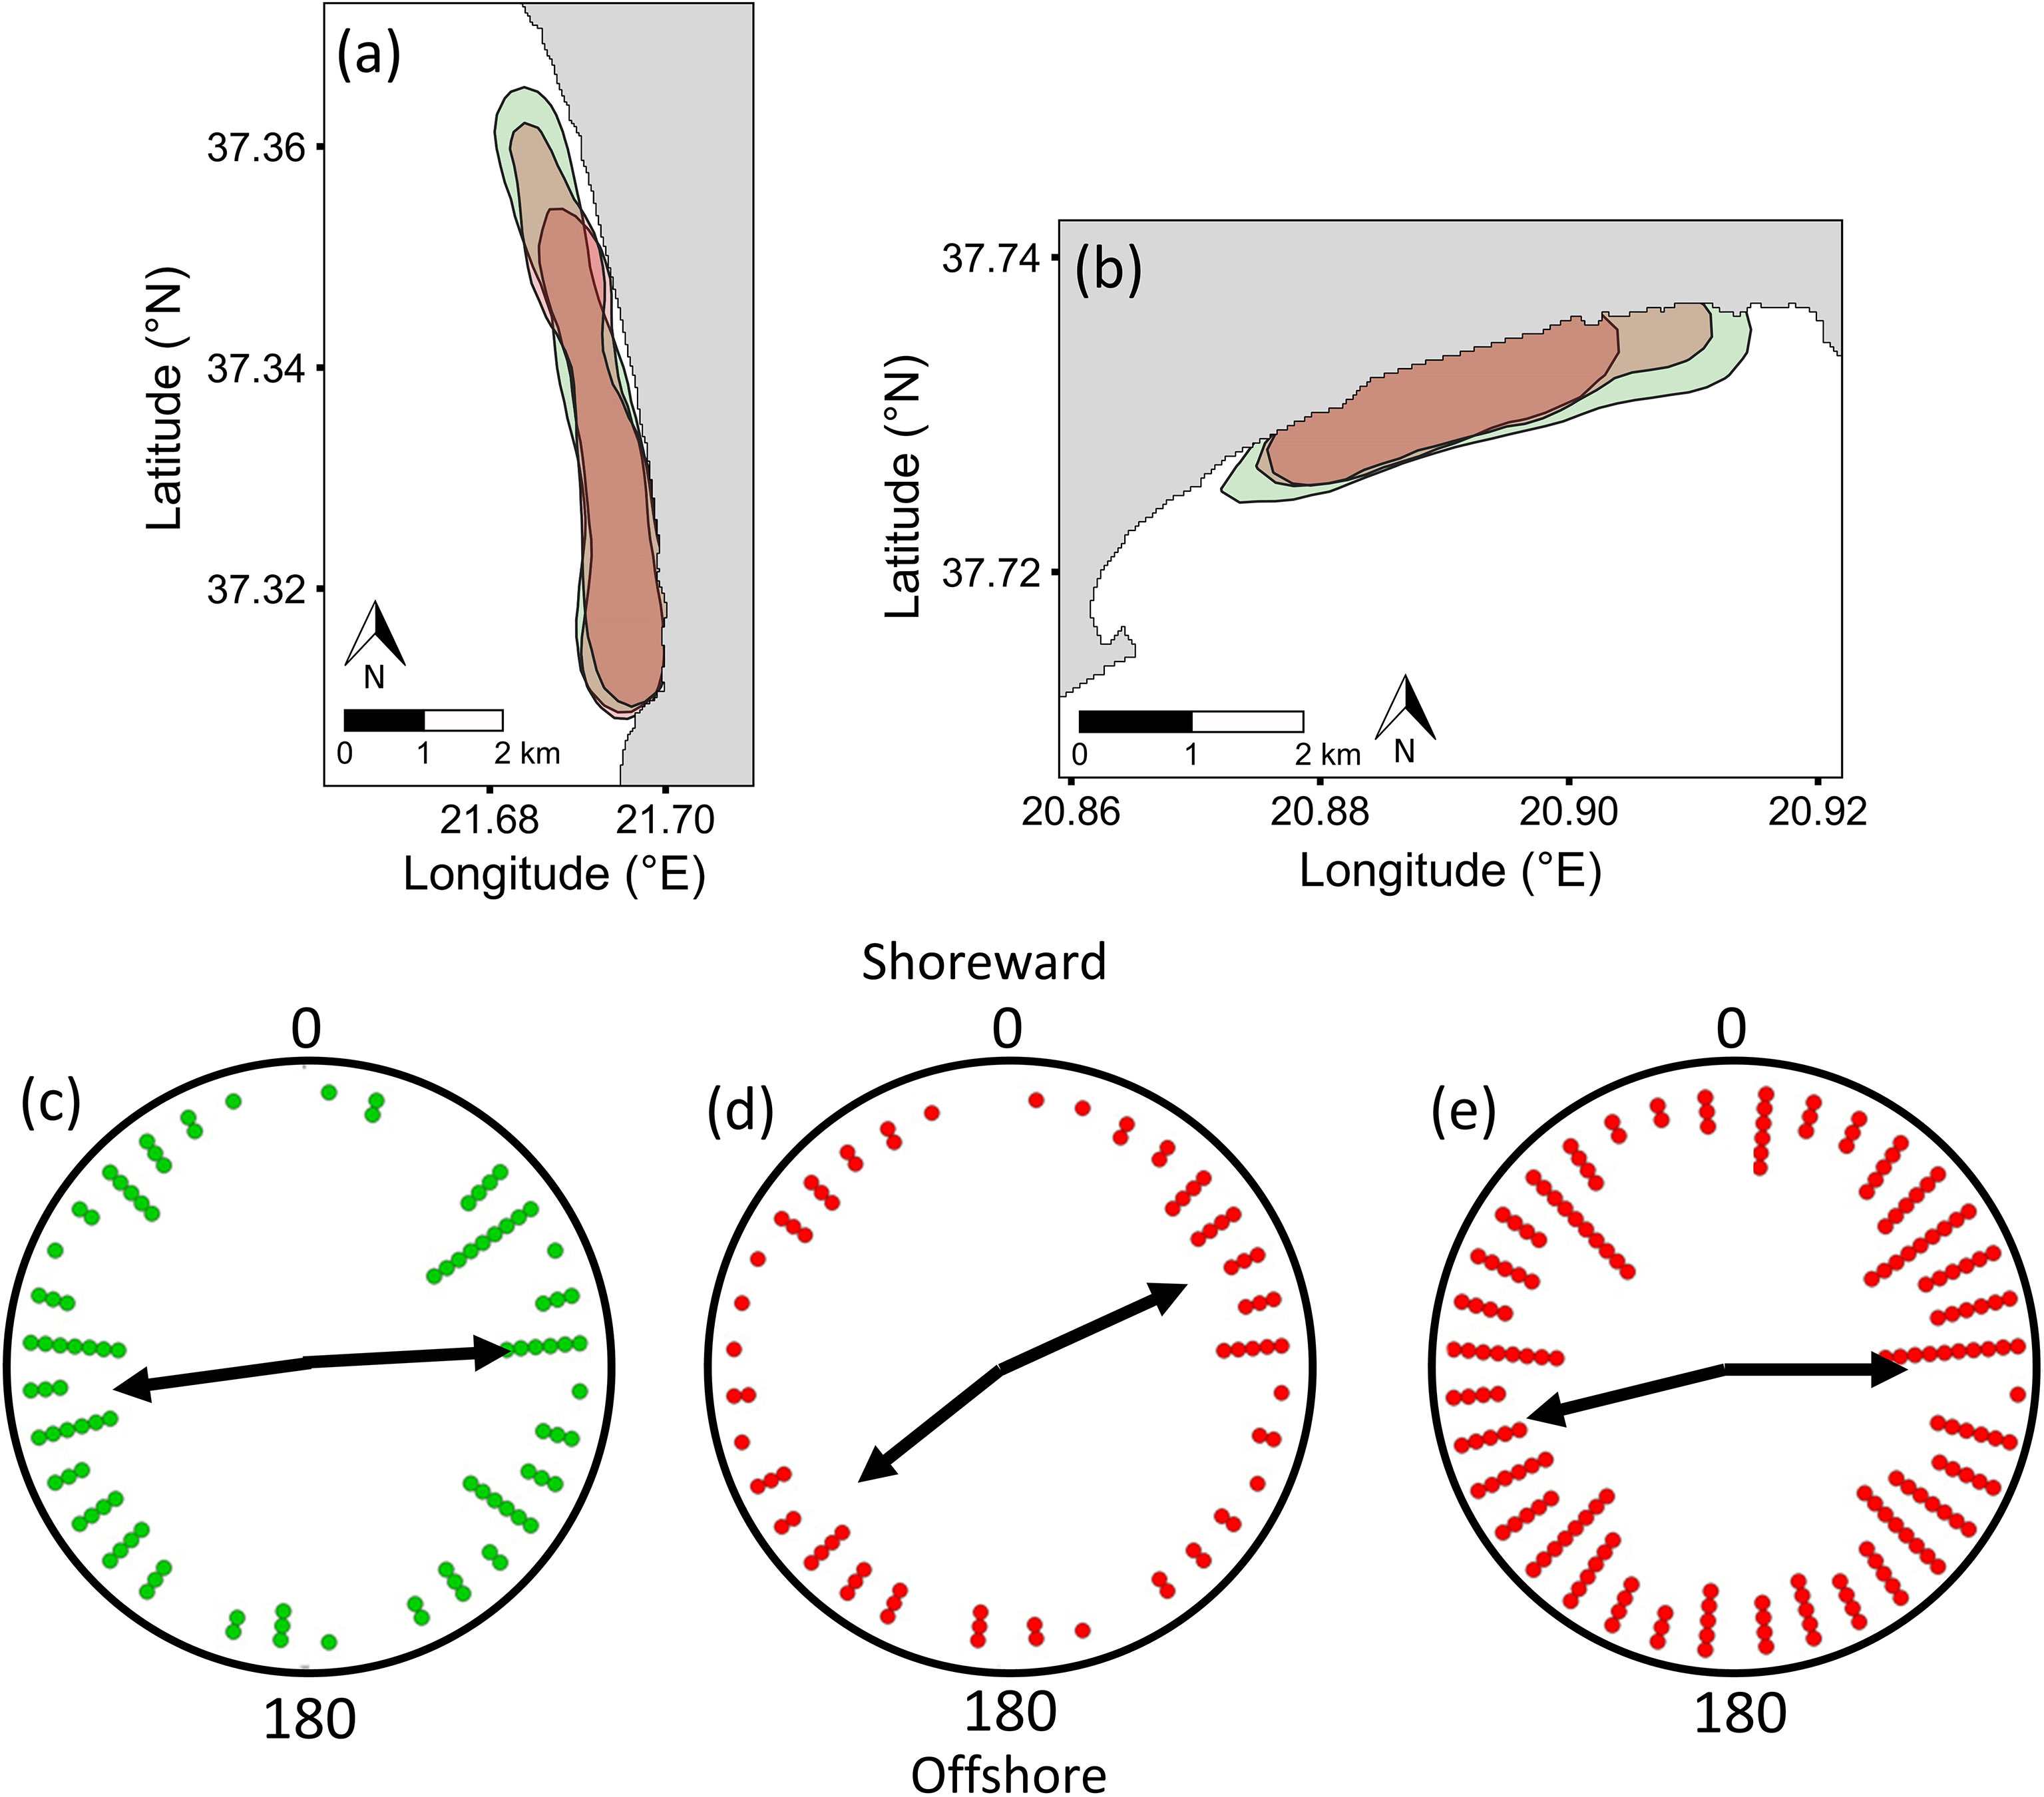
Figure 4 Variability in the 50% Kernel Utilisation Distribution (KUD) of male (May and June surveys combined: green fill) and female (May: larger red fill; June: smaller red fill) loggerhead sea turtles at (A) Kyparissiakos and (B) Zakynthos. For solitary turtles at both sites (data were combined as the same bimodal trends were detected), (C) males were oriented parallel to shore in May (left-right or right-left), whereas (D) females were oriented diagonally to shore in May and (E) parallel, but with high variability, in June. Data are presented in 10-degree bins; circular means for each mode are shown as black arrows. Female count values for each bin were divided by 7 to allow comparison with male values.
Discussion
Here, we used UAS surveys to show the fine-scale structuring of two sea turtle breeding aggregations, revealing the effects of both environmental variables and sex-specific traits. We confirmed that the positioning of aggregations changed in response to wind direction supporting previous boat-based surveys, and was attributed to females seeking temporary warmer nearshore waters to mature eggs before nesting at these thermally suboptimal breeding sites (Schofield et al., 2009; Fossette et al., 2012). Aggregation structure also changed as the relative numbers of males and females changed across the breeding season. The broader distribution of males compared with females, in addition to different behaviours (swimming versus resting in females) and orientations, likely increases their chances of encountering females (Schofield et al., 2010; Arendt et al., 2011b). Our study demonstrated the importance of using sufficient survey intervals to capture variation in aggregation structure and strengthen the design of protection zoning.
This study confirmed the potential of UASs to monitor wildlife aggregations, generating large volumes of highly accurate locations (Hodgson et al., 2013; Johnston, 2019; Dujon et al., 2021; Oleksyn et al., 2021). This allowed us to extend existing guidelines on UAS survey approaches (Sykora-Bodie et al., 2017; Raoult et al., 2020) to provide suggestions on minimum survey effort at both our study sites, which were located approximately 80 km from one another. Establishing minimum survey effort is important for acquiring sufficient data for balanced analysis, while meeting logistical and budgetary limitations (James et al., 1999; Bottrill et al., 2008). Based on our results, we advise that the minimum survey effort suggested here to capture survey period home ranges should be used as a guide, as it would likely alter depending on the geographical location of site (i.e., temperate versus tropical), life-stage, sex-specificity, species and environment, with it being important to establish factors affecting variability first on a site-specific basis. For instance, assessments of survey effort of terrestrial, avian and marine vertebrates using established monitoring approaches (e.g., line transect surveys, constant-effort-search surveys, capture-recapture) have demonstrated significant geographical and seasonal heterogeneity (e.g., wetland birds, Calladine et al., 2009; Wiest and Shriver, 2016; fin and sperm whales, Mannocci et al., 2018; bottlenose dolphins, Symons et al., 2018). Specifically, boat-based transects to quantify the size of cetacean populations range from six times a month at some locations (Smith et al., 2016) to two times a month during summer months only (Nykänen et al., 2020), with the latter potentially impeding records of recruitment and/or detection of growth/decline and associated factors (Wilson et al., 1999; Symons et al., 2018). For marine turtles, UASs provide an unprecedented opportunity to estimate the actual size of breeding populations empirically, including both males and females, which is not possible when using beach-monitoring counts alone that are based only on the female component of the population (i.e., track, nest or female counts), and typically require modelling approaches to infer population size (Jolly-Seber models [POPAN] or multi-state open robust design [MSORD]) (Chaloupka and Limpus, 2004; Pfaller et al., 2013; Schofield et al., 2017; Whiting et al., 2020). For instance, some programs monitor the tracks/nests of female turtles from daily to less frequently (weekly to monthly) in some regions, while others monitor tracks/nests or females during the peak period of nesting (2-4 weeks only) (Pfaller et al., 2013; Whiting et al., 2020), and lack information on male numbers because they do not emerge on beaches. Integration of UAS surveys with beach-based monitoring programs could therefore help towards standardising differing monitoring practices, facilitating more holistic evaluations of global trends (Mazaris et al., 2017; Sequeira et al., 2019).
We showed that even one UAS survey at the peak of the breeding season could capture the overall home range of breeding sea turtles, with 50% KUDs for single-surveys similar to that generated from remote tracking datasets (Schofield et al., 2013). Furthermore, by timing surveys to coincide with peak periods of breeding area use (Limpus et al., 2003; Whiting et al., 2013), UASs could be used to conduct scoping surveys to detect habitat use inside and outside of aggregations (Dickson et al., 2021). However, as UASs only capture the distribution of wildlife within surveyed areas, combining them with other approaches, such as remote tracking of individuals (Hart and Hyrenbach, 2009; Wilmers et al., 2015), could be used to validate survey area selection and establish connectivity across surveyed sites. Of note, our results showed that, with long intervals between surveys (e.g., once or twice per breeding season), the survey period home range only partially captured the area used by aggregations, as information on the influence of extrinsic and intrinsic parameters was incomplete (Morrell and James, 2008; Marshall et al., 2011). Furthermore, as shown by our data, inter-annual variation in environmental conditions leads to major differences in how aggregations distribute (Harris et al., 1990; Borger et al., 2008). Thus, capturing within season and across season patterns in the positioning and structuring of aggregations could help improve the placement of zoning in MPAs, particularly allowing for appropriately sized buffers between wildlife and human use zones. (Borger et al., 2008; Laver and Kelly, 2008). For instance, many marine protected areas contain no-use zones, recreational zones and/or fishing zones (Edgar et al., 2014; Watson et al., 2014; McCauley et al., 2015), which, if not properly aligned with the home ranges of wildlife, might not adequately mitigate the risk of disturbance, trauma or potentially fatal interactions, such as boat strikes (e.g., dugongs, Hodgson and Marsh, 2007; cetaceans, Mullen et al., 2013; and turtles, Shimada et al., 2017; Wright et al., 2020).
Our study showed that the distribution of sea turtles at both sites shifted in relation to wind, supporting existing studies in this study region (Schofield et al., 2007; Schofield et al., 2009; Dickson et al., 2021). Wind impacts sea turtles in different ways depending on life stage and habitat. For instance, Hays et al. (2003) reported artificially displaced adult turtles using windborne (olfactory and/or auditory) cues to actively relocate nesting beaches, while sea turtle hatchlings likely use (wind-driven) ocean surface currents as a method of semi-passive transport (Lohmann et al., 2001; Hays et al., 2010). Therefore, UAS survey frequencies would need to be adjusted with life stage and environment to capture these different dynamics. Shifts in the distribution of marine wildlife in response to wind have been widely documented (e.g., fish, Jadot et al., 2006; albatrosses, Weimerskirch et al., 2012; Green et al., 2014; sea turtles, Shaver et al., 2017). For instance, some species actively move with wind to form large aggregations (e.g., jellyfish, Fossette et al., 2015), to benefit from migratory transport to foraging regions (e.g., northern fur seals, Ream et al., 2005), or to enhance breeding success (e.g., albatrosses, Weimerskirch et al., 2012). In comparison, some species drift with winds and currents, which can sometimes be beneficial, as in the transport of fish larvae from spawning to nursery areas (Norcross and Shaw, 1984) or controlling depth-regulatory behaviour in larval crustaceans (Naylor, 2006). However, regardless of whether movement is active or passive, shifts in the positioning of aggregations in response to environmental factors could place animals at higher risks of anthropogenic threats if maritime zoning does not incorporate such effects (Green and Starr, 2011). For instance, on Zakynthos, the core aggregation shifts across the three national park protection zones depending on wind direction, and occurs in the two lesser protected zones in most surveys (vessel activity of 6 knots permitted). The zoning of this national park was delineated based on the numbers of nests supported by beaches, rather than the in-water habitats used by turtles. While the marine park was designated based nesting on beaches, the emerging in-water distribution data can be used to show the value of the park (and hence provide evidence for its continuation), as well as providing information to improve management, essentially “fine-tuning” the management using turtle movement data (Hays et al., 2019). In particular, it is important to identify the key parameters driving the structure of aggregations, which, in turn could be used to implement real-time management strategies (termed dynamic ocean management) (Bates et al., 2018; Rilov et al., 2019). For instance, the TurtleWatch program incorporates near real-time SST into prediction models, allowing the dynamic management of loggerhead and leatherback turtles within Hawaiian swordfish fishing grounds, which has possibly reduced bycatch (Howell et al., 2015). Dynamic management has also been implemented in coastal zones, for example using wind, chlorophyll-a concentrations, and SST to manage the overlap of shipping routes with blue whales off the coast of California, reducing the risk of ship strikes (Hazen et al., 2017). Our results demonstrate the utility of UASs in capturing key drivers of entire aggregations, which could be used to manage coastal MPAs in real time.
In addition to environmental drivers, animal distributions are also influenced by biotic interactions (Dill, 1987; Couzin et al., 2005). UASs provided us with a unique opportunity to explore the distributions and behaviours of males and females, and how their distribution changed when just one sex (males) departed the area. As expected, males and females used the breeding area differently, with different distributions, behaviours, and orientation patterns. Males generally had broader home ranges and were generally swimming parallel to shore, likely to increase encounter rates with females. In contrast, females had narrower home ranges and were generally resting (on the seabed or in the water column), likely to enhance egg maturation rates before nesting (Hays et al., 1999; Wallace et al., 2005; Fossette et al., 2012). On Zakynthos mating activity peaks in late April-early May, with males generally departing when females are no longer receptive to mating (Schofield et al., 2008; Schofield et al., 2017), and given the close geographic proximity of the southern section of Kyparissiakos Bay (85 km distant), and our results, we suggest a similar pattern occurs at this location. Previous studies suggested that female turtles use refuges to avoid harassment by males (Booth and Peters, 1972; Lee and Hays, 2004); however, our UAS surveys showed that females became more strongly aggregated once males departed. This might reflect higher receptivity to males during May, with the broader distribution increasing encounter rates, and the need to access warm nearshore water in June to mature eggs, with a narrower nearshore distribution. Furthermore, the orientation of females changed when male numbers dropped, possibly due to a reduction in harassment (Pilastro et al., 2003; Lee and Hays, 2004). Differences in the movement patterns and area use of male versus female turtles during breeding and non-breeding periods have also been detected by previous studies. For instance, the males of both loggerhead and hawksbill turtles tend to migrate shorter distances to foraging grounds compared to females (Van Dam et al., 2008; Arendt et al., 2011a; Schofield et al., 2020). Schofield et al. (2020) also showed sex-specific differences in foraging area use leads to lower survival rates in males. Similar differences have been detected for other wildlife too, primarily in relation to overlap with human activities (Szekely et al., 2014; Weimerskirch, 2018; Gownaris and Boersma, 2019). For instance, Jiménez et al. (2016) and Weimerskirch (2018) reported that the females of great albatrosses (Diomedea spp.) are subject to higher mortality by fisheries compared to males due to their foraging at lower latitudes, with similar reasons for female-biased mortality being recorded in false killer whales (Pseudorca crassidens) (Baird et al., 2015). These studies on sea turtles and other marine life reinforce the importance of removing research bias towards females in sea turtle research (Rees et al., 2018). While our study did not test for mortality risk across sexes, the difference in spatial use suggests that our results could be used to evaluate mortality risk in future studies.
This study demonstrates the utility of UAS surveys to capture the dynamics in the positioning and structuring of sea turtles within breeding aggregations in relation to each other and the surrounding environment. We showed that breeding sea turtle aggregations at our two study sites were highly sensitive to wind (to gain access to warmer waters) and the presence of the opposite sex. Our results support the importance of incorporating these dynamics in protected area management, to ensure that zoning captures all habitat needs of wildlife. While we delineated minimum survey frequencies for UASs here, these were life-stage and habitat specific, and will likely vary across different populations, life-stages, species and environmental settings. Through showing the possibility of UASs to monitor wildlife at the scale of typical protected areas, we showed their potential for strengthening and integrating existing information on wildlife ecology, and towards delineating effective zoning within protected areas.
Data Availability Statement
The original contributions presented in the study are publicly available. This data can be found here: 10.5061/dryad.wdbrv15rc.
Ethics Statement
Ethical review and approval was not required for the animal study because no handling or manipulation of animals was involved.
Author Contributions
Conceptualization, GS. Field work, LD, KAK, and GS. Formal analysis, LD, HT, and GS. Writing—original draft preparation, LD and GS. Writing—review and editing, LD, KAK, HT, and GS. Supervision, GS. Funding acquisition, GS. All authors have read and agreed to the published version of the manuscript.
Funding
This research was funded by Queen Mary University of London (UK). Approval was given by the Greek Ministry of Environment (Permit: 151503/162 and 181806/941).
Conflict of Interest
The authors declare that the research was conducted in the absence of any commercial or financial relationships that could be construed as a potential conflict of interest.
Publisher’s Note
All claims expressed in this article are solely those of the authors and do not necessarily represent those of their affiliated organizations, or those of the publisher, the editors and the reviewers. Any product that may be evaluated in this article, or claim that may be made by its manufacturer, is not guaranteed or endorsed by the publisher.
Acknowledgments
This work was funded by Queen Mary University of London (UK). Approval was given by the Greek Ministry of Environment (Permit: 151503/162 and 181806/941). We thank the anonymous reviewers and handling editor for providing constructive suggestions. We thank Kostas Poirazidis, Joshua Simcock, Kesten Laverty, and Liam Nash for providing fieldwork assistance.
Supplementary Material
The Supplementary Material for this article can be found online at: https://www.frontiersin.org/articles/10.3389/fmars.2022.864694/full#supplementary-material
References
Ahmed S., Compton S. G., Butlin R. K., Gilmartin P. M. (2009). Wind-Borne Insects Mediate Directional Pollen Transfer Between Desert Fig Trees 160 Kilometers Apart. Proc. Natl. Acad. Sci. U. S. A. 106 (48), 20342–20347. doi: 10.1073/pnas.0902213106
Allen A. M., Singh N. J. (2016). Linking Movement Ecology With Wildlife Management and Conservation. Front. Ecol. Evol. 3. doi: 10.3389/fevo.2015.00155
Arendt M. D., Segars A. L., Byrd J. I., Boynton J., Schwenter J. A., Whitaker J. D., et al. (2011a). Migration, Distribution, and Diving Behavior of Adult Male Loggerhead Sea Turtles (Caretta Caretta) Following Dispersal From a Major Breeding Aggregation in the Western North Atlantic. Mar. Biol. 159 (1), 113–125. doi: 10.1007/s00227-011-1826-0
Arendt M. D., Segars A. L., Byrd J. I., Boynton J., Whitaker J. D., Parker L., et al. (2011b). Distributional Patterns of Adult Male Loggerhead Sea Turtles (Caretta Caretta) in the Vicinity of Cape Canaveral, Florida, USA During and After a Major Annual Breeding Aggregation. Marine Biol. 159 (1), 101–112. doi: 10.1007/s00227-011-1793-5
Baird R. W., Mahaffy S. D., Gorgone A. M., Cullins T., McSweeney D. J., Oleson E. M., et al. (2015). False Killer Whales and Fisheries Interactions in Hawaiian Waters: Evidence for Sex Bias and Variation Among Populations and Social Groups. Mar. Mammal Sci. 31 (2), 579–590. doi: 10.1111/mms.12177
Bates A. E., Helmuth B., Burrows M. T., Duncan M. I., Garrabou J., Guy-Haim T., et al. (2018). Biologists Ignore Ocean Weather at Their Peril. Nature 560 (7718), 299–301. doi: 10.1038/d41586-018-05869-5
Begall S., Cerveny J., Neef J., Vojtech O., Burda H. (2008). Magnetic Alignment in Grazing and Resting Cattle and Deer. Proc. Natl. Acad. Sci. U. S. A. 105 (36), 13451–13455. doi: 10.1073/pnas.0803650105
Block B. A., Jonsen I. D., Jorgensen S. J., Winship A. J., Shaffer S. A., Bograd S. J., et al. (2011). Tracking Apex Marine Predator Movements in a Dynamic Ocean. Nature 475 (7354), 86–90. doi: 10.1038/nature10082
Booth J., Peters J. A. (1972). Behavioural Studies on the Green Turtle (Chelonia Mydas) in the Sea. Anim. Behav. 20 (4), 808–812. doi: 10.1016/S0003-3472(72)80155-6
Borger L., Dalziel B. D., Fryxell J. M. (2008). Are There General Mechanisms of Animal Home Range Behaviour? A Review and Prospects for Future Research. Ecol. Lett. 11 (6), 637–650. doi: 10.1111/j.1461-0248.2008.01182.x
Borger L., Franconi N., De Michele G., Gantz A., Meschi F., Manica A., et al. (2006). Effects of Sampling Regime on the Mean and Variance of Home Range Size Estimates. J. Anim. Ecol. 75 (6), 1393–1405. doi: 10.1111/j.1365-2656.2006.01164.x
Bottrill M. C., Joseph L. N., Carwardine J., Bode M., Cook C., Game E. T., et al. (2008). Is Conservation Triage Just Smart Decision Making? Trends Ecol. Evol. 23 (12), 649–654. doi: 10.1016/j.tree.2008.07.007
Bruce B., Bradford R. (2015). Segregation or Aggregation? Sex-Specific Patterns in the Seasonal Occurrence of White Sharks Carcharodon Carcharias at the Neptune Islands, South Australia. J. Fish Biol. 87 (6), 1355–1370. doi: 10.1111/jfb.12827
Buttarazzi D., Pandolfo G., Porzio G. C. (2018). A Boxplot for Circular Data. Biometrics 74 (4), 1492–1501. doi: 10.1111/biom.12889
Calenge C. (2006). The Package “Adehabitat” for the R Software: A Tool for the Analysis of Space and Habitat Use by Animals. Ecol. Modelling 197 (3-4), 516–519. doi: 10.1016/j.ecolmodel.2006.03.017
Calladine J., Garner G., Wernham C., Thiel A. (2009). The Influence of Survey Frequency on Population Estimates of Moorland Breeding Birds. Bird Study 56 (3), 381–388. doi: 10.1080/00063650902984604
Carslaw D., Ropkins K. (2019). Openair: Tools for the Analysis of Air Pollution Data. R Package Version 1.8-2. Available at: https://cran.r-project.org/web/packages/openair/index.html.
Casale P., Margaritoulis D. (2010). Sea Turtles in the Mediterranean: Distribution, Threats and Conservation Priorities (Gland, Switzerland: International Union for Conservation of Nature (IUCN).
Chaloupka M., Limpus C. (2004). Estimates of Sex- and Age-Class-Specific Survival Probabilities for a Southern Great Barrier Reef Green Sea Turtle Population. Mar. Biol. 146 (6), 1251–1261. doi: 10.1007/s00227-004-1512-6
Couzin I. D., Krause J., Franks N. R., Levin S. A. (2005). Effective Leadership and Decision-Making in Animal Groups on the Move. Nature 433 (7025), 513–516. doi: 10.1038/nature03236
Dehnhard N., Ludynia K., Poisbleau M., Demongin L., Quillfeldt P. (2013). Good Days, Bad Days: Wind as a Driver of Foraging Success in a Flightless Seabird, the Southern Rockhopper Penguin. PloS One 8 (11), e79487. doi: 10.1371/journal.pone.0079487
Dickson L. C., Katselidis K. A., Eizaguirre C., Schofield G. (2021). Incorporating Geographical Scale and Multiple Environmental Factors to Delineate the Breeding Distribution of Sea Turtles. Drones 5 (4), 142. doi: 10.3390/drones5040142
Dill L. M. (1987). Animal Decision Making and its Ecological Consequences: The Future of Aquatic Ecology and Behaviour. Can. J. Zool. 65 (4), 803–811. doi: 10.1139/z87-128
Dujon A. M., Ierodiaconou D., Geeson J. J., Arnould J. P. Y., Allan B. M., Katselidis K. A., et al. (2021). Machine Learning to Detect Marine Animals in UAV Imagery: Effect of Morphology, Spacing, Behaviour and Habitat. Remote Sens. Ecol. Conserv. 7 (3), 341–354. doi: 10.1002/rse2.205
Edgar G. J., Stuart-Smith R. D., Willis T. J., Kininmonth S., Baker S. C., Banks S., et al. (2014). Global Conservation Outcomes Depend on Marine Protected Areas With Five Key Features. Nature 506 (7487), 216–220. doi: 10.1038/nature13022
Fossette S., Gleiss A. C., Chalumeau J., Bastian T., Armstrong C. D., Vandenabeele S., et al. (2015). Current-Oriented Swimming by Jellyfish and Its Role in Bloom Maintenance. Curr. Biol. 25 (3), 342–347. doi: 10.1016/j.cub.2014.11.050
Fossette S., Schofield G., Lilley M. K. S., Gleiss A. C., Hays G. C. (2012). Acceleration Data Reveal the Energy Management Strategy of a Marine Ectotherm During Reproduction. Funct. Ecol. 26 (2), 324–333. doi: 10.1111/j.1365-2435.2011.01960.x
Gill P. C., Morrice M. G., Page B., Pirzl R., Levings A. H., Coyne M. (2011). Blue Whale Habitat Selection and Within-Season Distribution in a Regional Upwelling System Off Southern Australia. Mar. Ecol. Prog. Ser. 421, 243–263. doi: 10.3354/meps08914
Gownaris N. J., Boersma P. D. (2019). Sex-Biased Survival Contributes to Population Decline in a Long-Lived Seabird, the Magellanic Penguin. Ecol. Appl. 29 (1), e01826. doi: 10.1002/eap.1826
Green K. M., Greenley A. P., Starr R. M. (2014). Movements of Blue Rockfish (Sebastes Mystinus) Off Central California With Comparisons to Similar Species. PloS One 9 (6), e98976. doi: 10.1371/journal.pone.0098976
Green K. M., Starr R. M. (2011). Movements of Small Adult Black Rockfish: Implications for the Design of MPAs. Mar. Ecol. Prog. Ser. 436, 219–230. doi: 10.3354/meps09263
Harris S., Cresswell W. J., Forde P. G., Trewhella W. J., Woollard T., Wray S. (1990). Home-Range Analysis Using Radio-Tracking Data–A Review of Problems and Techniques Particularly as Applied to the Study of Mammals. Mammal Rev. 20 (2-3), 97–123. doi: 10.1111/j.1365-2907.1990.tb00106.x
Hart K. M., Hyrenbach K. D. (2009). Satellite Telemetry of Marine Megavertebrates: The Coming of Age of an Experimental Science. Endangered Species Res. 10, 9–20. doi: 10.3354/esr00238
Hays G. C., Adams C. R., Broderick A. C., Godley B. J., Lucas D. J., Metcalfe J. D., et al. (2000). The Diving Behaviour of Green Turtles at Ascension Island. Anim. Behav. 59 (3), 577–586. doi: 10.1006/anbe.1999.1326
Hays G. C., Akesson S., Broderick A. C., Glen F., Godley B. J., Papi F., et al. (2003). Island-Finding Ability of Marine Turtles. Proc. R. Soc. B: Biol. Sci. 270 (Suppl 1), S5–S7. doi: 10.1098/rsbl.2003.0022
Hays G. C., Bailey H., Bograd S. J., Bowen W. D., Campagna C., Carmichael R. H., et al. (2019). Translating Marine Animal Tracking Data Into Conservation Policy and Management. Trends Ecol. Evol. 34 (5), 459–473. doi: 10.1016/j.tree.2019.01.009
Hays G., Broderick A., Glen F., Godley B., Nichols W. (2001). The Movements and Submergence Behaviour of Male Green Turtles at Ascension Island. Marine Biol. 139 (2), 395–400. doi: 10.1007/s002270100580
Hays G. C., Fossette S., Katselidis K. A., Mariani P., Schofield G. (2010). Ontogenetic Development of Migration: Lagrangian Drift Trajectories Suggest a New Paradigm for Sea Turtles. J. R. Soc. Interface 7 (50), 1319–1327. doi: 10.1098/rsif.2010.0009
Hays G. C., Hawkes L. A. (2018). Satellite Tracking Sea Turtles: Opportunities and Challenges to Address Key Questions. Front. Mar. Sci. 5 (432). doi: 10.3389/fmars.2018.00432
Hays G. C., Luschi P., Papi F., del Seppia C., Marsh R. (1999). Changes in Behaviour During the Inter-Nesting Period and Post-Nesting Migration for Ascension Island Green Turtles. Marine Ecol. Prog. Ser. 189, 263–273. doi: 10.3354/meps189263
Hays G. C., Marshall G. J., Seminoff J. A. (2006). Flipper Beat Frequency and Amplitude Changes in Diving Green Turtles, Chelonia Mydas. Mar. Biol. 150 (5), 1003–1009. doi: 10.1007/s00227-006-0412-3
Hazen E. L., Palacios D. M., Forney K. A., Howell E. A., Becker E., Hoover A. L., et al. (2017). WhaleWatch: A Dynamic Management Tool for Predicting Blue Whale Density in the California Current. J. Appl. Ecol. 54 (5), 1415–1428. doi: 10.1111/1365-2664.12820
Hernandez P. A., Graham C. H., Master L. L., Albert D. L. (2006). The Effect of Sample Size and Species Characteristics on Performance of Different Species Distribution Modeling Methods. Ecography 29 (5), 773–785. doi: 10.1111/j.0906-7590.2006.04700.x
Hodgson A., Kelly N., Peel D. (2013). Unmanned Aerial Vehicles (UAVs) for Surveying Marine Fauna: A Dugong Case Study. PloS One 8 (11), e79556. doi: 10.1371/journal.pone.0079556
Hodgson A. J., Marsh H. (2007). Response of Dugongs to Boat Traffic: The Risk of Disturbance and Displacement. J. Exp. Marine Biol. Ecol. 340 (1), 50–61. doi: 10.1016/j.jembe.2006.08.006
Howell E. A., Hoover A., Benson S. R., Bailey H., Polovina J. J., Seminoff J. A., et al. (2015). Enhancing the TurtleWatch Product for Leatherback Sea Turtles, a Dynamic Habitat Model for Ecosystem-Based Management. Fisheries Oceanography 24 (1), 57–68. doi: 10.1111/fog.12092
Hussey N. E., Kessel S. T., Aarestrup K., Cooke S. J., Cowley P. D., Fisk A. T., et al. (2015). Aquatic Animal Telemetry: A Panoramic Window Into the Underwater World. Science 348 (6240), 1255642. doi: 10.1126/science.1255642
I-Jiunn C. (2009). Changes in Diving Behaviour During the Internesting Period by Green Turtles. J. Exp. Mar. Biol. Ecol. 381 (1), 18–24. doi: 10.1016/j.jembe.2009.08.021
Jackson A. L., Broderick A. C., Fuller W. J., Glen F., Ruxton G. D., Godley B. J. (2008). Sampling Design and Its Effect on Population Monitoring: How Much Monitoring Do Turtles Really Need? Biol. Conserv. 141 (12), 2932–2941. doi: 10.1016/j.biocon.2008.09.002
Jadot C., Donnay A., Acolas M. L., Cornet Y., Bégout Anras M. L. (2006). Activity Patterns, Home-Range Size, and Habitat Utilization of Sarpa Salpa (Teleostei: Sparidae) in the Mediterranean Sea. ICES J. Mar. Sci. 63 (1), 128–139. doi: 10.1016/j.icesjms.2005.06.010
James M. C., Eckert S. A., Myers R. A. (2005). Migratory and Reproductive Movements of Male Leatherback Turtles (Dermochelys Coriacea). Mar. Biol. 147 (4), 845–853. doi: 10.1007/s00227-005-1581-1
James A. N., Gaston K. J., Balmford A. (1999). Balancing the Earth's Accounts. Nature 401 (6751), 323–324. doi: 10.1038/43774
Jiménez S., Domingo A., Brazeiro A., Defeo O., Abreu M., Forselledo R., et al. (2016). Sexual Size Dimorphism, Spatial Segregation and Sex-Biased Bycatch of Southern and Northern Royal Albatrosses in Pelagic Longline Fisheries. Antarctic Sci. 29 (2), 147–154. doi: 10.1017/s0954102016000493
Johnston D. W. (2019). Unoccupied Aircraft Systems in Marine Science and Conservation. Annu. Rev. Marine Sci. 11, 439–463. doi: 10.1146/annurev-marine-010318-095323
Katsanevakis S., Coll M., Fraschetti S., Giakoumi S., Goldsborough D., Mačić V., et al. (2020). Twelve Recommendations for Advancing Marine Conservation in European and Contiguous Seas. Front. Mar. Sci. 7. doi: 10.3389/fmars.2020.565968
Kokko H., Rankin D. J. (2006). Lonely Hearts or Sex in the City? Density-Dependent Effects in Mating Systems. Philos. Trans. R Soc. Lond. B Biol. Sci. 361 (1466), 319–334. doi: 10.1098/rstb.2005.1784
Lamont M. M., Iverson A. R. (2018). Shared Habitat Use by Juveniles of Three Sea Turtle Species. Marine Ecol. Prog. Ser. 606, 187–200. doi: 10.3354/meps12748
Landler L., Ruxton G. D., Malkemper E. P. (2019). The Hermans-Rasson Test as a Powerful Alternative to the Rayleigh Test for Circular Statistics in Biology. BMC Ecol. 19 (1), 30. doi: 10.1186/s12898-019-0246-8
Laver P. N., Kelly M. J. (2008). A Critical Review of Home Range Studies. J. Wildlife Manage. 72 (1), 290–298. doi: 10.2193/2005-589
Le Boeuf B. J., Crocker D. E., Costa D. P., Blackwell S. B., Webb P. M., Houser D. S. (2000). Foraging Ecology of Northern Elephant Seals. Ecol. Monogr. 70 (3), 353–382. doi: 10.1890/0012-9615(2000)070[0353:Feones]2.0.Co;2
Lee P. L., Hays G. C. (2004). Polyandry in a Marine Turtle: Females Make the Best of a Bad Job. Proc. Natl. Acad. Sci. U. S. A. 101 (17), 6530–6535. doi: 10.1073/pnas.0307982101
Lee P. L. M., Schofield G., Haughey R. I., Mazaris A. D., Hays G. C. (2018). A Review of Patterns of Multiple Paternity Across Sea Turtle Rookeries. Adv. Mar. Biol. 79, 1–31. doi: 10.1016/bs.amb.2017.09.004
Lewis S., Phillips R. A., Burthe S. J., Wanless S., Daunt F. (2015). Contrasting Responses of Male and Female Foraging Effort to Year-Round Wind Conditions. J. Anim. Ecol. 84 (6), 1490–1496. doi: 10.1111/1365-2656.12419
Limpus C., Miller J., Parmenter C., Limpus D. (2003). The Green Turtle, Chelonia Mydas, Population of Raine Island and the Northern Great Barrier Reef: 1843–2001. Memoirs Queensland Museum 49, 349440.
Lohmann K. J., Cain S. D., Dodge S. A., Lohmann C. M. (2001). Regional Magnetic Fields as Navigational Markers for Sea Turtles. Science 294 (5541), 364–366. doi: 10.1126/science.1064557
Mannocci L., Roberts J. J., Halpin P. N., Authier M., Boisseau O., Bradai M. N., et al. (2018). Assessing Cetacean Surveys Throughout the Mediterranean Sea: A Gap Analysis in Environmental Space. Sci. Rep. 8 (1), 3126. doi: 10.1038/s41598-018-19842-9
March D., Palmer M., Alós J., Grau A., Cardona F. (2010). Short-Term Residence, Home Range Size and Diel Patterns of the Painted Comber Serranus Scriba in a Temperate Marine Reserve. Mar. Ecol. Prog. Ser. 400, 195–206. doi: 10.3354/meps08410
Margaritoulis D., Rees A. F. (2001). The Loggerhead Turtle, Caretta Caretta, Population Nesting in Kyparissia Bay, Peloponnesus, Greece: Results of Beach Surveys Over Seventeen Seasons and Determination of the Core Nesting Habitat. Zool Middle East 24 (1), 75–90. doi: 10.1080/09397140.2001.10637886
Margules C. R., Pressey R. L. (2000). Systematic Conservation Planning. Nature 405 (6783), 243–253. doi: 10.1038/35012251
Marshall A. D., Dudgeon C. L., Bennett M. B. (2011). Size and Structure of a Photographically Identified Population of Manta Rays Manta Alfredi in Southern Mozambique. Mar. Biol. 158 (5), 1111–1124. doi: 10.1007/s00227-011-1634-6
Mazaris A. D., Schofield G., Gkazinou C., Almpanidou V., Hays G. C. (2017). Global Sea Turtle Conservation Successes. Sci. Adv. 3 (9), e1600730. doi: 10.1126/sciadv.1600730
McCauley D. J., Pinsky M. L., Palumbi S. R., Estes J. A., Joyce F. H., Warner R. R. (2015). Marine Defaunation: Animal Loss in the Global Ocean. Science 347 (6219), 1255641. doi: 10.1126/science.1255641
Melletti M., Delgado M. M., Penteriani V., Mirabile M., Boitani L. (2010). Spatial Properties of a Forest Buffalo Herd and Individual Positioning as a Response to Environmental Cues and Social Behaviour. J. Ethol. 28 (3), 421–428. doi: 10.1007/s10164-009-0199-z
Moilanen A. (2005). Reserve Selection Using Nonlinear Species Distribution Models. Am. Nat. 165 (6), 695–706. doi: 10.1086/430011
Morrell L. J., James R. (2008). Mechanisms for Aggregation in Animals: Rule Success Depends on Ecological Variables. Behav. Ecol. 19 (1), 193–201. doi: 10.1093/beheco/arm122
Mullen K. A., Peterson M. L., Todd S. K. (2013). Has Designating and Protecting Critical Habitat had an Impact on Endangered North Atlantic Right Whale Ship Strike Mortality? Mar. Policy 42, 293–304. doi: 10.1016/j.marpol.2013.03.021
Myers N., Mittermeier R. A., Mittermeier C. G., da Fonseca G. A., Kent J. (2000). Biodiversity Hotspots for Conservation Priorities. Nature 403 (6772), 853–858. doi: 10.1038/35002501
Nathan R., Katul G. G., Horn H. S., Thomas S. M., Oren R., Avissar R., et al. (2002). Mechanisms of Long-Distance Dispersal of Seeds by Wind. Nature 418 (6896), 405–409. doi: 10.1038/nature00844
Naylor E. (2006). Orientation and Navigation in Coastal and Estuarine Zooplankton. Mar. Freshw. Behav. Physiol. 39 (1), 13–24. doi: 10.1080/10236240600593344
Norcross B. L., Shaw R. F. (1984). Oceanic and Estuarine Transport of Fish Eggs and Larvae: A Review. Trans. Am. Fisheries Soc. 113 (2), 153–165. doi: 10.1577/1548-8659(1984)113<153:Oaetof>2.0.Co;2
Nykänen M., Oudejans M. G., Rogan E., Durban J. W., Ingram S. N. (2020). Challenges in Monitoring Mobile Populations: Applying Bayesian Multi-Site Mark–Recapture Abundance Estimation to the Monitoring of a Highly Mobile Coastal Population of Bottlenose Dolphins. Aquat. Conserv. 30 (8), 1674–1688. doi: 10.1002/aqc.3355
O'Leary B. C., Ban N. C., Fernandez M., Friedlander A. M., Garcia-Borboroglu P., Golbuu Y., et al. (2018). Addressing Criticisms of Large-Scale Marine Protected Areas. Bioscience 68 (5), 359–370. doi: 10.1093/biosci/biy021
Oleksyn S., Tosetto L., Raoult V., Joyce K. E., Williamson J. E. (2021). Going Batty: The Challenges and Opportunities of Using Drones to Monitor the Behaviour and Habitat Use of Rays. Drones 5 (1), 12. doi: 10.3390/drones5010012
Pardini A. T., Jones C. S., Noble L. R., Kreiser B., Malcolm H., Bruce B. D., et al. (2001). Sex-Biased Dispersal of Great White Sharks. Nature 412 (6843), 139–140. doi: 10.1038/35084125
Parrish J. K., Edelstein-Keshet L. (1999). Complexity, Pattern, and Evolutionary Trade-Offs in Animal Aggregation. Science 284 (5411), 99–101. doi: 10.1126/science.284.5411.99
Pfaller J. B., Bjorndal K. A., Chaloupka M., Williams K. L., Frick M. G., Bolten A. B. (2013). Accounting for Imperfect Detection is Critical for Inferring Marine Turtle Nesting Population Trends. PloS One 8 (4), e62326. doi: 10.1371/journal.pone.0062326
Pilastro A., Benetton S., Bisazza A. (2003). Female Aggregation and Male Competition Reduce Costs of Sexual Harassment in the Mosquitofish Gambusia Holbrooki. Anim. Behav. 65 (6), 1161–1167. doi: 10.1006/anbe.2003.2118
Plotz R. D., Grecian W. J., Kerley G. I., Linklater W. L. (2016). Standardising Home Range Studies for Improved Management of the Critically Endangered Black Rhinoceros. PloS One 11 (3), e0150571. doi: 10.1371/journal.pone.0150571
Prendergast J. R., Quinn R. M., Lawton J. H., Eversham B. C., Gibbons D. W. (1993). Rare Species, the Coincidence of Diversity Hotspots and Conservation Strategies. Nature 365 (6444), 335–337. doi: 10.1038/365335a0
Raoult V., Colefax A. P., Allan B. M., Cagnazzi D., Castelblanco-Martínez N., Ierodiaconou D., et al. (2020). Operational Protocols for the Use of Drones in Marine Animal Research. Drones 4 (64), 1–35. doi: 10.3390/drones4040064
R Core Team (2018). R: A Language and Environment for Statistical Computing (Vienna, Austria: R Foundation for Statistical Computing).
Ream R. R., Sterling J. T., Loughlin T. R. (2005). Oceanographic Features Related to Northern Fur Seal Migratory Movements. Deep Sea Res. Part II: Topical Stud. Oceanography 52 (5-6), 823–843. doi: 10.1016/j.dsr2.2004.12.021
Rees A. F., Avens L., Ballorain K., Bevan E., Broderick A. C., Carthy R. R., et al. (2018). The Potential of Unmanned Aerial Systems for Sea Turtle Research and Conservation: A Review and Future Directions. Endanger. Species Res. 35, 81–100. doi: 10.3354/esr00877
Rilov G., Mazaris A. D., Stelzenmüller V., Helmuth B., Wahl M., Guy-Haim T., et al. (2019). Adaptive Marine Conservation Planning in the Face of Climate Change: What can We Learn From Physiological, Ecological and Genetic Studies? Global Ecol. Conserv. 17, 135. doi: 10.1016/j.gecco.2019.e00566
Runge C. A., Martin T. G., Possingham H. P., Willis S. G., Fuller R. A. (2014). Conserving Mobile Species. Front. Ecol. Environ. 12 (7), 395–402. doi: 10.1890/130237
Schofield G., Bishop C. M., Katselidis K. A., Dimopoulos P., Pantis J. D., Hays G. C. (2009). Microhabitat Selection by Sea Turtles in a Dynamic Thermal Marine Environment. J. Anim. Ecol. 78 (1), 14–21. doi: 10.1111/j.1365-2656.2008.01454.x
Schofield G., Dickson L. C. D., Westover L., Dujon A. M., Katselidis K. A. (2021). COVID-19 Disruption Reveals Mass-Tourism Pressure on Nearshore Sea Turtle Distributions and Access to Optimal Breeding Habitat. Evolutionary Appl. 14 (10), 25116–2526. doi: 10.1111/eva.13277
Schofield G., Esteban N., Katselidis K. A., Hays G. C. (2019). Drones for Research on Sea Turtles and Other Marine Vertebrates – A Review. Biol. Conserv. 238 (108214), 1–10. doi: 10.1016/j.biocon.2019.108214
Schofield G., Hobson V. J., Lilley M. K. S., Katselidis K. A., Bishop C. M., Brown P., et al. (2010). Inter-Annual Variability in the Home Range of Breeding Turtles: Implications for Current and Future Conservation Management. Biol. Conserv. 143 (3), 722–730. doi: 10.1016/j.biocon.2009.12.011
Schofield G., Katselidis K. A., Dimopoulos P., Pantis J. D. (2008). Investigating the Viability of Photo-Identification as an Objective Tool to Study Endangered Sea Turtle Populations. J. Exp. Mar. Biol. Ecol. 360 (2), 103–108. doi: 10.1016/j.jembe.2008.04.005
Schofield G., Katselidis K. A., Dimopoulos P., Pantis J. D., Hays G. C. (2006). Behaviour Analysis of the Loggerhead Sea Turtle Caretta Caretta From Direct in-Water Observation. Endangered Species Res. 2, 71–79. doi: 10.3354/esr002071
Schofield G., Katselidis K. A., Lilley M. K. S., Reina R. D., Hays G. C. (2017). Detecting Elusive Aspects of Wildlife Ecology Using Drones: New Insights on the Mating Dynamics and Operational Sex Ratios of Sea Turtles. Funct. Ecol. 31 (12), 2310–2319. doi: 10.1111/1365-2435.12930
Schofield G., Katselidis K. A., Pantis J. D., Dimopoulos P., Hays G. C. (2007). Female–female Aggression: Structure of Interaction and Outcome in Loggerhead Sea Turtles. Marine Ecol. Prog. Ser. 336, 267–274. doi: 10.3354/meps336267
Schofield G., Klaassen M., Papafitsoros K., Lilley M. K. S., Katselidis K. A., Hays G. C. (2020). Long-Term Photo-Id and Satellite Tracking Reveal Sex-Biased Survival Linked to Movements in an Endangered Species. Ecology 101 (7), e03027. doi: 10.1002/ecy.3027
Schofield G., Scott R., Dimadi A., Fossette S., Katselidis K. A., Koutsoubas D., et al. (2013). Evidence-Based Marine Protected Area Planning for a Highly Mobile Endangered Marine Vertebrate. Biol. Conserv. 161, 101–109. doi: 10.1016/j.biocon.2013.03.004
Schuetzenmeister A., Dufey F. (2020). VCA: Variance Component Analysis. R Package Version 1.4.3. Available at: https://cran.r-project.org/web/packages/VCA/index.html.
Seaman D. E., Powell R. A. (1996). An Evaluation of the Accuracy of Kernel Density Estimators for Home Range Analysis. Ecology 77 (7), 2075–2085. doi: 10.2307/2265701
Sequeira A. M. M., Bouchet P. J., Yates K. L., Mengersen K., Caley M. J., McPherson J. (2018). Transferring Biodiversity Models for Conservation: Opportunities and Challenges. Methods Ecol. Evol. 9 (5), 1250–1264. doi: 10.1111/2041-210x.12998
Sequeira A. M. M., Heupel M. R., Lea M. A., Eguiluz V. M., Duarte C. M., Meekan M. G., et al. (2019). The Importance of Sample Size in Marine Megafauna Tagging Studies. Ecol. Appl. 29 (6), e01947. doi: 10.1002/eap.1947
Shaver D. J., Tissot P. E., Streich M. M., Walker J. S., Rubio C., Amos A. F., et al. (2017). Hypothermic Stunning of Green Sea Turtles in a Western Gulf of Mexico Foraging Habitat. PloS One 12 (3), e0173920. doi: 10.1371/journal.pone.0173920
Shimada T., Limpus C., Jones R., Hamann M. (2017). Aligning Habitat Use With Management Zoning to Reduce Vessel Strike of Sea Turtles. Ocean Coast Manag. 142, 163–172. doi: 10.1016/j.ocecoaman.2017.03.028
Shimada T., Thums M., Hamann M., Limpus C. J., Hays G. C., FitzSimmons N. N., et al. (2020). Optimising Sample Sizes for Animal Distribution Analysis Using Tracking Data. Methods Ecol. Evol. 12 (2), 288–297. doi: 10.1111/2041-210x.13506
Smith H., Frère C., Kobryn H., Bejder L. (2016). Dolphin Sociality, Distribution and Calving as Important Behavioural Patterns Informing Management. Anim. Conserv. 19 (5), 462–471. doi: 10.1111/acv.12263
Sprogis K. R., Pollock K. H., Raudino H. C., Allen S. J., Kopps A. M., Manlik O., et al. (2016). Sex-Specific Patterns in Abundance, Temporary Emigration and Survival of Indo-Pacific Bottlenose Dolphins (Tursiops Aduncus) in Coastal and Estuarine Waters. Front. Mar. Sci. 3. doi: 10.3389/fmars.2016.00012
Stockwell D. R. B., Peterson A. T. (2002). Effects of Sample Size on Accuracy of Species Distribution Models. Ecol. Modelling 148 (1), 1–13. doi: 10.1016/s0304-3800(01)00388-x
Sykora-Bodie S. T., Bezy V., Johnston D. W., Newton E., Lohmann K. J. (2017). Quantifying Nearshore Sea Turtle Densities: Applications of Unmanned Aerial Systems for Population Assessments. Sci. Rep. 7 (1), 17690. doi: 10.1038/s41598-017-17719-x
Symons J., Sprogis K. R., Bejder L. (2018). Implications of Survey Effort on Estimating Demographic Parameters of a Long-Lived Marine Top Predator. Ecol. Evol. 8 (21), 10470–10481. doi: 10.1002/ece3.4512
Szantoi Z., Smith S. E., Strona G., Koh L. P., Wich S. A. (2017). Mapping Orangutan Habitat and Agricultural Areas Using Landsat OLI Imagery Augmented With Unmanned Aircraft System Aerial Photography. Int. J. Remote Sens. 38 (8-10), 2231–2245. doi: 10.1080/01431161.2017.1280638
Szekely T., Liker A., Freckleton R. P., Fichtel C., Kappeler P. M. (2014). Sex-Biased Survival Predicts Adult Sex Ratio Variation in Wild Birds. Proc. R. Soc. B: Biol. Sci. 281 (1788), 20140342. doi: 10.1098/rspb.2014.0342
Thomas B., Holland J. D., Minot E. O. (2011). Wildlife Tracking Technology Options and Cost Considerations. Wildlife Res. 38 (8), 653–663. doi: 10.1071/wr10211
Thomson J. A., Börger L., Christianen M. J. A., Esteban N., Laloë J. O., Hays G. C. (2017). Implications of Location Accuracy and Data Volume for Home Range Estimation and Fine-Scale Movement Analysis: Comparing Argos and Fastloc-GPS Tracking Data. Mar. Biol. 164 (10), 204. doi: 10.1007/s00227-017-3225-7
Tošić I., Gavrilov M. B., Marković S. B., Ruman A., Putniković S. (2017). Seasonal Prevailing Surface Winds in Northern Serbia. Theor. Appl. Climatology 131 (3-4), 1273–1284. doi: 10.1007/s00704-017-2044-6
Van Dam R. P., Diez C. E., Balazs G. H., Colón Colón L. A., McMillan W. O., Schroeder B. (2008). Sex-Specific Migration Patterns of Hawksbill Turtles Breeding at Mona Island, Puerto Rico. Endangered Species Res. 4, 85–94. doi: 10.3354/esr00044
Wallace B. P., Williams C. L., Paladino F. V., Morreale S. J., Lindstrom R. T., Spotila J. R. (2005). Bioenergetics and Diving Activity of Internesting Leatherback Turtles Dermochelys Coriacea at Parque Nacional Marino Las Baulas, Costa Rica. J. Exp. Biol. 208 (Pt 20), 3873–3884. doi: 10.1242/jeb.01860
Wang D., Shao Q., Yue H. (2019). Surveying Wild Animals From Satellites, Manned Aircraft and Unmanned Aerial Systems (UASs): A Review. Remote Sens. 11 (11), 1308. doi: 10.3390/rs11111308
Watson J. E., Dudley N., Segan D. B., Hockings M. (2014). The Performance and Potential of Protected Areas. Nature 515 (7525), 67–73. doi: 10.1038/nature13947
Weimerskirch H. (2018). Linking Demographic Processes and Foraging Ecology in Wandering Albatross-Conservation Implications. J. Anim. Ecol. 87 (4), 945–955. doi: 10.1111/1365-2656.12817
Weimerskirch H., Louzao M., de Grissac S., Delord K. (2012). Changes in Wind Pattern Alter Albatross Distribution and Life-History Traits. Science 335 (6065), 211–214. doi: 10.1126/science.1210270
Weishampel J. F., Bagley D. A., Ehrhart L. M. (2006). Intra-Annual Loggerhead and Green Turtle Spatial Nesting Patterns. Southeastern Nat. 5 (3), 453–462. doi: 10.1656/1528-7092(2006)5[453:Ilagts]2.0.Co;2
White T. D., Carlisle A. B., Kroodsma D. A., Block B. A., Casagrandi R., De Leo G. A., et al. (2017). Assessing the Effectiveness of a Large Marine Protected Area for Reef Shark Conservation. Biol. Conserv. 207, 64–71. doi: 10.1016/j.biocon.2017.01.009
Whiting A. U., Chaloupka M., Limpus C. J. (2013). Comparing Sampling Effort and Errors in Abundance Estimates Between Short and Protracted Nesting Seasons for Sea Turtles. J. Exp. Mar. Biol. Ecol. 449, 165–170. doi: 10.1016/j.jembe.2013.09.016
Whiting A. U., Chaloupka M., Limpus C. J. (2020). Sampling Nesting Sea Turtles: Impact of Survey Error on Trend Detection. Mar. Ecol. Prog. Ser. 634, 213–223. doi: 10.3354/meps13202
Wiest W. A., Shriver W. G. (2016). Survey Frequency and Timing Affect Occupancy and Abundance Estimates for Salt Marsh Birds. J. Wildlife Manage. 80 (1), 48–56. doi: 10.1002/jwmg.963
Wilmers C. C., Nickel B., Bryce C. M., Smith J. A., Wheat R. E., Yovovich V. (2015). The Golden Age of Bio-Logging: How Animal-Borne Sensors Are Advancing the Frontiers of Ecology. Ecology 96 (7), 1741–1753. doi: 10.1890/14-1401.1
Wilson B., Hammond P. S., Thompson P. M. (1999). Estimating Size and Assessing Trends in a Coastal Bottlenose Dolphin Population. Ecol. Appl. 9 (1), 288–300. doi: 10.1890/1051-0761(1999)009[0288:Esaati]2.0.Co;2
Worton B. J. (1989). Kernel Methods for Estimating the Utilization Distribution in Home-Range Studies. Ecology 70 (1), 164–168. doi: 10.2307/1938423
Wright M. K., Baumbach D. S., Collado N., Safi S. B., Dunbar S. G. (2020). Influence of Boat Traffic on Distribution and Behavior of Juvenile Hawksbills Foraging in a Marine Protected Area in Roatán, Honduras. Ocean Coast Manag. 198, 105379. doi: 10.1016/j.ocecoaman.2020.105379
Yaney-Keller A., San Martin R., Reina R. D. (2021). Comparison of UAV and Boat Surveys for Detecting Changes in Breeding Population Dynamics of Sea Turtles. Remote Sens. 13 (15), 2857. doi: 10.3390/rs13152857
Keywords: conservation policy, dynamic management, micro-habitat, remote sensing, species distribution models, sex-specific differences, telemetry
Citation: Dickson LCD, Tugwell H, Katselidis KA and Schofield G (2022) Aerial Drones Reveal the Dynamic Structuring of Sea Turtle Breeding Aggregations and Minimum Survey Effort Required to Capture Climatic and Sex-Specific Effects. Front. Mar. Sci. 9:864694. doi: 10.3389/fmars.2022.864694
Received: 28 January 2022; Accepted: 12 April 2022;
Published: 25 May 2022.
Edited by:
Michele Thums, Australian Institute of Marine Science (AIMS), AustraliaReviewed by:
Kristen Marie Hart, United States Geological Survey (USGS), United StatesJustin Meager, Queensland Government, Australia
Copyright © 2022 Dickson, Tugwell, Katselidis and Schofield. This is an open-access article distributed under the terms of the Creative Commons Attribution License (CC BY). The use, distribution or reproduction in other forums is permitted, provided the original author(s) and the copyright owner(s) are credited and that the original publication in this journal is cited, in accordance with accepted academic practice. No use, distribution or reproduction is permitted which does not comply with these terms.
*Correspondence: Liam C. D. Dickson, l.c.d.dickson@qmul.ac.uk