Au-Coated Ni80Fe20 Submicron Magnetic Nanodisks: Interactions With Tumor Cells
 Carla Divieto‡
  Gabriele Barrera*†‡
  Federica Celegato‡
  Giancarlo D'Agostino
  Marco Di Luzio Marco Coïsson
  Andrea Lapini Leonardo Mortati
  Massimo Zucco Stefano Pavarelli Maria P. Sassi
  Paola Tiberto
- Advanced Materials Metrology and Life Sciences, I.N.Ri.M.—Istituto Nazionale di Ricerca Metrologica, Turin, Italy
Effective interaction and accumulation of nanoparticles (NPs) within tumor cells is crucial for NP-assisted diagnostic and therapeutic biomedical applications. In this context, the shape and size features of NPs can severely influence the strength of adhesion between NPs and cell and the NP internalization mechanisms. This study proved the ability of the PT45 and A549 tumor cells to uptake and retain magnetic Au-coated Ni80Fe20 nanodisks (NDs) prepared by means of a bottom–up self-assembling nanolithography technique assisted by polystyrene nanospheres. The chosen geometrical parameters, i.e., diameter (≈650 nm) and thickness (≈30 nm), give rise to magnetic domain patterns arranged in vortex state at the magnetic remanence. PT45 and A549 cell lines were cultured in the presence of different concentrations of Au-coated Ni80Fe20 nanodisks, and their biocompatibility was evaluated by viability and proliferation tests. Electron microscopy techniques and a combined CARS (Coherent Anti-stokes Raman Scattering) and TPL (two-photon photoluminescence) microscopy allow localizing and distinguishing the NDs within or attached to the tumor cells, without any labeling. A quantitative measurement of ND amount retained within tumor cells as a function of ND concentrations was performed by the Instrumental Neutron Activation Analysis (INAA) characterization technique.
Introduction
Nanoparticles (NPs) offer potential benefits in biomedicine due to their unique chemical and physical properties (Tran and Webster, 2010; Thanh, 2012; Giner-Casares et al., 2016; Cardoso et al., 2018; He et al., 2018; Wagner et al., 2019). As a result, they are used in many biological and biomedical applications including drug delivery (Bonini et al., 2013; Toy and Roy, 2016; El-Boubbou, 2018; Liyanage et al., 2019; Xu et al., 2020), heat-assisted treatments, and medical imaging (Huang et al., 2011; Dutz and Hergt, 2014; Blanco-Andujar et al., 2016; Noukeu et al., 2018; Fratila et al., 2019; Paris et al., 2020). The efficiency of these applications is strongly dependent on the interaction of NPs with cells and tissues, and it is affected by several particle properties including their shape, size, composition, and surface functionalization (Decuzzi et al., 2010; Petros and DeSimone, 2010; Verma and Stellacci, 2010; Bartczak et al., 2012; Barua and Mitragotri, 2014; Jiang et al., 2016).
Among them, size, shape, and aspect ratio play a very important role in influencing circulation time, biodistribution, and the processes of cellular phagocytosis and internalization (Champion et al., 2007; Venkataraman et al., 2011; Bartczak et al., 2012; Truong et al., 2015; Wong and Wright, 2016; Kinnear et al., 2017). In both processes, cell behavior is strongly influenced by the volume ratio between NP and cell (Champion and Mitragotri, 2006) as well as by the overall and local NP shape (Champion and Mitragotri, 2006; Gratton et al., 2008). With the exception of spherical nanoparticles, the local shape at the contact point between the nanoparticle and the cell strongly influences their interaction (Champion and Mitragotri, 2006). In particular, the internalization is made more difficult when a concave or flat NP region approaches the cell membrane, whereas it is favored if the initial contact takes place with a convex, dome, or ring NP region.
Moreover, the NP shape and size affect also the strength of adhesion between the nanoparticle and the cell surface (Decuzzi and Ferrari, 2006; Napierska et al., 2013). A firm adhesion of NP to the target cell guarantees the completion of the diagnostic or therapeutic mission counteracting the force induced by the flowing blood that attempts to take the nanoparticles away. Interestingly, at fixed particle volume, the adhesive strength becomes stronger with the increase in the particle aspect ratio; consequently, the oblate shape is more effective than the spherical one (Decuzzi and Ferrari, 2006).
Evidently, the adhesion process requires a close approach of the particle to the target cell; therefore, the NP design should take into account also its ability to drift laterally toward the vessel periphery (margination process) near the target cell, rather than move within the vessel core. Experimental evidence has clarified that the discoidal shape favors the margination of particles compared to spherical ones (Gentile et al., 2008; Lee et al., 2013).
These previous findings suggest that a nanoparticle of discoidal shape, having two large flat sides, shows some potential benefits in biomedicine: (i) the resistance to the phagocytosis by the immune response is increased with a consequent rise of the circulation time of NP inside the blood stream; (ii) the margination process favors the particle approaching the target cell; (iii) the strength of adhesion between particle and cell results more efficient.
In the last decade, NPs consisting of soft ferromagnetic alloys, such as FeNi, FePd, received much interest for their ability to stabilize a controllable magnetic vortex domain configuration when they are prepared in discoidal shape (Rozhkova et al., 2009; Kim et al., 2010; Leulmi et al., 2015; Tiberto et al., 2015, 2016; Barrera et al., 2016) within a proper selected range of diameters and aspect ratio (Tiberto et al., 2016; Peixoto et al., 2020). This magnetic vortex configuration induces peculiar magnetic properties to the discoidal NPs, not present in the more conventional iron oxide-based spherical ones, such zero remanence, high magnetic saturation and susceptibility, as well as the presence of a hysteresis at high field (Kim et al., 2010; Tiberto et al., 2015; Barrera et al., 2016).
Therefore, the development of growth and lithographic procedures in order to obtain magnetic NPs with discoidal shape allows to combine these unique magnetic properties with the abovementioned benefits in biomedicine (i–iii), making this kind of magnetic NPs suitable candidates to develop advanced magnetic-based treatments for cancer therapies such as drug delivery assisted by magnetic gradient field, magnetomechanical cell destruction, and magnetic hyperthermia (Rozhkova et al., 2009; Kim et al., 2010; Leulmi et al., 2015; Ferrero et al., 2019; Peixoto et al., 2020).
Obviously, the effectiveness of these biomedical treatments is strongly dependent on the degree of NP accumulation in cancerous tissues.
Liu et al. (2013) reported different publications showing that size of NPs influences their accumulation in tumors. Small dimensions (around 20 nm) can easily penetrate the tissues but are usually released after 24 h. Larger NPs (more than 100 nm), instead, are not able to easily reach the tissues because they remain embedded in the extracellular matrix (ECM) surrounding the cells.
This work aims to give a comprehensive and systematic evaluation of the Au-coated magnetic Ni80Fe20 nanodisk uptake and retention of two different types of tumor cells using state-of-the-art imaging techniques (SEM, CARS, and TLP) and an innovative and accurate method based on Instrumental Neutron Activation Analysis (INAA). Additionally, the unconventional nanofabrication method based on a bottom–up self-assembling nanolithography process assisted by polystyrene nanospheres is also presented to obtain the Au-coated Ni80Fe20 free-standing nanodisks characterized by a magnetic vortex magnetic domain configuration. Furthermore, a long-term incubation with studied cells was used to test any cytotoxic effect of the NDs, performing viability and proliferation tests.
The results reported in this work concerning the qualitative and quantitative analysis of the interaction between Au-coated Ni80Fe20 NDs and tumor cells performed using some unconventional techniques provide some preliminary and important aspects interesting for the understanding of the NP internalization mechanisms.
Materials and Methods
NDs Nanofabrication
Au-coated Ni80Fe20 nanodisks have been prepared by a combination of sputter deposition and self-assembling of polystyrene nanosphere lithography, following the procedure detailed elsewhere (Tiberto et al., 2015; Campanini et al., 2018). The high versatility of this procedure allows finely tuning the nanodisk thickness and diameter, which can be sized from the nano- to the submicron scale (Tiberto et al., 2015, 2016; Campanini et al., 2018). In this work, we set the diameter at 650 nm and the thickness at 30 nm to guarantee, in combination with the soft magnetic properties of NiFe alloy, the formation of a stable magnetic vortex domain configuration. Summarizing the nanofabrication method, a monolayer of polystyrene nanospheres (PNS) is deposited on top of the stack composed of Au (5 nm), Ni80Fe20 (30 nm), Au (5 nm), previously sputtered on top of a Si-oxide substrate covered by an optical resist (Figure 1A). The PNS are submitted to a plasma etching to reduce their diameter from the initial 800-nm value to 650 nm choosing a suitable treatment time. Then, sputter-etching removes the metal stack not protected by the nanospheres (Figure 1B), and sonication in deionized water detaches the PNS, therefore, leaving a nanodisk array on top of the resist. At the end of the nanofabrication process, a washing procedure, repeated five times first in acetone, then in ethanol, and finally in deionized water, is performed to detach the nanodisks from the resist (Figure 1C) and disperse them in water.
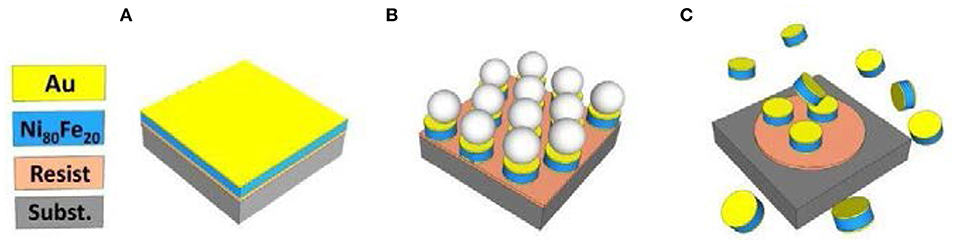
Figure 1. Sketch of nanofabrication process: (A) sputter deposition of Au/Ni80Fe20/Au tri-layer; (B) sputter etching to remove tri-layer among spheres; (C) disk detachment from the substrate.
The Au layers deposited on the top and bottom faces of the nanodisks have the purpose of coating the magnetic core with a biocompatible surface reducing the toxic effect of the Ni element contained in the Ni80Fe20 magnetic alloy (Bar-Ilan et al., 2009). In addition, Au coating improves not only the biocompatibility of the magnetic nanodisks but also provides a useful surface to potentially bind chemical and biological entities maintaining unaltered the magnetic behavior of the particles (Li et al., 2011; Barrera et al., 2016).
The fraction of surface area occupied by nanodisks array with respect to the whole substrate area (packing density, η = 0.62) and the area number density (ρ = 1.2 × 10⁸ nanodisks cm−2) were evaluated taking several scanning electron microscopy (SEM) images in different regions of the samples (Barrera et al., 2016) in order to prepare a magnetic ND solution with a known nominal concentration, resulting in 58 μg ml−1, which was then diluted in order to prepare ND solution for the biological assays at 11.60, 1.16, and 0.12 μg ml−1.
NDs Magnetic Characterization
Magnetic hysteresis loops on NDs have been measured with a LakeShore 7410 vibrating sample magnetometer (VSM) at room temperature, on a liquid sample of 70 μl consisting of water-dispersed NDs at nominal concentration of 58 μg ml−1.
Cell Cultures and Treatment With NDs
Two cell lines from human cancerous tissues, A549 and PT45, were cultured. A549 are adenocarcinomic human alveolar basal epithelial cells, while PT45 are pancreatic ductal adenocarcinoma and GFP-positive cells. The two cell lines were cultured separately in adherent monolayers in Petri dishes using a cell growth medium prepared with Dulbecco's modified minimum essential medium (DMEM) supplemented with 10% v/v of fetal bovine serum (FBS), 2 mM L-glutamine, 100 IU/ml of penicillin, and 100 mg/ml of streptomycin (all the reagents were purchased from Lonza, Wokingham, UK). Petri dishes were incubated at 37°C in 5% CO2 and 95% humidity. Exhausted medium was replaced with fresh medium every 2 days until cells reached about 80% confluence. Cells were then washed once with 1× phosphate buffer saline (PBS), detached with 0.25% Trypsin−0.53 mM EDTA solution, counted using a hemocytometer (i.e., Neubauer chamber) and resuspended in fresh medium. The cells were finally seeded in a 24-well plate at a concentration of 2 × 10⁴ ml−1 for a total of 10,000 cells per well in 0.5 ml of cell growth medium. The cells were allowed to adhere to the bottom of the wells for 24 h in an incubator at 37°C and 5% CO2.
To treat living cells with NDs, the latter were sterilized in ethanol 70% v/v as follows.
The NDs, obtained in water at a nominal concentration of 58 μg ml−1, were collected at the bottom of a tube by centrifugation at 10,000 rpm for 10 min and subsequent magnetic attraction by means of a magnet. The water was eliminated and replaced by 1 ml of ethanol 70% to sterilize the NDs.
After 24 h in ethanol, the NDs were again collected at the bottom of the tube by centrifugation at 10,000 rpm for 10 min and subsequent magnetic attraction. The ethanol was eliminated and replaced with fresh medium. Finally, the NDs were sonicated for 10 min at a maximum power of an ultrasonic bath to avoid any aggregation. This operation was repeated before each deposition of NDs with cells.
Three concentrations of NDs, obtained by diluting the 58-μg ml−1 solution, were tested on both cell types: 11.60 μg ml−1 (dilution 1:5), 1.16 μg ml−1 (1:50 dilution), and 0.12 μg ml−1 (dilution 1:500).
The NDs were incubated with the cells for 2 h in the first experimental set up and for 2 days in the second: the cell growth medium in the 24-well plate where cells were seeded was replaced with medium containing NDs. Cells not in contact with NDs were the negative control. An incubation time of 2 h was used for imaging NDs, while a longer incubation time of 2 days was used to test any cytotoxic effect of the NDs.
Imaging Characterization
For scanning electron microscope analysis, A549 and PT45 cells were seeded and allowed to adhere overnight on Cu TEM (transmission electron microscopy) grids covered by a holey carbon film. Then the cells were incubated with NDs for 2 h, washed several times with PBS, and fixed with ethanol 70% in water (v/v) before imaging. The images have been acquired with an FEI Inspect-F scanning electron microscope (SEM) equipped with three different detectors: secondary electrons (SE), backscattered electrons (BSE) and transmitted electrons (STEM). All images were acquired under an accelerating voltage of 30 kV. STEM images are in bright field.
For multimodal microscope analysis, A549 cells were seeded on a glass coverslip, let to adhere overnight, and incubated with NDs for 2 h. The experimental setup of the home-built multimodal microscope used to collect CARS images is based, as the master source, on a passively mode-locked Nd:YVO4 laser emitting 10-ps pulses centered at 1,064 nm (Picotrain, HighQLaser) (Mortati et al., 2012). The frequency-doubled output at 532 nm (5 ps, 4 W) synchronously pumps the optical parametric oscillator (OPO; Levante Emerald, APE Berlin). In this experiment, the OPO acts as the tunable “pump” source, and it is based on a non-linear lithium–triborate (LBO) crystal inserted in a resonant optical cavity. The tuning range is 700–1,020 nm for the Signal and 1,110–2,200 nm for the Idler pulses. In this experiment, CARS signal for the CH2 stretching mode (2,848 cm−1) of the lipid structure of cellular membrane is generated using a portion of the 1,064-nm pulse acting as the Stokes field overlapped in space and time with the Signal pulse from the OPO, centered at 820 nm, and acting as the pump field. Once the pulses have been overlapped, both Signal and 1,064 beam enter into the microscope part of our instrumental setup. The microscope is constituted by a scanning unit (FluoView FV300, Olympus) combined with an upright microscope (BX51WI, Olympus) that allows a point-by-point detection of CARS signals all over the sample with high resolution and high excitation efficiency. The average power of Stokes plus Pump pulses was adjusted using an achromatic half wave plate in combination with a calcite polarizer and was set to about 40 mW. The Z depth scanning is achieved by moving the focusing objective with a stepper motor. A water immersion objective (LUMPLFLN 40XW NA = 0.8, W.D. = 3.3 mm, Olympus), fully compensated for both spherical and chromatic aberrations from the UV to the near-infrared region, was used to focus the excitation beams on living cell samples. The water immersion objective was cleaned and sterilized with a solution 70% ethanol in water (v/v) before each imaging experiment to prevent cell culture damages. The forward CARS signals are collected through an objective (UPLSAPO 10× objective NA = 0.4, Olympus) and focused on a PMT (R3896, Hamamatsu) with a plano-convex lens having a focal length of 25 mm. On the other hand, the multi-photon excitation fluorescence signal was acquired in back-scattering geometry (epi-geometry), using the PMT detector placed inside the microscope scanning head. The optical microscope was coupled to an incubator system (Okolab), allowing a time lapse imaging of living cell cultures under temperature and CO2 controlled conditions.
It is very well-known that CARS microscopy is extremely selective from a chemical point of view, and we have used this characteristic to reconstruct the cellular profile (Mortati et al., 2012; Camp Jr. and Cicerone, 2015; Polli et al., 2018). Indeed, the image acquisition strategy employed in this work was based on the use of CARS microscopy to build a three-dimensional profile of the cells in order to understand the localization of NDs with good accuracy. In particular, the CH2 symmetrical stretching at 2,848 cm−1, characteristic of the lipidic structures present in the cell and particularly rich in the cellular membrane, was selected; this is achieved by tuning the frequency difference between the pump (at about 816.9 nm) and Stokes (at 1,064 nm) pulses in resonance with CH2 stretching. Following this scheme, the three-dimensional profile of the cells was reconstructed acquiring a series of images (slices) as a function of the height of the focusing objective with respect to the glass substrate (coverslip) for cell adhesion with the Z depth scanning (Z depth scanning method).
Two-photon luminescence (TPL) from NDs has been determined using the epi-detection method and filtering the optical backscattered signal in a range between 410 and 625 nm.
Viability and Proliferation Test
The CellTiter-Blue® cell viability assay (Promega Corporation, Madison, WI, USA) is a resazurin-based method (Divieto and Sassi, 2015). Cells were incubated with resazurin 44 μM for 1 h at 37°C and 5% CO2. Resazurin molecule in the basic form is slightly fluorescent and has a dark blue color. The solution is blue because, in the basic form (zwitterionic form), it absorbs light at 600 nm. Resaruzin penetrates the cells by passing the cell membrane and into the cytoplasm and is reduced by cytosolic, microsomal, and mitochondrial redox enzymes to resorufin. This reaction is made only in living (viable) cells, which have metabolic activity. Resazurin is dark blue and slightly fluorescent until it is reduced to resorufin, which is pink and highly fluorescent. When it is reduced to resorufin, its absorption shifts to 570 nm, it becomes fluorescent, and its fluorescence maximum is peaked at 585 nm (pink). The resorufin has a color going from violet to dark pink color, depending on the number of cells that are metabolizing the resazurin into resorufin. The same color indicates a similar cell number.
The proliferation test was carried out by optical microscopy. Proliferation was evaluated by visual qualitative assessment of the cell confluence (ratio between the growth area occupied by cells and the total growth area). Viability test was performed at day 2, while proliferation test was performed at day 8.
Instrumental Neutron Activation Analysis (INAA)
In order to prepare the sample for INAA characterization, the cell medium was eliminated from culture, and the cells were washed twice with PBS and detached from the 24-well plate using trypsin. The collected cells were finally fixed in ethanol in Eppendorf vials.
The ethanol in the vials was replaced with ultra-pure (MilliQ) water. Afterward, the water with the suspended cells was spilled in polyethylene (PE) vials for the neutron irradiation. Samples (about 0.4 ml) of the cell medium, ethanol, PBS, and trypsin were also pipetted in different PE vials. After drying with an IR lamp, the PE vials were heat sealed, placed in an aluminum container together with three Au standard samples prepared with a traceable Au solution, and sent to the irradiation facility.
The neutron irradiation lasted 6 h and was carried out at the central channel of the 250-kW TRIGA Mark II reactor at the Laboratory of Applied Nuclear Energy (LENA) of the University of Pavia. The γ-spectrometry measurements were performed with a high-purity Ge detector, Canberra (35% relative efficiency) inside a low-background graded lead shield and connected to an Ortec DSPEC-Pro digital spectrometer. The Au mass in the samples was calculated by applying the relative INAA standardization method; the samples and the Au standards were located at about 6-cm distance from the end-cap of the detector. The collected γ-spectra were processed using the Ortec Gamma Vision software to determine the net area of the 411.8-keV full-energy γ-peak.
Results and Discussion
The morphology of the as-fabricated NDs, investigated by SEM microscopy, is shown in Figure 2A where a disk shape with a well-defined contour and diameter of about 650 nm is clearly observed.
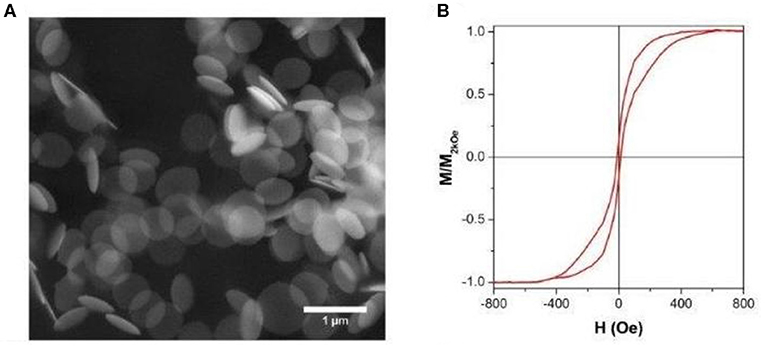
Figure 2. (A) Scanning electron microscopy (SEM) image of free-standing NDs; (B) room-temperature hysteresis loop of nanodisks (NDs) dispersed in liquid solution.
The room-temperature hysteresis loop, reported in Figure 2B, demonstrates that the NDs present a typical vortex-state configuration at the magnetic remanence (Guimarães, 2009; Peixoto et al., 2020), with expulsion and nucleation fields when saturation or remanence are approached, respectively. The measured loop is the average of the contribution to magnetic moment of individual NDs, whose orientation with respect to the applied field is random, as they are dispersed in water (Tiberto et al., 2015). The presence of a vortex state at remanence is of utmost importance to reduce the magneto-static interactions, therefore acting against the inclination that other nanostructure shapes have to agglomerate because of long-ranged dipolar magnetic fields (Ferrero et al., 2019) making the disk shape very promising for different biomedical applications.
Two different experimental setups were performed to test cellular uptake, localization, biocompatibility, and retention of NDs in cells.
The first setup was performed as described: two cell lines from human cancerous tissues containing adenocarcinomic human alveolar basal epithelial cells (A549) and pancreatic ductal adenocarcinoma, GFP-positive cells (PT45) were treated with cell growth medium containing the sterilized NDs at a concentration of 11.6 μg ml−1 for 2 h at 37°C and 5% CO2. After this incubation, cell growth medium containing NDs were discarded, and cells were imaged with SEM and a combined CARS (Coherent Anti-stokes Raman Scattering) and TPL (two-photon photoluminescence) microscopy to check the cellular uptake and localization of NDs (Scheme 1, action 1).
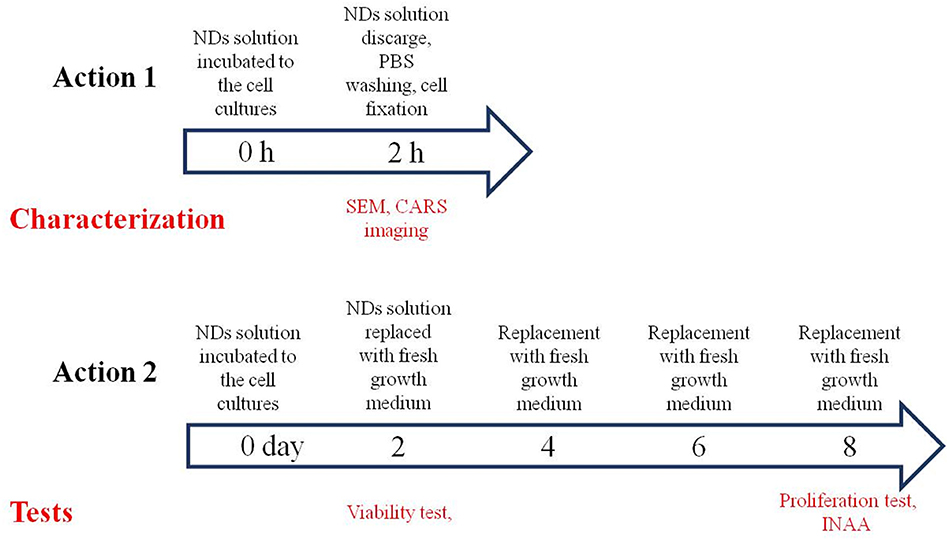
Scheme 1. Time chart of actions, characterizations, and tests performed on the tumor cell cultures.
The second setup was performed as follows: the same cell lines (A549 and PT45) were treated with cell growth medium containing the sterilized NDs at different concentrations: 11.60, 1.16, and 0.12 μg ml−1. The cell growth medium containing the NDs was added to the same number of cells (103 cells for each cell culture well as described in the Materials and Methods section) at day 0 and incubated for 2 days (Scheme 1, action 2). A long-term incubation of 2 days at 37°C and 5% CO2 was used to test any cytotoxic effect of the NDs, performing viability and proliferation tests. After this incubation time, cell culture medium containing the NDs was discarded and replaced with fresh growth medium; at day 2, a viability test was done. The exhausted cell growth medium was replaced with the fresh one every 2 days for a total duration of 8 days when a proliferation test was conducted followed by the INAA analysis.
NP Uptake and Localization in Cells: Imaging
To assess the ND uptake and localization in cells, the first setup was used, having an incubation time of 2 h.
Figure 3 shows electron microscopy images acquired with the three different detectors (SE, BSE, and STEM)of A549 and PT45 cells treated with the ND solution at a concentration of 11.6 μg ml−1. The washing procedure, described in the Imaging Characterization section, was performed in order to remove the NDs not in contact and/or weakly attached to the cells.
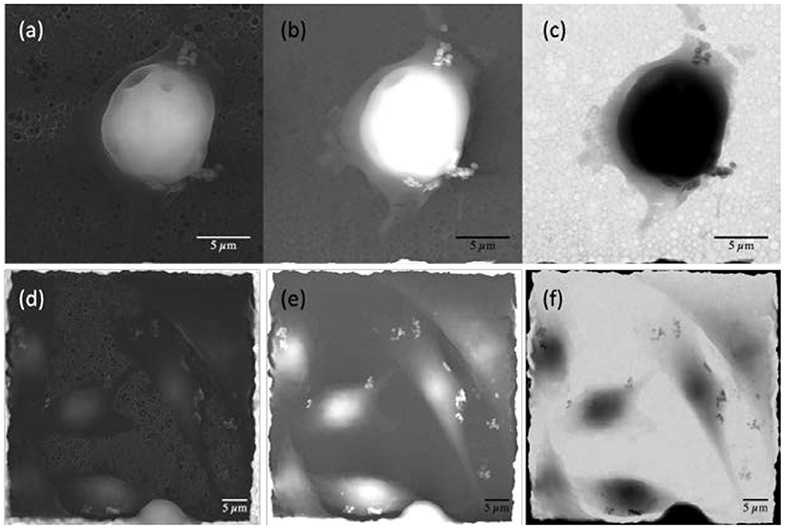
Figure 3. Electron microscopy images of pancreatic ductal adenocarcinoma [PT45; (a–c)] and adenocarcinomic human alveolar basal epithelial cells [A549; (d–f)] cell lines. (a,d) Secondary electrons images; (b,e) backscattered electrons images; (c,f) transmitted electrons images.
The combination of the three different detectors allows, by comparing the images, to clearly distinguish the presence of several NDs in the cells or on their membrane. Secondary electron images (Figures 3a,d) are particularly sensitive to the sample morphology; indeed, details of the cell shape and contours of their different portions are clearly visible, together with smaller nano-object clusters near the sides of the cells.
These nano-objects appear particularly bright in backscattered electrons images (Figures 3b,e) because they are sensitive to the atomic number of the substance probed by the electrons. However, the images taken from this detector alone are not fully discriminant regarding the position of NDs because areas with very different thickness or density, when belonging to the same image, may appear to have similar brightness. The comparison with secondary electron images reveals that the internal compartment of the cell has a significant three-dimensional structure (A549 and PT45 cells have a typical thickness of about 2–10 μm, depending on their adhesion phase), whereas the bright nano-objects clusters, that are visible in the thinner outer portion of the cell, are much smaller in size along the three geometrical directions, as they appear to have a darker shade. They can, therefore, be identified as clusters of NDs. Indeed, their metallic nature is evidenced by the transmitted electrons images (Figures 3c,f), where the NDs, although small and thin, appear dark, indicating that very few electrons can pass through the metal of which they are constituted and reach the underneath detector. Conversely, the dark color of the cell interior is attributed to their significant thickness, which attenuates the transmitted electron beam in spite of the relatively low density and atomic mass with respect to the metallic NDs. The effectiveness of the washing procedure is demonstrated by the fact that no NDs can be observed either on the holey carbon structure or on the copper grid. The remaining NDs have, therefore, been incorporated becoming part of the cells, having adhered to their membrane or having being internalized; they mostly appear in small clusters with no specific space arrangement. Only some cells interact with large ND ensemble (>5–7 μm) as shown in Figure S1 in the Supplementary Material.
To assess the latter hypothesis and to better localize the NDs within the cells, a multimodal non-linear optical microscopy, allowing 3D visualization of cells, has been employed on living A549 cells adherent to a glass coverslip and incubated at 37°C and 5% CO2 for 2 h in cell culture medium containing NDs at a concentration of 11.6 ml−1, as described in the Materials and methods section. Non-linear microscopy exploits non-linear interaction processes between laser pulses and the material under examination to collect images with high spatial resolution, real time acquisition rate, and label-free chemical selectivity (Yue et al., 2011; Mortati et al., 2012; Pavillon et al., 2014; Ni and Zhuo, 2015; Polli et al., 2018).
In Figure 4A, some images have been reported, representing different cellular planes as a function of Z position. The images have been obtained by moving along the cellular height with the Z depth scanning method. Looking at Figure 4A, the cellular elements like the membrane as well as the internal compartments become visible, while the white arrows indicate the presence of black circles/holes inside the cells where the CARS signal is absent. The presence of those black holes in the CARS images constitute, together with the luminescence generated by the NDs after laser irradiation and reported in Figure 5, the evidence of the internalization of the NDs by the cells. The black holes observed in Figure 4A are the result of a remarkable local overheating caused by sample illumination by the laser pulses and characterized by the generation of gas microbubbles. The overheating effect has been observed in specific and limited areas within the cells as well as in the culture medium. The process of local overheating and generation of microbubbles have been recorded, and the images that document the key phases are reported in Figure 4B.
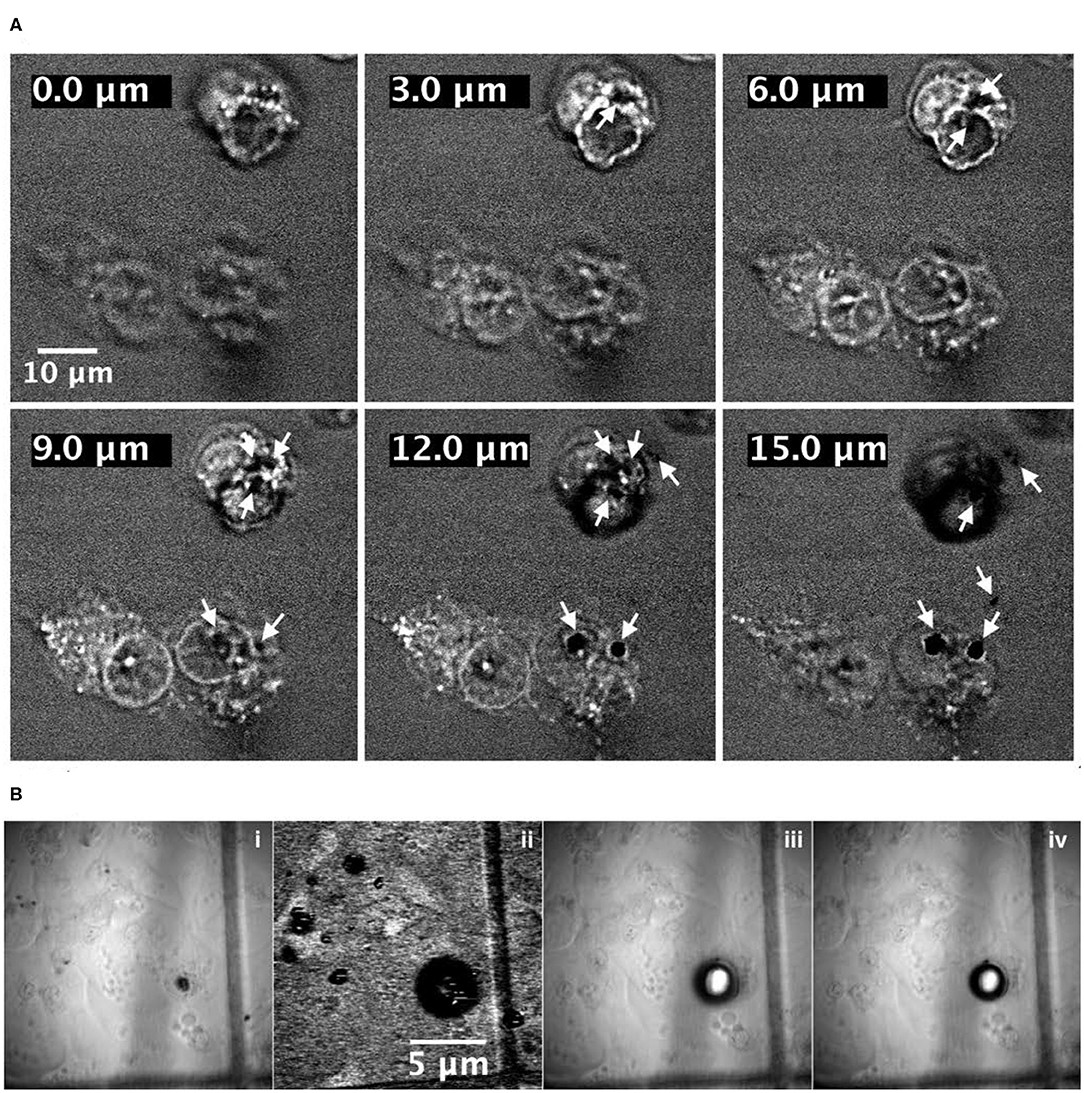
Figure 4. (A) Top: Coherent Anti-stokes Raman Scattering (CARS) images of A549 cells containing NDs: from top left to bottom right, the frames show the same image at different Z planes. Arrows show the ND localization indicated by microbubbles, which are formed due to overheating of those regions when the laser irradiates a cluster of NDs. (B) Bottom: four frames of the same sample area acquired in bright-field mode before (i) and after (iii,iv) irradiation of NDs and with CARS microscopy (ii) during irradiation. The third and fourth frames, acquired a few seconds one after the other. They evidence the quite rapid volume reduction of the bubble. Cells with no NDs did not shown any microbubbles. The sample glass has a grid feature that could help to localize the bubble and to have a rough idea of its size starting from the CARS image (ii).
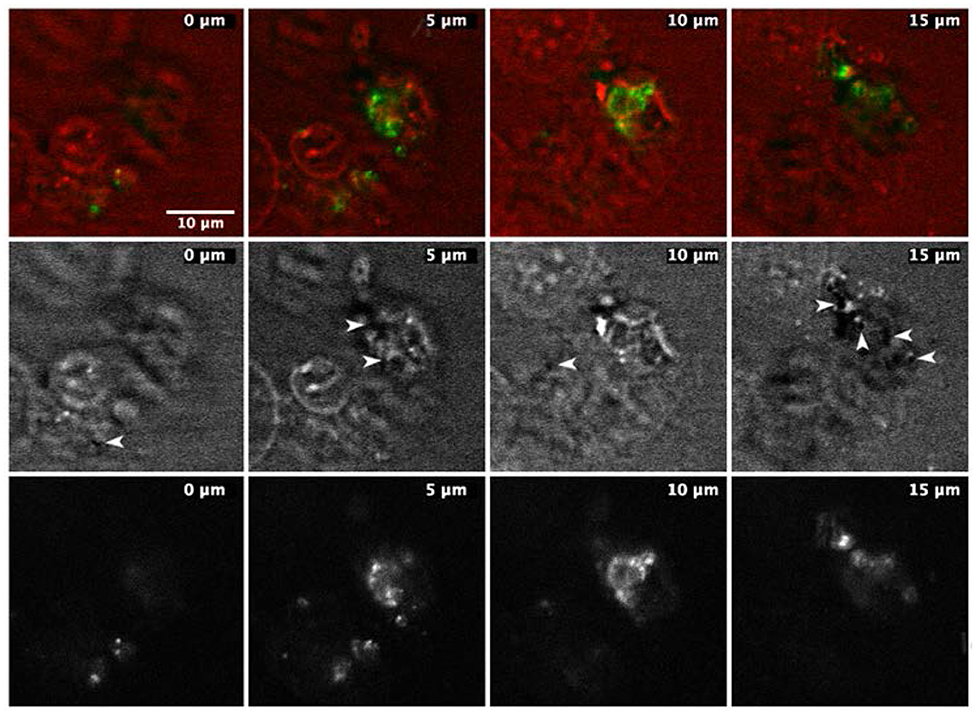
Figure 5. Time frames of the same sample area of a cell culture dish with A549 cells and NDs. Images were acquired by two modalities, CARS and two-photon photoluminescence (TPL). Top: images of cells with overlapped CARS (red) and TPL (green) signal. TPL signal comes only from selected area inside the cells, and only some of the imaged cells show the TPL signal. Middle: CARS images of the same sample area; arrows indicate the black spots, which are supposed to be NDs. Bottom: only TPL images of the same sample area: the most intense bright spots are located precisely where the black spots in CARS images are located.
The image on the lower left panel (b. i) has been recorded in bright field with an Olympus XM10 camera and represents the cell containing a large aggregate of NDs (very similar to SEM image in Figure S1 in the Supplementary Material) before being irradiated. The cell was then irradiated for the time required (a few hundreds of ms) to record a single CARS image of the cell, itself, at a fixed Z position, and the image is reported in the lower middle panel (b. ii). The image is characterized by a bright background signal coming from the non-resonant background interaction and, in the cell area, by a well-defined zone where the CARS signal is totally absent. Because the gas microbubble causes a sudden jump in the refractive index between the culture medium and the cell wall, it modifies both the spatial overlap between the pump and Stokes pulses and the transmission of the optical signal through the sample, effectively preventing the acquisition of the CARS signal. The result of laser irradiation was finally documented by recording further bright-field images (b. iii and b. iv). The images show the presence of a huge bubble surrounding the cell, and the bubble was documented to reduce gradually its dimensions with time (further images have been acquired showing the reduction process, but is not reported here). Finally, the confirmation that the overheating effect is due to laser absorption by NDs was obtained by irradiating in the same experimental conditions cells not treated with NDs and observing the complete absence of microbubbles.
The second and perhaps even more significant confirmation of the ND internalization and the indication of the position of the NDs was given by recording the ND emission by two-photon photoluminescence (TPL) (Alqudami and Annapoorni, 2007; Chi et al., 2015). Considering the shape and size of the NDs, it is indeed reasonable to expect that they have a non-negligible extinction coefficient in the region of the spectrum between 400 and 800 nm (Guo et al., 2001; Kelly et al., 2003; Sun et al., 2006; Amendola et al., 2011; Muñetón Arboleda et al., 2015; Elango et al., 2016). Therefore, irradiating the sample with laser pulses possessing an average power of the order of tens of mW and 5- to 6-ps pulse-width, can lead to a two-photon absorption, capable of inducing either photoemission and local overheating (described before). Hence, by synchronously acquiring the cell profile with CARS and the two-photon photoluminescence of NDs, it was possible to obtain a series of two-color combined images that allow reconstructing the position of the NDs within the cell. The result of this combined investigation is shown in Figure 4: the upper line of images shows the two channels (CARS and TPL) combined together to facilitate the localization of the two signals with respect to each other, while the other two lines represent the CARS (middle line) and the TPL (lower line) signals separately. The combined images (upper line) show that only some cells have internalized the NDs and that, where the concentration is high enough, the dark circles appear in the CARS images, while bright spots were observed in the TPL images. Furthermore, the TPL signal appears only in some cells confirming that there is no generalized and diffuse two-photon auto-fluorescence of the cells and that the recorded TPL comes from the intracellular NDs.
Finally, since both the CARS and TPL images have been acquired with intrinsic “confocal” techniques, each image belongs to a different focal plane (different height Z position), we can affirm that in the various cells investigated, the NDs were found predominantly within the cell, near the cell membrane.
Although there are studies that confirm the weak photoluminescence of metal nanoparticles like those of iron and nickel (Alqudami and Annapoorni, 2007; Chi et al., 2015), a recent work performed on semiconducting nanoparticles showed that an enhanced two-photon signal can be observed when the pump frequency is tuned close to a two-photon resonance of the material (Moger et al., 2008), and it cannot be completely excluded that the observed phenomenon is related to the emission of thermal radiation by nanoparticles. In fact, other works highlight the emission of thermal radiation in the spectral region between 400 and 600 nm by metallic nanoparticles subjected to irradiation with pulsed lasers having comparable powers (Estelrich et al., 2018; Long et al., 2019). However, despite the origin of the recorded emission (i.e., thermal radiation), the proposed method allows to localize the position of NDs as the thermal radiation comes exclusively from NDs.
ND Biocompatibility: Viability and Proliferation Tests
CellTiter-Blue® cell viability assay was performed at day 2 on 2D cell cultures of A549 and PT45 cells for selected ND concentrations, following the second setup. Cells only, without NDs, are used as negative control. Resaruzin test as qualitative method allows the evaluation of differences in cell quantities by different shades of color clearly visible, from blue to violet and to pink.
Figures 6A,C show wells containing the PT45 and A549 cells in fresh medium (immediately after the 2 days of incubation with NDs) where the resazurin has just been added. A dark blue color is clearly visible.
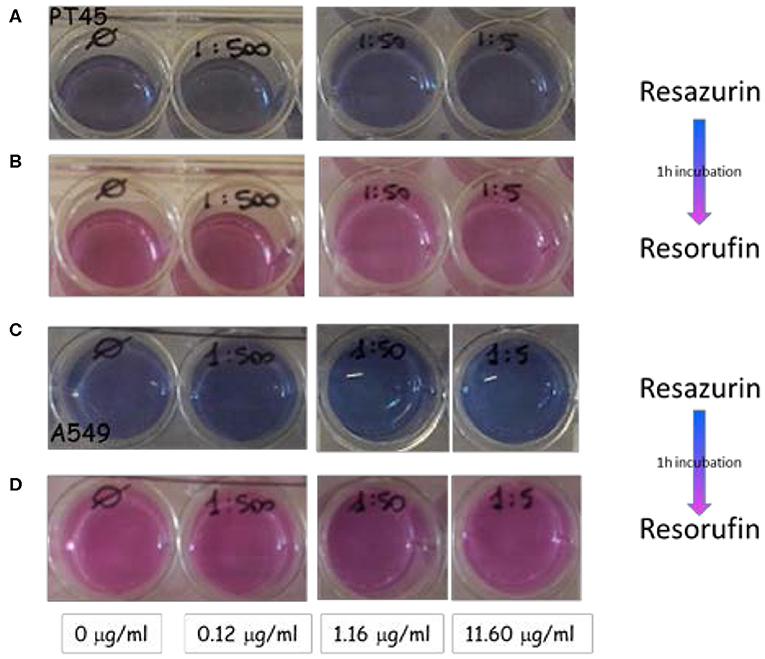
Figure 6. Wells containing the PT45 and A549 cells incubated with selected concentration of NDs at day 2: (A,C) cells in fresh medium just incubated with resazurin; (B,D) the same cells after 1 h of incubation.
The same wells after 1 h of incubation at 37°C and 5% CO2 are shown in Figures 6B,D: the color changes from blue to pink indicating that the resazurin has been metabolized by viable and metabolically active cells. In all wells containing different ND concentrations, the color change results in the same shade of pink color of the negative control well; this effect indicates that the NDs did not interfere with cell viability in the studied range concentration from 0.12 to 11.6 μg ml−1.
The effect of magnetic NDs on cell A549 proliferation was evaluated by phase-contrast optical microscopy measuring the cell confluency (ratio between the growth area occupied by cells and the total growth area) at day 8. A comparison between a negative control sample without NDs and the sample in the presence of ND at 11.6-μg ml−1 concentration is shown in Figure 7. Both samples display the same cell proliferation rate; the confluency increases from days 0 to 8 reaching 100% confluency, which indicates that the presence of NDs did not interfere with cell proliferation.
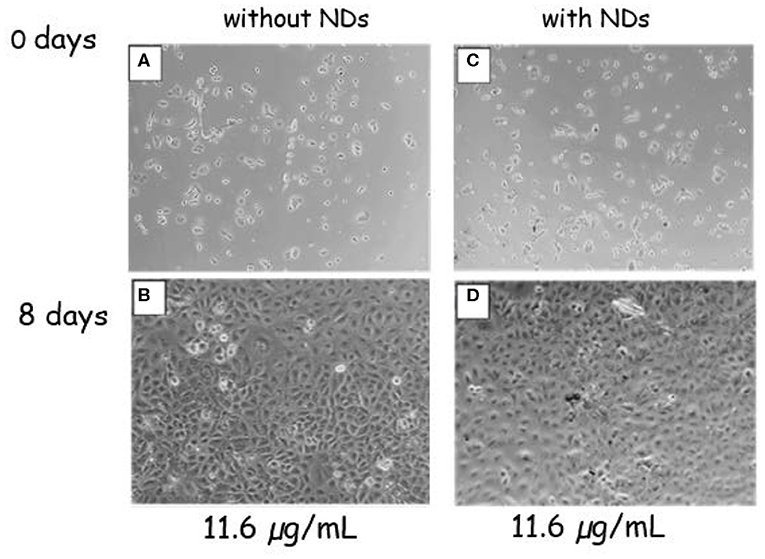
Figure 7. Phase-contrast optical images of A549 cells. Control sample without NDs at 0 (A) and 8 (B) days of culture. Cells submitted to the ND concentration of 11.6 μg ml−1 at 0 (C) and 8 (D) days of culture.
NP Retention in Cells: INAA-Based ND Number Quantification
The evidences of ND internalization in cells obtained from SEM and CARS/TPL characterizations were further examined by means of the Instrumental Neutron Activation Analysis in order to obtain also a quantification of NDs retained as a function of ND solution concentrations.
In order to prepare the samples for Instrumental Neutron Activation Analysis (INAA) characterization, the wells containing A459 or PT45 cells were incubated with 0.4 ml of cell growth medium containing NDs at the selected concentrations of 11.60, 1.16, and 0.12 μg ml−1; as a consequence, the nominal number of NDs in each well at day 0 is estimated to be 4 × 10⁷, 4 × 10⁶, and 4 × 10⁵, respectively, calculated from the single ND weight.
At day 8, cells in culture were detached and prepared for neutron irradiation following the protocol described in the Materials and Methods section. The procedure includes washing passages in order to remove NDs not internalized in the cells. This ensures that the NDs measured by INAA are within the cells.
The samples were exposed to neutron flux, and the analysis of the 411.8-keV full-energy γ-peak in the collected γ-spectra is quantitatively related to the amount of Au mass of all NDs retained in the cells.
The number of internalized NDs was obtained as the ratio of the measured total Au mass in each well to the Au mass of a single ND estimated from the volume occupied by Au in an ND (3.32 × 10⁶ nm3 in the case of 650 nm diameter and 10 nm Au total thickness) and the Au density (19.3 g cm−3).
The ND amount measured by INAA in the A549 and PT45 cell lines (at day 8) as a function of the total nominal number of NDs incubated with the cells (at day 0) is shown in Figure 8 and summarized in Table 1 where the percentage of NDs retained in A549 and PT45 cell lines were reported. The error bars show the expanded uncertainty (k = 2) calculated for INAA measurement. The uncertainty on the number of nominal NDs at day 0 (not calculated) is affected by the pipetting error and the formation of ND aggregates.
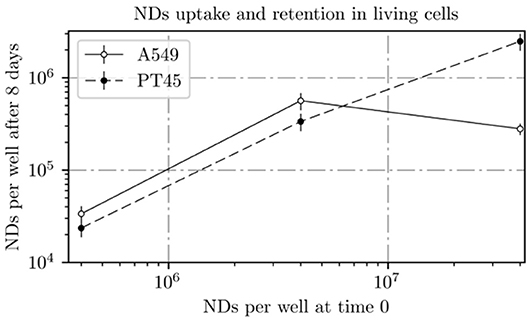
Figure 8. ND amount incubated with cells at day 0 plotted vs. ND amount measured by INAA in the A549 and PT45 cell lines at day 8.
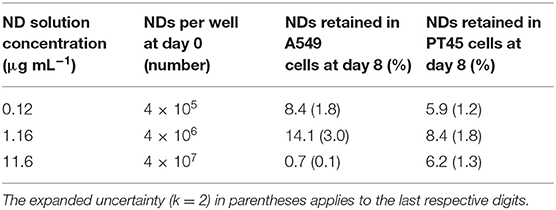
Table 1. ND number per well vs. the % of NDs retained in A549 and PT45 cell lines at day 8.
In the PT45 cell lines, the number of NDs within the cell after 8 days increases with the increase in the ND concentration in contact with cells at day 0 following an almost linear trend without an evident saturation approach.
On the other hand, in the A549 cells treated at day 0 with lower concentrations of ND solution (0.12 and 1.16 μg ml−1), the number of retained NDs in the wells is higher than the ones incubated with PT45 cells; however, a decrease in the number of retained NDs in the wells treated with the highest concentration is clearly visible.
This difference in cellular uptake/retention could be due to two reasons:
(1) Different pathways for cellular uptake of each cell type, as described by (Capco and Chen, 2014). The most likely used mechanism of cellular uptake for large particles (more than 100 nm) is the endocytic pathway based on formation of vesicles able to internalize the particles. The endocytic pathway includes different mechanisms, which depend on the protein involved, the size of the vesicles, and the cell type (Kou et al., 2013). On the other hand, also nanoparticle physicochemical properties (i.e., size, charge, and shape) can affect the transport pathway. In the specific case, the discoidal shape and the large size of NDs compared with the different size and shape of the two cell types (PT45 and A549) can strongly affect the ND retention.
Since the PT45 appear rounded and quite thick, while the A549 do not appear rounded and are fairly flat and thin (see Figure 3), it is reasonable to expect that the retention efficiency will be greater with this type of NDs for the PT45 than the A549.
(2) A549 and PT45 have a similar size when they are not attached to any substrate, but in liquid suspension (around 10 μm diameter), however, when attached on solid substrates, A549 cell confluency (area occupied by cells attached at the bottom of the cell culture well) is bigger than PT45 cell confluency. This could be explained considering that A549 are flatter than PT45 (see Figure 3) and, therefore, offer less internal space for NDs and at high ND concentration are able to retain less NDs than PT45.
Retention of NDs in both cells was higher at 1.16 μg ml−1 than at lower or higher concentration. For PT45 cells, retention percentage was between 4.7 and 10.2%, while for A549, it was between 0.6 and 17.1%.
These low values are probably due to the time (8 days) passed in culture. During this time in culture, cells naturally die and can lose a significant number of NDs.
Conclusion
The bottom-up self-assembling nanolithography process based on polystyrene nanospheres comes out as a low-cost and fast method to prepare Au-coated Ni80Fe20 nanodisks with a well-defined shape and contour. ND geometrical parameters (diameter ≈650 nm and thickness ≈30 nm) induce the formation of a magnetic vortex-state configuration at the remanence state useful to reduce the magneto-static interactions.
A549 and PT49 cell lines from human cancerous tissues maintain their cell viability, metabolic activity, and proliferation rate after 2 days of incubation with NDs at different concentrations up to 11.60 μg ml−1, until 8 days in culture even without any biocompatible functionalization layer.
The presence of the NDs within or in contact with the cells was proven by different imaging techniques: with SEM, it was possible to clearly localize and distinguish the presence of several NDs retained by the cells and distributed in small clusters with no specific space arrangement. Note that the formation of small ND ensemble does not affect the peculiar magnetic properties induced by geometrical parameters of a single ND (Barrera et al., 2016).
CARS microscopy and TPL microscopy are very useful tools for the investigation of the arrangement of metal NDs within the cellular framework. Indeed, combining the TPL signal from NDs with the reconstruction of cellular profile by CARS microscopy allows us to locate the ND within the cell. Furthermore, the observation of microbubbles within the culture medium in correspondence of the position of NDs (due to a fast overheating of the NDs) and the concomitant disappearance of the CARS signal is the final feature that led to the identification of the position of metal NDs. These imaging techniques showed that a 2-h incubation time was sufficient to ensure an ND cellular uptake.
The INAA technique is a useful tool to evaluate the amount of NDs retained in the tumor cells. It is proven that the percentage of NDs retained in cell culture depends on both the kinds of cells and the concentration of ND solution. At the concentrations of 0.12 and 1.16 μg ml−1, the A549 cells internalize a higher number of NDs than the PT45 cell, whereas at 11.60 μg ml−1, a decrease in the retained NDs in A549 cells is observed.
In 2013, Lui et al. (2013) showed that in mice treated with an injection of Au nanoparticles (16 nm size) after 24 h, the retention of nanoparticles in the animal tissues is around 80% and decreases to 30% at 72 h. Larger particles (more than 100 nm) are, instead, expected to be embedded in the extracellular matrix (ECM) surrounding the cells. Surprisingly, in this work, NDs, 650 × 30 nm, have been found able to enter and to be retained within cells up to 8 days in culture. This ND property could be used for long-term drug release after ND functionalization as drug carrier. In addition, the magnetic properties of these NDs make them potentially very useful as a therapeutic agent, such as in hyperthermia applications, but also as a bioimaging agent, such as in MRI.
Data Availability Statement
All datasets generated for this study are included in the article/Supplementary Material.
Author Contributions
All authors designed the study, analyzed the data, wrote and revised the manuscript, and given approval to the final version of the manuscript. PT and MS contributed to the conception of the study and to the discussion of the results. CD designed and performed the cell culture, viability, and proliferation experiments, and prepared the samples for INAA and imaging analysis. FC fabricated the nanodisks and performed the SEM imaging. GB and MC characterized and studied the magnetic properties of the nanodisks. GD'A and MD designed and performed the INAA measurements. AL, LM, and MZ designed and performed the multimodal imaging studies. SP contributed to the imaging experiments.
Conflict of Interest
The authors declare that the research was conducted in the absence of any commercial or financial relationships that could be construed as a potential conflict of interest.
Supplementary Material
The Supplementary Material for this article can be found online at: https://www.frontiersin.org/articles/10.3389/fnano.2020.00002/full#supplementary-material
References
Alqudami, A., and Annapoorni, S. (2007). Fluorescence from metallic silver and iron nanoparticles prepared by exploding wire technique. Plasmonics 2, 5–13. doi: 10.1007/s11468-006-9019-2
Amendola, V., Riello, P., and Meneghetti, M. (2011). Magnetic nanoparticles of iron carbide, iron oxide, iron@iron oxide, and metal iron synthesized by laser ablation in organic solvents. J. Phys. Chem. C 115, 5140–5146. doi: 10.1021/jp109371m
Bar-Ilan, O., Albrecht, R. M., Fako, V. E., and Furgeson, D. Y. (2009). Toxicity assessments of multisized gold and silver nanoparticles in zebrafish embryos. Small 5, 1897–1910. doi: 10.1002/smll.200801716
Barrera, G., Serpe, L., Celegato, F., Coïsson, M., Martina, K., Canaparo, R., et al. (2016). Surface modification and cellular uptake evaluation of Au-coated Ni80Fe20 nanodiscs for biomedical applications. Interface Focus 6:20160052. doi: 10.1098/rsfs.2016.0052
Bartczak, D., Muskens, O. L., Nitti, S., Sanchez-Elsner, T., Millar, T. M., and Kanaras, A. G. (2012). Interactions of human endothelial cells with gold nanoparticles of different morphologies. Small 8, 122–130. doi: 10.1002/smll.201101422
Barua, S., and Mitragotri, S. (2014). Challenges associated with penetration of nanoparticles across cell and tissue barriers: a review of current status and future prospects. Nano Today 9, 223–243. doi: 10.1016/j.nantod.2014.04.008
Blanco-Andujar, C., Walter, A., Cotin, G., Bordeianu, C., Mertz, D., Felder-Flesch, D., et al. (2016). Design of iron oxide-based nanoparticles for MRI and magnetic hyperthermia. Nanomedicine 11, 1889–1910. doi: 10.2217/nnm-2016-5001
Bonini, M., Berti, D., and Baglioni, P. (2013). Nanostructures for magnetically triggered release of drugs and biomolecules. Curr. Opin. Colloid Interface Sci. 18, 459–467. doi: 10.1016/j.cocis.2013.07.007
Camp Jr, C. H., and Cicerone, M. T. (2015). Chemically sensitive bioimaging with coherent Raman scattering. Nat. Photonics 9, 295–305. doi: 10.1038/nphoton.2015.60
Campanini, M., Nasi, L., Fabbrici, S., Casoli, F., Celegato, F., Barrera, G., et al. (2018). Magnetic shape memory turns to nano: microstructure controlled actuation of free-standing nanodisks. Small 14:1803027. doi: 10.1002/smll.201803027
Cardoso, V. F., Francesko, A., Ribeiro, C., Bañobre-López, M., Martins, P., and Lanceros-Mendez, S. (2018). Advances in magnetic nanoparticles for biomedical applications. Adv. Healthc. Mater. 7:1700845. doi: 10.1002/adhm.201700845
Champion, J. A., Katare, Y. K., and Mitragotri, S. (2007). Particle shape: a new design parameter for micro- and nanoscale drug delivery carriers. J. Control. Release 121, 3–9. doi: 10.1016/j.jconrel.2007.03.022
Champion, J. A., and Mitragotri, S. (2006). Role of target geometry in phagocytosis. Proc. Natl. Acad. Sci. U.S.A. 103, 4930–4934. doi: 10.1073/pnas.0600997103
Chi, P. W., Wei, D. H., Wu, S. H., Chen, Y. Y., and Yao, Y. D. (2015). Photoluminescence and wettability control of NiFe/ZnO heterostructure bilayer films. RSC Adv. 5, 96705–96713. doi: 10.1039/C5RA13973B
Decuzzi, P., and Ferrari, M. (2006). The adhesive strength of non-spherical particles mediated by specific interactions. Biomaterials 27, 5307–5314. doi: 10.1016/j.biomaterials.2006.05.024
Decuzzi, P., Godin, B., Tanaka, T., Lee, S. Y., Chiappini, C., Liu, X., et al. (2010). Size and shape effects in the biodistribution of intravascularly injected particles. J. Control. Release 141, 320–327. doi: 10.1016/j.jconrel.2009.10.014
Divieto, C., and Sassi, M. P. (2015). A first approach to evaluate the cell dose in highly porous scaffolds by using a nondestructive metabolic method. Future Sci. OA 1:FSO58. doi: 10.4155/fso.15.58
Dutz, S., and Hergt, R. (2014). Magnetic particle hyperthermia - a promising tumour therapy? Nanotechnology 25:452001. doi: 10.1088/0957-4484/25/45/452001
Elango, G., Roopan, S. M., Dhamodaran, K. I., Elumalai, K., Al-Dhabi, N. A., and Arasu, M. V. (2016). Spectroscopic investigation of biosynthesized nickel nanoparticles and its larvicidal, pesticidal activities. J. Photochem. Photobiol. B Biol. 162, 162–167. doi: 10.1016/j.jphotobiol.2016.06.045
El-Boubbou, K. (2018). Magnetic iron oxide nanoparticles as drug carriers: preparation, conjugation and delivery. Nanomedicine 13, 929–952. doi: 10.2217/nnm-2017-0320
Estelrich, J., Busquets, M., Estelrich, J., and Busquets, M. A. (2018). Iron oxide nanoparticles in photothermal therapy. Molecules 23:1567. doi: 10.3390/molecules23071567
Ferrero, R., Manzin, A., Barrera, G., Celegato, F., Coïsson, M., and Tiberto, P. (2019). Influence of shape, size and magnetostatic interactions on the hyperthermia properties of permalloy nanostructures. Sci. Rep. 9:6591. doi: 10.1038/s41598-019-43197-4
Fratila, R. M., and De La Fuente, J. M. (eds) (2019). Nanomaterials for Magnetic and Optical Hyperthermia Applications. Amsterdam: Elsevier.
Gentile, F., Chiappini, C., Fine, D., Bhavane, R. C., Peluccio, M. S., Cheng, M. M. C., et al. (2008). The effect of shape on the margination dynamics of non-neutrally buoyant particles in two-dimensional shear flows. J. Biomech. 41, 2312–2318. doi: 10.1016/j.jbiomech.2008.03.021
Giner-Casares, J. J., Henriksen-Lacey, M., Coronado-Puchau, M., and Liz-Marzán, L. M. (2016). Inorganic nanoparticles for biomedicine: where materials scientists meet medical research. Mater. Today 19, 19–28. doi: 10.1016/j.mattod.2015.07.004
Gratton, S. E. A., Ropp, P. A., Pohlhaus, P. D., Luft, J. C., Madden, V. J., Napier, M. E., et al. (2008). The effect of particle design on cellular internalization pathways. Proc. Natl. Acad. Sci. U.S.A. 105, 11613–11618. doi: 10.1073/pnas.0801763105
Guo, L., Huang, Q., Li, X., and Yang, S. (2001). Iron nanoparticles: synthesis and applications in surface enhanced raman scattering and electrocatalysis. Phys. Chem. Chem. Phys. 3, 1661–1665. doi: 10.1039/b009951l
He, S., Zhang, H., Liu, Y., Sun, F., Yu, X., Li, X., et al. (2018). Maximizing specific loss power for magnetic hyperthermia by hard–soft mixed ferrites. Small 14:1800135. doi: 10.1002/smll.201800135
Huang, H.-C., Barua, S., Sharma, G., Dey, S. K., and Rege, K. (2011). Inorganic nanoparticles for cancer imaging and therapy. J. Control. Release 155, 344–357. doi: 10.1016/j.jconrel.2011.06.004
Jiang, P., Zhang, Y., Zhu, C., Zhang, W., Mao, Z., and Gao, C. (2016). Fe3O4/BSA particles induce osteogenic differentiation of mesenchymal stem cells under static magnetic field. Acta Biomater 46, 141–150. doi: 10.1016/j.actbio.2016.09.020
Kelly, K. L., Coronado, E., Zhao, L. L., and Schatz, G. C. (2003). The optical properties of metal nanoparticles: the influence of size, shape, and dielectric environment. ChemInform 107, 668–677. doi: 10.1002/chin.200316243
Kim, D. H., Rozhkova, E. A., Ulasov, I. V., Bader, S. D., Rajh, T., Lesniak, M. S., et al. (2010). Biofunctionalized magnetic-vortex microdiscs for targeted cancer-cell destruction. Nat. Mater. 9, 165–171. doi: 10.1038/nmat2591
Kinnear, C., Moore, T. L., Rodriguez-Lorenzo, L., Rothen-Rutishauser, B., and Petri-Fink, A. (2017). Form follows function: nanoparticle shape and its implications for nanomedicine. Chem. Rev. 117, 11476–11521. doi: 10.1021/acs.chemrev.7b00194
Kou, L., Sun, J., Zhai, Y., and He, Z. (2013). The endocytosis and intracellular fate of nanomedicines: implication for rational design. Asian J. Pharm. Sci. 8, 1–10. doi: 10.1016/j.ajps.2013.07.001
Lee, T. R., Choi, M., Kopacz, A. M., Yun, S. H., Liu, W. K., and Decuzzi, P. (2013). On the near-wall accumulation of injectable particles in the microcirculation: smaller is not better. Sci. Rep. 3:2079. doi: 10.1038/srep02079
Leulmi, S., Chauchet, X., Morcrette, M., Ortiz, G., Joisten, H., Sabon, P., et al. (2015). Triggering the apoptosis of targeted human renal cancer cells by the vibration of anisotropic magnetic particles attached to the cell membrane. Nanoscale 7, 15904–15914. doi: 10.1039/C5NR03518J
Li, Y., Liu, J., Zhong, Y., Zhang, J., Wang, Z., Wang, L., et al. (2011). Biocompatibility of Fe3O4@Au composite magnetic nanoparticles in vitro and in vivo. Int. J. Nanomedicine 6, 2805–2819. doi: 10.2147/IJN.S24596
Liu, X., Chen, Y., Li, H., Huang, N., Jin, Q., Ren, K., et al. (2013). Enhanced retention and cellular uptake of nanoparticles in tumors by controlling their aggregation behavior. ACS Nano 7, 6244–6257. doi: 10.1021/nn402201w
Liyanage, P. Y., Hettiarachchi, S. D., Zhou, Y., Ouhtit, A., Seven, E. S., Oztan, C. Y., et al. (2019). Nanoparticle-mediated targeted drug delivery for breast cancer treatment. Biochim. Biophys. Acta Rev. Cancer 1871, 419–433. doi: 10.1016/j.bbcan.2019.04.006
Long, B. A., Rodriguez, D. J., Lau, C. Y., and Anderson, S. L. (2019). Thermal emission spectroscopy for single nanoparticle temperature measurement: optical system design and calibration. Appl. Opt. 58, 642. doi: 10.1364/AO.58.000642
Moger, J., Johnston, B. D., and Tyler, C. R. (2008). Imaging metal oxide nanoparticles in biological structures with CARS microscopy. Opt. Express 16:3408. doi: 10.1364/OE.16.003408
Mortati, L., Divieto, C., and Sassi, M. P. (2012). CARS and SHG microscopy to follow collagen production in living human corneal fibroblasts and mesenchymal stem cells in fibrin hydrogel 3D cultures. J. Raman Spectrosc. 43, 675–680. doi: 10.1002/jrs.3171
Muñetón Arboleda, D., Santillán, J. M. J., Mendoza Herrera, L. J., van Raap, M. B. F., Mendoza Zélis, P., Muraca, D., et al. (2015). Synthesis of Ni nanoparticles by femtosecond laser ablation in liquids: structure and sizing. J. Phys. Chem. C 119, 13184–13193. doi: 10.1021/acs.jpcc.5b03124
Napierska, D., Quarck, R., Thomassen, L. C. J., Lison, D., Martens, J. A., Delcroix, M., et al. (2013). Amorphous silica nanoparticles promote monocyte adhesion to human endothelial cells: size-dependent effect. Small 9, 430–438. doi: 10.1002/smll.201201033
Ni, M., and Zhuo, S. (2015). Nonlinear optical microscopy: endogenous signals and exogenous probes. Ann. Phys. 527, 471–489. doi: 10.1002/andp.201500119
Noukeu, L. C., Wolf, J., Yuan, B., Banerjee, S., and Nguyen, K. T. (2018). Nanoparticles for detection and treatment of peripheral arterial disease. Small 14:1800644. doi: 10.1002/smll.201800644
Paris, J. L., Villaverde, G., Gómez-Graña, S., and Vallet-Regí, M. (2020). Nanoparticles for multimodal antivascular therapeutics: dual drug release, photothermal and photodynamic therapy. Acta Biomater. 101, 459–468. doi: 10.1016/j.actbio.2019.11.004
Pavillon, N., Fujita, K., and Isaac Smith, N. (2014). Multimodal label-free microscopy. J. Innov. Opt. Health Sci. 07:1330009. doi: 10.1142/S1793545813300097
Peixoto, L., Magalhães, R., Navas, D., Moraes, S., Redondo, C., Morales, R., et al. (2020). Magnetic nanostructures for emerging biomedical applications. Appl. Phys. Rev. 7:011310. doi: 10.1063/1.5121702
Petros, R. A., and DeSimone, J. M. (2010). Strategies in the design of nanoparticles for therapeutic applications. Nat. Rev. Drug Discov. 9, 615–627. doi: 10.1038/nrd2591
Polli, D., Kumar, V., Valensise, C. M., Marangoni, M., and Cerullo, G. (2018). Broadband coherent raman scattering microscopy. Laser Photon. Rev. 12:1800020. doi: 10.1002/lpor.201800020
Rozhkova, E. A., Novosad, V., Kim, D. H., Pearson, J., Divan, R., Rajh, T., et al. (2009). Ferromagnetic microdisks as carriers for biomedical applications. J. Appl. Phys. 105, 21–24. doi: 10.1063/1.3061685
Sun, Y.-P., Li, X., Cao, J., Zhang, W., and Wang, H. P. (2006). Characterization of zero-valent iron nanoparticles. Adv. Colloid Interface Sci. 120, 47–56. doi: 10.1016/j.cis.2006.03.001
Thanh, N. T. K. T. (2012). Magnetic Nanoparticles From Fabrication to Clinical Applications. Boca Raton, FL: CRC Press.
Tiberto, P., Barrera, G., Celegato, F., Conta, G., Coïsson, M., Vinai, F., et al. (2015). Ni80 Fe20 nanodisks by nanosphere lithography for biomedical applications. J. Appl. Phys. 117:17B304. doi: 10.1063/1.4913278
Tiberto, P., Celegato, F., Barrera, G., Coisson, M., Vinai, F., and Rizzi, P. (2016). Magnetization reversal and microstructure in polycrystalline Fe50Pd50 dot arrays by self-assembling of polystyrene nanospheres. Sci. Technol. Adv. Mater. 17, 462–472. doi: 10.1080/14686996.2016.1201414
Toy, R., and Roy, K. (2016). Engineering nanoparticles to overcome barriers to immunotherapy. Bioeng. Transl. Med. 1, 47–62. doi: 10.1002/btm2.10005
Tran, N., and Webster, T. J. (2010). Magnetic nanoparticles: biomedical applications and challenges. J. Mater. Chem. 20, 8760–8767. doi: 10.1039/c0jm00994f
Truong, N. P., Whittaker, M. R., Mak, C. W., and Davis, T. P. (2015). The importance of nanoparticle shape in cancer drug delivery. Expert Opin. Drug Deliv. 12, 129–142. doi: 10.1517/17425247.2014.950564
Venkataraman, S., Hedrick, J. L., Ong, Z. Y., Yang, C., Ee, P. L. R., Hammond, P. T., et al. (2011). The effects of polymeric nanostructure shape on drug delivery. Adv. Drug Deliv. Rev. 63, 1228–1246. doi: 10.1016/j.addr.2011.06.016
Verma, A., and Stellacci, F. (2010). Effect of surface properties on nanoparticles-cell interactions. Small 6, 12–21. doi: 10.1002/smll.200901158
Wagner, A. M., Knipe, J. M., Orive, G., and Peppas, N. A. (2019). Quantum dots in biomedical applications. Acta Biomater. 94, 44–63. doi: 10.1016/j.actbio.2019.05.022
Wong, A. C., and Wright, D. W. (2016). Size-dependent cellular uptake of DNA functionalized gold nanoparticles. Small 12, 5592–5600. doi: 10.1002/smll.201601697
Xu, C.-H., Ye, P.-J., Zhou, Y.-C., He, D.-X., Wei, H., and Yu, C.-Y. (2020). Cell membrane-camouflaged nanoparticles as drug carriers for cancer therapy. Acta Biomater. 105, 1–14. doi: 10.1016/j.actbio.2020.01.036
Keywords: tumor cells, magnetic nanodisks, cell–disk interactions, Instrumental Neutron Activation Analysis (INAA), Coherent Anti-stokes Raman Scattering/two-photon photoluminescence (CARS/TPL) multimodal microscopy
Citation: Divieto C, Barrera G, Celegato F, D'Agostino G, Di Luzio M, Coïsson M, Lapini A, Mortati L, Zucco M, Pavarelli S, Sassi MP and Tiberto P (2020) Au-Coated Ni80Fe20 Submicron Magnetic Nanodisks: Interactions With Tumor Cells. Front. Nanotechnol. 2:2. doi: 10.3389/fnano.2020.00002
Received: 10 March 2020; Accepted: 20 May 2020;
Published: 16 July 2020.
Edited by:
Cristina Satriano, University of Catania, ItalyReviewed by:
Maria Alba, Monash University, AustraliaYannan Yang, The University of Queensland, Australia
Copyright © 2020 Divieto, Barrera, Celegato, D'Agostino, Di Luzio, Coïsson, Lapini, Mortati, Zucco, Pavarelli, Sassi and Tiberto. This is an open-access article distributed under the terms of the Creative Commons Attribution License (CC BY). The use, distribution or reproduction in other forums is permitted, provided the original author(s) and the copyright owner(s) are credited and that the original publication in this journal is cited, in accordance with accepted academic practice. No use, distribution or reproduction is permitted which does not comply with these terms.
*Correspondence: Gabriele Barrera, g.barrera@inrim.it
†ORCID: Gabriele Barrera orcid.org/0000-0002-3174-8092
‡These authors have contributed equally to this work