Burst analysis tool for developing neuronal networks exhibiting highly varying action potential dynamics
- 1Department of Biomedical Engineering, Tampere University of Technology, Tampere, Finland
- 2Institute of Biosciences and Medical Technology, Tampere, Finland
- 3Department of Psychology, University of Jyväskylä, Jyväskylä, Finland
- 4NeuroGroup, Institute of Biomedical Technology, University of Tampere and Tampere University Hospital, Tampere, Finland
In this paper we propose a firing statistics based neuronal network burst detection algorithm for neuronal networks exhibiting highly variable action potential dynamics. Electrical activity of neuronal networks is generally analyzed by the occurrences of spikes and bursts both in time and space. Commonly accepted analysis tools employ burst detection algorithms based on predefined criteria. However, maturing neuronal networks, such as those originating from human embryonic stem cells (hESCs), exhibit highly variable network structure and time-varying dynamics. To explore the developing burst/spike activities of such networks, we propose a burst detection algorithm which utilizes the firing statistics based on interspike interval (ISI) histograms. Moreover, the algorithm calculates ISI thresholds for burst spikes as well as for pre-burst spikes and burst tails by evaluating the cumulative moving average (CMA) and skewness of the ISI histogram. Because of the adaptive nature of the proposed algorithm, its analysis power is not limited by the type of neuronal cell network at hand. We demonstrate the functionality of our algorithm with two different types of microelectrode array (MEA) data recorded from spontaneously active hESC-derived neuronal cell networks. The same data was also analyzed by two commonly employed burst detection algorithms and the differences in burst detection results are illustrated. The results demonstrate that our method is both adaptive to the firing statistics of the network and yields successful burst detection from the data. In conclusion, the proposed method is a potential tool for analyzing of hESC-derived neuronal cell networks and thus can be utilized in studies aiming to understand the development and functioning of human neuronal networks and as an analysis tool for in vitro drug screening and neurotoxicity assays.
Introduction
In this paper we study methods to assess the bursting behavior of developing human neuronal networks. Previously, it has been shown that human embryonic stem cell (hESC)-derived neuronal cells are functional at single cell level (Carpenter et al., 2001; Erceg et al., 2008; Lai et al., 2008; Daadi et al., 2009; Bissonnette et al., 2011; Kim et al., 2011) and can form spontaneously functional neuronal networks (Heikkilä et al., 2009). Compared to the more widely studied in vitro neuronal networks, that is, rodent primary cultures, it seems that networking mechanisms and behavior of hESC-derived neurons are more variable in their statistics from individual spikes to bursts (Heikkilä et al., 2009). This calls for new methods for the assessment of network development and functioning, since traditional burst detection algorithms are not in general capable of capturing the bursts and related features of such networks.
To assess the functioning of neuronal networks in their different developmental stages and to observe their responses to different drugs, toxins, and chemicals, substrate integrated microelectrode arrays (MEAs) provide an in vitro platform to monitor the firing patterns and the network activity (Gross et al., 1977; Pine, 1980; Wagenaar et al., 2006; Illes et al., 2007; Heikkilä et al., 2009; Ylä-Outinen et al., 2010). Neuronal activity is normally described either by single cell firing called spikes or actual network activity manifested by more or less regular occurring short episodes of intense firing called bursts (Kandel and Spencer, 1961; Connors et al., 1982; Gray and McCormick, 1996). In this type of network activity, neurons are interacting and firing in an orchestrated manner. It is suggested that bursts reflect and influence the plasticity mechanisms and could be used for assessment of network activity (Lisman, 1997). It has been shown, for example, that cultured networks of rat cortical neurons exhibit a significant increase in spontaneous bursting during the development of new synapses and networks (Ichikawa et al., 1993; Maeda et al., 1995; Kamioka et al., 1996). Thus, analysis of bursting behavior is a way to assess the developing neuronal network properties.
Even though bursting is a very fundamental property of the neuronal networks, the definitions of bursts and burst detection methods, however, differ between studies. Some define bursts according to interspike interval (ISI) thresholds and the numbers of spikes in bursts which are set by visual inspection, such as utilizing a fixed ISI of 100 ms and a minimum number of 10 spikes in bursts (Chiappalone et al., 2005), or again utilizing a fixed ISI and a minimum number of spikes in bursts which are chosen according to experimental conditions and differentiate bursts from other activity based on the slopes in time-spike number curves (Turnbull et al., 2005). Others utilize calculated average ISIs of the measurements (Mazzoni et al., 2007), average firing rates and alternatively a fixed ISI threshold of 100 ms (Wagenaar et al., 2006), or logarithmic histogram of ISIs to calculate an ISI threshold for detecting bursts (Selinger et al., 2007; Pasquale et al., 2010). These methods, except that by Turnbull et al. (2005), are focused on analyzing the activity of neurons extracted from rat central nervous system such as rat cortical neurons (Chiappalone et al., 2005; Wagenaar et al., 2006; Pasquale et al., 2010) and rat hippocampal neurons (Mazzoni et al., 2007). Thus, they may be tuned to the type of the analyzed network. In the developing networks, the spiking and bursting may behave differently as the network is formed by active neuronal movement, process formation, and synaptic modulation. In fact, beside the frequent occurrence of “primitive” bursts which are formed by a few spikes, we also observed bursts with tens of spikes and bursts lasting from milliseconds to seconds while studying maturing hESC-derived neuronal networks (Heikkilä et al., 2009). The earlier mentioned most widely applied burst detection and burst analysis methods, however, ignore the primitive and unstable spike train and burst activity of hESC-derived neuronal networks. The spike trains or bursts of such networks are in this paper defined to be “unstable” if their statistics such as the number of spikes forming bursts, ISIs inside and between bursts, burst durations, etc., highly vary.
In addition to the need for an applicable burst detection method for developing neuronal networks, it is necessary to obtain characterization measures for the practical analysis of the responses of the networks to different treatments, drugs, toxins, or chemicals. Several parameters such as overall spiking activity, burst frequency, and duration can be used in activity characterization (Bal-Price et al., 2010; Äänismaa et al., 2011; Defranchi et al., 2011; Hogberg et al., 2011). These parameters can be obtained from large data pools by an analysis tool which has no bias for a certain type of analyzed networks, such as fixed burst parameters, e.g., ISI or the number of spikes in bursts. Thus there is a need for methods that provide these parameters also intrinsically from developing networks.
Here, we propose a burst detection method without any a priori fixed burst criteria, and demonstrate its applicability with maturing hESC-derived neuronal networks. To demonstrate the need for such methods we illustrate the dynamic nature of hESC-derived neuronal networks during maturation by spike activity maps for different measurement days. Thereafter, we shortly review the existing burst detection methods and compare their performances in the analysis of hESC-derived neuronal network recordings. We compare the applicability of the methods, and finally discuss potential uses of the hereby proposed method in assessing the characteristics of various neuronal networks.
Materials and Methods
Cell Cultures
hESCs [cell line Regea 08/023, passages 36 (used in dataset-I), 42 (used in datasets-II and -III), 44 (used in dataset-IV), and 60 (used in dataset-V)] were differentiated into neuronal cells using the previously published method (Sundberg et al., 2009; Lappalainen et al., 2010) and plated on MEAs as described in Heikkilä et al. (2009). Briefly, 10–15 small aggregates dissected from neurospheres (50,000–150,000 cells in total) were plated on MEA dishes coated with polyethyleneimine (0.05% solution, Sigma-Aldrich, St. Louis, MO, USA) and subsequently with human laminin (20 μg/ml, Sigma-Aldrich). Medium containing basic fibroblast growth factor (4 ng/ml, FGF, Sigma-Aldrich) and brain-derived growth factor (5 ng/ml, BNDF, Gibco Invitrogen, Carlsbad, CA, USA or Peprotech, Rocky Hill, NJ, USA) was replaced three times a week. The cell seeding area in the MEA was either the normal, that is, 20 mm in diameter or the area was restricted to Ø 4 mm to reduce the amount of cells needed and to guide the cells to grow on top of the electrode area.
All the MEAs with cells were kept in an incubator (+37°C, 5% CO2, 95% air) prior to and between recordings. All recordings were made using MEAs and equipment's purchased from Multi Channel Systems MCS GmbH (MCS, Reutlingen, Germany). hESC experiments were performed in the Institute of Biomedical Technology (University of Tampere, Tampere, Finland) that has the approval from the Ethics Committee of the Pirkanmaa Hospital District to culture the hESC lines.
Electrophysiological Recordings
Electrical activities were recorded using MEAs with square arrays of 59 substrate-embedded titanium nitride microelectrodes (30 μm in diameter, 200 μm inter-electrode distance, model: 200/30iR-Ti-gr, MCS) and internal embedded reference electrodes. Signals were sampled at 20 kHz, and stored to a standard PC using the MC_Rack software (MCS). The culture temperature was maintained at +37°C using a TC02 temperature controller (MCS) during the measurements. Recordings were visually inspected for artifacts and the measurements or channels likely to contain artifacts were excluded from the further analysis. In this paper, for demonstrating the proposed analysis methods, we opted for the analysis of artifact free data only. Spike detection was carried out online by setting an amplitude threshold at six times the standard deviation of the signal noise level and the spike time stamps and spike waveform cutouts were stored in the MC Rack software.
For method validation, we utilized five different data sets (Ds-I, Ds-II, Ds-III, Ds-IV, Ds-V) that altogether contained measured data from 27 MEAs (each containing 59 electrodes referred to hereafter as channels or ch). Each MEA was measured altogether three times (mes1, mes2, and mes3) and each measurement lasted approximately 300 s. The first measurement day was chosen according to the criteria that at least 10% of the channels in a MEA were active and in active channels at least 100 spikes were found during the recording period. The first measurement day (mes1) varied between 6 and 22 days of culturing in MEA. Thereafter, the developing networks were measured at 4–7 days after the first measurement (mes2), and the third measurement day (mes3) was 2–4 days after the second measurement day (Table 1).
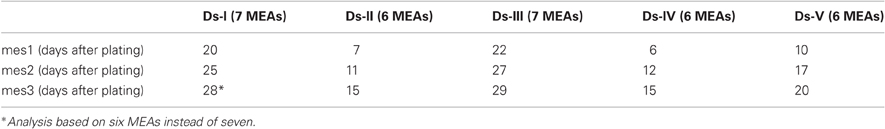
Table 1. The measurement days and the number of included MEAs for different data sets.
Spike Activity Colormaps
To observe how dynamic the firing was during the maturation process of hESC-derived neurons, a spike activity map (colormap) of all 59 channels for different measurement days were formed. In our colormaps, MEA channels are represented as an 8 × 8 matrix and the layout of the MEA matches the colormap matrix elements spatially. Since a MEA has 60 channels (including the reference channel), the corner elements of the colormap matrix have no values. Thus, the color shown in the corners of the subfigures of Figure 1 is set based on values interpolated from the neighboring channels.
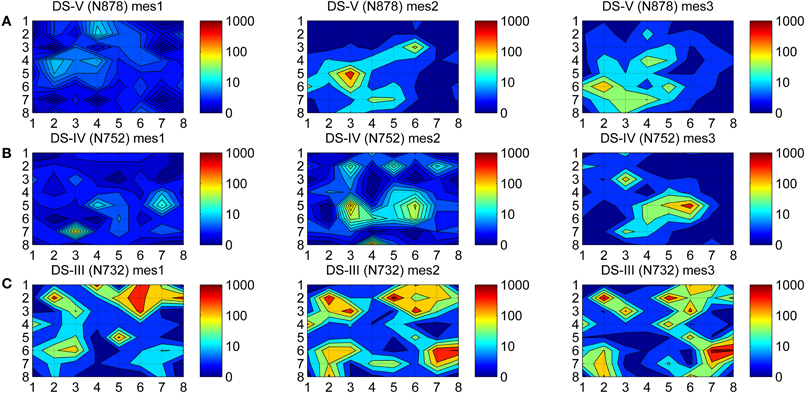
Figure 1. Colormaps of the spike activities. Spikes were counted from all three measurements time points (mes1, mes2, mes3) from the individual MEAs from three different data sets (A) Ds-V, (B) Ds-IV, and (C) Ds-III. Logarithmic values of the counts are mapped to colors to better facilitate observations, dark blue representing silent channels (0 spikes) and dark red the most active ones (1000 spikes).
At first, spikes were counted separately for the different measurement days, yielding the total spike counts of each measurement for every MEA channel. Secondly, the logarithms of these spike counts were calculated to be able to show a wide range of values in the same colormap, and the values were mapped to color, the colors were interpolated between the channels, and the colormaps were contoured.
ISI and ISI Histogram Based Burst Definitions
Time intervals between consecutive spikes, i.e., ISIs are very commonly used in the analysis of neuronal recordings. ISI has also been used as one of criteria to detect the burst activity in some reported algorithms (Chiappalone et al., 2005; Wagenaar et al., 2006; Mazzoni et al., 2007). In these algorithms, an ISI threshold is selected or calculated and a fixed number of consecutive spikes (three, four, or ten, depending on the algorithm) with ISIs less than the selected threshold are considered burst spikes. On the other hand, an ISI histogram can be easily formed after spike detection by counting the spikes and time binning ISIs. It can be calculated for, e.g., each channel, recording, measurement day or complete dataset. Although ISI histograms are capable of representing some characteristics of the firing activities, it is usually not rewarding to analyze them alone. Gradual decay in the ISI histogram, forming a tail after the peak of the ISI histogram and fluctuations of local extrema (local minima and maxima) are common observations in ISI histograms. The analysis of such histogram behavior is a promising method for network analysis, although some aspects of network characteristics are not easily observable in raw ISI histograms.
Logarithmic Interspike Interval Histogram (logISIH) Algorithm
One of the alternative solutions for analyzing ISI histograms is plotting the logarithmic ISI instead of plain ISI, which was proposed previously by Selinger et al. (2007) and employed in rat cortical cell measurement analysis by Pasquale et al. (2010). The method is based on plotting ISI histograms using logarithmic instead of linear scale. In the algorithm, ISI threshold is selected at the point where intra-burst ISI is most clearly separated from inter-burst ISI. Clear separation is indicated by the distinct principal and secondary peaks formed in the logarithmic histogram representing intra and inter-burst ISIs, respectively (see Figure 7A). Parameter “void,” which is described in detail by Selinger et al. (2007), is calculated to assess this separation. In logISIH algorithm, if the ISI threshold is lower than 100 ms, bursts are detected only according to this threshold; otherwise a fixed ISI threshold of 100 ms is employed in finding burst cores and the calculated threshold is employed to detect burst boundary spikes. Complete detected bursts are formed by combining the detected burst cores with the boundary spikes adjacent to each burst core. The algorithm has strict rules such as the occurrence of the first peak (principal peak) in the ISI histogram, which represents intra-burst ISIs, within a defined time window (here 100 ms). Recordings should have at least one peak at an ISI less than 100 ms in their logarithmic ISI histograms. In the case where the logarithmic histograms of the recordings have no good separation between inter-burst and intra-burst ISIs or there is no principal peak before 100 ms, another strict burst definition is employed, such as requiring 10 spikes in a row which have ISIs less than 100 ms, as in the study by Chiappalone et al. (2005). As a result, this algorithm was not very suitable for the analysis of our data as bursts with 10 or more spikes are hardly available. To make the algorithm more comparable to our algorithm and applicable to our data, we modified the algorithm to consider three spikes in a row instead of 10.
Cumulative Moving Average Method for Detecting Bursts
For analyzing the recordings for which no clear separation can be observed between the inter- and intra-burst ISIs, like the majority of the recordings obtained from maturing hESCs (see Figure 8A), we propose an adaptive method based on the cumulative moving average (CMA) of the ISI histogram. As an alternative for analyzing the raw ISI histogram, CMA of the ISI histogram allows us to observe the cumulative average spike count up to a particular ISI. Generally, CMA of a data series smoothens short term fluctuations and highlights long term trends. In our particular case, CMA of the ISI histogram provides us the general change in the trend of the ISI histogram, and allows us to define an ISI value which we can use as a threshold to define the bursts in a particular recording. Thus, without considering any local changes we can identify the ISIs at which critical changes occur, i.e., the ISI at which the average spike count starts decreasing. The proposed algorithm has no strictly fixed parameters that would render any particular types of neuronal network behaviors not analyzable. Thus, every recording is evaluated based on its inner dynamics and bursts are detected for further network analyzes and characterization.
The proposed CMA algorithm was implemented in Matlab environment for post recording analysis and consists of the steps described in the following three subchapters.
Calculating ISI threshold for burst like patterns
Let yi, i = 1,…,N, with N the total number of ISI bins, be the spike count in the ith ISI bin. The value of the cumulative sum of the histogram CHI at the Ith, I ≤ N, ISI bin is defined as
The corresponding CMA is given by
whose maximum, CMAm, is reached at the mth ISI bin, and
This point represents the maximum that the average spike count reaches. ISI threshold for defining a burst might, for example, be selected at this maximum point after which CMA begins to decrease. However, adding a tolerance to this maximum, i.e., selecting the actual ISI threshold as α·CMAm, where 0 < α < 1, strengthens the burst detection. Here, α is selected according to the ISI behavior of the ISI histogram. Generally, the ISI histogram of a burst containing recording and its CMA curve exhibit a peak at lower ISI values and a tail at higher ISI values. Intra-burst ISIs are expected to be in the neighborhood of the peak because of the fact that intra-burst ISIs are shorter than the ISIs of individual spikes which don't belong to a burst. If they exist, individual spikes are located in the tail of the histogram, whereas burst tails or pre-burst spikes (burst related spikes) are located in the histogram between ISIs of intra-burst spikes and ISIs of individual spikes. For a simple bursting model, in which ISI values do not widely vary, ISI values will form an almost symmetrical distribution with a short tail, i.e., the skewness of the distribution is approximately zero, and most of the burst spikes are expected to be located in the vicinity of CMAm (c.f., Figure 2A). Thus, we can define two parameters: α1 which can be set close to one, and for the burst related spikes α2 < α1. However, for most of the burst models ISI histograms lean to the right with a tail, i.e., they are positively skewed. In these cases, ISI values have large variance, and also the tail of the ISI histogram contains intra-burst ISIs (c.f., Figures 2B,C). Longer the tail, more skewed the histogram, and the smaller α can be set not to miss the intra-burst ISIs in the tail. Denoting the ISI at CMAm (3) by xm, the ISI threshold xt, xt > xm, for burst detection is found at the mid time point of the ISI bin for which the value of the CMA curve is the closest to α·CMAm. In Figure 3, CMA of the ISI histogram and the calculation of the threshold are illustrated. After calculating the threshold, burst detection is employed, here with the requirement of at least three spikes in a row (triplet) with ISIs below the calculated ISI threshold. We consider that extracellular burst means more event than one, as also noted by Lisman (1997) and Izhikevich et al. (2003), thus we concentrated on triplets to be sure for this study. However, also two spikes in a row (duplet) instead of a triplet can be accommodated in the algorithm's if the user prefers this option.
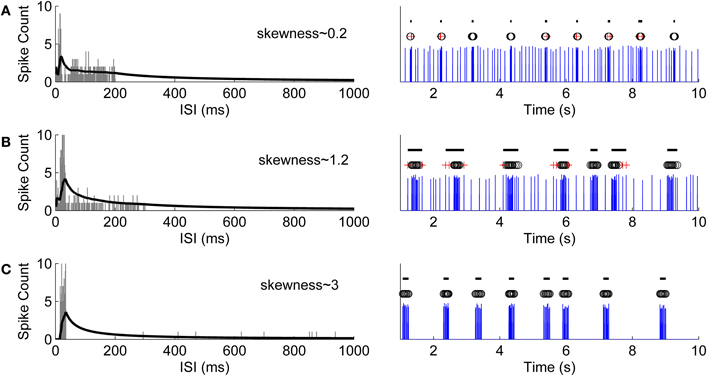
Figure 2. Simulation of different bursting models and their ISI histograms with the corresponding calculated CMA curves and skewness values. (A) A simple model whose ISI values don't widely vary. ISI distribution is almost symmetrical with a short tail and an approximate skewness value of 0.2. On the left hand side, the ISI histogram is shown with gray bars and the corresponding CMA curve is shown with black line. On the right hand side, the bursts detected using an α value which corresponds to the skewness value are labeled by black lines. Black circles denote the burst spikes whereas red crosses represent the burst related spikes [similarly for (B) and (C)]. (B) A bursting model with a wider tail in its ISI histogram with an approximate skewness value of 1.2. (C) A bursting model with a wider ISI distribution than in the previous models. Consequently, its histogram has a longer tail and a relatively higher skewness value of approximately 3.
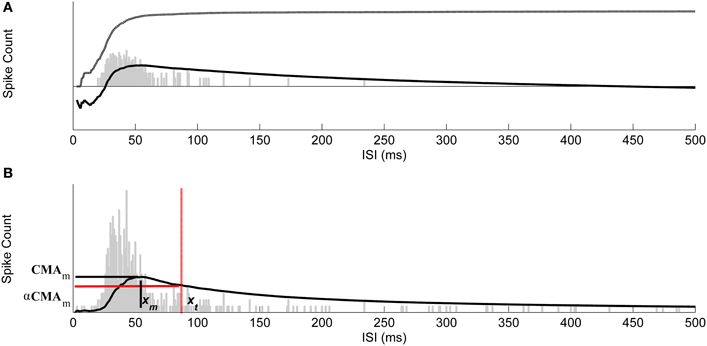
Figure 3. Selecting thresholds for burst ISIs by using CMA curve. (A) The ISI histogram (gray bars), cumulative histogram (dash-dotted), and the corresponding CMA curve (solid). Vertical axis is logarithmic. (B) Maximum value of CMA curve, CMAm, is reached at the ISI xm and the ISI threshold xt for bursting was found at the ISI corresponding to the CMA value closest to α·CMAm. The ISI threshold for burst detection is marked with red dash-dotted vertical line. Vertical axis is linear and thus the cumulative histogram is not shown.
Calculating ISI threshold for burst related spikes
The term burst related spikes is used here for defining the burst tails or pre-burst spikes which are located in the neighborhood of bursts and are an essential part of the bursting behavior. In a previous study, changes in the firing activity before and after bursts were observed and analyzed (Wang and Hatton, 2005). Burst tails have also been studied and utilized in classifying bursting behaviors (Wagenaar et al., 2006). It is common to observe the burst related spikes in our recordings as well. To calculate ISI threshold for the burst related spikes with α2, the first step of the CMA algorithm is repeated. After detecting the potential burst related spikes, the ones which are not following or followed by a burst are omitted.
To automatically select α values, we can form a scale of α values with the corresponding skewness values. This relationship is depicted in Figure 4 with α1 values used for detecting burst spikes and α2 values used for detecting burst related spikes. The scale was formed by experimenting with the relation of α and skewness for our recordings.
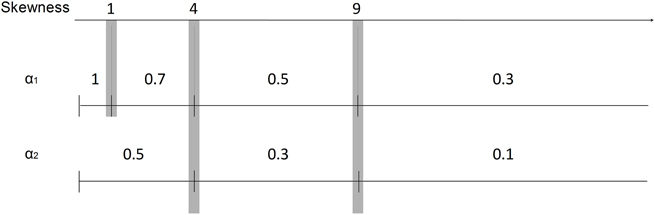
Figure 4. Scale of α values and the corresponding ISI distribution skewness values. The scale is formed by experimenting with the relation of α and skewness values for our recordings. α1 values were set for burst spikes as 1, 0.7, 0.5, and 0.3 for the skewness values less than 1, 4, 9, and more than 9, respectively. α2 values were set for burst related spikes as 0.5, 0.3, and 0.1 for the skewness values less than 4, 9, and more than 9, respectively.
Extending bursts with the burst related spikes and merging close bursts
The burst related spikes are included in their neighboring bursts in this step. Also, the bursts which are closer to each other than the threshold calculated in the second step are merged together. This step also corrects erroneous burst spike detections and misses caused by ISI variance inside bursts and is especially advantageous for the analysis of maturing networks, which frequently have high ISI variance and consist of both bursts and individual spikes. Figure 5 demonstrates data with high intra-burst ISI variability. Black circles are detected burst spikes whereas red crosses are the detected burst related spikes after the first step of CMA algorithm, whereas black lines indicate bursts after the extending and merging process. In Figure 5, the burst around the 50th second has an intra-burst ISI variability of approximately 600 ms and the burst related spikes are detected during the burst. Extending bursts to the burst related spikes and merging close bursts, we get the satisfactorily detected burst marked with black line instead of the erroneously detected two separate bursts.
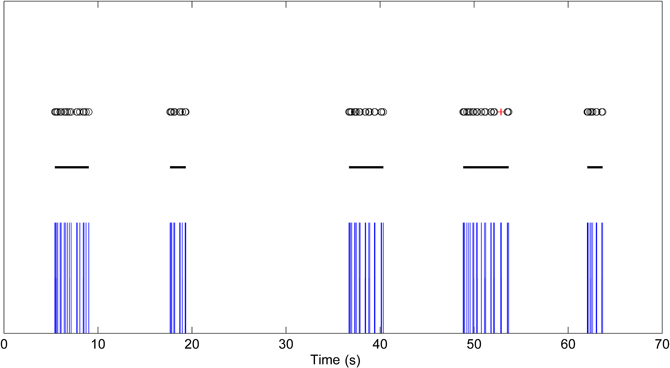
Figure 5. Bursting data with high intra-burst ISI variability. Black circles are the detected burst spikes whereas red crosses are the detected burst related spikes after the first step of CMA algorithm. Black lines indicate the bursts after the extending and merging process.
Analysis of the Detected Bursts
After detecting the bursts by CMA algorithm, all the bursts from five data sets were pooled according to their measurement days. Additionally, we pooled the bursts according cell seeding area size on the MEAs. For analyzing the bursts, we calculated three parameters from the detected bursts for each channel: average burst duration (ABD), total number of bursts detected (TNB), and average number of spikes per burst (ASpB). The relations of these parameters were plotted for different measurement days to analyze the changes during the development.
Results
A colormap which shows the spike activities is a useful tool for viewing the channel dynamics of hESC-derived neurons during the maturation process. The activity colormaps for the three measurement days (mes1, mes2, and mes3) of three MEAs (N732, N752, and N878) from three data sets (Ds-III, Ds-IV, and Ds-V) are presented in Figure 1. The dynamics of the networks can be observed from the fading and rising of the firing activities in time.
Before proceeding to compare the burst detection results using the previously published methods (Chiappalone et al., 2005; Pasquale et al., 2010) and our method, we investigated if it was appropriate to set one fixed threshold to define intra-burst ISIs for the burst detection algorithms. Since the principal peak in a logarithmic histogram represents mostly the intra-burst ISI values as mentioned earlier, the principal peak ISI values of our recordings were calculated to observe the feasibility of using a fixed threshold as in previously published algorithms.
In Figure 6 are shown the logarithmic ISI histograms of the selected active channels whose principal peaks of the logarithmic histograms include at least 30 spikes to make the three different common types of logarithmic ISI histogram trends found in hESC-derived neuronal recordings clearly observable. Histograms with two well separated peaks, with only one peak and no local extrema, and with local extrema which cannot be separated well enough are typical in our recordings. Figure 6A demonstrates that both the principal ISI values and the histogram shape may be greatly varying. To further show the variability of the ISI value of the peak, logarithmic ISI histograms for all of the channels from every recording were calculated and the locations of the principal peaks consisting of the minimum of 30 spikes are shown in Figure 6B. The peak locations have an approximate ISI range from 30 to 2000 ms.
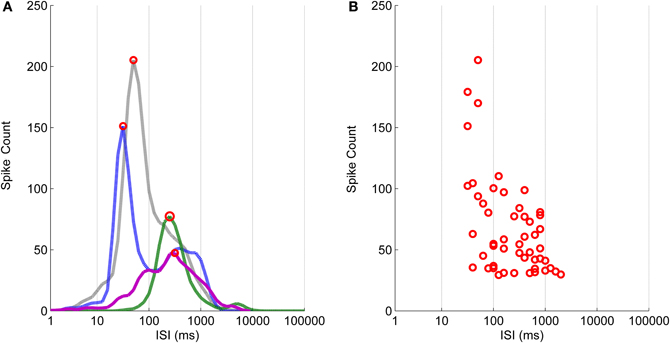
Figure 6. The logarithmic ISI histograms and their principal peak locations for the data selected to illustrate the different commonly encountered cases. (A) Histograms with two well separated peaks (blue dashed-dotted and green dashed lines), with only one peak and no local extrema (black dotted line), and with local extrema which cannot be separated well enough (purple solid line), are typical for ISIs of hESC-derived neuronal recordings. (B) Principal peak locations of selected channels vary from approximately 30–2000 ms.
Figure 7A demonstrates the logarithmic ISI histogram of the data from one channel of a MEA (MEA N728, Ds-II, mes2) which exhibits clearly separated bursts shown in Figure 7B. In the case shown in Figure 7, it can be seen that the principal peak (red circle) and the secondary peak (red cross) are well separated and the ISI threshold for the burst boundary spikes is calculated at 1259 ms (blue dashed line). On the other hand, the location of the principal peak is almost at the proposed threshold for the burst cores at 100 ms. Accordingly, we experimented with the ISI thresholds for the burst cores at 100, 200, and also at 1000 ms, which seems more rational when observing the Figure 7A. The burst detection results labeled with “1” in Figure 7B represent the results by the logISIH algorithm with the threshold ISI of 100 ms as also previously shown (Pasquale et al., 2010). The results obtained by changing the threshold to 200 ms for the principal peak locations and for the burst cores are shown labeled “2.” The results obtained by changing ISI threshold for the burst cores from 100 to 1000 ms and also changing the threshold for the principal peak locations to 1000 ms are shown labeled “3.” The results given by our CMA algorithm are shown labeled “4” in Figure 7B. Skewness of the ISI distribution was in this case found to be 4.7, which corresponds to α1 = 0.5 and α2 = 0.3.
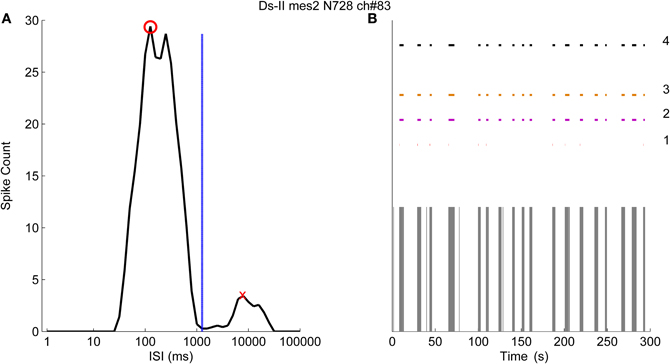
Figure 7. The logarithmic ISI histogram of a channel with well separated inter- and intra-burst ISIs. (A) Logarithmic histogram (black solid line) has two different peaks where red circle shows the principal peak and the red cross shows the secondary peak. Threshold for the burst boundary spikes is calculated to occur at 1259 ms (blue dashed line). (B) Burst detection results of logISIH method by employing the burst core and principal peak thresholds at 100, 200, and 1000 ms are labeled as 1, 2, and 3 respectively. The result of the CMA algorithm is labeled as 4.
Figure 8A shows an example of logarithmic ISI histogram of a recording in which the bursts are not clearly separable. As can be seen, results cannot be obtained by logISIH algorithm since the required criterion for the separation cannot be satisfied. Instead, we used fixed ISI threshold values and fixed number of burst spikes as the criteria to compare the methods. In Figure 8B, 50 s of the recording and the results are shown to better observe the burst detection results. The results labeled from “1” to “3” in Figure 8B represent the algorithm with 100 ms intra-burst ISI threshold and the minimum of 10 spikes for detecting bursts (Chiappalone et al., 2005) and its modified versions alike in Figure 7. The algorithm with the criteria of 100 ms intra-burst ISI threshold and the minimum three of spikes in a burst is labeled with “2,” whereas the algorithm with 200 ms intra-burst ISI threshold with the minimum of three spikes is labeled with “3.” The result of CMA algorithm for this recording is labeled with “4.” In this case skewness of the ISI distribution is found to be 2.7, which corresponds to α1 = 0.7 and α2 = 0.5.
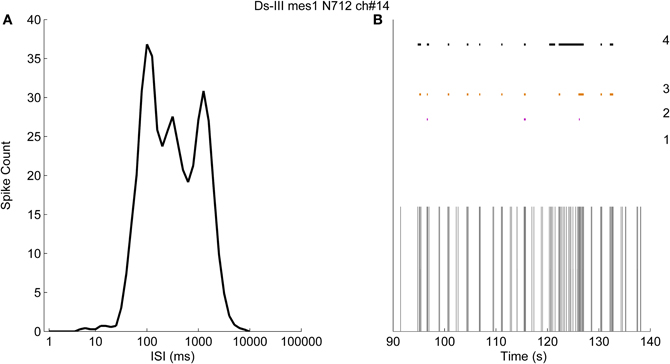
Figure 8. The logarithmic ISI histogram of a channel with poorly separated inter- and intra-burst ISIs. (A) Logarithmic histogram (black solid line) has no well-definable principal or secondary peaks. (B) Burst detection results obtained with pre-defined thresholds. The results obtained by employing a threshold for intra-burst spikes of 100 ms with at least 10 spikes in a burst, 100 ms with at least three spikes, and 200 ms with at least three spikes, are labeled as 1, 2, and 3, respectively. The result of the CMA algorithm is labeled as 4.
Further results obtained with logISIH algorithm by changing its parameters for testing its applicability for analyzing our recordings are shown in Figure 9. For this case, the time window for principal peaks and ISI threshold for burst cores was set at 200 ms, which is different from that proposed by Pasquale et al. (2010). As seen in Figure 9A, logISIH algorithm with the fixed ISI threshold of 200 ms does not detect more than one burst in this data. This is because the principal peak of the logarithmic histogram for this data is beyond the ISI of 200 ms. In comparison, our method succeeds in finding bursts in this data (Figure 9A). In Figure 9B is shown a case in which some of the bursts correctly found by our method are missed by the logISIH algorithm, whereas in case shown in Figure 9C, the burst detection results between the algorithms are different. For the cases shown in Figures 9A,B, the algorithm proposed in this paper is clearly advantageous over the logISIH algorithm. For the case shown in Figure 9C, the selection of the preferable algorithm depends on the desired subsequent analysis.
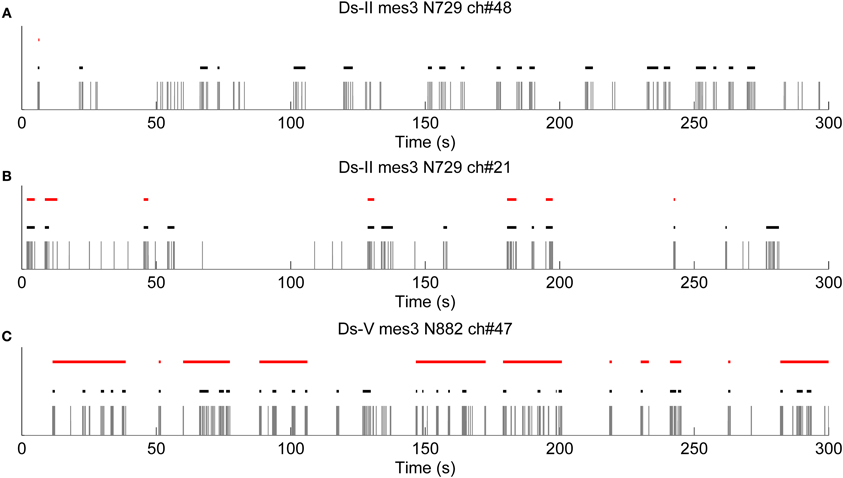
Figure 9. Results obtained with logISIH algorithm by changing the time window for the principal peaks and the ISI thresholds of the burst cores to 200 ms. Black and red lines are bursts detected by CMA and LogISIH algorithms, respectively, during approximately 300 s. (A) logISIH algorithm detected only one burst in this recording. (B) Some of the bursts which were detected by CMA algorithm are missed by logISIH algorithm. (C) logISIH algorithm detected different bursts than CMA algorithm.
We analyzed the usability of the CMA algorithm further with recordings from differently behaving hESC-derived neuronal networks. Recordings shown in Figures 10A–C have different skewness values of their ISI distributions. As seen from Figures 10A–C, the longer the tail of the ISI histogram, the bigger the skewness value, which also indicates higher variance of the ISI values. Figure 10A presents a recording which has closely located ISI values and naturally almost symmetrical ISI distribution with skewness of one. Accordingly, burst detection ISI threshold is set at the peak of CMA curve. On the other hand, the recordings presented in Figures 10B,C have more positively skewed ISI distributions with increasing variance of the ISI values, and accordingly ISI thresholds are calculated with smaller α values with the result of setting the detection threshold further away to the right from the peak of the CMA curve.
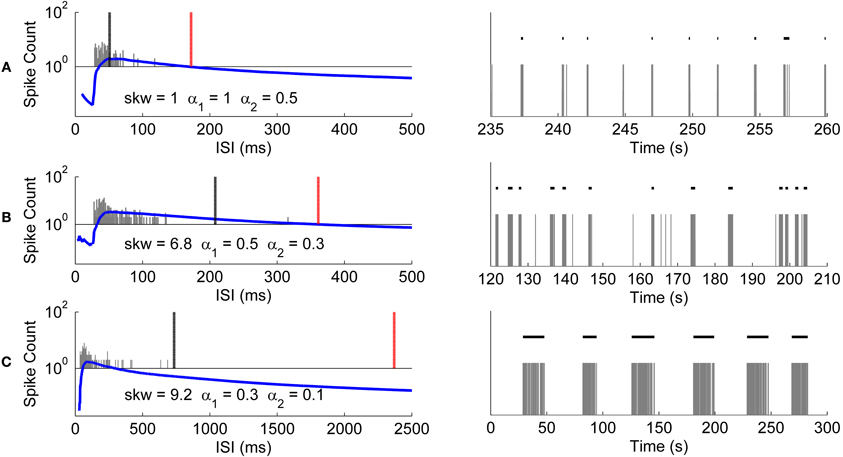
Figure 10. Burst detection results of CMA algorithm for differently behaving networks. Recordings shown in the right panels have different skewnesses of their ISI histograms. The ISI histograms (gray bars), CMA curves (blue lines), and the thresholds for the burst and burst related spikes (black and red lines, respectively) are shown in the left panels. Skewness values and the corresponding α values used for calculating these thresholds are given along with the histograms. Logarithmic scale is used for the vertical axis since CMA curves and histogram values have very different scales. (A) Histogram and CMA curve of a recording which has the calculated ISI histogram skewness of 1 (left panel). Detected bursts during 25 s of the recording (right panel). (B) Histogram and CMA curve of a recording which has the calculated ISI histogram skewness of 6.8 (left panel). Detected bursts during 90 s of the recording (right panel). (C) Histogram and CMA curve of a recording which has the calculated ISI histogram skewness of 9.2 (left panel). Detected bursts in the entire recording of 300 s (right panel).
We also tested the usability of the methods with a larger amount of data to demonstrate how much of the data is produced for further burst analysis by different methods without considering whether the burst detection was true or false. Simply, if a burst detection algorithm doesn't detect any bursts in a recording, that recording is not included in the further analysis and vice versa. Thus, we applied all the algorithms on a collection of data sets consisting of MEA channels which potentially exhibited bursts. Data from channels from all measurement days and all data sets which exhibit over 50 spikes at least in one of the measurements of approximately 300 s were chosen for a test. For example, if a channel exhibits over 50 spikes in the second measurement day, then the same channel data from the first and third measurement days are also chosen for the test without considering how many spikes they contain. In Table 2 are given the numbers of channels in which the burst were detected. Percentage values represent the ratio of detected bursts containing channels to total number of recordings tested.
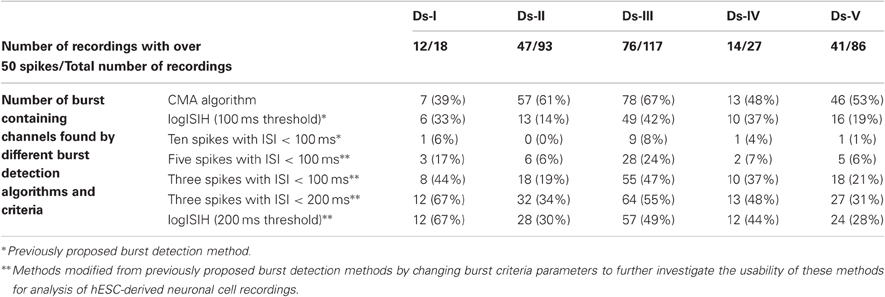
Table 2. The number of burst containing channels which are found by different methods.
In addition to success of the algorithm demonstrated in Figures 7 and 8, Table 2 points out that we can increase the number of channels to be further analyzed by employing our CMA algorithm, which means extracting more burst or burst-like data for the subsequent analysis. As seen from Table 2, CMA algorithm works well in comparisons with the other tested algorithms and their variants. In Table 2, the methods with three spikes with ISI < 200 ms and logISIH with 200 ms threshold did not yield satisfactory results. Figure 9 shows an example of this comparison for three different channels, comparing logISIH algorithm with modified burst detection criteria of intra-burst ISI threshold of 200 ms with at least three spikes in a burst and our CMA algorithm. The results demonstrate that even though logISIH algorithm with modified parameters detects bursts (c.f., Table 2), this does not necessarily mean that the burst detection is satisfactory for further analysis since some burst event may be missed (Figures 9A,B) or differently detected (Figure 9C).
The CMA algorithm can be used to assess the developing network with regard to different types of MEAs and cultures as well. To demonstrate this, we pooled all the spontaneous recordings from five data sets according to the measurement days and plotted the relations of the calculated parameters ABD, TNB, and ASpB. Figure 11 shows the results for all three measurement time points with each channel represented by one blue circle. The number of burst containing channels increased after the first measurement day. The numbers of burst containing channels for mes1, mes2, and mes3 were 28, 60 and 50, respectively. Despite of the small dataset available, we were able to observe changes by simply analyzing the ABD vs. TNB panels for all three measurement days in Figure 11, where the values for up to ABD of 5 s are demonstrated for a better view. We can conclude that majority of ABDs increased for second and third measurement days compared to first measurement day. The ABD values for mes1, mes2, and mes3 were found to be 7.7, 14, and 10.9 s, respectively. The ASpB values increased as well, and were 7, 9.4, and 9.3 spikes per bursts for the three measurement days, respectively. Increase in ASpB values can be seen from ASpB vs. TNB panels for all three measurement days. The values for up to 50 spikes are shown in the ASpB vs. TNB panels of Figure 11 for more in detail observations. Also, the effects of restricted cell growth area on the development of the network were assessed: the number of bursting channels increased with the restricted cell growth area. The total number of burst containing channels was 28 in 10 normal MEAs, whereas the total number was 63 measured from three MEAs with restricted cell growth area. ASpB and TNB values for those active channels increased as well for the MEAs which had restricted cell growth areas (Figure 12). Average number of bursts per channel was calculated to be 16.6 and 27.1 bursts for normal MEAs and MEAs with restricted cell growth areas, respectively, and the average spikes per burst were calculated to be 11.9 and 23.4 spikes, respectively. The relations between these three parameters give us an idea about changes in the bursting behavior during network development: as expected, increasing number of bursts is seen during development, as is the increase in the ASpB.
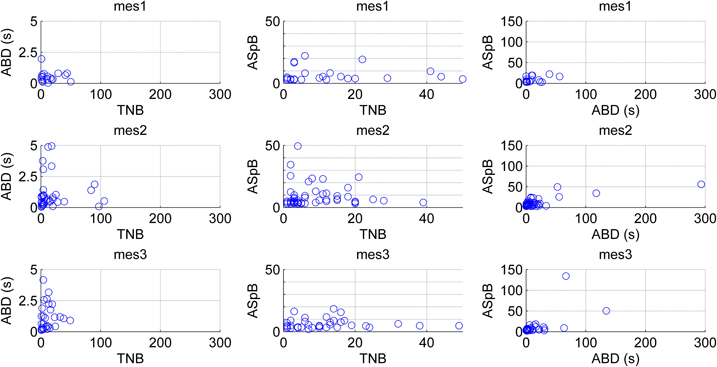
Figure 11. Changes in the network behavior of maturing hESC-derived neuronal cells. Results from five experiments are pooled according to the measurement days (mes1, mes2, mes3). The channels are analyzed by the means of three different derived parameters: average burst duration (ABD), total number of bursts detected (TNB), and average number of spikes per bursts (ASpB). In the leftmost and middle panels the vertical axis ranges are limited to better observe the data, whereas in the rightmost panels all data is shown.
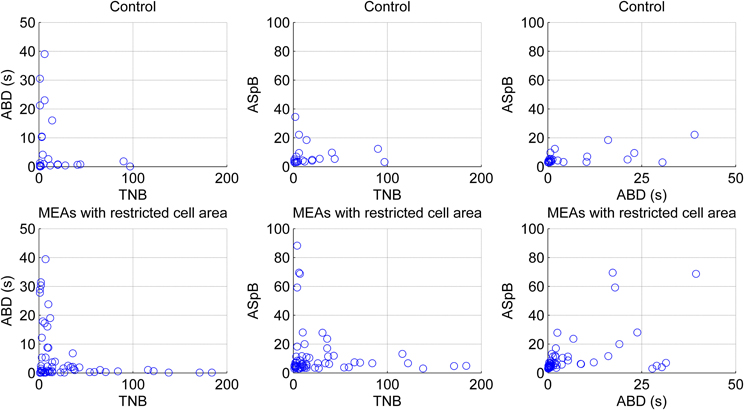
Figure 12. Effect of restricted cell growth area on maturing and network behavior of maturing hESC-derived neuronal cells. Each blue circle illustrates one bursting channel. Upper panels present the behavior of the cells growing in normal MEAs by the means of total numbers of detected bursts (TNB), average burst durations (ABD), and average number of spikes per burst (ASpB), whereas lower panels present the behavior of the cells growing in MEAs with restricted cell areas. The results were obtained from all three measurement days pooled together.
Discussion
As hESC-derived neuronal cells can generate spontaneously functional networks in vitro (Heikkilä et al., 2009), analyzing their bursting behaviors is essential to understand the development and functioning of human neuronal networks in vitro, and thus to strive to analyze the development of connections in these rather primitive networks with implications to the understanding of brain function. As we show in this paper, hESC-derived neuronal cells exhibit extremely time varying trends, and changing spiking trends can be observed as various types of burst-like patterns that are dynamically changing during the maturation of the cells and networks. Different burst definitions have been proposed previously, which mainly use fixed criteria, or as in Wagenaar et al. (2006), employ a detection algorithm based on channel synchrony. As seen in Figure 1, developing active hESC-derived networks change their firing trends often. For such networks, in which the spatial synchronicity is changing rapidly, taking synchronicity as the primary criterion for bursting may not always be fruitful. Thus, synchronicity is not in the scope of this paper but for future studies, taking synchronicity into account would provide additional outcomes. For example, for the networks where bursts have tendencies to fire synchronously, bursts would be considered as individual events or clusters and neuronal network maturity can be assessed by analyzing IBIs instead of bursts itself (Tateno et al., 2002).
Another observation of variable neuronal network behavior is the irrationality of applying predefined fixed burst definition parameters. Classical parameters used for the burst detection and analysis, i.e., the number of spikes in bursts and burst durations (Harris et al., 2001; Tam, 2002; Kepecs and Lisman, 2004; Chiappalone et al., 2005), are often neither useful nor preferable for analysis of the developing networks. A previous study using intracellular recordings demonstrated the presence of singlet and duplet spikes that occur upon burst mediated depolarization (Weick et al., 2011). However for their study, hESC-derived neuroepithelial aggregates were added on a slice rather than grown as an entity. Also the temperature of their experiments (room temperature, 21–23°C) may have resulted in different results as our experiments were carried out in 37°C. Cooling from 34 to 21°C has been shown to remove network synchronization in rat hippocampal slices (Javedan et al., 2002). Furthermore, since extracellularly detected bursts require synchronization of large network of neurons, we consider that extracellular burst means more than one spike (Lisman, 1997; Izhikevich et al., 2003), and at least duplets or triplets should be evaluated as bursts. Here, we propose that other detection parameters should not restrict the burst. This can be realized by extracting the parameters from statistics of the firing networks. It is possible that some of the maturing cells that still are incapable of emitting several spikes are omitted from our bursting criteria. However, multiple recordings of the same culture would reveal if such a neuronal assemble is later detected by the algorithm. Let us also note that cellular network activity manifested only in local field potentials (Kelly et al., 2010) could be utilized to improve network burst analysis, but is naturally ignored by our purely action potential based analysis. Figure 6 demonstrates the problems with the analysis of developing networks if a priori defining ISI threshold boundaries as suggested previously (Harris et al., 2001; Kepecs and Lisman, 2004; Chiappalone et al., 2005; Pasquale et al., 2010). It can be seen that the major concentrations of intra-burst ISIs represented by the principal peaks appear in a wide range of approximately from 30 to 2000 ms. We could find a well behaving predetermined threshold by experimenting with various threshold values, but this is not very practical and the results would be sporadic. Our CMA algorithm is based on our motivation to detect burst like activities according to the assessment of the dynamics of the data itself. It provides us means to assess the developing networks with irregular and evolving dynamics.
With CMA algorithm the skewness and skewness based factor α, can be used in analyzing the network behavior. Skewness of ISI distributions has been considered, for example, also in conjunction with the assessment of different neuronal and network models, e.g., by Hosaka et al. (2006). The relation of α and skewness is assessed in this paper by observing the relationship at a few discrete values of α and skewness. Since only a limited number of values of the skewness and α were tested, in some cases, different α values may produce better results than the α's employed here. The set of values employed here simplifies the detection algorithm and more importantly still results in satisfactory performance of our algorithm. For future studies, α and skewness may be utilized more extensively to describe network behaviors. Further, CMA also enables considering burst pre-spiking and burst tails as part of the analysis while considering dynamic network behavior and data.
A drawback of the CMA algorithm is that since it is devised to point out any “noteworthy” burst like events in the recordings, it may detect bursts erroneously in certain conditions, especially when applied on rarely spiking data with no bursts or on very active channels with very frequent nonstop spiking. Such kind of erroneous detections can be seen in the analysis of outliers and can be excluded by, e.g., simple cluster analysis, filtering, or thresholding. In our data, an example of a rare spiking channel which fires approximately 50 spikes in 300 s was detected as a single burst. The plot for this burst is seen as an outlier in Figure 11 in the rightmost panel for the second measurement day. It can be seen as an extraordinary behavior among the usual bursts which forms a cluster in lower values in the same panel. If needed, exclusion of this outlier and focusing only on common bursting behavior for the subsequent analysis is a simple task by using a threshold of for instance 50 spikes for ASpB and 5 s for ABD values in this example. In fact, in closer observation, Figure 11 demonstrates the increase in ABD and ASpB values as well as increase in the number of burst containing channels after the first measurement day. This is supported by the calculated average values for these parameters as well. Effect of cell growth area is shown in Figure 12. Increase in the average number of bursts per channels and ASpB is evident in Figure 12 and confirmed by numerical analysis results. It seems that the restricted cell growth area results in faster network development since the number of burst containing channels increased as well in comparison with the control MEAs (Figure 12).
logISIH algorithm is excellent in detecting the bursting behavior especially for very frequent firing networks which have a good separation of inter-burst ISIs from intra-burst ISIs. Thus, it would be effective for detecting burst like activities of matured dynamic hESC-derived neurons. For developing networks the predefined boundaries limit its usability and, further, the logarithmic ISI distribution of developing non-matured networks is not usually analyzable with this method as was the case for our data. In this paper we have quite freely utilized the concept of bursting behavior and enabled our parameters to go well above the commonly applied thresholds (Harris et al., 2001; Kepecs and Lisman, 2004; Chiappalone et al., 2005). As developing hESC-derived neuronal cell networks have not been available earlier, we feel that we should more openly think about the dynamics of the developing networks and at least study the concept of bursting more freely than before. Especially the logISIH and CMA algorithms provide ways to do so. Also, recurrence quantification analysis, which was proposed by Novellino and Zaldivar (2010) for analyzing and screening the changes in the neuronal activity especially for networks having slow dynamics, could be promising for hESC-derived neurons since slow dynamics in electrophysiological recordings can be observed in the early days of network development (Heikkilä et al., 2009) and the dynamics are demonstrated, e.g., by spiking/bursting frequency, inter-burst intervals, number of spikes per bursts. Additionally, a novel spike detection algorithm, e.g., by Maccione et al. (2009), could be combined with our method to yield enhanced analysis instead of the basic spike detection algorithm we used in this study.
In this paper, we were particularly motivated by the behavior and the problematic analysis of functional neural networks of hESC-derived neuronal cells and proposed a new burst detection and analysis method capable of the analysis of data measured from such networks. Our method provides enhanced analysis power to understand the development and functioning of neuronal networks, thus hopefully in time also contributing to our knowledge of the brain and towards the development of safe and functional neuronal stem cell based cures. Moreover, the proposed analysis method could be employed in developing new in vitro tests for drug screening and neurotoxicity assays.
Conflict of Interest Statement
The authors declare that the research was conducted in the absence of any commercial or financial relationships that could be construed as a potential conflict of interest.
Acknowledgments
This study was funded by Academy of Finland (decisions number 122947, 122959, 123233, and 135220), BioneXt Tampere, and Competitive Research Funding of Pirkanmaa Hospital District. Research of Fikret E. Kapucu was supported by Finnish Cultural Foundation and Ella and Georg Ehrnrooth Foundation. We want to acknowledge the personnel of Stem Cell Unit of Institute of Biomedical Technology, Tampere, Finland, for the support in stem cell research.
References
Äänismaa, R., Ylä-Outinen, L., Mikkonen, J. E., and Narkilahti, S. (2011). “Human pluripotent stem cell-derived neuronal networks: their electrical functionality and usability for modelling and toxicology,” in Methodological Advances in the Culture, Manipulation and Utilization of Embryonic Stem Cells for Basic and Practical Applications, ed C. Atwood (Rijeka, Croatia: InTech), 459–472.
Bal-Price, A. K., Hogberg, H. T., Buzanska, L., Lenas, P., van Vliet, E., and Hartung, T. (2010). In vitro developmental neurotoxicity (DNT) testing: relevant models and endpoints. Neurotoxicology 31, 545–554.
Bissonnette, C. J., Lyass, L., Bhattacharyya, B. J., Belmadani, A., Miller, R. J., and Kessler, J. A. (2011). The controlled generation of functional basal forebrain cholinergic neurons from human embryonic stem cells. Stem Cells 29, 802–811.
Carpenter, M. K., Inokuma, M. S., Denham, J., Mujitaba, T., Chiu, C. P., and Rao, M. S. (2001). Enrichment of neurons and neural precursors from human embryonic stem cells. Exp. Neurol. 172, 383–397.
Chiappalone, M., Novellino, A., Vajda, I., Vato, A., Martinoia, S., and van Pelt, J. (2005). Burst detection algorithms for the analysis of spatio-temporal patterns in cortical networks of neurons. Neurocomputing 65–66, 653–662.
Connors, B. W., Gutnick, M. J., and Prince, D. A. (1982). Electrophysiological properties of neocortical neurons in vitro. J. Neurophysiol. 48, 1302–1320.
Daadi, M. M., Li, Z., Arac, A., Grueter, B. A., Sofilos, M., Malenka, R. C., Wu, J. C., and Steinberg, G. K. (2009). Molecular and magnetic resonance imaging of human embryonic stem cell-derived neural stem cell grafts in ischemic rat brain. Mol. Ther. 17, 1282–1291.
Defranchi, E., Novellino, A., Whelan, M., Vogel, S., Ramirez, T., van Ravenzwaay, B., and Landsiedel, R. (2011). Feasibility assessment of micro-electrode chip assay as a method of detecting neurotoxicity in vitro. Front. Neuroeng. 4:6. doi: 10.3389/fneng.2011.00006
Erceg, S., Laínez, S., Ronaghi, M., Stojkovic, P., Pérez-Aragó, M. A., Moreno-Manzano, V., Moreno-Palanques, R., Planells-Cases, R., and Stojkovic, M. (2008). Differentiation of human embryonic stem cells to regional specific neural precursors in chemically defined medium conditions. PLoS ONE 3:e2122. doi: 10.1371/journal.pone.0002122
Gray, C. M., and McCormick, D. A. (1996). Chattering cells: superficial pyramidal neurons contributing to the generation of synchronous oscillations in the visual cortex. Science 274, 109–113.
Gross, G. W., Rieske, E., Kreutzberg, G. W., and Meyer, A. (1977). A new fixed-array multi-microelectrode system designed for long-term monitoring of extracellular single unit neuronal activity in vitro. Neurosci. Lett. 6, 101–105.
Harris, K. D., Hirase, H., Leinekugel, X., Henze, D. A., and Buzsáki, G. (2001). Temporal interaction between single spikes and complex spike bursts in hippocampal pyramidal cells. Neuron 32, 141–149.
Heikkilä, T., Ylä-Outinen, L., Tanskanen, J. M. A., Lappalainen, R. S., Skottman, H., Suuronen, R., Mikkonen, J. E., Hyttinen, J. A., and Narkilahti, S. (2009). Human embryonic stem cell-derived neuronal cells form spontaneously active neuronal networks in vitro. Exp. Neurol. 218, 109–116.
Hogberg, H. T., Sobanski, T., Novellino, A., Whelan, M., Weiss, D. G., and Bal-Price, A. K. (2011). Application of micro-electrode arrays (MEAs) as an emerging technology for developmental neurotoxicity: evaluation of domoic acid-induced effects in primary cultures of rat cortical neurons. Neurotoxicology 32, 158–168.
Hosaka, R., Sakai, Y., Ikeguchi, T., and Yoshizawa, S. (2006). BvP neurons exhibit a larger variety in statistics of inter-spike intervals than LIF neurons. J. Phys. Soc. Jpn. 75, 124007.
Ichikawa, M., Muramoto, K., Kobayashi, K., Kawahara, M., and Kuroda, Y. (1993). Formation and maturation of synapses in primary cultures of rat cerebral cortical cells: an electron microscopic study. Neurosci. Res. 16, 95–103.
Illes, S., Fleischer, W., Siebler, M., Hartung, H. P., and Dihné, M. (2007). Development and pharmacological modulation of embryonic stem cell-derived neuronal network activity. Exp. Neurol. 207, 171–176.
Izhikevich, E. M., Desai, N. S., Walcott, E. C., and Hoppensteadt, F. C. (2003). Bursts as a unit of neuronal information: selective communication via resonance. Trends Neurosci. 26, 161–167.
Javedan, S. P., Fisher, R. S., Eder, H. G., Smith, K., and Wu, J. (2002). Cooling abolishes neuronal network synchronization in rat hippocampal slices. Epilepsia 43, 574–580.
Kamioka, H., Maeda, E., Jimbo, Y., Robinson, H. P., and Kawana, A. (1996). Spontaneous periodic synchronized bursting during formation of mature patterns of connections in cortical cultures. Neurosci. Lett. 206, 109–112.
Kandel, E. R., and Spencer, W. A. (1961). Electrophysiology of hippocampal neurons. II. After-potentials and repetitive firing. J. Neurophysiol. 24, 243–259.
Kelly, R. C., Smith, M. A., Kass, R. E., and Lee, T. S. (2010). Local field potentials indicate network state and account for neuronal response variability. J. Comput. Neurosci. 29, 567–579.
Kim, J. E., O'Sullivan, M. L., Sanchez, C. A., Hwang, M., Israel, M. A., Brennand, K., Deerinck, T. J., Goldstein, L. S., Gage, F. H., Ellisman, M. H., and Ghosh, A. (2011). Investigating synapse formation and function using human pluripotent stem cell-derived neurons. Proc. Natl. Acad. Sci. U.S.A. 108, 3005–3010.
Lai, B., Mao, X. O., Greenberg, D. A., and Jin, K. (2008). Endothelium-induced proliferation and electrophysiological differentiation of human embryonic stem cell-derived neuronal precursors. Stem Cells Dev. 17, 565–572.
Lappalainen, R. S., Salomäki, M., Ylä-Outinen, L., Heikkilä, T. J., Hyttinen, J. A., Pihlajamäki, H., Suuronen, R., Skottman, H., and Narkilahti, S. (2010). Similarly derived and cultured hESC lines show variation in their developmental potential towards neuronal cells in long-term culture. Regen. Med. 5, 749–762.
Lisman, J. E. (1997). Bursts as a unit of neural information: making unreliable synapses reliable. Trends Neurosci. 20, 38–43.
Maccione, A., Gandolfo, M., Massobrio, P., Novellino, A., Martinoia, S., and Chiappalone, M. (2009). A novel algorithm for precise identification of spikes in extracellularly recorded neuronal signals. J. Neurosci. Methods 177, 241–249.
Maeda, E., Robinson, H. P., and Kawana, A. (1995). The mechanisms of generation and propagation of synchronized bursting in developing networks of cortical neurons. J. Neurosci. 15, 6834–6845.
Mazzoni, A., Broccard, F. D., Garcia-Perez, E., Bonifazi, P., Ruaro, M. E., and Torre, V. (2007). On the dynamics of the spontaneous activity in neuronal networks. PLoS ONE 2:e439. doi: 10.1371/journal.pone.0000439
Novellino, A., and Zaldivar, J.-M. (2010). Recurrence quantification analysis of spontaneous electrophysiological activity during development: characterization of in vitro neuronal networks cultured on multi electrode array chips. Adv. Artif. Intell. 2010, 10.
Pasquale, V., Martinoia, S., and Chiappalone, M. (2010). A self-adapting approach for the detection of bursts and network bursts in neuronal cultures. J. Comput. Neurosci. 29, 219–229.
Pine, J. (1980). Recording action potentials from cultured neurons with extracellular microcircuit electrodes. J. Neurosci. Methods 2, 19–31.
Selinger, J. V., Kulagina, N. V., O'Shaughnessy, T. J., Ma, W., and Pancrazio, J. J. (2007). Methods for characterizing interspike intervals and identifying bursts in neural activity. J. Neurosci. Methods 162, 64–71.
Sundberg, M., Jansson, L., Ketolainen, J., Pihlajamäki, H., Suuronen, R., Skottman, H., Inzunza, J., Hovatta, O., and Narkilahti, S. (2009). CD marker expression profiles of human embryonic stem cells and their neural derivatives, determined using flow cytometric analysis, reveal a novel CD marker for exclusion of pluripotent stem cells. Stem Cell Res. 2, 113–124.
Tam, D. C. (2002). An alternate burst analysis for detecting intra-burst firings based on inter-burst periods. Neurocomputing 44–46, 1155–1159.
Tateno, T., Kawana, A., and Jimbo, Y. (2002). Analytical characterization of spontaneous firing in networks of developing rat cultured cortical neurons. Phys. Rev. E Stat. Nonlin. Soft Matter Phys. 65, 051924.
Turnbull, L., Dian, E., and Gross, G. (2005). The string method of burst identification in neuronal spike trains. J. Neurosci. Methods 145, 23–35.
Wagenaar, D. A., Pine, J., and Potter, S. M. (2006). An extremely rich repertoire of bursting patterns during the development of cortical cultures. BMC Neurosci. 7, 11.
Wang, Y. F., and Hatton, G. I. (2005). Burst firing of oxytocin neurons in male rat hypothalamic slices. Brain Res. 1032, 36–43.
Weick, J. P., Liu, Y., and Zhang, S.-C. (2011). Human embryonic stem cell-derived neurons adopt and regulate the activity of an established neuronal network. Proc. Natl. Acad. Sci. U.S.A. 108, 20189–20194.
Keywords: spike trains, action potential bursts, burst analysis, hESCs, human embryonic stem cells, developing neuronal networks, MEA, microelectrode array
Citation: Kapucu FE, Tanskanen JMA, Mikkonen JE, Ylä-Outinen L, Narkilahti S and Hyttinen JAK (2012) Burst analysis tool for developing neuronal networks exhibiting highly varying action potential dynamics. Front. Comput. Neurosci. 6:38. doi: 10.3389/fncom.2012.00038
Received: 21 March 2012; Accepted: 30 May 2012;
Published online: 19 June 2012.
Edited by:
Misha Tsodyks, Weizmann Institute of Science, IsraelCopyright: © 2012 Kapucu, Tanskanen, Mikkonen, Ylä-Outinen, Narkilahti and Hyttinen. This is an open-access article distributed under the terms of the Creative Commons Attribution Non Commercial License, which permits non-commercial use, distribution, and reproduction in other forums, provided the original authors and source are credited.
*Correspondence: Jari A. K. Hyttinen, Department of Biomedical Engineering, Tampere University of Technology, P. O. Box 692, FI-33101 Tampere, Finland. e-mail: jari.hyttinen@tut.fi