Graph theoretical analysis of resting magnetoencephalographic functional connectivity networks
- 1MEG Core Facility, National Institute of Mental Health, Bethesda, MD, USA
- 2Clinical Brain Disorders Branch, National Institute of Mental Health, Bethesda, MD, USA
- 3Lieber Institute for Brain Development, Baltimore, MD, USA
Complex networks have been observed to comprise small-world properties, believed to represent an optimal organization of local specialization and global integration of information processing at reduced wiring cost. Here, we applied magnitude squared coherence to resting magnetoencephalographic time series in reconstructed source space, acquired from controls and patients with schizophrenia, and generated frequency-dependent adjacency matrices modeling functional connectivity between virtual channels. After configuring undirected binary and weighted graphs, we found that all human networks demonstrated highly localized clustering and short characteristic path lengths. The most conservatively thresholded networks showed efficient wiring, with topographical distance between connected vertices amounting to one-third as observed in surrogate randomized topologies. Nodal degrees of the human networks conformed to a heavy-tailed exponentially truncated power-law, compatible with the existence of hubs, which included theta and alpha bilateral cerebellar tonsil, beta and gamma bilateral posterior cingulate, and bilateral thalamus across all frequencies. We conclude that all networks showed small-worldness, minimal physical connection distance, and skewed degree distributions characteristic of physically-embedded networks, and that these calculations derived from graph theoretical mathematics did not quantifiably distinguish between subject populations, independent of bandwidth. However, post-hoc measurements of edge computations at the scale of the individual vertex revealed trends of reduced gamma connectivity across the posterior medial parietal cortex in patients, an observation consistent with our prior resting activation study that found significant reduction of synthetic aperture magnetometry gamma power across similar regions. The basis of these small differences remains unclear.
Introduction
The human brain is a complex biological system composed of many interacting subsystems, and its collective behavior cannot simply be understood in terms of its isolated components (Varela et al., 2001). Viewing the brain as a complex network has motivated the recent shift from pinpointing local activations of cortex to identifying widespread functional networks. One common measurement used in the latter approach is functional connectivity, or the statistical interrelations between physiological time series recorded from different brain areas, which is assumed to reflect functional interactions.
Graph theoretical analysis can be used to characterize complex patterns of functional connectivity from a network perspective. A graph G = (V, E, W) is a mathematical description of a network, which is essentially reduced to a collection of nodes (vertices, V) connected by lines (edges, E) that hold values (weights, W). The presence of an edge in a graph that represents functional brain networks indicates functional connectivity between the brain sources (vertices) it links.
Modern magnetoencephalography (MEG) is an ideal method to study complex brain systems because it covers the whole head with a large number of sensors that provide measurements on the time scale of cognitive processes. In this study, we explored MEG functional networks of the so-called resting human brain in health and schizophrenia by means of graph theory. Two graphical tools were of particular interest to us, small worldness and degree distribution.
The small world phenomenon, also commonly called six degrees of separation, was first observed in social networks in which the number of intermediate acquaintances between any two people is surprisingly small (Milgram, 1967). Although small worldness and its theories were introduced more than four decades ago, the small world phenomenon was only recently translated to a more quantifiable physical basis in an algorithm proposed by Watts and Strogatz (Watts and Strogatz, 1998; Watts, 1999).
They constructed a computational model of a perfectly ordered graph, in which each node was directly connected to its four nearest neighbors. This lattice topology demonstrated high clustering between nearby nodes because the path length (number of intermediary edges) between them was small by design. In contrast, the path length between distant nodes (on opposite ends of the lattice) was large, rendering the minimum path length averaged across all possible pairs of nodes as also large. They then randomly rewired all edges of the lattice until it had been transformed into a perfectly random network which had theoretical values of low clustering and low average minimum path length.
Importantly, however, they found that if they only introduced relatively few random rewirings into the lattice, it would mediate a short average minimum path length that was, for the most part, undetected at the local level. Hence, they found a class of graphs that were topologically intermediate between ordered and random graphs, exhibiting both the dense local interconnectedness observed in lattices and the high global integration (low average minimum path length) observed in random networks, which they called small world networks in allusion to the small world phenomenon.
Following this quantitative demonstration that a few short-cuts can have significant impact on network topology, small worldness has been reported in a range of complex networks ranging from metabolic systems and food webs to transportation systems and electrical power grids (Strogatz, 2001; Latora and Marchiori, 2003; Grigorov, 2005).
There are theoretical and empirical motives behind pursuing a small world analysis of human brain networks. To start with, several groups have argued that optimal brain functioning requires an appropriate balance between local specialization and global integration of brain activity (Tononi et al., 1998; Sporns et al., 2000; Latora and Marchiori, 2001; Le van Quyen, 2003), which suggests that brain networks might exhibit small world properties of high clustering (consistent with modular/segregated processing) and low average minimum path length (compatible with distributed/integrated processing). Moreover, the brain is a complex network since it must balance these two opposing forces (Tononi et al., 1998; Sporns et al., 2000), and therefore might show small world characteristics given the widespread observation of small worldness in so many other complex systems.
Small world topology might also represent an optimal brain organization for synchronization robustness between different brain regions (Watts and Strogatz, 1998; Lago-Fernandez et al., 2000; Latora and Marchiori, 2001; Barahona and Pecora, 2002; Masuda and Aihara, 2004). For instance, non-identical Hodgkin-Huxley neurons coupled with excitatory synapses show coherent oscillations in regular graphs, fast response in random graphs, and both coherent and fast responses in small world graphs (Lago-Fernandez et al., 2000). Importantly, synchronization of neural activity denotes physiological mechanisms of functional integration (Singer, 1999; Varela et al., 2001; Fries, 2005; Yu et al., 2008), and in this manner, small world networks of the brain allow for efficient information processing (Latora and Marchiori, 2001; Mathias and Gopal, 2001; Sporns and Zwi, 2004) and learning (Simard et al., 2005), as well as conditional robustness against malfunctioning brain regions (Albert et al., 2000; Achard et al., 2006).
Along these lines, it has been proposed that conservation of wiring cost has been an important selection pressure on the evolution of human brain components (Durbin and Mitchison, 1990; Chklovskii et al., 2002) since longer axonal projections are metabolically and materially expensive (Cherniak, 1994). With that said, small world architecture derived from anatomical and functional human brain connectivity models has been thought to deliver an economic strategy of maximizing global and local efficiency while minimizing axonal wiring connections (Latora and Marchiori, 2003; Achard and Bullmore, 2007; Humphries et al., 2007; Bassett et al., 2008).
A small, but growing, number of studies have confirmed small world features in healthy functional human brains when engaged in no proscribed activity (i.e., “rest”), and the evidence has been consistent (Stam, 2004; Eguiluz et al., 2005; Salvador et al., 2005; Achard et al., 2006; Bassett et al., 2006; Micheloyannis et al., 2006; Achard and Bullmore, 2007; Liu et al., 2008; Van den Heuvel et al., 2008). Remarkably, these studies reached the same conclusion albeit their diverse range of functional connectivity estimations (synchronization likelihood, wavelet decomposition, and partial correlation), nodal dimensions (macroscopic/regional and mesoscopic/voxel), and neuroimaging modalities [functional magnetic resonance imaging (fMRI), electroencephalography (EEG), and MEG]. (For more generalized reviews of healthy brain networks organized as small worlds, both functionally and structurally, in various modalities and testing conditions, see He and Evans, 2010; Sporns, 2011).
The optimal small world patterns seen in healthy functional brain networks may be disrupted in brain diseases: Brain tumors (Bartolomei et al., 2006), Alzheimer's disease (Stam et al., 2007a, 2009; Xie and He, 2012), epilepsy (Ponten et al., 2007, 2009), multiple sclerosis (Schoonheim et al., 2011) and schizophrenia (Micheloyannis et al., 2006; Liu et al., 2008; Rubinov et al., 2009) have all exhibited atypical small world functional brain topologies. To date, however, reports of how or even whether small world properties are disturbed in some of these clinical conditions have remained largely inconsistent (For recent reviews, see Reijneveld et al., 2007; Stam and Reijneveld, 2007; Van den Heuvel and Hulshoff Pol, 2010).
The second graphical approach often used to probe the functional organization of brain networks is degree distribution P(k). One of the most basic descriptions of a vertex is its degree k, or the number of edges that connect it to the rest of the graph. The average degree of the network is then knet. Highly connected vertices have large degrees and are often interpreted to function as network hubs. The degree distribution of a graph is the fraction of nodes with degree k, and can be used to assay the hierarchy of potential hubs in the network.
Efforts to classify the degree distribution of healthy functional brain networks have been less conclusive than those of small worldness, with some studies reporting scale-free organizations (Eguiluz et al., 2005; Van den Heuvel et al., 2008) and others reporting exponentially truncated power-law distributions (Achard et al., 2006; Bassett et al., 2006). In any case, these studies all suggest non-random degree distributions of resting healthy functional brain networks that are, at least in part, compatible with the occurrence of hubs.
One goal of this study was to determine whether source-localized magnetoencephalographic functional connectivity brain networks in resting health would show, across one or more bandwidths, non-random degree distributions and small world properties. We could not hypothesize whether graph theoretical measurements in this study would distinguish between healthy controls and schizophrenic patients because the topic remains elusive in the literature (Reijneveld et al., 2007; Stam and Reijneveld, 2007; Bassett et al., 2008; Bullmore and Sporns, 2009; Van den Heuvel and Hulshoff Pol, 2010). However, we recently found that resting patients showed significant reduction of source-localized MEG gamma power in the posterior medial parietal cortex, and wanted to determine whether similar differences are also present from functional connectivity perspectives, using datasets and preprocessing techniques as consistent as possible to our original study (Rutter et al., 2009).
Materials and Methods
Subjects
We initially wanted to use the same datasets (38 healthy controls and 38 patients) we applied in our previous resting activation study (Rutter et al., 2009). However, functional connectivity measurements presented technical limitations that led us to choose a subset of 40 datasets from the original 76; further explanation of this selection process is provided later. The age-gender matched sample used for this study included 20 patients (6 females, 14 males; mean age: 31.2 ± 10.9, age range: 20.7–48.6) and 20 healthy controls (6 females, 14 males; mean age: 31.3 ± 10.8, age range: 21.3–54.2), all right handed (Oldfield, 1971).
Data was collected as part of the Clinical Brain Disorders Branch Genetic Study of Schizophrenia (National Institutes of Health Study ID NCT00001486, DR Weinberger, PI) and subject screening procedures were approved by the National Institute of Mental Health Institutional Review Board. Details of the criteria used to screen our subjects can be found elsewhere (Egan et al., 2000). All subjects with the diagnosis of schizophrenia were receiving antipsychotic drugs.
Data Acquisition
Participants were instructed to rest with eyes closed in a lit, magnetically shielded room for a 4 min recording. MEG signals were continuously recorded with a 275-gradiometer SQUID sensor array over the inner surface of a whole-head helmet (the former CTF Systems, Coquitlam BC, Canada). Anatomical MRI (3T General Electric MRI scanner) and MEG data were registered onto a common coordinate system for each subject using three fiducial references. All datasets in this study were also used in our previous study; see (Rutter et al., 2009) for further description of acquisitional logistics.
Preprocessing
An identical preprocessing pipeline was applied to each of the potential 76 datasets: First, raw neuromagnetic data was digitized at a sampling rate of 600 Hz (bandwidth of 0–150 Hz) and filtered online in synthetic third gradient mode for background noise reduction. A 42,000 sampled (70 s) epoch, with minimal eye artifacts and head movement less than 0.5 cm, was selected off-line from each dataset. The data were then broadband filtered (1–80 Hz), and a minimal high-pass filter (0.61 Hz) and powerline filter (60 Hz) were used in addition to direct current offset.
Three-dimensional source projection of a given dataset onto a standardized brain template resulted in a whole-brain grid that contained 3291 cubic voxels with 7.5 mm width dimensions. For each dataset, MEG signals were translated to source weights for the 3291 voxels using single-state pseudo Z-deviate synthetic aperture magnetometry (SAM) (Vrba and Robinson, 2001). From the magnetic fields recorded by the 275 sensors, SAM generates a unique beamformer (275×1 vector of weighting factors) for each voxel in the cortex. Volumetric representation of brain activity was hence given in the form of 3291 virtual channels (linear combinations of measurements over time).
Minimum-variance beamforming estimates current dipole power changes in voxels across particular time windows and frequency bands. Optimal orientation of dipoles was estimated using the vector based method of Sekihara et al. Sekihara et al. (2001). The power source distribution of our SAM imaging was normalized with a constant noise estimate. An array ∑ of the N = 275 sensors was constructed with a constant noise variance vθ, defined as the smallest eigenvalue of the covariance matrix:
The estimated sensor noise was calculated as:
where Hθ represents the N × 1 unique beamformer generated for each voxel in the cortex. The estimated source power can then be calculated as:
where matrix X consists of rows containing data points for the N = 275 sensor channels and columns containing the sensor values, and covariance matrix C represents the covariance between sensor channels in X after the removal of the mean from each channel. The normalized estimated power in the voxel is then a ratio of the estimated source power and estimated noise variance of the voxel:
Defining Network Nodes
The 3291 source-localized virtual channels for each subject were converted to ASCII format, down-sampled from 600 to 200 Hz, and filtered into four narrower bandwidths as per classic electrophysiology (Θ: 4–8 Hz, α: 8–14 Hz, β: 14–30 Hz, γ: 30–80 Hz).
We initially generated source weights for all 3291 voxels within each of the 76 potential datasets. However, when estimating source activity across such a large set of voxels, we inevitably found voxels with low signal-to-noise ratios (S:N ≤ 1), where the quantity and location of such voxels varied across individual datasets. For accuracy, we only rendered a voxel usable if S:N > 1 for all datasets.
Because of this constraint, and the fact that graph analyses performed at the individual level are computationally expensive, we chose 40 datasets that maintained the highest number of usable voxels (2872) as well as the age-gender match between patients and controls. Discarded voxels were dispersed throughout the brain and were not confined to any particular gyrus or hemisphere. This routine concluded with 40 datasets that each contained 2872 voxel (node) time series, each with 14,000 samples, across four distinct bandwidths (Θ, α, β, γ).
Estimating Association between Nodes
Magnitude squared coherence, a generalization of correlation to the frequency domain, was computed between each pair of voxels in each dataset as a measure of linear relationship. From the time series of voxels i and j, and, we used Fourier transformation to obtain complex frequency-domain representations, x(f)i and x(f)j, and calculated the cross power spectral density defined as:
in which the overbar symbolizes complex conjugation. Complex-valued coherence is a function of the cross power spectral density and power spectral densities of i and j:
and magnitude squared coherence is the absolute value of complex-valued coherence squared:
For clarification, what we hereafter refer to as coherence is simply magnitude squared coherence. Coherence estimates how well i and j correspond at a specific frequency without a component of directionality; it ranges between 0 and 1. We obtained a single value of coherence for each voxel pair in each previously-filtered bandwidth (Θ, α, β, γ) by averaging the set of coherence values associated with the frequencies that constituted that bandwidth. For all calculations, we used the function mscohere in the Signal Processing Toolbox of MATLAB Software, using a Periodic Hamming window, sample overlap of 50%, and default FFT length.
Coherence remains one of the most studied tools for investigating interactions among neuron signals. It also forms some of the current mechanisms proposed for communication between brain regions (Fries, 2005). Recent work has also implicated that various phase value measures “provides equivalent information to the cross-correlation of the two complex time series” (Aydore et al., 2013). For these reasons, we believe coherence may be an appropriate tool in the time series we consider in the current work.
Generating Association Matrices
These coherence values, believed to reflect inter-voxel functional connectivity, were represented as an association matrix M, where element Mij contained the coherence value between voxels i and j. We repeated this process for each bandwidth, which resulted in four {2872 × 2872} matrices M for each subject.
From each association matrix M, we derived two thresholded matrices using an arbitrary threshold 0 ≥ τ ≥ 1: We produced a binary-valued adjacency matrix A, where Aij = 1 if Mij ≥ τ and Aij = 0 if Mij < τ, and a weighted matrix W, where Wij = Mij if Mij ≥ τ and Wij = 0 if Mij < τ. For all indices i and j: Aij = Aji, Wij = Wji, Aii = 0, and Wii = 0.
Constructing Graphs
There are several variations of graphs: For example, graphs can be unweighted or weighted. An unweighted (binary) graph contains edge weights of either zero or unity. In contrast, when graded values are associated to edges, the corresponding graph is called a weighted graph, and its edge values can be used to indicate the strength of their relationships. A graph can also be undirected or directed: An undirected graph indicates symmetric edge relationships between its vertices (Eij = Eji), whereas a directed graph signifies that its edges have causality (Eij ≠ Eji).
We were able to abstract graphs GA and GW, from matrices A and W respectively, by inputing lines between voxel pairs that held coherence values exceeding the threshold. Because we used coherence, a symmetric measurement, graph GA was undirected and unweighted, and graph GW was undirected and weighted. Repeating this process for each subject (40) and bandwidth (4) led to the formation of 160 sets of graphs GA and GW at the specified threshold. The dimensions of these 320 graphs were identical since we used the same number of nodes (N = 2872) for each subject.
Computing Small World Metrics
We could next characterize possible small world properties in the undirected graphs that represented functional brain networks by calculating two key metrics of small worldness, the clustering coefficient C and the shortest path length L.
In some networks, if vertex i has edge connections to vertices j and h (Eij = Eih = 1), then it is also probable that j is adjacent to h (Ejh = 1); this phenomenon can be quantified with the clustering coefficient. The clustering coefficient of vertex i, 0 = Ci = 1, is simply a ratio of the number of existing links between its neighbors to the number of maximum possible links between its neighbors, with its neighbors being defined as nodes directly connected to i with one edge. Thus, for graph GA:
In the equation above, we divided the maximum number of possible neighborhood connections ki(ki − 1) by two as we are observing undirected graphs. In an undirected but weighted graph, in our case GW, the clustering coefficient incorporates node-neighbor edge weights into the calculations:
where Wki is the weighted degree of i and WEij and WEih are the weighted edges of i with j and h. Both binary and weighted clustering coefficients range between 0 and 1. The mean clustering coefficient of the graph, Cnet, is then determined by averaging nodal clustering coefficients across the entire network.
Cnet is a measure of the presence of densely connected clusters within the network. A large Cnet is associated with efficiency of local information transfer in addition to local fault tolerance, broadly meaning that even if vertex i fails, its neighbors remain connected (Bullmore and Sporns, 2009).
Often, there are several alternative paths between two vertices i and j. The path that requires the minimum number of edges to traverse between i and j is known as the shortest path or geodesic distance, Dij. In a weighted graph, the weights of edges are taken to be inversely proportional to distance in the computation of the shortest path: That is, higher weights correspond to shorter geodesic distances and vice versa. The average minimum path length of a network, Lnet, sometimes referred to as the characteristic path length, represents the average of the shortest paths between all pairs of vertices in the network:
Lnet is a global property that measures the overall navigability of a network: A small Lnet is consistent with a well-integrated network capable of efficient parallel information transfer (Barabasi and Oltvai, 2004; Bullmore and Sporns, 2009).
Calculating Sigma
Network organization exists on a continuum with two extremes, perfectly ordered and perfectly random graphs. Watts and Strogatz showed in their algorithm that small world networks have Lnet comparable to, but Cnet much larger than, those of perfectly random graphs. Hence, the small worldness of a network can be expressed in a convenient single-value parameter, the ratio of its clustering coefficient to its path length with both metrics normalized by their corresponding values in an equivalent random graph. Formally this is written as:
As expected, sigma is larger than one for networks exhibiting small world properties (Humphries et al., 2006).
The node degrees of a theoretical random network follow a Poisson distribution which may differ from the degree distribution of the original graph. For this reason, calculation of sigma should be performed with a surrogate random graph configured with the same knet and P(k) as the graph of interest (Sporns and Zwi, 2004). Thus, for each graph (GA and GW), we generated surrogate random graphs (GA<rand> and GW<rand>) by randomly reshuffling the paths of node i to another nodal location and repeating this process for each node i = 1.2, 3 … N until the graph was completely randomized but knet and P(k) were preserved. This randomization process went through 25 iterations to compile each surrogate random graph.
Selecting Thresholds
Applying a single arbitrary threshold τ to the association matrices M would confine our analysis to the properties of the resulting set of graphs. We therefore methodically calculated graph theoretical metrics over a range of thresholds. The cells of our association matrices M contained coherence values between 0 and 1; hence, when τ = 0, all edges are present in the graph (Emax = N×(N−1)/2 = 4, 122, 756 in our graphs), and when τ = 1, no edges exist in the graph (Emin = 0).
One can apply the same threshold (for example τ = 0.5) to each graph. Although straightforward, this process results in a set of graphs with varying numbers of edges. In order to genuinely compare topological and functional characteristics between graphs, it is important to ensure that all graphs contain the same number of edges at a given threshold. This can be achieved using the threshold-dependent cost factor K(τ) of a graph, which is defined as the number of existing edges divided by the maximum potential number of edges, 0 ≤ K(τ) = E(τ)/Emax ≤ 1 (Latora and Marchiori, 2001; Achard and Bullmore, 2007).
Low values of K(τ) result in sparse graphs in which the number of false-positive connections is minimized (Breakspear and Terry, 2002). On the other hand, very low values of K(τ) lead to either fragmentation of graphs into sub-graphs when nodes become disconnected or conditions in which small world properties are no longer estimable because the average degree becomes less than the log of the number of nodes (knet < ln(N) = 7.96 in our graphs).
We therefore selected our lowest value of K(τ) to fulfill two criteria: The largest connected component had to contain at least 99% of nodes and knet had to be larger than 7.96. We found that the limiting constraint occurred just below K(τ) = 0.04 when graphs from several subjects showed disconnection of >1% nodes. Therefore, we calculated small world metrics over 33 separate thresholds of K(τ), ranging from 0.04 to 0.3 (in 0.01 intervals) and 0.4 to 0.9 (in 0.1 intervals). For a schematic representation of small world calculation and threshold selection, refer to Figure 1.
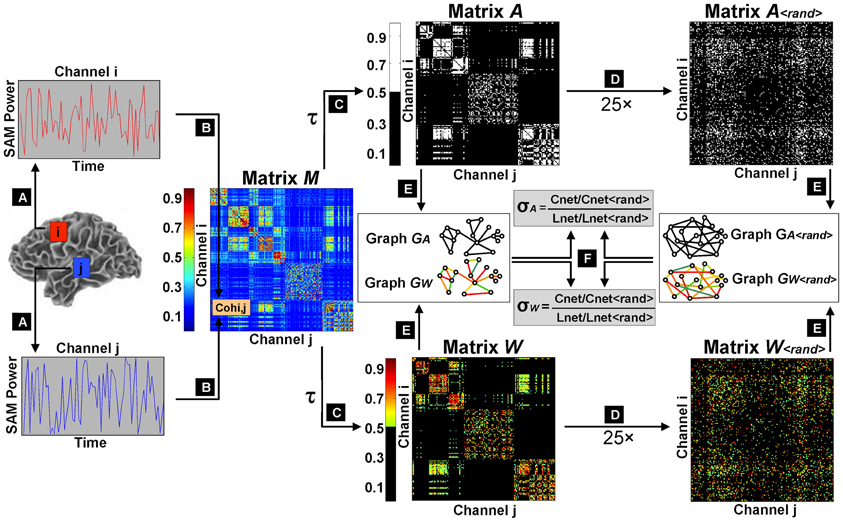
Figure 1. Schematic flowchart of small world index calculation. The first step was the extraction of filtered, source-localized magnetoencephalographic time series from 2872 voxels across the brain (A). Magnitude squared coherence was then computed as an estimation of functional connectivity between all pairwise combinations of virtual channels to construct an association matrix M (B). Sliding thresholds τ were used to derive adjacency matrices A and weighted matrices W, with cost factors K(τ) ranging from 0.04 (sparsest matrix: 4% edges retained) to 0.7 (densest matrix: 70% edges retained) (C). A randomization procedure was iterated 25 times on the thresholded weighted and unweighted matrices to obtain surrogate random networks with random connectivity organizations but preserved knet and P(k) (D). Original matrices and their randomized counterparts were then converted into undirected graphs (E), and small world parameters (Cnet and Lnet) were computed for the graphical models of functional brain networks GA and GW, and normalized by their equivalent values (Cnet<rand> and Lnet<rand>) in randomized graphs GA<rand> and GW<rand>, to determine small world indices σA and σW (F).
Calculating Physical Connection Distance
The topological distance between brain areas, emphasized in graph theory, is often related to the topographical (physical) distance between brain regions, and minimization of cortical wiring is typically observed in small world brain networks (Bullmore and Sporns, 2009).
We estimated the connection distance of an edge, dij, as the Euclidean distance between the three-dimensional centroids of voxels i and j in standard stereotactic space: dij ~ (xi − xj)2 + (yi − yj)2 + (zi − zj)2. The mean connection distance (d,mm) of each brain network was defined as the average of the connection distances over its edges. Therefore, unlike the topological and dimensionless metrics we used in graph theoretical measurements, the connection distance describes a spatial property of the network (axonal length) and has units of millimeters.
Producing Degree Distribution Plots
Degree distribution analysis was performed on the sparsest weighted network (K = 0.04), as this strict threshold eliminates weaker noisy connections (Achard et al., 2006) while remaining valid for small world network analysis. Previous studies suggest that small world brain networks may be fitted for three candidate models based on the frequency distribution of their node degrees: exponential, power-law, and exponentially truncated power law (Amaral et al., 2000), which we briefly describe.
Random graphs follow an exponential degree distribution: P(k) ~ e−αk (Bassett and Bullmore, 2006), indicating an absence of hubs since the majority of nodes have degrees similar to knet (Barabasi and Oltvai, 2004). Most networks in the real world, however, have degree distributions that strongly deviate from those of random models.
Complex systems, such as the World Wide Web, approximate a power-law degree distribution: P(k) ~ k−α (Barabasi and Albert, 1999; Barabasi and Oltvai, 2004). These networks are called scale free because they demonstrate the coexistence of nodes with largely different degrees (scales).
Physically embedded networks, such as transportation systems, have nodes with finite capacities that reach their maximum degree when they can no longer physically accommodate more connections. These networks follow an exponentially truncated power-law distribution: P(k) ~ kα−1ek/kc (Guimera et al., 2005; Bullmore and Sporns, 2009). The form of their degree distribution suggests that they are likely to have a stronger hub presence than in comparable random configurations but a lesser hub presence than in comparable scale free networks (Bassett and Bullmore, 2006).
We evaluated goodness of fit for the three statistical models described above using Akaike information criterion, a method that accounts for the differences in degrees of freedoms (Achard et al., 2006). In this process, we used a cumulative distribution to reduce the effects of noise (Strogatz, 2001; Gong et al., 2009).
Statistics
Statistical comparison of brain metrics between the two groups was performed using a two-sample t-test at each K(τ) using the voxel-wise 3dttest command from AFNI (Cox, 1996; He et al., 2006; Micheloyannis et al., 2006; Liu et al., 2008).
Results
Clustering Coefficient and Characteristic Path Length
We concentrated on binary, rather than weighted, Cnet and Lnet brain network values to compare them to their corresponding values in ordered and random networks (Watts and Strogatz, 1998; Stam et al., 2009). The binary Cnet increased as the network became denser, and was less than experimental and theoretical (Cnet = 0.75) values of same-cost lattices, but greater than experimental and theoretical (Cnet = knet/N) values of same-cost random networks (Figure 2C). The binary Lnet decreased as the network contained more edges, and was also less than experimental and theoretical (Lnet = N/2knet) values of regular networks, but greater than experimental and theoretical [Lnet = ln(N)/ln(knet)] values of random networks configured with the same edge connection densities (Figure 2A). Although binary functional brain networks were topologically intermediate between ordered and random structures, in the sparsest networks, binary Cnet was closer to that of a regular network and binary Lnet was closer to that of a random network (Figures 2A,C). All of these trends for binary Cnet and Lnet values were observed in each frequency bandwidth (Figures 2A,C), and healthy controls and patients did not show significant differences in any binary Cnet and Lnet values.
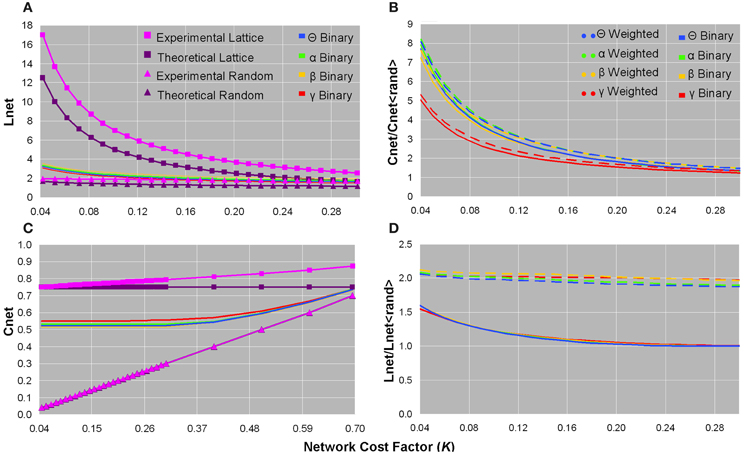
Figure 2. Plots of the characteristic path length (A), normalized clustering coefficient (B), clustering coefficient (C), and normalized characteristic path length (D) as a function of network cost factor for averaged healthy control datasets. In each bandwidth, as the network cost increased, the binary Lnet decreased (A) and the binary Cnet increased (C). Binary Lnet and Cnet were both intermediate between their corresponding values in lattices and random networks configured with the same number of edge connections and calculated both theoretically and experimentally (A,C). Note that (C) is presented until a larger cost factor as a means to demonstrate that the binary networks remained intermediate between ordered and random configurations until convergence. Normalized binary and weighted clustering coefficient values decreased as more edges were added and were smaller in the γ bandwidth than in the other frequency bands (B). Unweighted and weighted normalized path length values decreased in denser networks, and binary graphs showed smaller values than those of weighted graphs (D). For visualization purposes, only data from healthy controls are plotted since these values did not significantly differ in patients.
Normalized Clustering Coefficient and Normalized Characteristic Path Length
For all bandwidths, binary and weighted normalized Cnet and Lnet increased as the number of network edges decreased; however, normalized Cnet values increased considerably more than normalized Lnet values (Figures 2B,D). In sparse networks, the γ frequency band showed smaller normalized binary and weighted Cnet values than the other bandwidths (Figure 2B). Compared to weighted networks, binary networks showed smaller normalized Lnet values as a function of network cost (Figure 2D). No significant differences were found in normalized Cnet and Lnet values between healthy controls and patients.
Small World Index
Small world indices did not significantly distinguish between healthy controls and patients, and all subjects showed σ-values greater than unity in low K(τ) networks in each frequency band of binary and weighted networks (Figures 3A,B). Although the standard deviation of σ-values was largest in the sparsest networks, inter-subject variation was minimal (Figures 3C,D). The γ frequency showed smaller σ-values compared to the other frequencies in both weighted and unweighted graphs (Figures 3A,B). For a given bandwidth and cost factor, binary networks showed larger σ-values than weighted networks (Figures 3A,B). As networks became denser, σ-values monotonically decreased toward an asymptotic value of ~1 in binary networks and ~0.56 in weighted networks (Figures 3A,B).
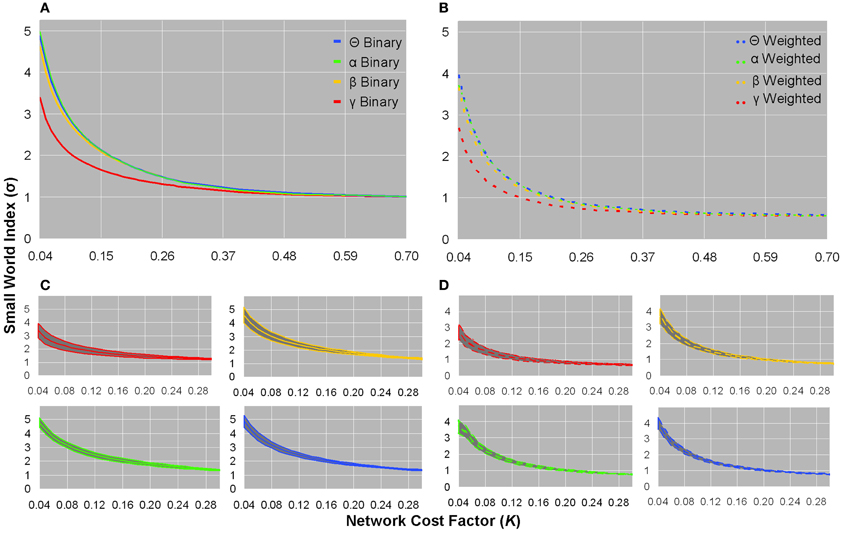
Figure 3. Small world indices for healthy controls. Plots of binary graph average small world index (A) and standard deviation (C), and weighted graph average small world index (B) and standard deviation (D). In binary and weighted sparse graphs, the γ bandwidth showed smaller σ-values than the other bandwidths (A,B). Binary σ-values were larger than weighted σ-values as a function of network cost, and binary σ-values monotonically declined toward an asymptotic value of ~1, whereas weighted σ-values monotonically declined toward an asymptotic value of ~0.56 (A,B). In sparsely connected networks, both binary and weighted graphs showed σ >> 1 (A,B). The standard deviation of σ-values showed little inter-subject variation (C,D). The σ-values from healthy controls were not significantly different in patients.
Physical Connection Distance
Networks from all bandwidths showed larger coherence values, on average, in voxel pairs that were physically closer than those that were more physically remote (Figure 4A). There was little variation between subjects in the average coherence between voxel pairs grouped by physical connection distance (<7.5 mm, 7.5–15 mm, 15–22.5 mm, etc.) (Figure 4A). Likewise, as network sparsity increased, the mean connection distance (d,mm) decreased: In the sparsest brain network (K = 0.04), mean connection distance was three times smaller (d ~ 23.7 mm) than it would be in a comparable random network (d ~ 72.8 mm) (Figure 4B). Functional brain organization of physical connection distances did not significantly differ between patients and controls.
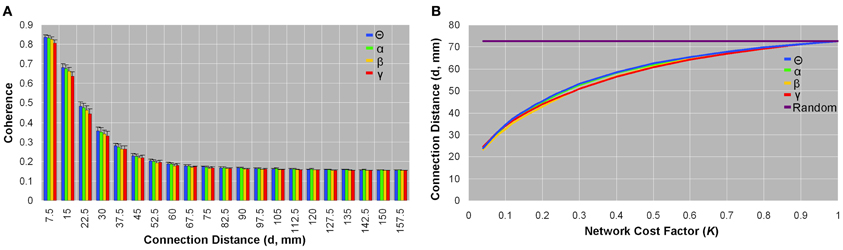
Figure 4. Organization of physical connection distances between brain voxels. Coherence as a function of connection distance (A), and connection distance as a function of network cost (B) in healthy control data. Coherence between spatially close voxel pairs was on average higher than spatially remote voxel pairs; this pattern was observed in each frequency band (A). Small standard deviation bars indicate that the average coherence between voxel pairs placed in bins as per physical connection distance varied little between subjects (A). Similarly, the average physical connection distance between all voxel pairs was smaller in sparse networks than in dense networks, and this trend was seen across all frequencies (B). In the most sparse brain networks (K = 0.04), the mean connection distance was about one-third that of comparable random networks (d ~ 72.8 mm) (B). Patients did not significantly differ from healthy controls in any parameters of physical connection distances.
Degree Distribution
The log-log plot of the cumulative distribution of functional brain network degrees decayed most as an exponentially truncated power law in all cases except the beta control group (Figure 5). In general, average brain networks for healthy controls and patients across each bandwidth showed the most negative AIC value for the exponentially truncated power law (range: −74.7 to −61.9, excluding the beta control group) and the least negative AIC value for the power law (range: −25.5 to −49.0) (Table 1).
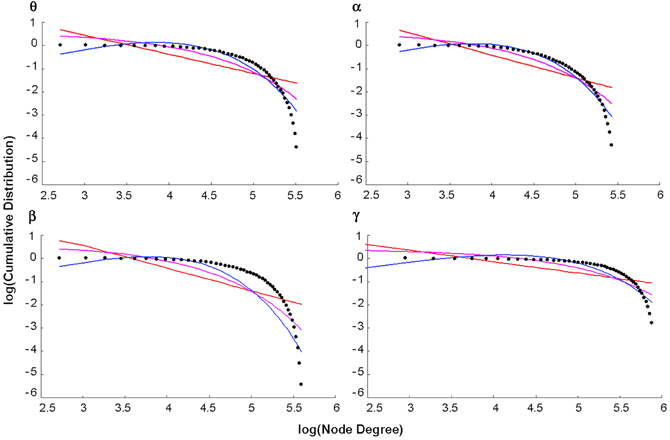
Figure 5. Degree distributions. Plots of the log of the cumulative distribution of degree, log(P(k)), vs. the log of degree, log(k), for healthy control group maps in each bandwidth. The black dots represent observed brain data, the pink line is the best-fitting exponential, the red line is the best-fitting power law, and the blue line is the best-fitting exponentially truncated power law.
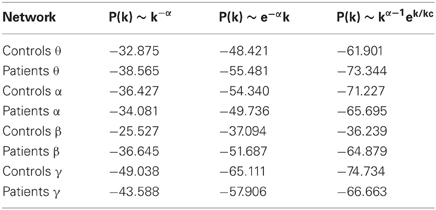
Table 1. Akaike information criterion for goodness of fit of the three statistical models.
Post-hoc Analysis: Non-Global Measurements
Although graph theoretical global parameters (small world metrics, mean connection distance, and degree distribution) were quantifiably similar to those reported in previous healthy volunteer studies, they did not show significant differences between the functional brain networks of healthy controls and patients. We therefore investigated whether functional connectivity at a less global level would significantly differentiate between the subject populations. It would be impractical for us to explore a range of thresholds for this purpose, and so we concentrated on weighted graphs of the strictest threshold (K = 0.04), which we had previously used to examine degree distribution.
First, we explored functional connectivity metrics at the scale of individual brain voxels. To do this, we defined the mean functional connectivity of voxel i, Fi, as the average coherence it shared with all other voxels in the brain:
For each subject, we generated a vector F [1×2872], where elements represented the mean functional connectivity for the 2872 brain voxels. We saved these vectors as ASCII text files, along with an ASCII list of the 2872 brain coordinates, and converted them into 3D-functional datasets using the “3dUndump” command in AFNI (Analysis of Functional Neural Images) Software (Cox, 1996).
Talairach aligned volumes were computed for each dataset, and 3D-mean maps of healthy controls and patients were computed across each bandwidth. From these group maps, we determined the spatial locations of the fifty voxels with the highest mean functional connectivity, as these brain regions might represent hubs that play important roles in network organization (Van den Heuvel et al., 2008). It was important to determine the anatomical location of these functional hubs: Our findings from the main analysis that brain graph nodes followed a heavy-tailed exponentially truncated power law degree distribution had suggested that most brain regions have low linkage and are held together in the system by the few regions that have high linkage (the hubs).
We found that brain regions with the largest mean functional connectivity were relatively consistent across frequency bands, and included the caudate, cerebellar tonsil, cingulate gyrus, culmen, claustrum, hippocampus, parahippocampal gyrus, PCC, and thalamus (Table 2). In general, lower frequency (θ and α) maps showed functional hubs predominantly in the culmen and cerebellar tonsil, whereas higher frequency (β and γ) maps showed functional hubs mainly in the PCC. Across all bandwidths, the thalamus served as a key functional hub (Table 2). All of these potential resting-state hubs widely overlapped between healthy controls and patients (Table 3).
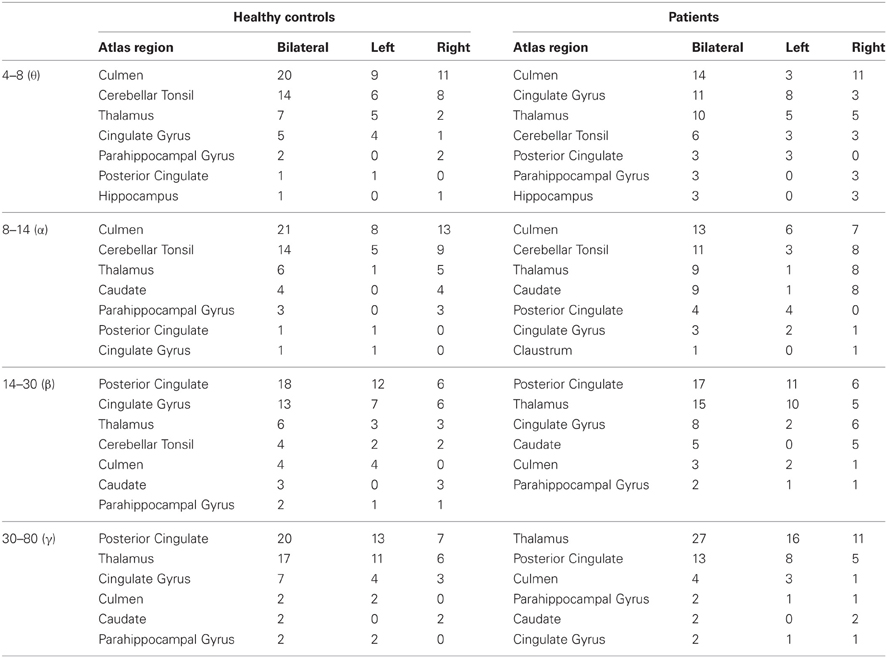
Table 2. Hub locations: The fifty voxels with the largest mean functional connectivity per bandwidth.
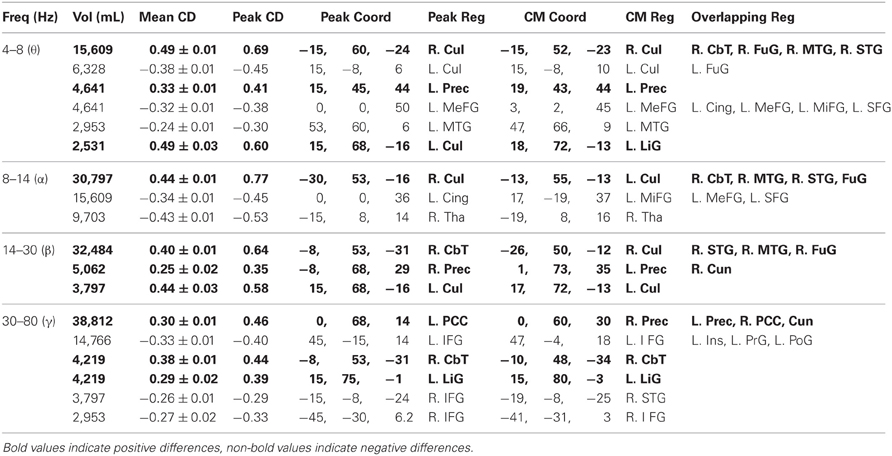
Table 3. Voxel clusters with mean functional connectivity differences between population groups (uncorrected p = 0.05).
We also computed 3D-ttest maps between the 3D-functional datasets of healthy controls and patients to determine if any voxels showed significant differences in mean functional connectivity between the populations (uncorrected p = 0.05). Across the frequency bands, we found that healthy controls generally showed higher mean functional connectivity in the precuneus, cuneus, PCC, culmen, and cerebellar tonsil, whereas patients typically showed higher mean functional connectivity in the inferior frontal, medial frontal, middle frontal, and superior frontal gyri (Figure 6A, Table 3).
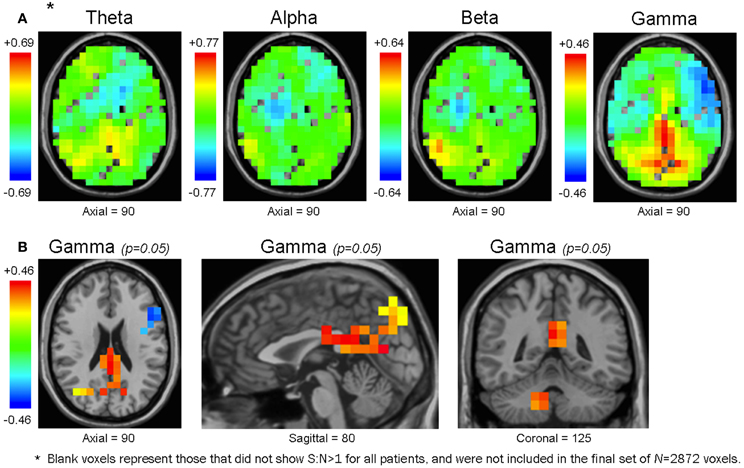
Figure 6. Maps of the mean functional connectivity difference of healthy controls minus patients. Unthresholded maps for each frequency bandwidth (A), and maps for the γ band thresholded at an uncorrected p-value of 0.05 (B). In the unthresholded maps, some voxels are without values because they did not have S:N>1 for all subjects, and were not included in the original voxel set of N = 2872 (see Methodology) (A). In θ, α, and β maps, the voxel cluster with the largest mean functional connectivity difference was positive-valued (i.e., healthy controls had larger mean functional connectivity than patients) and overlapped with the right CbT. In the γ bandwidth, the voxel cluster with the largest difference in mean functional connectivity was also positive-valued but overlapped with the bilateral Prec, Cun, and PCC (A). Unthresholded maps are presented along the same axial plane; therefore, except for the γ bandwidth, they do not show their peak voxels (which would be in the CbT for θ, α, and β maps) (A). Although none of the voxels from any bandwidth survived multiple comparison procedures, at the uncorrected level of p = 0.05 the γ map presented trends that accord with our previous resting activation study in which healthy controls showed larger γ SAM power in the bilateral Prec, Cun, and PCC (B).
We noted that the largest γ band voxel cluster to survive the uncorrected p = 0.05 threshold showed higher mean functional connectivity in healthy controls across the bilateral precuneus, cuneus, and PCC (Figure 6B, Table 3). Interestingly, these brain regions overlapped with the only cluster we identified in a previous resting activation study, in which healthy controls showed higher resting γ SAM power than patients. Consequently, even though none of the voxels from the 3D-ttest maps survived multiple comparison testing, the largest γ cluster at the uncorrected p-level of 0.05 was consistent with our previous resting γ activation findings.
In the last part of the post-hoc analysis, we focused on the γ bandwidth to determine whether inter-regional brain pairs showed coherence values significantly different between healthy controls and patients. To accomplish this, we grouped the 2872 brain voxels into 62 brain anatomical seed regions and computed, for each of the 1891 pairwise combinations of brain regions, the average coherence value between all voxels comprising that pair of brain regions. This procedure led to a set of 1891 values for each subject that represented the average γ coherence value between the 1891 brain region pairs.
We arbitrarily focused on the fifty regional pairs (~2.5% of all possible pairs) with the largest γ coherence differences between healthy controls and patients (uncorrected p = 0.03). Fifteen of these pairs showed higher γ coherence in patients, and involved several connections to the right inferior frontal gyrus, right uncus, and right insula (Figure 7). In contrast, healthy controls showed higher γ coherence in thirty-five of these pairs, with the most connected brain regions including the bilateral cuneus (18 inter-regional connections) and bilateral PCC (9 inter-regional connections) (Figure 7). Healthy controls also showed higher γ coherence in pairs that included the left middle occipital gyrus, left cingulate gyrus, and left precuneus (Figure 7). All of these brain regions in which healthy controls showed higher inter-regional γ coherence coincided with regions from our previous resting activation study in which healthy controls showed greater resting γ SAM power. Hence, although none of the 1891 inter-regional γ coherence values passed multiple testing corrections, several of the inter-regional pairs in which healthy controls showed higher γ coherence (at the uncorrected p-level of 0.03) were consonant with our previous findings of increased resting γ SAM power in healthy controls across the posterior portion of the medial parietal cortex.
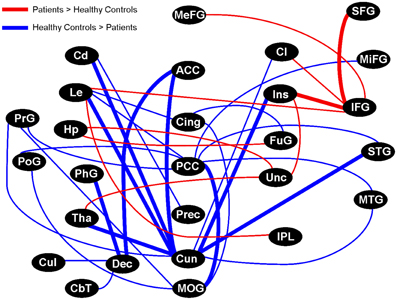
Figure 7. Graphical visualization of the fifty anatomical pairs with the largest connectivity difference between healthy controls and patients in the γ band. The pairs represent ~2.5% of the 1891 possible pairs between 62 brainwide anatomical seed regions. The nodes in the above image do not consider brain laterality: However, thick lines are distinguished from thin lines as they represent regions that maintained more than one laterality combination of pairs (for example: R.Cun/R.ACC and L.Cun/R.ACC). Brain regions in which healthy controls displayed higher SAM γ power in our previous study all showed higher inter-regional connectivity in healthy controls, particularly the Cun and PCC, but also the MOG, Cing, and Prec. On the contrary, the IFG and Unc were prominently more connected in patients. Although none of the 1891 pairs passed multiple comparison testing, the top ~2.5% of pairs (uncorrected p-value of 0.03) showed trends that are consistent with our previous study.
Discussion
We found that global parameters of functional brain networks were consistent with those of previous reports, demonstrating small world topologies, near-minimum wiring costs, and non-random degree distributions. We also found that all these metrics were preserved in patients with schizophrenia even in the presence of a brain disorder with putative impacts on complex brain functions and treatment with antispychotic drugs, which may also impact on such functions. It is difficult to place this negative finding into the framework of current literature, as reports have varied on how or even whether graph theoretical approaches distinguish between healthy controls and patients (Reijneveld et al., 2007; Stam and Reijneveld, 2007; Bassett et al., 2008; Bullmore and Sporns, 2009; Van den Heuvel and Hulshoff Pol, 2010).
Importantly, however, we found that instead of chance and randomness, there existed a moderate degree of internal order in networks, which might allow for the optimization between segregation and integration of information processing, yielding highly complex brain dynamics. Recent studies have isolated brain regions that show high levels of functional connectivity during resting conditions (Damoiseaux et al., 2006; Buckner et al., 2008), and this phenomenon might be reflected in the high level of clustering we found in networks of this study (Van den Heuvel et al., 2008). The presence of a short characteristic path length in functional networks here might demonstrate that resting brain topology allows for high navigability and streamlined parallel information transfer between resting-state brain regions (Van den Heuvel et al., 2008). Additionally, compared to random networks, brain networks showed reduced wiring costs, which implies that the resting brain conserves energy and material needed for longer axonal projections, while delivering economical small world properties.
Our data add to the growing evidence that small world properties in brain networks may be detectable fairly independent of the methodological procedures used for network construction. Within our study alone, we found that small world architecture was resilient enough to be discerned across eight networks of distinct preprocessing pipelines (four frequency ranges of binary and weighted arrangements). Moreover, our study represents one of the few efforts to apply graph theoretical mathematics at the source-level, and in so doing, we have added to recent endeavors striving to confirm neural correlates to the resting hemodynamic functional connectivity networks more-often analyzed in fMRI (Brookes et al., 2011a), thereby permitting useful cross-modality comparisons that would be impeded if our study were to be performed at the sensor-level (Hillebrand et al., 2011).
Source Versus Sensor Space
We acknowledge that analyzing functional connectivity in source-space, as opposed to the more prevalent sensor-space, may affect the resulting brain connectivity patterns. However, we decided to analyze the resting networks using SAM beamforming in order to provide the most simple and consistent design needed to continue our line of thought from our original paper, in which we found localized reduction of SAM power in the “resting condition” in our patients (Rutter et al., 2009). In other words, we did not wish to introduce new methodological variability in our subsequent study, other than that we are now determining whether the original baseline differences related to any network abnormalities.
It is also worth noting that there are several drawbacks to using sensor recordings for network construction: For instance, multiple recording sites often detect signals from common sources due to the configuration of the induced magnetic flux, and as such, several groups have advocated for the use of source reconstruction in connectivity analysis to reduce the resulting confounding effects of field spread and volume conduction (Schoffelen and Gross, 2009; Bialonski et al., 2010), as they may lead to erroneously high estimates of functional connectivity (Hillebrand et al., 2011; Jin et al., 2011). Furthermore, multiple signals from spatially separated brain areas merge at the sensor level, which can culminate in over- and under-estimation of synchronization measurements (de Hann et al., 2011; Hillebrand et al., 2011).
These restrictions on sensor-level approaches have prompted exploration into various directions, one being investigation into the use of functional connectivity research at the source level (Hillebrand et al., 2011), an alternative that simultaneously increases the precision of the anatomical regions being studied (Stam et al., 2007b), which may prove particularly imperative in schizophrenia research as a means to thoroughly elucidate whether and how functional brain interactions are impaired (Hinkley et al., 2010). In light of this, several groups that studied resting functional connectivity networks at the sensor level have recommended that future studies address whether similar findings may be detected at the source level (Stam, 2004; Jin et al., 2011; Becker et al., 2012). Also in relation to our study, the specific use of graph theoretical tools to characterize functional networks may be valid at the source level (Palva et al., 2010; Banerjee et al., 2012), and some authors deem that signal space readings may not qualify as genuine vertices seeing they have no clear relation to underlying sources (Antiqueira et al., 2010).
One advantage of the beamformer method, which we employed in our current study, over other inverse procedures is that the number of sources to be estimated does not need to be defined a priori (Aine et al., 2011). Additionally, studies have positively assessed methods of estimating linear and non-linear interaction of neuronal sources using beamformers (Moratti et al., 2011; Vakorin et al., 2011; Wibral et al., 2011), including SAM (Hadjipapas et al., 2005; Vakorin et al., 2010). One recent group, after confirming spatial agreement between resting functional connectivity estimates derived from MEG and fcMRI, concluded that SAM may represent an effective beamformer to model functional connectivity in source space (Brookes et al., 2011a). And several more groups have used similar methods to those of our current study, by mapping MEG functional connectivity across the resting brain using beamforming (Guggisberg et al., 2008; Hinkley et al., 2010), including SAM (Brookes et al., 2011b; Hillebrand et al., 2011). With that said, however, each source reconstruction algorithm employs its own assumptions that may influence correlation estimates between source-based recordings, and beamforming naturally presents its own disadvantages, including partial cancellation of coherent signals and robust cross-talk problems (Hui et al., 2010), knowing that volume conduction and field spread are not entirely eradicated after moving to source-space (Hillebrand et al., 2011).
We now briefly discuss how we interpret our current findings and how they relate to previous reports.
Small World Metrics
Watts and Strogatz established that small worldness exists in sparse networks that require N >> knet >> ln(N) >> 1. In our analysis, the sparsest binary brain networks (K = 0.04) showed Lnet closer to that of random graphs and Cnet closer to that of lattices (Figures 2A,C). The strong clustering and short path length in our analysis might support the integration believed to be necessary for efficient information processing in networks (Stam, 2010; Sporns, 2011). Moreover, when normalized by random networks matched for knet and P(k), the sparsest brain networks showed much higher Cnet than Lnet (Figures 2B,D). However, the calculated clustering coefficient, and hence the small world metric, may both be inflated as a result of the problem of artifactual connectivity decreasing with distance in source-level MEG (Schoffelen and Gross, 2009).
These preliminary results may still suggest that sparse brain networks exhibit small worldness, and were in line with our direct computation that σ >>1 in the sparsest networks of healthy controls for both binary (σ : θ = 4.87 ± 0.42, α = 4.99 ± 0.55, β = 4.61 ± 0.58, γ = 3.38 ± 0.55) and weighted (σ : θ = 3.96 ± 0.34, α = 3.95 ± 0.39, β = 3.66 ± 0.46, γ = 2.67 ± 0.45) computations (Figure 3), of which patients showed similar σ-values. Each individual dataset showed small world properties most saliently in the sparsest networks; however, as expected, when networks became denser, the values of σ monotonically declined (Figure 3).
We originally constructed weighted graphs to determine whether the distribution of weights would affect the small world indices computed in the more-often analyzed unweighted graphs, a procedure suggested by recent studies (Jin et al., 2011). In general, we found that weighted graph metrics were qualitatively similar to binary graph metrics, and still did not distinguish between subject populations. However, a notable difference was an overall increase in normalized Lnet in weighted networks compared to binary networks (Figure 2D), a finding that was also observed in a previous study that compared binary and weighted graphs (Rubinov et al., 2009).
We also initially constructed graphs over a range of frequencies to determine whether small world indices would vary across bandwidths. Although the γ band showed decreased normalized Cnet and σ compared to other bands (Figures 2B, 3A,B), we generally found that small world metrics were preserved across frequency bands and still did not distinguish between healthy controls and patients. This finding is broadly consistent with a previous demonstration of frequency scale invariance in resting healthy brain functional networks derived from wavelet decomposition of MEG time series (Bassett et al., 2006).
Additionally, our observation that the small world index did not distinguish between subject populations is somewhat in accordance with a recent study that derived anatomical networks from MRI cortical thickness measurements, and found no differences in small world values between healthy controls and patients (Bassett et al., 2008). And, our findings that no small world values differentiated the subject populations is in line with another study that also found no differences in overall small world value, clustering coefficient, or path length between subject groups using diffusion tensor imaging (Van den Heuvel et al., 2010). However, we should comment that these projects analyzed anatomical, as opposed to functional, brain networks.
In contrast to our experiment, most studies have reported disrupted small world metrics in resting functional brain networks of patients, although these reports have not been consistent (Reijneveld et al., 2007; Stam and Reijneveld, 2007). Nevertheless, the most replicated observation is that of decreased clustering coefficients in schizophrenia from studies using EEG (Micheloyannis et al., 2006; Sakkalis et al., 2006; Rubinov et al., 2009) and fMRI (Liu et al., 2008; Lynall et al., 2010; Alexander-Bloch et al., 2012; Yu et al., 2012). We suspect that differences in these studies, to the extent that they are not methodological, involve differences in clinical samples, in the MEG physical environment, and in other characteristics that might impact on the mental state of patients during the acquisition of the MEG data.
The first of these EEG studies to explore small world metrics used continuous wavelet transform to characterize γ oscillations from healthy controls and patients performing a working memory paradigm (Sakkalis et al., 2006). The authors reported overall reductions in Cnet, and Lnet in the functional brain networks of patients. The next EEG study explored functional brain networks derived from synchronization likelihood estimations of signals collected at rest and during a working memory condition (Micheloyannis et al., 2006). Patients showed reduced σ and Cnet in α, β, and γ bandwidths during both resting and working memory conditions. In the most recent of the EEG studies, patients showed lower Cnet and shorter Lnet in comparison to healthy functional brain networks estimated from non-linear interactions of resting-state scalp EEG data (Rubinov et al., 2009).
Several groups have investigated small world networks in resting schizophrenia using fMRI: In one study, partial correlation analysis was used to estimate functional connectivity, and patient networks showed smaller Cnet and longer Lnet (Liu et al., 2008). A more recent project investigated resting functional connectivity in the 0.06–0.125 Hz range, and found that patients showed decreased σ and Cnet values (Lynall et al., 2010). Another group explored modular organization of brain networks by decomposing fMRI data into independent components, and reported decreased Cnet values in patients (Yu et al., 2012). The most recent fMRI study reported reduced Cnet values in childhood-onset schizophrenia (Alexander-Bloch et al., 2012).
That the brain network organization of schizophrenia has been mostly reported as being less clustered, and sometimes less small-world, has led to the hypothesis there may be “subtle randomization” of brain network topology in schizophrenia (Rubinov et al., 2009). However, several studies have showed that the small world index does not distinguish schizophrenia, and other studies have reported that significant population differences in small world parameters may depend upon study methodological parameters: For instance, a recent EEG study by Jalili and Knyazeva found that patients showed increased σ in α bands but decreased σ in β bands, suggesting that the discriminating capacity of graph theoretical parameters in schizophrenia may be fairly dependent on methodologies and modalities (Jalili and Knyazeva, 2011).
Indeed, a recent study found that patients unexpectedly showed increased Cnet values, as well as increased Lnet values, and the authors noted their findings were not in accord with the often-reported decreased clustering in schizophrenia (Yu et al., 2011). Our current study also did not find significant decreased clustering in schizophrenia, and this relatively unexpected finding may be partially due to the fact that we analyzed the brain networks using MEG, instead of EEG and fMRI used in previous studies. As noted above, it may also reflect differences in the mental state of our patients during the MEG procedure in comparison to that of other studies, which could be determined by various uncontrolled and uninterpretable factors (Morcom and Fletcher, 2007).
Physical Connection Distance
In light of the fact that longer wiring expends more physical energy (Cherniak, 1994), it has been suggested that the conservation of wiring cost might reflect selection pressures on the evolution of brain networks (Bullmore and Sporns, 2009), and that small world topology might represent an economical layout to minimize axonal volume while maximizing brain complexity (Bassett et al., 2006). As such, spatially close brain regions have a higher probability of being connected than spatially remote regions (Hellwig, 2000; Averbeck and Seo, 2008).
In our analysis, coherence value was negatively correlated with Euclidean distance in functional brain networks (Figure 4A), and the sparsest networks showed mean connection distances one-third that of comparable random networks (Figure 4B). These measurements did not differ between healthy controls and patients, which suggests that all brain networks share the organizational principle of reducing wiring costs, compared to random graphs, especially in the sparsest brain networks that demonstrate the largest σ-values. However, we note that it is difficult to determine whether or how much of the observed reductions in wiring cost can be attributed to the fact that source reconstruction may underestimate true long-distance interactions (Stam and van Straaten, 2012).
One previous study found that both healthy and schizophrenic cortical networks showed less wiring cost than expected in random topologies, and this trend was observed in each classical division of cortex (multimodal, unimodal, and transmodal) (Bassett et al., 2008). Compared to healthy controls, however, people with schizophrenia showed significantly increased mean connection distance in the multimodal networks, an observation that the authors interpreted to mean less wiring efficiency. The same group recently found that task performance in healthy controls and patients during a working memory task was proportional to global cost efficiency in β band MEG networks (Bassett et al., 2009). These findings, combined with our current findings, are in line with the hypothesis that low connection cost might also mean higher efficiency of information transfer in complex brain networks.
With that said, however, the fact that mean connection distance did not distinguish subject populations in our study, and particularly in the orientation that patients would show increased mean wiring cost, a trend that was recently reported in resting fMRI studies of childhood schizophrenia (Alexander-Bloch et al., 2012), may be somewhat inconsistent with previous reports; however, the diverse methodologies employed between the studies and the variable environmental and clinical characteristics may again be partially responsible for these discrepancies.
Degree Distribution
Previous studies of healthy functional brain networks at rest have reported degree distributions that either conform to power-laws or exponentially truncated power-laws. An explanation for divergent findings of scale-free properties is currently unavailable (Bullmore and Sporns, 2009). However, it is notable that truncated power law degree distributions have been more often reported in regional-resolution studies (Achard et al., 2006; Bassett et al., 2006; Lynall et al., 2010), whereas pure power-law scaling have mostly been more often reported in voxel-resolution studies (Eguiluz et al., 2005; Van den Heuvel et al., 2008; Tomasi and Volkow, 2011a). Moreover, resting-state studies that constructed degree distributions at both voxel and regional based resolutions have observed that the higher the resolution, the closer the fit changes from a truncated to a full power law (Hayasaka and Laurienti, 2010).
We found evidence for truncated power-law degree distributions in functional brain networks across all MEG frequency bands in both health and schizophrenia, with the exception of healthy beta band (Figure 5, Table 1). This finding is broadly consistent with previous reports on the topic: One study reported that truncated power-law degree distributions in healthy functional networks were preserved across MEG frequency scales (Bassett et al., 2006). Other studies have confirmed the existence of truncated power-law scaling for both healthy controls and patients in both structural (Bassett et al., 2008) and functional networks (Lynall et al., 2010). However, our study provides unique evidence, although not the first that node degrees of functional brain networks can be best-fitted to truncated power-laws at the voxel-based level. One potential explanation for this discrepancy is that we used SAM prior to the construction of our functional networks, and this preprocessing procedure might have affected the form of the degree distribution differently than studies that did not use source localization techniques (Bullmore and Sporns, 2009).
The current study, along with previous studies, suggests that functional brain networks allow for the emergence of hubs. The presence of highly connected hubs in the default network may be of central importance in intelligence and consciousness (Van den Heuvel et al., 2009; Douw et al., 2011; Soddu et al., 2011). With that said, however, truncated power-law distributions often represent networks that are physically restrained so that the development of very highly connected hubs is less probable than a power-law would anticipate (Amaral et al., 2000; Strogatz, 2001). Therefore, our observation of truncated power-law scaling in networks could likewise reflect the metabolic constraints of maintaining long-range brain connections (Xulvi-Brunet and Sokolov, 2002), or an upper-limit on the number of connections that brain regions can accommodate (Albert and Barabasi, 2000).
Post-hoc Analysis: 3D-Mean Functional Connectivity Maps
We determined the spatial location of potential brain hubs, defined as voxels holding the largest mean functional connectivity, implied to be present in the networks since their degrees decayed as exponentially truncated power laws. Healthy controls and patients showed similar functional hub regions: The most notable regions included the bilateral culmen and cerebellar tonsil in the θ/α bands, the bilateral PCC in the β/γ bands, and the bilateral thalamus across all bands, and to a lesser extent, bilateral cingulate gyrus, caudate, and parahippocampal gyrus (Table 2).
Surprisingly, we did not find the precuneus to serve as a hub, even though it has been regularly reported as a functional and structural resting-state brain hub (Achard et al., 2006; Hagmann et al., 2008; Iturria-Medina et al., 2008; Van den Heuvel et al., 2008; Bullmore and Sporns, 2009; Gong et al., 2009), and accounted for the most resting γ SAM power in our previous resting activation study for all subjects (Rutter et al., 2009).
Despite that, many regions overlap with hubs from previous reports: One group first analyzed healthy brain networks using low frequency oscillations of BOLD fMRI time series, and pinpointed the bilateral posterior cingulate and thalamus to be major functional resting hubs (Van den Heuvel et al., 2008), then analyzed healthy brain networks using DTI, and found bilateral caudate, cingulate, precuneus, and thalamus to be major structural hubs (Van den Heuvel et al., 2010).
More recently, another group thoroughly investigated the variability of resting MRI functional connectivity hubs using an impressive sample size of about 1000 subjects across various institutions. They employed a density mapping technique that does not require a priori hypotheses of preselected seed regions, and found that, for both long- and short-range connectivity assessments, the strongest hub consisted of the ventral precuneus and posterior cingulate, and was functionally connected to the cerebellum and thalamus, two major subcortical hubs also found in the current study. Additionally, the authors noted that the most connected hub was functionally linked to the default mode network, and proposed that their findings may be consistent with studies reporting aberrant resting functional connectivity in schizophrenia considering that the related hub regions are known to heavily impact normal and altered states of consciousness (Tomasi and Volkow, 2011a,b).
Post-hoc Analysis: 3D-Ttest Functional Connectivity Maps
We produced 3D-Ttest maps of mean functional connectivity to determine whether this metric, in contrast to graph theoretical parameters, would distinguish healthy controls and patients at rest. The resulting ROIs from the 3D-Ttests (Table 3) were broadly similar to the three γ ROIs we isolated in our SAM power 3D-Ttests from our first study, in which patients and unaffected siblings showed reduced SAM power in the posterior medial parietal cortex, and unaffected siblings showed increased SAM power in the superior, medial, and middle frontal gyri (Rutter et al., 2009).
We found that mean functional connectivity was reduced in patients across the posterior medial parietal cortex (θ, β, and γ), and increased in patients across superior, medial, and middle frontal gyri (θ and α) (Figure 6, Table 3). Furthermore, our γ cross-regional analysis complemented these results, and patients showed pronounced interregional connectivity decrease in the medial parietal cortex seed regions, as well as interregional connectivity increase in the frontal gyri seed regions, with the exception of the middle frontal gyrus (Figure 7).
Although these results must be viewed with considerable caution, as none survived statistical correction, we suggest that the previous statistically-significant differences in resting γ SAM power in the same subjects may in the future be robust enough to be discerned with improved functional connectivity measurements. It should be noted that our findings should be viewed with caution for the additional reason that we performed many comparisons in this study as a whole, thus increasing the overall potential for multiple comparison errors. Overall then, it may be ideal to view our study as one that did not address absolute significance between patient populations, but one that did provide evidence that magnitude squared coherence may not be quite strong enough to differentiate functional networks.
With that said, in both our previous and current study, the brain regions most dissimilar between subject populations coincided at least to some degree with components of the default mode network, a brain system that was implicated after multiple neuroimaging approaches converged on what has been proposed as anatomical correlates of the resting state (Buckner et al., 2008). In its strictest definition, the default network consists of the medial prefrontal cortex (MPFC) extending to the ventral anterior cingulate, the PCC extending to the precuneus, and the lateral parietal cortex (Buckner et al., 2008). These brain regions, in addition to being consistently coupled in normal subjects from the so-called resting state, have also been implicated in various states of introspective mentation, including autobiographical memory, theory of mind, and moral decision making, as well as various states of spontaneous cognition, including momentary lapses in attention, and several of these processes may be altered in people with schizophrenia (Buckner et al., 2008).
In line with this, abnormal effects on gray and white matter have been extensively reported in schizophrenia, and the strongest effects have been found in frontal and parietal regions that overlap with the default mode network (Van den Heuvel and Hulshoff Pol, 2010). Likewise, studies have consistently observed aberrant resting functional connectivity in schizophrenia between the medial frontal cortex and the precuneus, key regions of the default mode network (Van den Heuvel and Hulshoff Pol, 2010). Unfortunately, most of these findings, including the anatomical findings with MRI, are also associated with antipsychotic drug treatment, making differences observed between patients and controls based on these various neuroimaging measurements very difficult to interpret.
Moreover, while it has been uniformly reported that default network brain regions are aberrantly coupled in patients during so-called rest and task, reports have been less consistent regarding how this aberrancy is characterized across these brain regions. Several studies have suggested an overactive connectivity between brain regions comprising the default network in schizophrenia (Zhou et al., 2007), and in some cases this increased connectivity has been correlated to worsened task performance in patients (Harrison et al., 2007), and increased severity of disease symptoms in patients (Garrity et al., 2007) and first-degree relatives (Whitfield-Gabrieli et al., 2009). In contrast, other studies have reported evidence of decreased connectivity between default brain regions in patients (Lui et al., 2010; Rotarska-Jagila et al., 2010), and in some cases this reduced connectivity has been correlated to increased disease symptoms in patients (Bluhm et al., 2007) and people at genetic high risk for schizophrenia (Jang et al., 2011).
Along the same lines, while some resting analyses of schizophrenia have presented evidence of hypoconnectivity in the frontal regions of the default network, other resting studies have reported hyperconnectivity in the same regions, which may be in direct opposition to the hypofrontality hypothesis in schizophrenia.
Authors have proposed that the inconsistency of these findings may be related to neuroimaging modality differences; task design differences, especially regarding pure resting scans vs. resting periods extracted from task performance, as these situations may affect the likelihood that subjects can reach an appropriate level of internal thought; data analysis differences, especially regarding whether or not ROI seeds are preselected; and participant selection differences, especially regarding whether or not various subtypes or stages of schizophrenia may experience the resting condition differently (Camchong et al., 2011; Jang et al., 2011; Repovs et al., 2011).
Other authors have reported data in which patients showed significantly reduced power in default mode low frequency bins, but significantly increased power in default mode high frequency bins, implying that frequency selection may not only affect, but may also reverse, significant default mode differences between health and disease (Garrity et al., 2007). And some researchers reviewing functional connectivity studies of resting schizophrenia have suggested that hyperconnectivity along one pathway may not necessarily be inconsistent with disconnection along a second pathway, which may have been affected by the altered variance detected in the first pathway, and hence seemingly antithetical relationships may be related (Hoffman and Hampson, 2012).
Taken together, these findings may still substantiate dysconnectivity models of schizophrenia, only now implying that connection alterations are manifested by both quantitative and qualitative changes that vary across the default network, as opposed to any strict global increase or decrease of functional connectivity in resting schizophrenia (Woodward et al., 2011). One recent qualitative change has included the expansion of the default mode network to include less-traditional brain regions that also consistently show differences between resting health and schizophrenia, most notably the inferior frontal gyrus and lateral temporal region, both of which showed trends of aberrancy in our current study (Table 3, Figure 7) (Mannell et al., 2010; Salvador et al., 2010; Skudlarski et al., 2010; Woodward et al., 2011).
Moreover, several studies have detected aberrant cerebellar functional connectivity in resting schizophrenia (Honey et al., 2005; Kim et al., 2008; Becerril et al., 2011). Some authors have noted that the majority of these reports indicate reduced connectivity between the cerebellum and other brain areas, especially the inferior frontal gyrus and thalamus (Collin et al., 2011; Petterson-Yeo et al., 2011). Disruption of this cortical-subcortical-cerebellar circuit in resting schizophrenia has been postulated to relate to impairment in cognitive adaption and coordination in the disease (Bluhm et al., 2007; Collin et al., 2011), and has been found to correlate to more severe disorganization symptoms and less efficient cognitive performance among patients (Repovs et al., 2011). Interestingly, we found that functional connectivity of the cerebellum, as well as the culmen, was reduced in the schizophrenia cohort across all frequencies (Table 3).
In a broader context, the inconsistencies in the literature likely reflect a more generic problem in the interpretation of resting studies in patients with complex behavioral disorders. Since in vivo physiologic data presumably reflect the mental activity of the subject, which is what makes it of interest, the assumption that patients with schizophrenia will experience the laboratory environment, whether it be fMRI or MEG, with the same equanimity and “restfulness” as paid, usually experienced volunteers is highly suspect. Thus, interpreting differences in correlated activity patterns during “rest” across subject groups as inherently about the illness biology rather than the immediate illness state may not be justified.
Future Avenues
While evidence for functional connectivity stability in resting fMRI of normal volunteers has been accumulating, the stability of functional connectivity networks using resting MEG has not been as well-established (Jin et al., 2011). Recently, authors have argued that the most logical approach may be to search for consistent results across studies regardless of the technique used for network construction and analysis (Stam and van Straaten, 2012). And several newer studies comparing health and disease by using the MEG resting condition have applied multiple approaches to the same data as a means to determine the reproducibility and robustness of the two results: One study used both magnitude squared coherence and mutual information when comparing health and Alzheimer's (Alonso et al., 2010), and another study used both synchronization likelihood and phase coherence when comparing health and multiple sclerosis (Schoonheim et al., 2011). Other groups are also proposing new methods that may be valuable for inferring functional connectivity, and are evaluating their algorithms using both resting state and naturalistic stimulation MEG data from healthy subjects (Ramkumar et al., 2011), and some groups are developing improved solutions of the inverse problems that may ensure higher signal-to-noise ratios of source-localized functional connectivity MEG (Tanaka et al., 2011).
Previous functional connectivity comparisons of resting health and schizophrenia have produced divergent results, and the reasons are likely numerous. Nonetheless, the majority of studies have produced remarkably convergent results in terms of the brain areas themselves that may be the most differentiated between health and schizophrenia during rest, including traditional default network regions (such as the MPFC, PCC, and precuneus), as well as the inferior frontal gyrus, temporal regions, and the cerebellum. Our study provides evidence that less-established MEG approaches to functional connectivity may also detect trends that these same brain regions may be the most aberrant between subject populations at rest.
However, the current study did not produce statistically-significant differences between subject populations. This brings into question whether or not the graphs we derived from MEG are meaningful in relation to brain processes, and particularly whether or not they are underpowered due to the choice of coherence as a measure of functional connectivity in addition to the small number of participants. At this time, it remains difficult to answer this question as MEG source-level connectivity measures may introduce powerful enough artifacts to render the graphs irrelevant (Schoffelen and Gross, 2009), or they may be consistent with whole-brain connectivity studies that have demonstrated consistency between fMRI and MEG results (de Pasquale et al., 2010; Brookes et al., 2011a), thereby providing grounds that these graphs may be relevant to brain processes.
If newer approaches introduced improved capacities to differentiate between population groups, there are several future avenues we could pursue in continuation of the current study. One option would be to analyze functional connectivity networks of unaffected siblings as potential intermediate phenotypes, which was an option available to us in our original resting study after we did determine significant differences between health and schizophrenia (Rutter et al., 2009).
Additionally, this study used coherence to quantify oscillatory interdependencies between brain areas, which did not allow us direct inference about the directionality of information flow between brain regions. Another option would therefore be to employ asymmetrical measures, such as Granger and/or partial directed coherence, to construct effective connectivity models and determine whether healthy controls and patients showed different causal association resting measurements. Moreover, although our selection of coherence thresholds is consistent with one of the more common procedures in the literature, our thresholds could instead be determined by parameterless approaches derived from adaptive neighborhood algorithms (Moujahid et al., 2012).
There were several other limitations in the current study, and more detail about these shortcomings can be found in our original report as we used the same datasets (Rutter et al., 2009). It could be beneficial in the future to determine whether and how the resting differences we found between health and schizophrenia could be affected if no patients were on medications, if patient populations were separated by clinical subgroups, and if anxiety ratings and other behavior parameters were subjectively rated by participants before and after the scanning session. However, even with these factors controlled, it may still prove difficult to interpret how these resting differences may be separate from immediate mental states of the subjects (Morcom and Fletcher, 2007).
Conflict of Interest Statement
The authors declare that the research was conducted in the absence of any commercial or financial relationships that could be construed as a potential conflict of interest.
Acknowledgments
This work used the super-computing capabilities of the Biowulf Linux parallel processing cluster at the National Institutes of Health, Bethesda, MD (http://biowulf.nih.gov). This study was supported by the Intramural Research Program of the NIMH (protocol 99-M-0172). The authors would like to thank participants and their families for volunteering their time, the CBDB Sibling Study members for managing the recruitment procedures needed for this project, Judy Mitchell-Francis and Steven Kornweiss for assistance with data acquisition, as well as Yong Liu from the LIAMA Center for Computational Medicine, National Laboratory of Pattern Recognition, Institute of Automation, Chinese Academy of Sciences for sharing best-fitting degree distribution software.
References
Achard, S., and Bullmore, E. (2007). Efficiency and cost of economical brain functional networks. PLoS Comput. Biol. 3:e17. doi: 10.1371/journal.pcbi.0030017
Achard, S., Salvador, R., Whitcher, B., Suckling, J., and Bullmore, E. (2006). A resilient, low-frequency, small world human brain functional network with highly connected association cortical hubs. J. Neurosci. 26, 63–72. doi: 10.1523/JNEUROSCI.3874-05.2006
Aine, C. J., Sanfratello, L., Ranken, D., Best, E., MacArthur, J. A., Wallace, T., et al. (2011). MEG-SIM: a web portal for testing MEG analysis methods using realistic simulated and empirical data. Neuroinformatics 10, 141–158. doi: 10.1007/s12021-011-9132-z
Albert, R., and Barabasi, A. L. (2000). Topology of evolving networks: local events and universality. Phys. Rev. Lett. 85, 5234–5237. doi: 10.1103/PhysRevLett.85.5234
Albert, R., Jeong, H., and Barabasi, A. L. (2000). Error and attack tolerance of complex networks. Nature 406, 378–382. doi: 10.1038/35019019
Alexander-Bloch, A. F., Vertes, P. E., Stidd, R., Lalonde, F., Clasen, L., Rapoport, J., et al. (2012). The anatomical distance of functional connections predicts brain network topology in health and schizophrenia. Cereb. Cortex 23, 127–138. doi: 10.1093/cercor/bhr388
Alonso, J. F., Poza, J., Mananas, M. A., Romero, S., Fernandez, A., and Hornero, R. (2010). MEG connectivity analysis in patients with Alzheimer's disease using cross mutual information and spectral coherence. Ann. Biomed. Eng. 39, 524–536. doi: 10.1007/s10439-010-0155-7
Amaral, L. A. N., Scala, A., Barthelemy, M., and Stanley, H. E. (2000). Classes of small world networks. Proc. Natl. Acad. Sci. U.S.A. 97, 11149–11152. doi: 10.1073/pnas.200327197
Antiqueira, L., Rodrigues, F. A., Van Wijk, B. C., Costa da, L. F., and Daffertshofer, A. (2010). Estimating complex cortical networks via surface recordings – a critical note. Neuroimage 53, 439–449. doi: 10.1016/j.neuroimage.2010.06.018
Averbeck, B. B., and Seo, M. (2008). The statistical neuroanatomy of frontal networks in the macaque. PLoS Comput. Biol. 4:e1000050. doi: 10.1371/journal.pcbi.1000050
Aydore, S., Pantazis, D., and Leahy, R. M. (2013). A note on the phase locking value and its properties. Neuroimage 74, 231–244. doi: 10.1016/j.neuroimage.2013.02.008
Banerjee, A., Pillai, A., and Horwitz, B. (2012). Using large-scale neural models to interpret connectivity measures of cortico-cortical dynamics at millisecond temporal resolution. Front. Syst. Neurosci. 5:102. doi: 10.3389/fnsys.2011.00102
Barabasi, A. L., and Albert, R. (1999). Emergence of scaling in random networks. Science 286, 509–512. doi: 10.1126/science.286.5439.509
Barabasi, A. L., and Oltvai, Z. N. (2004). Network biology: understanding the cell's functional organization. Nat. Rev. Genet. 5, 101–113. doi: 10.1038/nrg1272
Barahona, M., and Pecora, L. M. (2002). Synchronization in small world system. Phys. Rev. Lett. 89:54101. doi: 10.1103/PhysRevLett.89.054101
Bartolomei, F., Bosma, I., Klein, M., Baayen, J. C., Reijneveld, J. C., Postma, T. J., et al. (2006). Disturbed functional connectivity in brain tumour patients: evaluation by graph analysis of synchronization matrices. Clin. Neurophysiol. 117, 2039–2049. doi: 10.1016/j.clinph.2006.05.018
Bassett, D. S., and Bullmore, E. (2006). Small world brain networks. Neuroscientist 12, 512–523. doi: 10.1177/1073858406293182
Bassett, D. S., Bullmore, E. T., Meyer-Lindenberg, A., Apud, J. A., Weinberger, D. R., and Coppola, R. (2009). Cognitive fitness of cost-efficient brain functional networks. Proc. Natl. Acad. Sci. U.S.A. 106, 11747–11752. doi: 10.1073/pnas.0903641106
Bassett, D. S., Bullmore, E., Verchinski, B. A., Mattay, V. S., Weinberger, D. R., and Meyer-Lindenberg, A. (2008). Hierarchical organization of human cortical networks in health and schizophrenia. J. Neurosci. 28, 9239–9248. doi: 10.1523/JNEUROSCI.1929-08.2008
Bassett, D. S., Meyer-Lindenberg, A., Achard, S., Duke, T., and Bullmore, E. (2006). Adaptive reconfiguration of fractal small world human brain functional networks. Proc. Natl. Acad. Sci. U.S.A. 103, 19518–19523. doi: 10.1073/pnas.0606005103
Becerril, K. E., Repovs, G., and Barch, D. M. (2011). Error processing network dynamics in schizophrenia. Neuroimage 54, 1495–1505. doi: 10.1016/j.neuroimage.2010.09.046
Becker, J. T., Bajo, R., Fabrizio, M., Sudre, G., Cuesta, P., Aizenstein, H. J., et al. (2012). Functional connectivity measured with magnetoencephalography identifies persons with HIV disease. Brain Imaging Behav. 6, 366–373. doi: 10.1007/s11682-012-9149-4
Bialonski, S., Horstmann, M. T., and Lehnertz, K. (2010). From brain to earth and climate systems: small-world interaction networks or not? Chaos 20, 013134. doi: 10.1063/1.3360561
Bluhm, R. L., Miller, J., Lanius, R. A., Osuch, E. A., Boksman, K., Neufeld, R. W., et al. (2007). Spontaneous low-frequency fluctuations in the BOLD signal in schizophrenic patients: anomalies in the default network. Schizophr. Bull. 33, 1004–1012. doi: 10.1093/schbul/sbm052
Breakspear, M., and Terry, J. R. (2002). Detection and description of non-linear interdependence in normal multichannel human EEG data. Clin. Neurophysiol. 113, 735–753. doi: 10.1016/S1388-2457(02)00051-2
Brookes, M. J., Hale, J. R., Zumer, J. M., Stevenson, C. M., Francis, S. T., Barnes, G. R., et al. (2011a). Measuring functional connectivity using MEG: methodology and comparison with fcMRI. Neuroimage 56, 1082–1104. doi: 10.1016/j.neuroimage.2011.02.054
Brookes, M. J., Woolrich, M., Luckhoo, H., Price, D., Hale, J. R., Stephenson, M. C., et al. (2011b). Investigating the electrophysiological basis of resting state networks using magnetoencephalography. Proc. Natl. Acad. Sci. U.S.A. 108, 16783–16788. doi: 10.1073/pnas.1112685108
Buckner, R. L., Andrews-Hanna, J. R., and Schacter, D. L. (2008). The brain's default network: anatomy, function, and relevance to disease. Ann. N.Y. Acad. Sci. 1124, 1–38. doi: 10.1196/annals.1440.011
Bullmore, E., and Sporns, O. (2009). Complex brain networks: graph theoretical analysis of structural and functional systems. Nat. Rev. Neurosci. 10, 186–198. doi: 10.1038/nrn2575
Camchong, J., MacDonald, A. W., Bell, C., Mueller, B. A., and Lim, K. O. (2011). Altered functional and anatomical connectivity in schizophrenia. Schizophr. Bull. 37, 640–650. doi: 10.1093/schbul/sbp131
Chklovskii, D. B., Schikorski, T., and Stevens, C. F. (2002). Wiring optimization in cortical circuits. Neuron 34, 341–347. doi: 10.1016/S0896-6273(02)00679-7
Collin, G., Pol, H. E. H., Hajima, S. V., Cahn, W., Kahn, R. S., and van den Heuvel, M. P. (2011). Impaired cerebellar functional connectivity in schizophrenia patients and their healthy siblings. Front. Psychiatry 2:73. doi: 10.3389/fpsyt.2011.00073
Cox, R. W. (1996). AFNI: software for analysis and visualization of functional magnetic resonance neuroimages. Comput. Biomed. Res. 29, 162–173. doi: 10.1006/cbmr.1996.0014
Damoiseaux, J. S., Rombouts, S. A., Barkhof, F., Scheltens, P., Stam, C. J., Smith, S. M., et al. (2006). Consistent resting-state networks across healthy subjects. Proc. Natl. Acad. Sci. U.S.A. 103, 13848–13853. doi: 10.1073/pnas.0601417103
de Hann, W., van der Flier, W. M., Koene, T., Smits, L. L., Scheltens, P., and Stam, C. J. (2011). Disrupted modular brain dynamics reflect cognitive dysfunction in Alzheimer's disease. Neuroimage 59, 3085–3093. doi: 10.1016/j.neuroimage.2011.11.055
de Pasquale, F., Della Penna, S., Snyder, A. Z., Lewis, C., Mantini, D., Marzetti, L., et al. (2010). Temporal dynamics of spontaneous MEG activity in brain networks. Proc. Natl. Acad. Sci. U.S.A. 107, 6040–6045. doi: 10.1073/pnas.0913863107
Douw, L., Schoonheim, M. M., Landi, D., Van der Meer, M. L., Geurts, J. J., Reijneveld, J. C., et al. (2011). Cognition is related to resting-state small-world network topology: an magnetoencephalographic study. Neuroscience 175, 169–177. doi: 10.1016/j.neuroscience.2010.11.039
Durbin, R., and Mitchison, G. (1990). A dimension reduction framework for understanding cortical maps. Nature 343, 644–647. doi: 10.1038/343644a0
Egan, M. F., Goldberg, T. E., Gscheidle, T., Weirich, M., Bigelow, L. B., and Weinberger, D. R. (2000). Relative risk of attention deficits in siblings of patients with schizophrenia. Am. J. Psychiatry 157, 1309–1316. doi: 10.1176/appi.ajp.157.8.1309
Eguiluz, V. M., Chialvo, D. R., Cecchi, G. A., Baliki, M., and Apkarian, A. V. (2005). Scale-free brain functional networks. Phys. Rev. Lett. 94:018102. doi: 10.1103/PhysRevLett.94.018102
Fries, P. (2005). A mechanism for cognitive dynamics: neuronal communication through neuronal coherence. Trends Cogn. Sci. 9, 474–480. doi: 10.1016/j.tics.2005.08.011
Garrity, A. G., Pearlson, G. D., McKiernan, K., Lloyd, D., Kiehl, K. A., and Calhoun, V. D. (2007). Aberrant “default mode” functional connectivity in schizophrenia. Am. J. Psychiatry 164, 450–457. doi: 10.1176/appi.ajp.164.3.450
Gong, G., He, Y., Concha, L., Lebel, C., Gross, D. W., Evans, A. C., et al. (2009). Mapping anatomical connectivity patterns of human cerebral cortex using in vivo diffusion tensor imaging tractography. Cereb. Cortex 19, 524–536. doi: 10.1093/cercor/bhn102
Grigorov, M. G. (2005). Global properties of biological networks. Drug Discov. Today 10, 365–372. doi: 10.1016/S1359-6446(05)03369-6
Guggisberg, A. G., Honma, S. M., Findlay, A. M., Dalal, S. S., Kirsch, H. E., Berger, M. S., et al. (2008). Mapping functional connectivity in patients with brain lesions. Ann. Neurol. 63, 193–203. doi: 10.1002/ana.21224
Guimera, R., Mossa, S., Turtschi, A., and Amaral, L. A. (2005). The worldwide air transportation network: anomalous centrality, community structure and cities' global roles. Proc. Natl. Acad. Sci. U.S.A. 102, 7794–7799. doi: 10.1073/pnas.0407994102
Hadjipapas, A., Hillebrand, A., Hilliday, I. E., Singh, K. D., and Barnes, G. R. (2005). Assessing interactions of linear and nonlinear neuronal sources using MEG beamformers: a proof of concept. Clin. Neurophysiol. 116, 1300–1313. doi: 10.1016/j.clinph.2005.01.014
Hagmann, P., Cammoun, L., Gigandet, X., Meuli, R., Honey, C. J., Wedeen, V. J., et al. (2008). Mapping the structural core of human cerebral cortex. PLoS Biol. 6:e159. doi: 10.1371/journal.pbio.0060159
Harrison, B. J., Yucel, M., Pujol, J., and Pantelis, C. (2007). Task-induced deactivation of midline cortical regions in schizophrenia assessed with fMRI. Schizophr. Res. 91, 82–86. doi: 10.1016/j.schres.2006.12.027
Hayasaka, S., and Laurienti, P. J. (2010). Comparison of characteristics between region- and voxel- based network analyses in resting-state fMRI data. Neuroimage 50, 499–508. doi: 10.1016/j.neuroimage.2009.12.051
He, Y., Chen, Z. J., and Evans, A. C. (2006). Small world anatomical networks in the human brain revealed by cortical thickness from MRI. Cereb. Cortex 17, 2407–2419. doi: 10.1093/cercor/bhl149
He, Y., and Evans, A. (2010). Graph theoretical modeling of brain connectivity. Curr. Opin. Neurol. 23, 341–350.
Hellwig, B. (2000). A quantitative analysis of the local connectivity between pyramidal neurons in layers 2/3 of the rat vixual cortex. Biol. Cybern. 82, 111–121. doi: 10.1007/PL00007964
Hillebrand, A., Barnes, G. R., Bosboom, J. L., Berendse, H. W., and Stam, C. J. (2011). Frequency-dependent functional connectivity within resting-state networks: an atlas-based MEG beamformer solution. Neuroimage 59, 3909–3921. doi: 10.1016/j.neuroimage.2011.11.005
Hinkley, L. B., Owen, J. P., Fisher, M., Findlay, A. M., Vinogradov, S., and Nagarajan, S. S. (2010). Cognitive impairments in schizophrenia as assessed through activation and connectivity measures of magnetoencephalography (MEG) data. Front. Hum. Neurosci. 3:73. doi: 10.3389/neuro.09.073.2009
Hoffman, R. E., and Hampson, M. (2012). Functional connectivity studies of patients with auditory verbal hallucinations. Front. Hum. Neurosci. 6:6. doi: 10.3389/fnhum.2012.00006
Honey, G. D., Pomarol-Clotet, E., Corlett, P. R., Honey, R. A. E., McKenna, P. J., Bullmore, E. T., et al. (2005). Functional dysconnectivity in schizophrenia associated with attentional modulation of motor function. Brain 128, 2597–2611. doi: 10.1093/brain/awh632
Hui, H. B., Pantazis, D., Bressler, S. L., and Leahy, R. M. (2010). Identifying true cortical interactions in MEG using the nulling beamformer. Neuroimage 49, 3161–3174. doi: 10.1016/j.neuroimage.2009.10.078
Humphries, M. D., Gurney, K., and Prescott, T. J. (2006). The brainstem reticular formation is a small world, not scale-free, network. Proc. Biol. Sci. 273, 503–511. doi: 10.1098/rspb.2005.3354
Humphries, M. D., Gurney, K., and Prescott, T. J. (2007). Is there a brainstem substrate for action selection? Philos. Trans. R. Soc. Lond. B Biol. Sci. 362, 1627–1639. doi: 10.1098/rstb.2007.2057
Iturria-Medina, Y., Sotero, R. C., Canales-Rodriguez, E. J., Aleman-Gomez, Y., and Melie-Garcia, L. (2008). Studying the human brain anatomical network via diffusion-weighted MRI and graph theory. Neuroimage 40, 1064–1076. doi: 10.1016/j.neuroimage.2007.10.060
Jalili, M., and Knyazeva, M. G. (2011). EEG-based functional networks in schizophrenia. Comput. Biol. Med. 41, 1178–1186. doi: 10.1016/j.compbiomed.2011.05.004
Jang, J. H., Jung, W. H., Choi, J.-S., Choi, C.-H., Kang, D.-H., Shin, N. Y., et al. (2011). Reduced prefrontal functional connectivity in the default mode network is related to greater psychopathology in subjects with high genetic loading for schizophrenia. Schizophr. Res. 127, 58–65. doi: 10.1016/j.schres.2010.12.022
Jin, S.-H., Seol, J., Kim, J. S., and Chung, C. K. (2011). How reliable are the functional connectivity networks of MEG in resting states? J. Neurophysiol. 106, 2888–2895. doi: 10.1152/jn.00335.2011
Kim, D., Burge, J., Lane, T., Pearlson, G. D., Kiehl, K. A., and Calhoun, V. D. (2008). Hybrid ICA-Bayesian network approach reveals distinct effective connectivity differences in schizophrenia. Neuroimage 42, 1560–1568. doi: 10.1016/j.neuroimage.2008.05.065
Lago-Fernandez, L. F., Huerta, R., Corbacho, F., and Siguenza, J. A. (2000). Fast response and temporal coherent oscillations in small world networks. Phys. Rev. Lett. 84, 2758–2761. doi: 10.1103/PhysRevLett.84.2758
Latora, V., and Marchiori, M. (2001). Efficient behavior of small world networks. Phys. Rev. Lett. 87, 198701. doi: 10.1103/PhysRevLett.87.198701
Latora, V., and Marchiori, M. (2003). Economic small world behavior in weighted networks. Eur. Phys. J. B 32, 249–263. doi: 10.1140/epjb/e2003-00095-5
Le van Quyen, M. (2003). Disentangling the dynamic core: a research program for a neurodynamics at the large scale. Biol. Res. 36, 67–88. doi: 10.4067/S0716-97602003000100006
Liu, Y., Liang, M., Zhou, Y., He, Y., Hao, Y., Song, M., et al. (2008). Disrupted small world networks in schizophrenia. Brain 131, 945–961. doi: 10.1093/brain/awn018
Lui, S., Li, T., Deng, W., Jiang, L., Wu, Q., Tang, H., et al. (2010). Short-term effects of antipsychotic treatment on cerebral function in drug-naive first-episode schizophrenia revealed by “resting state” functional magnetic resonance imaging. Arch. Gen. Psychiatry 67, 783–792. doi: 10.1001/archgenpsychiatry.2010.84
Lynall, M. E., Bassett, D. S., Kerwin, R., McKenna, P. J., Kitzbichler, M., Muller, U., et al. (2010). Functional connectivity and brain networks in schizophrenia. J. Neurosci. 30, 9477–9487.
Mannell, M. V., Franco, A. R., Calhoun, V. D., Canive, J. M., Thoma, R. J., and Mayer, A. R. (2010). Resting state and task-induced deactivation: a methodological comparison in patients with schizophrenia and healthy controls. Hum. Brain Mapp. 31, 424–437.
Masuda, N., and Aihara, K. (2004). Global and local synchrony of coupled neurons in small world networks. Biol. Cybern. 90, 302–309. doi: 10.1007/s00422-004-0471-9
Mathias, N., and Gopal, V. (2001). Small worlds: how and why. Phys. Rev. E Stat. Nonlin. Soft Matter Phys. 63:021117. doi: 10.1103/PhysRevE.63.021117
Micheloyannis, S., Pachou, E., Stam, C. J., Breakspear, M., Bitsios, P., Vourkas, M., et al. (2006). Small world networks and disturbed functional connectivity in schizophrenia. Schizophr. Res. 87, 60–66. doi: 10.1016/j.schres.2006.06.028
Moratti, S., Saugar, C., and Strange, B. A. (2011). Prefrontal-occipitoparietal coupling underlies late latency human neuronal responses to emotion. J. Neurosci. 31, 17278–17286. doi: 10.1523/JNEUROSCI.2917-11.2011
Morcom, A. M., and Fletcher, P. C. (2007). Does the brain have a baseline? Why we should be resisting a rest. Neuroimage 37, 1073–1082. doi: 10.1016/j.neuroimage.2006.09.013
Moujahid, A., d'Anjou, A., and Cases, B. (2012). Community structure in real-world networks from a non-parametrical synchronization-based dynamical approach. Chaos Solitons Fractals 45, 1171–1179. doi: 10.1016/j.chaos.2012.06.007
Oldfield, R. C. (1971). The assessment and analysis of handedness: the Edinburgh handedness inventory. Neuropsychologia 9, 97–113. doi: 10.1016/0028-3932(71)90067-4
Palva, S., Monto, S., and Palva, J. M. (2010). Graph properties of synchronized cortical networks during visual working memory maintenance. Neuroimage 49, 3257–3268. doi: 10.1016/j.neuroimage.2009.11.031
Petterson-Yeo, W., Allen, P., Benetti, S., McGuire, P., and Mechelli, A. (2011). Dysconnectivity in schizophrenia: where are we now? Neurosci. Biobehav. Rev. 35, 1110–1124. doi: 10.1016/j.neubiorev.2010.11.004
Ponten, S. C., Bartolomei, F., and Stam, C. J. (2007). Small world networks and epilepsy: graph theoretical analysis of intracerebrally recorded mesial temporal lobe seizures. Clin. Neurophysiol. 118, 918–927. doi: 10.1016/j.clinph.2006.12.002
Ponten, S. C., Douw, L., Bartolomei, F., Reijneveld, J. C., and Stam, C. J. (2009). Indications for network regularization during absence seizures: weighted and unweighted graph theoretical analyses. Exp. Neurol. 217, 197–204. doi: 10.1016/j.expneurol.2009.02.001
Ramkumar, P., Parkkonen, L., Hari, R., and Hyvarinen, A. (2011). Characterization of neuromagnetic brain rhythms over time scales of minutes using spatial independent component analysis. Hum. Brain Mapp. 33, 1648–1662. doi: 10.1002/hbm.21303
Reijneveld, J. C., Ponten, S. C., Berendse, H. W., and Stam, C. J. (2007). The application of graph theoretical analysis to complex networks in the brain. Clin. Neurophysiol. 118, 2317–2331. doi: 10.1016/j.clinph.2007.08.010
Repovs, G., Csernansky, J. G., and Barch, D. M. (2011). Brain network connectivity in individuals with schizophrenia and their siblings. Biol. Psychiatry 69, 967–973. doi: 10.1016/j.biopsych.2010.11.009
Rotarska-Jagila, A., van de Ven, V., Oertel-Knöchel, V., Uhlhaas, P. J., Vogeley, K., and Linden, D. E. (2010). Resting-state functional network correlates of psychotic symptoms in schizophrenia. Schizophr. Res. 117, 21–30. doi: 10.1016/j.schres.2010.01.001
Rubinov, M., Knock, S. A., Stam, C. J., Micheloyannis, S., Harris, A. W. F., Willliams, L. M., et al. (2009). Small world properties of nonlinear brain activity in schizophrenia. Hum. Brain Mapp. 30, 403–416. doi: 10.1002/hbm.20517
Rutter, L., Carver, F. W., Holroyd, T., Nadar, S. R., Mitchell-Francis, J., Apud, J., et al. (2009). Magnetoencephalographic gamma power reduction in patients with schizophrenia during resting condition. Hum. Brain Mapp. 30, 3254–3264. doi: 10.1002/hbm.20746
Sakkalis, V., Oikonomou, T., Pachou, E., Tollis, I., Micheloyannis, S., and Zervakis, M. (2006). “Time-significant wavelet coherence for the evaluation of schizophrenic brain activity using a graph theory approach,” Proceedings of the 28th IEEE EMBS Annual International Conference (New York, NY).
Salvador, R., Sarro, S., Gomar, J. J., Ortiz-Gil, J., Vila, F., Capdevila, A., et al. (2010). Overall brain connectivity maps show cortico-subcortical abnormalities in schizophrenia. Hum. Brain Mapp. 31, 2003–2014. doi: 10.1002/hbm.20993
Salvador, R., Suckling, J., Coleman, M. R., Pickard, J. D., Menon, D., and Bullmore, E. (2005). Neurophysiological architecture of functional magnetic resonance images of human brain. Cereb. Cortex 15, 1332–1342. doi: 10.1093/cercor/bhi016
Schoffelen, J. M., and Gross, J. (2009). Source connectivity analysis with MEG and EEG. Hum. Brain Mapp. 30, 1857–1865. doi: 10.1002/hbm.20745
Schoonheim, M. M., Geurts, J. J. G., Landi, D., Douw, L., van der Meer, M. L., Vrenken, H., et al. (2011). Functional connectivity changes in multiple sclerosis patients: a graph analytical study of MEG resting state data. Hum. Brain Mapp. 34, 52–61. doi: 10.1002/hbm.21424
Sekihara, K., Nagarajan, S. S., Poeppel, D., Marantz, A., and Miyashita, Y. (2001). Reconstructing spatio-temporal activities of neural sources using an MEG vector beamformer technique. IEEE Trans. Biomed. Eng. 48, 760–771. doi: 10.1109/10.930901
Simard, D., Nadeau, I., and Kroger, H. (2005). Fastest learning in small world neural networks. Phys. Lett. A 336, 8–15. doi: 10.1016/j.physleta.2004.12.078
Singer, W. (1999). Neuronal synchrony: a versatile code for the definition of relations? Neuron 24, 111–125. doi: 10.1016/S0896-6273(00)80821-1
Skudlarski, P., Jagannathan, K., Anderson, K., Stevens, M. C., Calhoun, V. D., Skudlarska, B. A., et al. (2010). Brain connectivity is not only lower but different in schizophrenia: a combined anatomical and functional approach. Biol. Psychiatry 68, 61–69. doi: 10.1016/j.biopsych.2010.03.035
Soddu, A., Vanhaudenhuyse, A., Bahri, M. A., Bruno, M. A., Boly, M., Demertzi, A., et al. (2011). Identifying the default-mode component in spatial IC analyses of patients with disorders of consciousness. Hum. Brain Mapp. 33, 778–796. doi: 10.1002/hbm.21249
Sporns, O. (2011). The human connectome: a complex network. Ann. N.Y. Acad. Sci. 1224, 109–125. doi: 10.1111/j.1749-6632.2010.05888.x
Sporns, O., Tononi, G., and Edelman, G. M. (2000). Theoretical neuroanatomy: relating anatomical and functional connectivity in graphs and cortical connection matrices. Cereb. Cortex 10, 127–141. doi: 10.1093/cercor/10.2.127
Sporns, O., and Zwi, J. D. (2004). The small world of the cerebral cortex. Neuroinformatics 2, 145–162. doi: 10.1385/NI:2:2:145
Stam, C. J. (2004). Functional connectivity patterns of human magnetoencephalographic recordings: a 'small world' network? Neurosci. Lett. 335, 25–28. doi: 10.1016/j.neulet.2003.10.063
Stam, C. J. (2010). Characterization of anatomical and functional connectivity in the brain: a complex networks perspective. Int. J. Psychophysiol. 77, 186–194. doi: 10.1016/j.ijpsycho.2010.06.024
Stam, C. J., de Haan, W., Daffertshofer, A., Jones, B. F., Manshanden, I., van Cappellen van Walsum, A. M., et al. (2009). Graph theoretical analysis of magnetoencephalographic functional connectivity in Alzheimer's disease. Brain 132, 213–224. doi: 10.1093/brain/awn262
Stam, C. J., Jones, B. F., Nolte, G., Breakspear, M., and Scheltens, P. (2007a). Small world networks and functional connectivity in Alzheimer's disease. Cereb. Cortex 17, 92–99. doi: 10.1093/cercor/bhj127
Stam, C. J., Nolte, G., and Daffertshofer, A. (2007b). Phase lag index: assessment of functional connectivity from multi channel EEG and MEG with diminished bias from common sources. Hum. Brain Mapp. 28, 1178–1193. doi: 10.1002/hbm.20346
Stam, C. J., and Reijneveld, J. C. (2007). Graph theoretical analysis of complex networks in the brain. Nonlinear Biomed. Phys. 1, 3. doi: 10.1186/1753–4631-1-3
Stam, C. J., and van Straaten, E. C. W. (2012). The organization of physiological brain networks. Clin. Neurophysiol. 123, 1067–1087. doi: 10.1016/j.clinph.2012.01.011
Tanaka, H., Hayashida, Y., Igasaki, T., and Murayama, N. (2011). “A new method for localizing the sources of correlated cross-frequency oscillations in human brains,” in 33rd Annual International Conference of the IEEE EMBS (Boston MA).
Tomasi, D., and Volkow, N. D. (2011a). Functional connectivity hubs in the human brain. Neuroimage 57, 908–917. doi: 10.1016/j.neuroimage.2011.05.024
Tomasi, D., and Volkow, N. D. (2011b). Association between functional connectivity hubs and brain networks. Cereb. Cortex 21, 2003–2013. doi: 10.1093/cercor/bhq268
Tononi, G., Edelman, G. M., and Sporns, O. (1998). Complexity and coherency: integrating information in the brain. Trends Cogn. Sci. 2, 474–484. doi: 10.1016/S1364-6613(98)01259-5
Vakorin, V. A., Misic, B., Krakovska, O., and McIntosh, A. R. (2011). Empirical and theoretical aspects of generation and transfer of information in neuromagnetic source network. Front. Syst. Neurosci. 5:96. doi: 10.3389/fnsys.2011.00096
Vakorin, V. A., Ross, B., Krakovska, O. A., Bardouille, T., Cheyne, D., and McIntosh, A. R. (2010). Complexity analysis of the neuromagnetic somatosensory steady-state response. Neuroimage 51, 83–90. doi: 10.1016/j.neuroimage.2010.01.100
Van den Heuvel, M. P., and Hulshoff Pol, H. E. (2010). Exploring the brain network: a review on resting-state fMRI functional connectivity. Eur. Neuropsychopharmacol. 20, 519–534. doi: 10.1016/j.euroneuro.2010.03.008
Van den Heuvel, M. P., Mandl, R. C., Stam, C. J., Kahn, R. S., and Hulshoff Pol, H. E. (2010). Aberrant frontal and temporal complex network structure in schizophrenia: a graph theoretical analysis. J. Neurosci. 30, 15915–15926. doi: 10.1523/JNEUROSCI.2874-10.2010
Van den Heuvel, M. P., Stam, C. J., Boersma, M., and Hulshoff Pol, H. E. (2008). Small world and scale-free organization of voxel-based resting-state functional connectivity in the human brain. Neuroimage 43, 528–539. doi: 10.1016/j.neuroimage.2008.08.010
Van den Heuvel, M. P., Stam, C. J., Kahn, R. S., and Hulshoff Pol, H. E. (2009). Efficiency of functional brain networks and intellectual performance. J. Neurosci. 29, 7619–7624. doi: 10.1523/JNEUROSCI.1443-09.2009
Varela, F., Lachaux, J.-P., Rodriguez, E., and Martinerie, J. (2001). The brainweb: phase synchronization and large-scale integration. Nat. Rev. Neurosci. 2, 229–239. doi: 10.1038/35067550
Vrba, J., and Robinson, S. E. (2001). Signal processing in magnetoencephalography. Methods 25, 249–271. doi: 10.1006/meth.2001.1238
Watts, D. J. (Ed.). (1999). Small Worlds: The Dynamics of Networks Between Order and Randomness. Princeton: Princeton University Press.
Watts, D. J., and Strogatz, S. H. (1998). Collective dynamics of ‘small world’ networks. Nature 393, 440–442. doi: 10.1038/30918
Whitfield-Gabrieli, S., Thermenos, H. W., Milaovic, S., Tsuang, M. T., Faraone, S. V., McCarley, R. W., et al. (2009). Hyperactivity and hyperconnectivity of the default network in schizophrenia and in first-degree relatives of persons with schizophrenia. Proc. Natl. Acad. Sci. U.S.A. 106, 1279–1284. doi: 10.1073/pnas.0809141106
Wibral, M., Rahm, B., Rieder, M., Lindner, M., Vicente, R., and Kaiser, J. (2011). Transfer entropy in magnetoencephalographic data: quantifying information flow in cortical and cerebellar networks. Prog. Biophys. Mol. Biol. 105, 80–97. doi: 10.1016/j.pbiomolbio.2010.11.006
Woodward, N. D., Rogers, B., and Heckers, S. (2011). Functional resting-state networks are differentially affected in schizophrenia. Schizophr. Res. 130, 86–93. doi: 10.1016/j.schres.2011.03.010
Xie, T., and He, Y. (2012). Mapping the Alzheimer's brain with connectomics. Front. Psychiatry 2:77. doi: 10.3389/fpsyt.2011.00077
Xulvi-Brunet, R., and Sokolov, I. M. (2002). Evolving networks with disadvantaged long-range connections. Phys. Rev. E Stat. Nonlin. Soft Matter Phys. 66, 026118. doi: 10.1103/PhysRevE.66.026118
Yu, S., Huang, D., Singer, W., and Nikolic, D. (2008). A small world of neuronal synchrony. Cereb. Cortex 18, 2891–2901. doi: 10.1093/cercor/bhn047
Yu, Q., Plis, S. M., Erhardt, E. B., Allen, E. A., Sui, J., Kiehl, K. A., et al. (2012). Modular organization of functional network connectivity in healthy controls and patients with schizophrenia during the resting condition. Front. Syst. Neurosci. 5:103. doi: 10.3389/fnsys.2011.00103
Yu, Q., Sui, J., Rachakonda, S., He, H., Gruner, W., Pearlson, G., et al. (2011). Altered topological properties of functional network connectivity in schizophrenia during resting state: a small-world brain network study. PLoS ONE 6:e25423. doi: 10.1371/journal.pone.0025423
Keywords: schizophrenia, small world, magnitude squared coherence, clustering coefficient, path length, exponentially truncated power-law, synthetic aperture magnetometry, default network
Citation: Rutter L, Nadar SR, Holroyd T, Carver FW, Apud J, Weinberger DR and Coppola R (2013) Graph theoretical analysis of resting magnetoencephalographic functional connectivity networks. Front. Comput. Neurosci. 7:93. doi: 10.3389/fncom.2013.00093
Received: 04 January 2013; Accepted: 21 June 2013;
Published online: 12 July 2013.
Edited by:
Hava T. Siegelmann, Rutgers University, USAReviewed by:
Abdelmalik Moujahid, University of the Basque Country UPV/EHU, SpainDimitri Nowicki, Moscow Institute of Physics and Technology, Ukraine
Copyright © 2013 Rutter, Nadar, Holroyd, Carver, Apud, Weinberger and Coppola. This is an open-access article distributed under the terms of the Creative Commons Attribution License, which permits use, distribution and reproduction in other forums, provided the original authors and source are credited and subject to any copyright notices concerning any third-party graphics etc.
*Correspondence: Richard Coppola, National Institute of Mental Health, Building 10-Room 3C119, 10 Center Drive, Bethesda, MD 20892, USA e-mail: coppolar@mail.nih.gov