 Werner L. Popp1,2*
 Lea Richner1,2
 Michael Brogioli2
 Britta Wilms3,4
 Christina M. Spengler3
 Armin E. P. Curt2
 Michelle L. Starkey2,5
 Roger Gassert1
- 1Rehabilitation Engineering Laboratory, Department of Health Sciences and Technology, ETH Zurich, Zurich, Switzerland
- 2Spinal Cord Injury Center, Balgrist University Hospital, Zurich, Switzerland
- 3Exercise Physiology Lab, Department of Health Sciences and Technology, ETH Zurich, Zurich, Switzerland
- 4Department of Internal Medicine I, University of Lübeck, Lübeck, Germany
- 5Department of Clinical Neurosciences & MRC Centre for Stem Cell Biology and Regenerative Medicine, University of Cambridge, Cambridge, United Kingdom
A healthy lifestyle reduces the risk of cardio-vascular disease. As wheelchair-bound individuals with spinal cord injury (SCI) are challenged in their activities, promoting and coaching an active lifestyle is especially relevant. Although there are many commercial activity trackers available for the able-bodied population, including those providing feedback about energy expenditure (EE), activity trackers for the SCI population are largely lacking, or are limited to a small set of activities performed in controlled settings. The aims of the present study were to develop and validate an algorithm based on inertial measurement unit (IMU) data to continuously monitor EE in wheelchair-bound individuals with a SCI, and to establish reference activity values for a healthy lifestyle in this population. For this purpose, EE was measured in 30 subjects each wearing four IMUs during 12 different physical activities, randomly selected from a list of 24 activities of daily living. The proposed algorithm consists of three parts: resting EE estimation based on multi-linear regression, an activity classification using a k-nearest-neighbors algorithm, and EE estimation based on artificial neural networks (ANNs). The mean absolute estimation error for the ANN-based algorithm was 14.4% compared to indirect calorimeter measurements. Based on reference values from the literature and the data collected within this study, we recommend wheeling 3 km per day for a healthy lifestyle in wheelchair-bound SCI individuals. Combining the proposed algorithm with a recommendation for physical activity provides a powerful tool for the promotion of an active lifestyle in the SCI population, thereby reducing the risk for secondary diseases.
Introduction
The life expectancy of individuals with a spinal cord injury (SCI) has increased significantly over the last decades (1). Nowadays, the leading causes of death are not a direct consequence of injury-related complications (sepsis, respiratory or renal complications) but rather related to cardiovascular disease (2, 3). Obesity, hypertension, hyperlipidemia, and diabetes have all been identified as risk factors for cardio-vascular disease, with a higher prevalence in the SCI population (4). Regular physical activity has been associated with a reduction of these risk factors in the able-bodied population, as well as in the SCI population (5–7). Unfortunately, the SCI population is challenged due to their limited choice of activities (8, 9), and there is a great need to promote and coach physical activity (10). One possible approach to promote a more active lifestyle is to provide feedback on daily physical activity and energy expenditure (EE).
Vanhees et al. showed that accelerometers and inertial measurement units (IMUs) can be used as objective assessment tools for physical activity and EE in the able-bodied population (11). Over the past 20 years, different approaches to estimate EE from IMU or accelerometer data have been proposed, ranging from simple linear regression models based on activity counts (AC) (12–14), to complex non-linear regression models based on more advanced statistical features (15), as well as approaches using artificial neural networks (ANNs) (16, 17). To increase the accuracy of EE estimation, additional sensors such as heart rate (HR) monitors to compensate for weight-loading activities (18), or air pressure sensors to improve the estimation for activities involving altitude changes were added (19). Despite the improvements in the field of EE estimation based on accelerometers and IMUs, commercially available devices show a wide range of estimation accuracy (root mean squared error of 14–28% in EE estimation) (20). However, considering that many individuals with SCI present different movement characteristics due to the use of a wheelchair, the application of methods developed in able-bodied populations will likely result in a moderate to poor EE estimation in individuals with SCI.
Although accelerometer-based EE estimation models were developed for subjects with SCI using a manual wheelchair (21, 22), combining accelerometer and demographic variables, these studies focused on a restricted set of activities and were only validated in a semi-structured environment. In a more recent study, linear regression models for the estimation of EE became available based on recordings of 20 different activities, with a mean absolute error (MAE) of around 25% (23). Using methods that are more sophisticated the quality of the EE estimation may be improved.
The main aim of this study therefore was to develop and validate an EE estimation model for wheelchair-bound SCI individuals based on non-obstructive IMU recordings in a natural setting. We included a comprehensive set of 24 different physical activities, covering a broad range of activities of daily living. Furthermore, the collected data formed a basis for a recommendation that could promote a healthy lifestyle in the wheelchair-bound SCI population.
Methods
Subjects
Thirty chronic SCI subjects (age 45.4 ± 11.4 years, 11 tetraplegics, 19 paraplegics) who rely on a wheelchair for daily ambulation were recruited. Inclusion criteria were an age over 18 years old and suffering from SCI for more than 6 months post injury. Subjects with all neurological levels of injury (NLI) according to the International Standard for Neurological Classification of Spinal Cord Injury (ISNCSCI), and ASIA Impairment Scale (AIS) grades (A, B, C, and D) were included (Table 1). Participants with an AIS grade D relied on a wheelchair for daily ambulation either because of hemiplegia of the lower limb or due to personal preference. Exclusion criteria were any neurological diseases other than SCI, metabolic, orthopedic or rheumatologic diseases as well as pre-morbid or ongoing psychiatric disorder. All subjects gave written informed consent in accordance with the Declaration of Helsinki prior to participating in the experiment. The study was approved by the local ethics committee of the canton of Zurich (KEK-ZH Nr. 2013-0202).
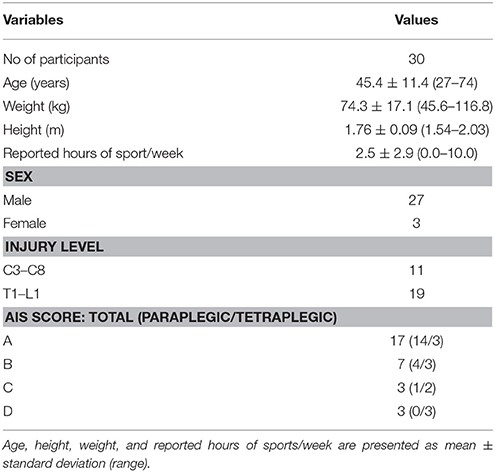
Table 1. Demographics and assessment scores of the included participants.
Measurement Devices
Activity Monitor
An IMU (ReSense) developed by Leuenberger and Gassert was used for this study (Figures 1B,C) (24). The sensor consists of a 3-axis accelerometer, a 3-axis gyroscope, a 3-axis magnetometer (not used in this study), as well as a barometric pressure sensor for altitude estimation. This low-power 10-degrees-of-freedom IMU can continuously record data for around 48 h at a sampling rate of 50 Hz. Thanks to its lightweight (15 g) and robust housing, the ReSense module is particularly well suited for clinical applications. In addition, the on-board clock of multiple modules can be synchronized temporally via a custom-built USB base station.
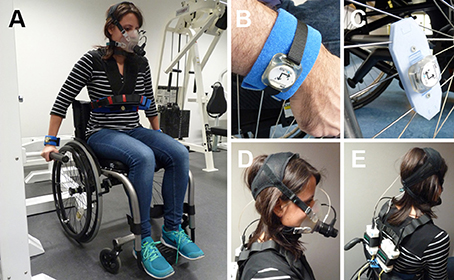
Figure 1. (A) Examiner wearing the full experimental setup during the activity weight lifting. One sensor module was attached at each wrist, one at the chest and one on the wheel of the wheelchair. (B) Sensor worn at the wrist with the AlphaStrap Blue and Velcro Strap fixation. (C) Wheel sensor with dedicated attachment. (D) Oxycon mobile mouth piece. (E) Back view of the Oxycon Mobile with sensor box and data exchange unit. Written and informed consent was obtained for the publication of these images.
Indirect Calorimetry
EE was assessed using a portable metabolic cart (Oxycon mobile, Carefusion, Hoechberg, Germany; Figures 1A,D,E). This system consists of a facemask, a turbine to assess flow as well as O2 and CO2 analysers. The data exchange unit as well as the sensor box were fixed on the participant's back via a harness. Data were recorded continuously breath-by-breath (i.e., one data point per breath) and synchronized offline with ReSense measurements. EE was derived from the O2 consumption and CO2 production using the proprietary software JLAB (Carefusion, Hoechberg, Germany). The system was calibrated according to the manufacturer's recommendation, 30 min prior to and immediately after each session in order to ensure high accuracy. Additionally, HR and blood oxygen saturation were measured by infrared technology, using an ear clip that was connected to the same system.
Bioelectrical Impedance Analysis (BIA)
BIA was used to determine fat mass (FM) and fat-free mass (FFM) of each subject. Based on FM and FFM, an additional reference value for the resting energy expenditure (REE) was calculated. For BIA measurements, a signal electrode as well as a measurement electrode were attached at each hand and foot and connected to the BIA device (AKERN BIA 101 system, SMT medical, Würzburg, Germany). FM and FMM were calculated using the proprietary software (BodyComposition, MEDI CAL HealthCare GmbH, Karlsruhe, Germany).
Clinical Assessments
Prior to the experiment, three standard clinical assessments were conducted to gather information on the NLI, the severity of the lesion, and the independence of the SCI subjects. The ISNCSCI protocol was used to assess the NLI as well as the completeness of the lesion (25). The Spinal Cord Independence Measure III (SCIM III) is a questionnaire containing 19 items, which was used to assess the level of independence in daily life (26). The total score, ranging from 0–100, as well as the scores of the three subdomains self-care (range 0–20), respiration and sphincter management (0–40), as well as mobility (0–40) were included separately in the analysis. The Graded Redefined Assessment of Strength, Sensibility and Prehension (GRASSP) was used to capture motor and sensory function and functional task performance of the upper extremities. As the GRASSP assesses sensation, strength, qualitative and quantitative grasping through a series of five examinations, the total score and the individual sub-scores of the five examinations were later included separately in the analysis (27, 28).
Tasks
Each subject had to perform 12 different physical activities out of a set of 24 possible activities. These activities were divided into three activity classes based on measured EE, subjectively perceived exertion, and the amount of distance traveled. The “low-intensity” activity class included the following activities: rest (lying on a bed), watching TV, reading, doing crossword puzzles, playing cards, riding an elevator, playing with a tablet PC, writing, computer work, and passive wheeling (i.e., when the wheelchair was pushed by someone else). The “high intensity” class included the following activities: washing dishes, hanging out the laundry, using a handbike ergometer (30 W), playing table tennis, and weight lifting. The last class was called “wheeling” and included activities involving wheelchair self-propulsion. These activities included completing a wheelchair skill parcour (including a slalom with nine cones, four curbs of 3–8 cm height, and a ramp with an inclination of 8%), wheeling at different speeds (2, 3.5, 5, 6.5 km/h and self-chosen), wheeling uphill (inclination 2.6%), wheeling downhill (inclination 2.6%), and wheeling on a wheelchair ergometer.
Protocol
Participants came to the Balgrist University Hospital for a single session of ~5 h in the morning after an overnight fast of at least 10 h. First, participants were informed about the experimental procedure, and the 12 pseudo-randomly selected tasks were explained in detail. Subsequently, body composition was assessed by use of BIA, height was measured while the subject was lying on the bed, and weight was measured with a wheelchair scale. Participants were equipped with one sensor module at each wrist, one module was fixed at the chest (approximately at the sternum) and an additional module was fixed to one wheel of the wheelchair. Participants used their own, individually adapted wheelchair for the entire duration of the study. Thereafter, the sensor modules were time-synchronized with the camera, the indirect calorimeter, and the HR monitor.
The first part of the experiment consisted of 20 min of rest, lying on a bed for assessment of REE, followed by a standardized breakfast equivalent to 30% of a participant's calculated daily EE. The second part of the experiment started at least 90 min after the end of breakfast, when EE had returned to baseline values. First, participants lay on a bed for 20 min. This was considered the REE measurement under the non-fasted condition (first task). Subsequently, participants performed eleven 8-min tasks, selected pseudo-randomly from the set of 24 tasks, with a minimum of 5 min between two consecutive tasks. The pseudo-random selection ensured that at least two tasks from each activity class were selected and that each task was performed approximately equally often across all subjects. The 8-min activities were ordered according to the expected intensity of the tasks, starting with the least intense task. After each task, subjects were asked to rate their perceived exertion on an 11-point numeric rating scale (0 = “no exertion,” 10 = “maximum exertion”).
Video recordings were taken during the entire experiment (GoPro Hero HD 2, Go Pro Inc., San Mateo, CA, USA) in order to verify all activities retrospectively. In case subjects were unable to start the experiment in the morning, a shortened version of the protocol was provided, i.e., subjects came to the clinic at least 2 h after the last food intake. After explanation of the study and signing the consent form, the experiment started with the assessment of body composition, height, and weight, followed by 20 min of REE measurement in the non-fasted condition. Afterwards, subjects followed the same protocol as described above.
Data Analysis
The complete data processing, statistical analysis, as well as the training of the k-nearest neighbors (kNN) classifier and ANNs were performed using MATLAB 2014a (The MathWorks, Natick, MA, USA). All processing steps were conducted offline.
In total, four different algorithms were designed, evaluated (Figure 2) and compared against algorithms described in the literature. The first algorithm is of low complexity, which requires only limited computational power and could therefore be implemented directly on an activity tracker for on-line analysis and subject feedback. This algorithm consists of a multi-linear regression (MLR) model which uses different statistical features derived from the IMU data and previously estimated REE as predictors. The second algorithm is a more complex approach requiring more computational power. The algorithm consists of an ANN using features derived from the sensor data and the estimated REE as predictors. The third (MLR based with prior classification) and the fourth (ANN based with prior classification) algorithms are motivated by the work of Staudenmayer et al. (16). This group showed that prior classification into different activity classes before the EE estimation increases the estimation accuracy significantly. Therefore, the third and fourth algorithms consist of three parts. In the first part, the REE is estimated from demographic data; in the second part the different activities are classified into the three activity classes; in the third part, the EE is estimated using different MLRs or ANNs, respectively, for each of the classes. All processing steps are explained in the following paragraph.
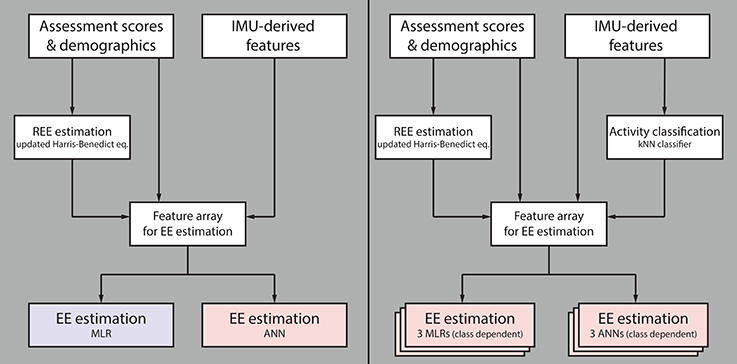
Figure 2. Flow chart summarizing the different evaluated algorithms. The first algorithm for estimating energy expenditure (EE) consists of a multiple linear regression (MLR) model and the second algorithm of an artificial neural network (ANN); both use features derived from IMU data, participant demographics and clinical assessment scores, as well as previously estimated resting EE (REE) as model input (Left). The third algorithm consists of three independent MLRs (one per activity class), and the fourth of three independent ANNs, both preceded by a k-nearest neighbors (kNN) classifier (Right). The two latter algorithms use the same model inputs as algorithms one and two, without preceding kNN classifier. Note that the blue model requires only limited computational power compared to the red ones.
Pre-processing
In order to ensure that all IMU data consisted of the same number of samples and that they were temporally aligned, the recordings from the ReSense modules were resampled at 50 Hz using a cubic spline interpolation function. Afterwards, IMU recordings were synchronized with the OxyconMobile data and the video recordings, using time stamps, which were aligned at the beginning of the experiment. The acceleration signals were filtered using a 2nd order Butterworth high-pass filer with a cut-off frequency of 0.25 Hz in order to remove the static acceleration component due to gravity. Gyroscope data were filtered with the same high-pass filter. The altitude data was filtered using a 2nd order Butterworth low-pass filter with a cut-off frequency 0.2 Hz.
Labeling and Segmentation
Data were labeled using temporal markers from the OxyconMobile, the IMU modules, and from the video recordings. For the REE measurements, the mean of a 4-min window (min 14–18) was taken. For each of the individual activities, the last 4 min of each activity were segmented in windows of 1 min without overlap. Taking the last 4 min ensured that the EE had reached a steady state. After visual inspection of the data, 1,324 windows remained, which were later included in the development of the different models. As HR data was partly missing for some subjects, all analysis involving the HR was only based on 897 windows (67.8%).
Feature Calculation
Features were calculated from the processed acceleration signal containing the dynamic component, from the gyroscope data and the altitude signal for each window. All statistical features derived from the accelerometer and gyroscope data were calculated from the respective magnitudes in order to ensure that the orientation of the sensors, and therefore in which orientation the sensor is placed, had no influence on the final algorithm. Statistical features derived from the sensor data were based on previously used features in activity classification studies (29–39). Only features from the time domain were taken for further analysis as we have shown that in “real world” applications, frequency domain features usually do not provide useful information (40). In addition, some high level features were included: AC (41), total distance traveled and distance traveled actively (40), altitude difference within one epoch, altitude variance within one epoch, and time above acceleration magnitude threshold (empirically chosen). In order to test whether the inclusion of HR improves the overall accuracy of EE estimation, as shown by Nightingale et al. (42), mean HR, resting HR and the difference between mean HR and resting HR were included as additional features. Finally, features extracted from demographics as well as from clinical assessments were included, namely age, height, weight, gender, AIS score (A = 4, D = 1), injury level (C1 = 1, L5 = 25), GRASSP sub-scores and SCIM III sub-scores.
REE Estimation
Five different MLR models were developed for the estimation of the REE. The different MLR models have all the following basic form:
with α representing the intercept, and βi representing the regression coefficient of the feature Fi. All MLR models included the independent variables height, weight, age and gender. In addition, different clinical scores were also included as independent variables, namely total SCIM III score, completeness, NLI, AIS score, and motor score of the ISNCSCI assessment. The MLR was computed by minimizing the sum of squared relative errors according to the method described by Tofallis (43). Moreover, ANNs based on the same features were trained in order to reveal more complex and non-linear relationships. Readers not familiar with ANNs can refer to the work of Basheer and Hajmeer (44). As one hidden layer is usually sufficient in most applications, all ANNs had a single hidden layer with five sigmoid neurons (44). The initial weights were chosen by the Nguyen-Widrow layer initialization function and the Levenberg-Marquardt backpropagation algorithm was used to train the ANNs (45, 46). As the actual output can vary depending on the initial weights, 100 ANNs were trained per iteration and the mean outcome was used for further analysis. The performance was analyzed using the leave-one-subject-out cross-validation, resulting in 30 iterations. The MAE in percent was chosen as criterion for the MLRs and ANNs. A detailed overview of the models and features included in this study can be found in Table 2. In addition to the REE estimation models described above, three well established estimation models, which have been developed for the able-bodied population, were evaluated with the data from this study: the Harris-Benedict equation, the updated Harris-Benedict equation and the Mifflin-St. Jeor equation (47–49). Finally, the REE was also estimated from the BIA measurement using the BIA software BodyComposition Professional (Medi Cal HealthCare GmbH, Karlsruhe, Germany).
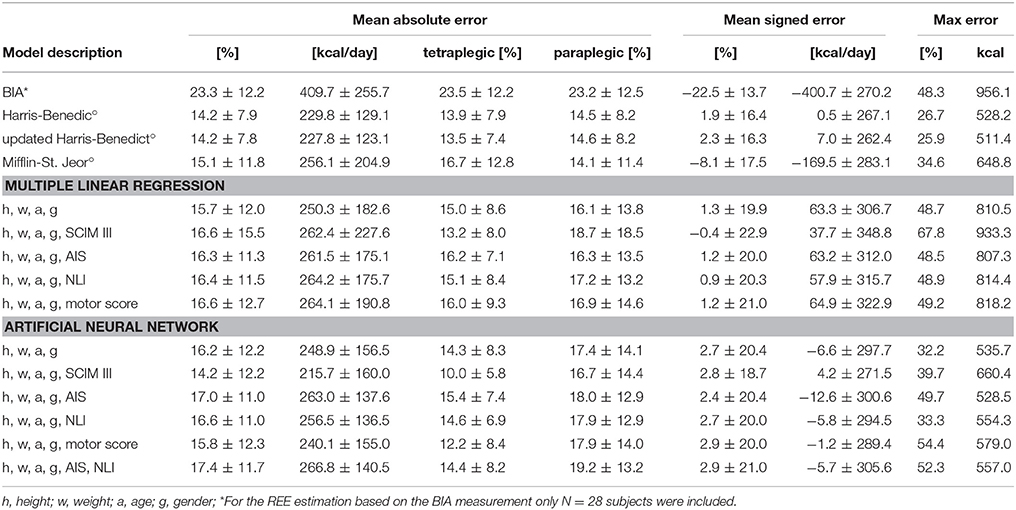
Table 2. Results of the REE estimation based on BIA measurement, models known from the literature (°), and MLR and ANN models developed in this study.
Activity Classification
In order to classify the different windows into one of the previously described activity categories “low-intensity,” “high-intensity,” and “wheeling,” a kNN classifier with k = 10 and a squared inverse distance weight was used. A total of n = 1384 windows were used to train the kNN classifier. Three features were selected for the kNN classifier, namely the AC of the wheel sensor as well as the root mean square (RMS, right wrist) and the median (left wrist) of the angular velocity magnitude. Among all feature combinations, the combination with these three features showed the best classification accuracy. In order to evaluate the performance of the kNN classifier, the leave-one-subject-out cross-validation method was used for the analysis. This resulted in a total of 30 iterations, one per subject. The percentage of correct classified windows was taken as a criterion to optimize the classifier.
EE Estimation
In total four different estimation models were designed for the activity dependent EE not including the HR. An MLR model and an ANN model were designed where the activity-dependent EE was estimated using IMU data and the estimated REE as predictors. In order to see if a prior classification into different activity classes increases the estimation accuracy, additional MLR and ANN based models were designed. Thereby each activity class had a separate MLR or ANN estimation model. In order to see how the classification accuracy of the previously mentioned kNN classifier influences the final EE estimation, the MLR and ANN models with prior activity classification were evaluated (i) assuming 100% correct classification and (ii) with the classes estimated by the kNN classifier. Similar to the REE estimation using MLR, the MLRs for the activity-depended EE estimation were computed using the sum of squared relative errors (43). The MLR model without prior classification used seven predictors in total (right wrist IMU: mean acceleration magnitude, kurtosis of the angular velocity magnitude, altitude difference; left wrist IMU: RMS of the acceleration magnitude; chest IMU: RMS of the angular velocity magnitude; wheel IMU: variance of the angular velocity magnitude; REE). The MLR model with previous classification used for the MLR of the “low-intensity” class the same features as predictors as mentioned before, the “wheeling” class used one predictor less, specifically, the RMS of the acceleration magnitude of the left wrist IMU. The “high intensity” class used slightly different features as predictors (right wrist IMU: altitude difference; left wrist IMU: RMS of the acceleration magnitude; chest IMU: median of the acceleration magnitude, RMS of the angular velocity magnitude; wheel IMU: kurtosis of the acceleration magnitude, variance of the angular velocity magnitude; REE). The ANNs trained for the estimation of the activity-dependent EE had the same design as the ANNs trained for the REE estimation. This means that all ANNs had one hidden layer with five sigmoid neurons. The Nguyen-Widrow layer initialization function was used to choose the initial weights and the Levenberg-Marquardt backpropagation algorithm was used to train the ANNs. Here again, 100 ANNs were trained per excluded subject and the mean outcome was used for further analysis. The ANN without prior activity classification used six features as input, namely the mean acceleration magnitude (right wrist IMU), AC (left wrist IMU), AC (chest IMU), altitude difference (chest IMU), distance traveled, and REE. The ANN model with prior activity classification had different features as inputs for every ANN. The ANN for the activity class “low intensity” had seven inputs, namely the mean acceleration magnitude (right wrist IMU), kurtosis of the angular velocity magnitude (right wrist IMU), altitude difference (right wrist IMU), RMS of the angular velocity magnitude (chest IMU), weight, gender, and estimated REE. The ANN for the “high intensity” class used five features as input, namely AC (right wrist IMU), mean acceleration magnitude (left wrist IMU), mean angular velocity magnitude (chest IMU), AC (left wrist), and estimated REE. The ANN for the “wheeling” class had six inputs: RMS of the acceleration magnitude (right wrist IMU and left wrist IMU), AC (chest IMU), mean angular velocity magnitude (wheel IMU), AC (left wrist), and estimated REE. In order to test if the inclusion of HR improves the estimation, all models (MLR and ANN based) with prior activity classification were trained again but this time including the difference between measured HR and resting HR as additional predictor. Note that only 897 windows were available for the training of the models including HR. All developed models (MLR, ANN, with and without HR) were evaluated using the leave-one-subject-out cross-validation method. This resulted in a total of 30 iterations for each developed model.
Establishing Reference Values for a Healthy Lifestyle
For a healthy lifestyle, different reference values exist for the able-bodied population. The most well-known reference value for a healthy lifestyle is probably the 10,000 steps a day reference (equivalent 300 kcal/day) (50, 51). However, this reference value is controversial and other research groups and institutions have proposed lower daily step-goals (52). Furthermore, other activity goals, which are not directly related to the number of steps, have been proposed.
The U.S. Department of Health and Human Services for example, suggests 150 min of moderate physical activity per week (e.g., 5 × 30 min) or 75 min of vigorous physical activity per week (53). This is similar to what the American College of Sport Medicine (ACSM) suggested in their updated recommendations from 2007, where 30 min of moderate physical activity on 5 days a week or 20 min of vigorous physical activity on 3 days per week is suggested to promote a healthy lifestyle (54). Blair and colleagues stated in their work, that 30 min of moderate intensity activity per day provides substantial benefits, but 60 min of moderate intensity activities per day would be ideal (55). These 60 min of moderate (to vigorous) activity per day are also what is recommended by Wilson and colleagues in order to prevent weight gain (56). Sixty minutes of moderate to vigorous activity per day results in an increase in EE by 150–200 kcal/day. In order to establish values for a healthy lifestyle in the wheelchair bound SCI population, we therefore investigated which daily distance traveled in wheelchair would result in 150, 200, and 300 kcal/day. In order to translate this recommendation for a healthy lifestyle into a daily distance to travel by wheelchair, the daily average speed has to be taken into consideration. Since the average wheeling speed in the SCI population was reported to be 1.7–2.3 km/h (57, 58), the EE measured in the wheeling task at 2 km/h was used. On the other hand, there are recommendations based on time spent in activities of moderate (to vigorous) intensity. Therefore, we estimated the distance to travel and the corresponding EE based on the recommendation corresponding to 30 and 60 min of wheeling at moderate intensity.
Performance Analysis and Statistics
The performance of the REE and EE estimation models were analyzed in terms of MAE in percent and mean signed error (MSE) in percent. The performance of the kNN classifier was analyzed using overall classification accuracy in percent and in addition the sensitivity of the different classes was computed (40). In order to compare different activities, the metabolic equivalent of task (MET) was calculated using an adapted formula for the SCI population (59), where 1 SCI MET is equivalent to 2.7 mL O2·kg−1·min−1 in contrast to the formula for the able-bodied population, where 1 MET is equivalent to 3.5 mL O2·kg−1·min−1 (60). In order to demonstrate the relationship between measured SCI MET and perceived exertion (numeric rating scale), a Spearman rank correlation was used. The significance level for all statistical analyses was set to p = 0.05.
Results
REE Estimation
An overview of all REE estimation models is presented in Table 2. The estimates are compared in terms of MAE, MSE and maximal error. Both Harris-Benedict equations as well as the ANN with height, weight, age, gender and total SCIM III score performed best in terms of MAE (14.2%). Generally, all models overestimated the REE, which is reflected in the positive MSE. Only the estimation with the BIA, the Mifflin-St. Jeor equation and the MLR model including height, weight, age, gender, and total SCIM III score showed an underestimation of the true EE value. The MAE in percent for men was always lower than the MAE for women, except for the BIA estimation where an MAE for men of 24.0 ± 11.5% and MAE for women of 17.8 ± 19.2% were found. By way of comparison, the MAE resulting from the updated Harris-Benedict equation was 13.0 ± 7.2% for men and 25.0 ± 7.2% for women.
Activity Classification
The overall classification accuracy of the kNN classifier was 97.9%. An overview of the classification accuracy of each individual activity class can be found in Figure 3B. In addition, a 3D scatter plot (Figure 3A) and two 2D scatter plots (Figures 3C,D) are presented in order to visualize the separation of the different activity classes. The sensitivity for the individual activities was generally high, with a range of 81.8–100% and a median of 100%.
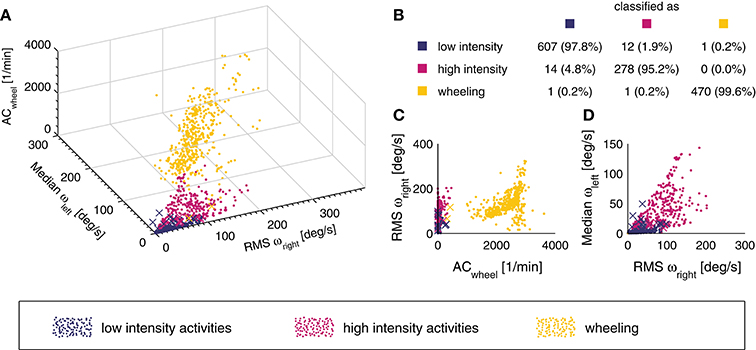
Figure 3. 3D scatter plot of the different activity classes for the three features used (A). A point represents a correct prediction and a cross a false prediction. In addition, the confusion matrix for the entire data set (n = 1,384 windows) is represented in subplot (B). The overall classification accuracy was 97.9%. In order to illustrate how the different activity classes can be separated, two additional projections of the 3D scatter plot are presented (C,D).
EE Estimation
ANN and MLR models were based on a total of 1,324 windows. An overview of the EE estimation accuracy of all models can be found in Table 3. Overall, the ANN model where the activity was previously classified into classes by the kNN classifier showed the lowest overall MAE for the EE estimation with 14.4 ± 5.3% (Figure 4). The MAE of the different activity classes for the previously mentioned EE estimation model was 11.8 ± 6.1% for the “low intensity” class, 19.2 ± 11.7% for the “high intensity” class, and 14.4 ± 6.8% for the “wheeling” class. Assuming a classification accuracy of 100% (ANN class known) for the kNN classifier, this would only result in a marginally better overall MAE (14.1 ± 5.4%) for the EE estimation. The MAE for the different activity classes was 11.8 ± 6.0% for the “low intensity” class, 17.6 ± 11.7% for the “high intensity” class, and 14.2 ± 6.9% for the “wheeling” class. The MLR model (with prior kNN classification) profited from the inclusion of the HR. The overall MAE for the EE estimation improved from 16.0 ± 6.2 to 14.9 ± 4.8% when including the HR. The MAE for the different classes was 13.7 ± 6.8% without HR and 13.8 ± 6.1% with HR for the “low intensity” class, 19.0 ± 10.7% without HR and 17.4 ± 9.4% with HR for the “high intensity” class, and 17.9 ± 9.3% without HR and 17.2 ± 10.9% with HR for the “wheeling” class. In contrast to the MLR model, the ANN model (with prior kNN classification) did not benefit from the inclusion of the HR. The overall MAE for the EE estimation with the ANN model was 12.9 ± 4.7% without HR and 13.6 ± 5.4% with inclusion of the HR. Looking at different classes showed that the MAE was 10.8 ± 5.9% without HR and 12.3 ± 6.9% with HR for the “low intensity” class, 18.6 ± 13.2% without HR and 17.3 ± 9.8% with HR for the “high intensity” class, and 14.2 ± 8.6% without HR and 15.1 ± 12.2% with HR for the “wheeling” class.
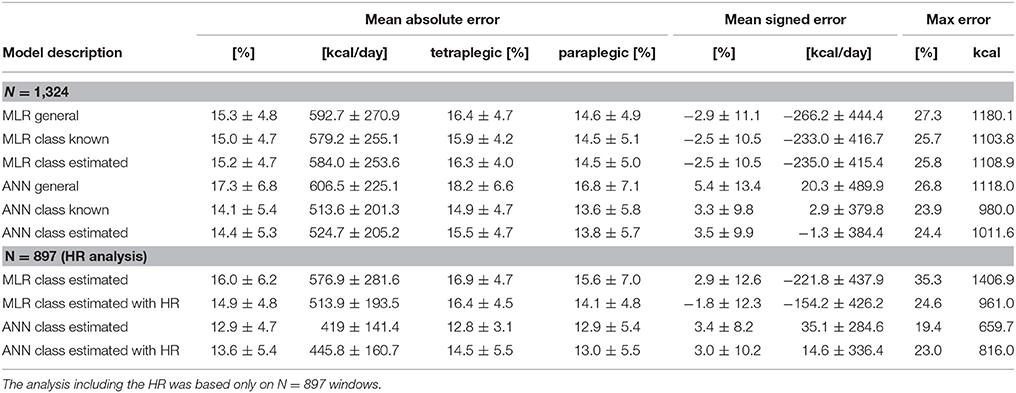
Table 3. Evaluation of the different models developed as a part of this study.
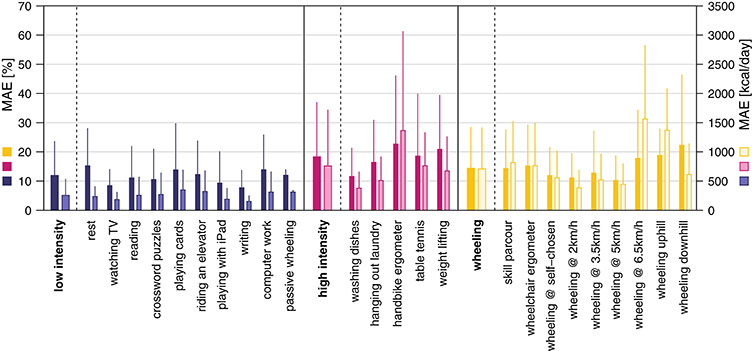
Figure 4. Mean absolute error (MAE) for the EE estimation using the ANN model with prior activity classification. The overall MAE was 14.4 ± 5.3%. The MAE in percent for the single activities and classes is presented in dark colors and the MAE in kcal is presented in bright colors.
The evaluation of the two 2.5 h-measurements to validate the algorithm under real-world conditions is shown in Figure 5. For subject #1, the real EE was underestimated by 23.2 kcal (6.1%) while for subject #2, the real value was overestimated by 12.2 kcal (4.6%).
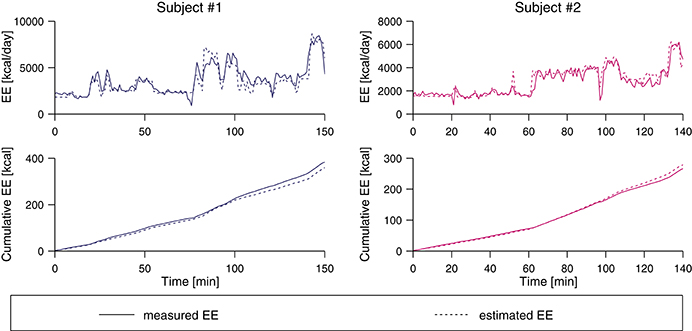
Figure 5. Pre-validation of two subjects using the class-dependent ANN algorithm. The two top plots show the measured EE from the indirect calorimetry and the estimate based on the IMU data, and the bottom plots show the cumulative value of the estimated and the measured EE value. At the end of the measurement period, the real EE was underestimated by 6.1% for subject #1 and overestimated by 4.6% for subject #2.
Energy Cost of Physical Activities
The metabolic cost of each single activity and the three activity classes is presented in Figure 6. The mean SCI MET for the “low-intensity” class was 1.6 ± 0.5 and all activities were below 2 SCI MET, which is considered as light intensity activity (61). The mean SCI MET for the “high-intensity” class was 3.2 ± 1.5 and three activities of this class are considered as light intensity activities and two as moderate intensity activities. For the “wheeling” class the mean SCI MET was 3.8 ± 1.6 and, according to Pate and co-workers, two activities would be classified as light intensity activities, six as moderate intensity activities, and one as vigorous intensity activity (61). In order to show the relationship between measured SCI MET and perceived exertion, a correlation (R = 0.73, p < 0.001) is presented in Figure 7.
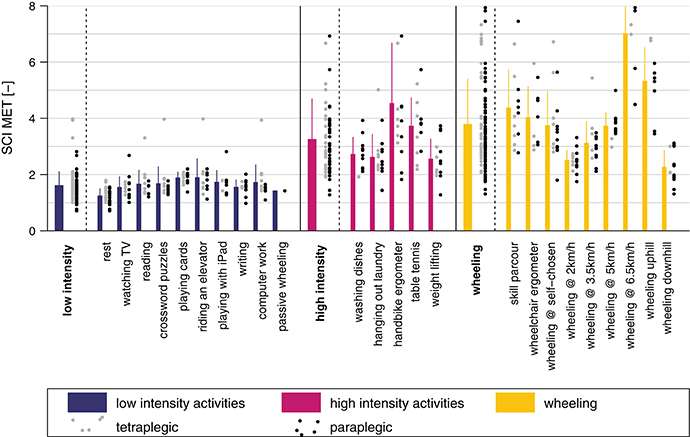
Figure 6. SCI MET presented for all activities and classes. The gray dots to the right of each bar represent the values for the tetraplegic subjects and the black dots the values for the paraplegic subjects. The bars represent the mean of the pooled data including paraplegic and tetraplegic subjects.
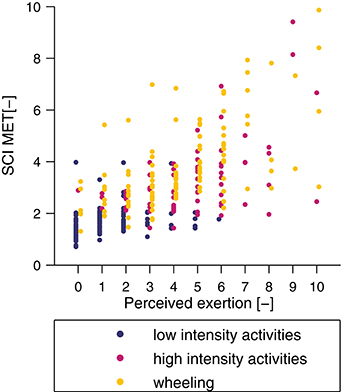
Figure 7. Correlation between perceived exertion, assessed with a numeric rating scale, and measured SCI MET. The correlation coefficient was R = 0.73 (p < 0.001).
Recommendations of Healthy Lifestyle
The conversion of the recommendations for a healthy lifestyle in the able-bodied population to daily goals in the wheelchair-bound SCI population can be found in Table 4.
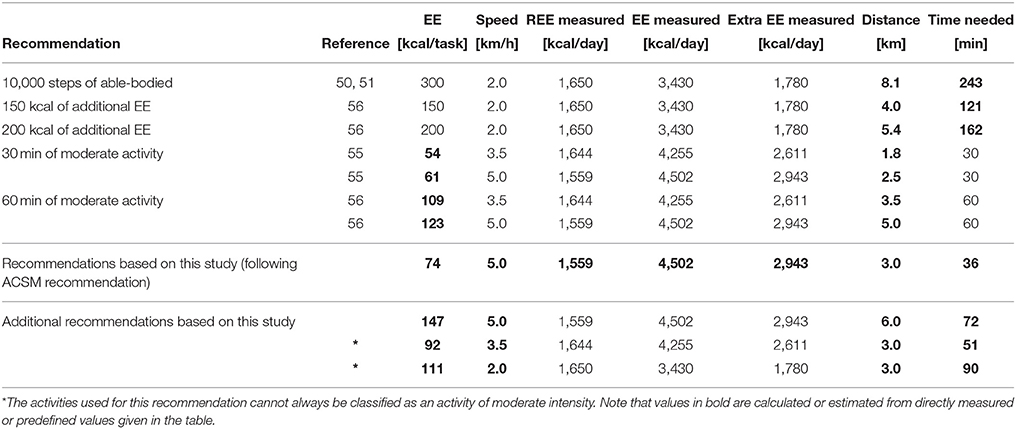
Table 4. Recommendations for the able-bodied population converted to EE during moderate activity, and to distance to travel for the wheelchair-bound SCI population.
Discussion
The main aim of this study was to develop and validate an algorithm for estimating EE from IMU data applicable in a real-world situation in individuals with SCI. We present a highly accurate method to estimate ADL-dependent EE from IMU recordings. Most importantly, we provide reference values for wheelchair-bound SCI subjects to promote and coach a healthy lifestyle, which could be beneficial for reducing the risk of cardiovascular diseases.
REE reflects the energy used to maintain vital functions at room temperature. To account for its large contribution [~65% in the able-bodied population (62)] to total daily EE, it was deemed important to accurately estimate the REE. Also, at a later stage, the estimated REE was used as predictor for the activity-dependent EE estimation models. As expected, the BIA-based model showed the worst REE estimation in terms of MAE, MSE, and maximum error, and is generally known to be very population specific (63). Therefore, a separate BIA estimation model for SCI would be required. The three well-established REE estimation equations, namely the Harris-Benedict equation, the updated Harris-Benedict equation, and the Mifflin-St. Jeor equation performed equally well. The MAE for REE estimation using the updated Harris-Benedict equation has been reported to be around 14% for the able-bodied population (49). This compares favorably to 14.2 ± 7.9% for the SCI data in the present study.
Here, we also investigated whether and how REE estimation models could be improved by considering clinical scores. However, the inclusion of the AIS score did not improve the models and is likely too unspecific in describing the extent of impairment. Also, including the level of injury or the motor scores of the ISNCSCI did not improve the estimation accuracy significantly. The only clinical score improving the MAE of the REE estimation was the SCIM III total score, although it only improved the ANN-based model. In general, all REE estimation models that were developed in this study were based on the data of only 30 subjects. This number is clearly too small to build a general model for this heterogeneous population of SCI subjects. For this reason, subsequent analyses were performed using the updated Harris-Benedict equation for REE estimation.
In the able-bodied population, the type of activity performed by a subject was shown to be of great importance when establishing models to estimate EE (16). In order to obtain a generalizable EE estimation model, we chose to split the different activities into three broader activity classes. The overall classification accuracy of the kNN classifier was slightly better than previous comparable models developed for the SCI population, which can most likely be explained by the fact that we included only three activity classes, whereas Hiremath and co-workers included four and seven activity classes, respectively (22, 64). The kNN classification has proven to be an appropriate approach for activity classification in the able-bodied population as well as in neurological conditions other than SCI (31, 36, 38, 39). The performance of our kNN classifier was excellent, with an overall classification accuracy of 97.9%. The activity class “wheeling” had only 2 out of 472 misclassified events. Already a single feature, namely AC of the wheel sensor, was enough to classify the aforementioned class (Figure 3C). The “low intensity” and “high intensity” class had 13 and 14 misclassified events. In the “low intensity” class, the activity “playing cards” showed the overall worst sensitivity with 85.3%. This result can be explained by the fact that even if playing cards is considered as low intense activity, it can include extended periods of faster and more intense arm movements. However, in only 2 out of 24 activities, the presented kNN classifier had a sensitivity lower than 90%. Thus, the presented kNN classifier is accurate enough to be used for the activity classification of the final EE estimation algorithm. Furthermore, since the kNN classifier classifies activities into activity classes (i.e., groups of activities) and not into single activities, this approach may be generalizable to other activities and applications.
The MAE of the activity-dependent EE estimation ranged from 14.1% up to 17.3%, when the HR information was not included. However, we have to take into account that the model reaching a MAE of 14.1% assumed a perfect classification into the different activity classes. In general, the overall MAE is in the range of other accelerometer or IMU based models developed for the SCI population although those studies included fewer activities (21, 22, 42). Recently, Hiremath and coworkers presented an EE estimation model which was developed using recordings from 20 different activities, achieving a MAE of 25% (23). A possible explanation for the different results might be that Hiremath and coworkers used linear regression models, which do not account for non-linear relationships between accelerometer measurements and EE (23). MAE in the present study was always highest for the “high intensity” class, which can be explained by the fact that weight-loading activities, such as the handbike ergometer and weight lifting, have been included in this class. In fact, a similarly decreased estimation accuracy for activities with external load has already been reported previously in the able-bodied population (13, 18). In order to obtain the best EE estimate for each class, different features where used for the different classes. Interestingly, all models developed in this study, whether MLR or ANN based, included features derived from the accelerometer data as well as from the gyroscope data. This is in contrast to what Moncada-Torres and co-workers have shown, where features derived from the gyroscope data did not provide useful information for activity classification (39). This discrepancy can be explained by the fact that, in our study, the algorithms were used to estimate a continuous value of EE, while in the study by Moncada-Torres the algorithms were used to classify activities (39). The inclusion of altimeter-based features in the final algorithm was not surprising, as it has already been shown that accelerometer and altimeter are a good combination to estimate EE in activities with altitude changes (65). Two features based on demographic data were further included, namely weight and gender. These two features were only selected in the class-dependent model and only for the “low intensity” class. Again, the exclusion of features based on demographic data may be explained by the fact that they are already represented in other features, especially in the REE. The comparison between MLR and ANN-based models showed that the MLR-based model performed better when no previous activity classification occurred, and the ANN-based model performed better for the class-dependent model.
The inclusion of the HR showed a slight improvement for the MLR-based model. Thereby, the overall estimation improvement comes mainly from the improvement in the “high intensity” class. This might be due to the fact that the addition of the HR can, to a certain extent, improve the EE estimate of weight loading activities. The validity of combining accelerometer and HR measurements in the SCI population to estimate EE by using linear models has already been shown by Nightingale et al. (42). Our non-linear approach based on the ANNs did not benefit from the inclusion of the HR, and the MAE increased when adding the HR as additional predictor. While the MAE decreased for the “high intensity” class, it increased slightly for the “wheeling” motion class and was negligible for the “low intensity” class. In fact, the change in HR might not necessarily result from a change in the intensity of an activity, especially in the “low intensity” class, as HR is known to be influenced also by emotion, stress or other factors which are most visible at rest and during low intensity exercise (66). During the assessments in the present study, activity-independent factors potentially influencing HR were minimized. Hence, the application of the ANN model with HR as additional feature would most likely result in even higher estimation errors under “real-world” conditions. Therefore, we suggest using the class-dependent ANN model without HR for future applications.
Based on the insights from this study and existing literature for the able-bodied population, we seeked to propose activity-related recommendations for a healthy lifestyle in the SCI population. For subjects with SCI, activity recommendations were translated into daily distance traveled in a manual wheelchair. Since translations from able-bodied to SCI are based on the EE recordings of the present study, we assured that the different SCI MET values in the literature matched the SCI MET values of this study. Collins and co-workers investigated the metabolic cost of 27 different physical activities in 170 adults with SCI (59). Six activities, namely desk work, laundry, washing dishes, weight lifting, table tennis, and hand bike ergometer were also included in our study. The measured mean SCI MET of these activities was indeed in the same range as was reported previously, except for the hand bike ergometer activity, where mean SCI MET was 4.5 in the present study compared to values between 3.37 and 3.83 reported by Collins et al. (59). Possibly, this difference can be explained by differing angular velocities of the hand bike ergometer between the two studies. Further agreement between the SCI MET of this study and the literature can be found in the study of Hiremath et al. (23). For the four common activities of both studies, namely arm ergometry, deskwork, resting and propulsion, all activities were within one standard deviation of EE. In the work of Nightingale and co-workers the EE for the propulsion at different wheelchair speeds (on a treadmill) was reported (42). Although the data cannot be compared directly to the values of our study, due to different protocols, we can see a linear relationship between wheelchair speed and EE in both studies, when excluding the task of wheeling at a speed of 6.5 km/h in our study. In conclusion, the SCI MET recorded in this study matches the values reported in the literature well. Therefore, we consider it a valid approach to use the measured EE of the present study for healthy lifestyle recommendations in the SCI population.
The most commonly used recommendation for an active lifestyle in the able-bodied population is the ACSM recommendation suggesting 30min of moderate to vigorous activity per day on at least 5 days per week. For the wheelchair-bound SCI population, the results of our study found wheeling at 3.5 or 5 km/h to represent an activity of moderate intensity. In order to choose one of the two speeds for the translation of the ACSM recommendation, we further examined the EE at these two wheeling speeds. According to Wilson et al. (56), 60 min of moderate to vigorous activity per day should result in ~150 kcal of increased EE, and 30 min of moderate to vigorous physical activity therefore corresponds to an additional 75 kcal. Wheeling at 5 km/h for 30 min was closer to the desired 75kcal than wheeling at 3.5 km/h. For this reason, we chose to use 5 km/h for the translation of the ACSM guidelines to the wheelchair-bound SCI population. This translation would therefore result in a recommendation to travel a daily distance of ~3 km at 5 km/h in the wheelchair.
There exist, however, also other recommendations for the able-bodied population. For the translation of the 10,000 steps/day (roughly 300 kcal/day) to a distance to travel per day in the wheelchair, we selected an average wheeling speed of 2 km/h. This value was based on daily averages obtained from long-term recordings in the SCI population (57, 58). Based on these values, the recommendation for the SCI population would be to wheel for around 8 km per day at this average speed. However, it is likely that this reference distance is far too high. First, the threshold of 10,000 steps/day is controversial in the able-bodied population, and some researchers have suggested lower thresholds for the able-bodied population. Second, the daily EE and the REE of an individual with SCI are lower than those of an able-bodied person, and therefore less than the additional 300 kcal/day (estimated for 10,000 steps) might be sufficient for a health-promoting effect. We further translated other activity recommendations for the able-bodied population such as an additional 150 and 200 kcal per day spent in activities of moderate to vigorous intensity, into daily distance to travel in the wheelchair. As these recommendations are, however, not well-established, we therefore did not consider them for our final recommendation.
Therefore, based on data of the present study we recommend to travel for at least 3 km at 5 km/h on 5 days a week in order to achieve a health-promoting additional daily EE. This recommendation is in line with the recommendations of the U.S. Department of Health and Human Services and the ACSM (53, 54). There are, however, wheelchair users who cannot achieve a wheeling speed of 5 km/h and therefore cannot fulfill the proposed combination of extra calories and intensity. Nevertheless, these wheelchair users could try to reach the goal of 3 km/day, first, because even at lower speeds they reach the recommended daily goal of additional 75 kcal, and second, because 3 km per day is more than what an average wheelchair user travels per day (around 2 km) (57, 58, 67, 68).
While our recommendation aims at minimizing the risk for cardiovascular diseases, Blair and co-workers stated in their work that 60 min instead of 30 min of moderate to vigorous physical activity per day is beneficial for different health outcomes such as for example, maintaining a lean body mass or improving muscular strength and endurance (55). In order to fulfill the 60 min recommendation, our results can easily be extrapolated to a daily distance to travel of 6 km/day.
We would like to acknowledge some limitations of this study. Firstly, the number of women included in this study (i.e., 3) may be considered too small (although it reflects a typical distribution in traumatic SCI) and, therefore, the sample measured may not be representative for the entire SCI population. Secondly, no individual HR calibration such as the method presented by Spurr and coworkers was used, which might have influenced the models including the HR (69). Thirdly, apart from the wheelchair wheel diameter, no information about the wheelchair types used by the study participants was included in the models, which might have influenced the EE estimation accuracy. Fourthly, the proposed algorithm does not consider the lifestyle of the individual (type and intensity of activities), which could have potentially improved our estimation model. The classification into different activity classes worked well for the activities included in this study, but a validation in a real-world setting is required. A further limitation of this study concerns the recommendations for a healthy lifestyle made for the SCI population. All values were translated from recommendations from the able-bodied population and it first has to be shown that those values should also be used in the SCI population. Finally, the REE models were based on 30 subjects only (equal to 30 data points), thus the inclusion of more subjects is needed to allow for the design of a more general estimation model.
Conclusion
The models presented in this study accurately estimate EE in an unprecedented pool of 24 activities and in 3 h of continuous measurements in wheelchair-bound SCI individuals, making it a powerful tool to be used during continuous and non-obstructive recordings in real-world situations. IMU-based EE estimation is a promising methodology that may be used, together with the proposed wheeling reference value of 3 km per day, to promote a healthy lifestyle in SCI individuals at later stages of and/or after rehabilitation. The use of such recordings and recommendations may help to increase physical activity of SCI individuals to an extent allowing to decrease the prevalence of cardiovascular disease and increase quality of life in the long run.
Author Contributions
WP, MB, BW, CS, AC, MS, and RG designed the study, WP, LR, and MB collected the experimental data, WP and LR performed the data analysis, WP, LR, MB, BW, CS, AC, MS, and RG interpreted the results, revised the manuscript, and approved the final version.
Funding
This work was supported by the Clinical Research Priority Program (CRPP) Neuro-Rehab of the University of Zurich, by the International Foundation for Research in Paraplegia (IRP, project number: P157), by the Swiss Paraplegic Foundation (SPS), by a HMZ Seed Project (project title: ZurichMOVE: Wearable sensors to monitor movement quality and mobility in health care) funded by the University of Zurich and the ETH Zurich Foundation, as well as by the ETH Zurich Foundation in collaboration with Hocoma AG.
Conflict of Interest Statement
The authors declare that the research was conducted in the absence of any commercial or financial relationships that could be construed as a potential conflict of interest.
The reviewer HS and handling Editor declared their shared affiliation.
Acknowledgments
The authors would like to thank Thi Dao Nguyen, Fanny Leimgruber, and Sophie Schneider for the help in data collection, Dr. Kaspar Leuenberger and Dr. Mike D. Rinderknecht for the help in data analysis and critical review of this manuscript, Larissa Angst for the help in preparing and testing the study protocol, and all subjects who volunteered for this study.
References
1. Wyndaele M, Wyndaele JJ. Incidence, prevalence and epidemiology of spinal cord injury: what learns a worldwide literature survey? Spinal Cord (2006) 44:523–9. doi: 10.1038/sj.sc.3101893
2. McColl MA, Walker J, Stirling P, Wilkins R, Corey P. Expectations of life and health among spinal cord injured adults. Spinal Cord (1997) 35:818–28. doi: 10.1038/sj.sc.3100546
3. Samsa GP, Patrick CH, Feussner JR. Long-term survival of veterans with traumatic spinal cord injury. Arch Neurol. (1993) 50:909–14. doi: 10.1001/archneur.1993.00540090018005
4. Myers J, Lee M, Kiratli J. Cardiovascular disease in spinal cord injury: an overview of prevalence, risk, evaluation, and management. Am J Phys Med Rehabil. (2007) 86:142–52. doi: 10.1097/PHM.0b013e31802f0247
5. Buchholz AC, Martin Ginis KA, Bray SR, Craven BC, Hicks AL, Hayes KC, et al. Greater daily leisure time physical activity is associated with lower chronic disease risk in adults with spinal cord injury. Appl Physiol Nutr Metabol. (2009) 34:640–7. doi: 10.1139/H09-050
6. Warburton DE, Nicol CW, Bredin SS. Health benefits of physical activity: the evidence. Can Med Assoc J. (2006) 174:801–9. doi: 10.1503/cmaj.051351
7. Phillips WT, Kiratli BJ, Sarkarati M, Weraarchakul G, Myers J, Franklin BA, et al. Effect of spinal cord injury on the heart and cardiovascular fitness. Curr Prob Cardiol. (1998) 23:641–716. doi: 10.1016/S0146-2806(98)80003-0
8. Rauch A, Hinrichs T, Oberhauser C, Cieza A, SS group. Do people with spinal cord injury meet the WHO recommendations on physical activity? Int J Public Health (2016) 61:17–27. doi: 10.1007/s00038-015-0724-5
9. Anneken V, Hanssen-Doose A, Hirschfeld S, Scheuer T, Thietje R. Influence of physical exercise on quality of life in individuals with spinal cord injury. Spinal Cord (2010) 48:393–9. doi: 10.1038/sc.2009.137
10. Washburn R, Hedrick B. Descriptive epidemiology of physical activity in university graduates with locomotor disabilities. Int J Rehabil Res. (1997) 20:275–88. doi: 10.1097/00004356-199709000-00004
11. Vanhees L, Lefevre J, Philippaerts R, Martens M, Huygens W, Troosters T, et al. How to assess physical activity? How to assess physical fitness? Eur J Cardiovasc Prev Rehabil. (2005) 12:102–14. doi: 10.1097/00149831-200504000-00004
12. Klippel NJ, Heil DP. Validation of energy expenditure prediction algorithms in adults using the Actical electronic activity monitor. Med Sci Sports Exerc. (2003) 35:S284. doi: 10.1097/00005768-200305001-01580
13. Swartz AM, Strath SJ, Bassett DR O, Brien WL, King GA, Ainsworth BE. Estimation of energy expenditure using CSA accelerometers at hip and wrist sites. Med Sci Sport Exerc. 32(9 Suppl.):S450–6. doi: 10.1097/00005768-200009001-00003
14. Freedson PS, Melanson E, Sirard J. (1998). Calibration of the computer science and applications, Inc. accelerometer. Med Sci Sport Exerc. (2000) 30:777–81. doi: 10.1097/00005768-199805000-00021
15. Crouter SE, Bassett DR. A new 2-regression model for the Actical accelerometer. Br J Sports Med. (2008) 42:217–24. doi: 10.1136/bjsm.2006.033399
16. Staudenmayer J, Pober D, Crouter S, Bassett D, Freedson P. An artificial neural network to estimate physical activity energy expenditure and identify physical activity type from an accelerometer. J Appl Physiol. (2009) 107:1300–7. doi: 10.1152/japplphysiol.00465.2009
17. Freedson PS, Lyden K, Kozey-Keadle S, Staudenmayer J. Evaluation of artificial neural network algorithms for predicting METs and activity type from accelerometer data: validation on an independent sample. J Appl Physiol. (2011) 111:1804–12. doi: 10.1152/japplphysiol.00309.2011
18. Brage S, Brage N, Franks PW, Ekelund U, Wong MY,ersen LB, et al. Branched equation modeling of simultaneous accelerometry and heart rate monitoring improves estimate of directly measured physical activity energy expenditure. J Appl Physiol. (2004) 96:343–51. doi: 10.1152/japplphysiol.00703.2003
19. Anastasopoulou P, Tansella M, Stumpp J, Shammas L, Hey S. “Classification of human physical activity and energy expenditure estimation by accelerometry and barometry,” In: 2012 Annual International Conference of the IEEE Engineering in Medicine and Biology Society. San Diego, CA: IEEE (2012).
20. Dannecker KL, Sazonova NA, Melanson EL, Sazonov ES, Browning RC. A comparison of energy expenditure estimation of several physical activity monitors. Med Sci Sport Exerc. (2013) 45:2105. doi: 10.1249/MSS.0b013e318299d2eb
21. Hiremath SV, Ding D, Farringdon J, Cooper RA. Predicting energy expenditure of manual wheelchair users with spinal cord injury using a multisensor-based activity monitor. Arch Phys Med Rehabil. (2012) 93:1937–43. doi: 10.1016/j.apmr.2012.05.004
22. Hiremath S, Ding D, Farringdon J, Vyas N, Cooper R. Physical activity classification utilizing sensewear activity monitor in manual wheelchair users with spinal cord injury. Spinal cord (2013) 51:705–9. doi: 10.1038/sc.2013.39
23. Hiremath SV, Intille SS, Kelleher A, Cooper RA, Ding D. Estimation of energy expenditure for wheelchair users using a physical activity monitoring system. Arch Phys Med Rehabil. (2016) 97:1146–53.e1. doi: 10.1016/j.apmr.2016.02.016
24. Leuenberger K, Gassert R. “Low-power sensor module for long-term activity monitoring,” In: 2011 Annual International Conference of the IEEE Engineering in Medicine and Biology Society. Boston, MA: IEEE (2011).
25. Kirshblum SC, Burns SP, Biering-Sorensen F, Donovan W, Graves DE, Jha A, et al. (2011). International standards for neurological classification of spinal cord injury (revised 2011). J Spinal Cord Med. (2016) 34:535–46. doi: 10.1179/204577211X13207446293695
26. Catz A, Itzkovich M. Spinal Cord Independence Measure: comprehensive ability rating scale for the spinal cord lesion patient. J Rehabil Res Dev. (2007) 44:65. doi: 10.1682/JRRD.2005.07.0123
27. Kalsi-Ryan S, Beaton D, Curt A, Duff S, Popovic MR, Rudhe C, et al. The graded redefined assessment of strength sensibility and prehension: reliability and validity. J Neurotrauma (2012) 29:905–14. doi: 10.1089/neu.2010.1504
28. Kalsi-Ryan S, Curt A, Verrier MC, Fehlings MG. Development of the Graded Redefined Assessment of Strength, Sensibility and Prehension (GRASSP): reviewing measurement specific to the upper limb in tetraplegia. J Neurosurg. (2012) 17(Suppl.1):65–76. doi: 10.3171/2012.6.AOSPINE1258
29. Karantonis DM, Narayanan MR, Mathie M, Lovell NH, Celler BG. Implementation of a real-time human movement classifier using a triaxial accelerometer for ambulatory monitoring. IEEE Transact Inform Technol Biomed. (2006) 10:156–67. doi: 10.1109/TITB.2005.856864
30. Curone D, Bertolotti GM, Cristiani A, Secco EL, Magenes G. A real-time and self-calibrating algorithm based on triaxial accelerometer signals for the detection of human posture and activity. IEEE Transact Inform Technol Biomed. (2010) 14:1098–105. doi: 10.1109/TITB.2010.2050696
31. Maurer U, Rowe A, Smailagic A, Siewiorek D. Location and activity recognition using eWatch: a wearable sensor platform. In: Cai Y, Abascal J, editors. Ambient Intelligence in Everyday Life. Berlin; Heidelberg: Springer (2006). p. 86–102.
32. Bouten CV, Koekkoek KT, Verduin M, Kodde R, Janssen JD. A triaxial accelerometer and portable data processing unit for the assessment of daily physical activity. IEEE Transact Biomed Eng. (1997) 44:136–47. doi: 10.1109/10.554760
33. Ravi N, Dandekar N, Mysore P, Littman ML. Activity Recognition from Accelerometer Data. In: AAAI. Pittsburgh, PA (2005).
34. Herren R, Sparti A, Aminian K, Schutz Y. The prediction of speed and incline in outdoor running in humans using accelerometry. Med Sci Sport Exerc. (1999) 31:1053–9. doi: 10.1097/00005768-199907000-00020
35. Baek J, Lee G, Park W, Yun BJ. “Accelerometer signal processing for user activity detection,” In: International Conference on Knowledge-Based and Intelligent Information and Engineering Systems. Wellington: Springer (2004).
36. Bao L, Intille SS. “Activity recognition from user-annotated acceleration data,” In: International Conference on Pervasive Computing. Linz/Vienna: Springer (2004).
37. Stikic M, Huynh T, Van Laerhoven K, Schiele B. “ADL recognition based on the combination of RFID and accelerometer sensing,” In: 2008 Second International Conference on Pervasive Computing Technologies for Healthcare. Tampere: IEEE (2008).
38. Leuenberger K, Gonzenbach R, Wiedmer E, Luft A, Gassert R. “Classification of stair ascent and descent in stroke patients,” In: Wearable and Implantable Body Sensor Networks Workshops (BSN Workshops), 2014 11th International Conference on IEEE. Zurich (2014).
39. Moncada-Torres A, Leuenberger K, Gonzenbach R, Luft A, Gassert R. Activity classification based on inertial and barometric pressure sensors at different anatomical locations. Physiol Meas. (2014) 35:1245. doi: 10.1088/0967-3334/35/7/1245
40. Popp WL, Brogioli M, Leuenberger K, Albisser U, Frotzler A, Curt A, et al. A novel algorithm for detecting active propulsion in wheelchair users following spinal cord injury. Med Eng Phys. (2016) 38:267–74. doi: 10.1016/j.medengphy.2015.12.011
41. Leuenberger K, Gonzenbach R, Wachter S, Luft A, Gassert R. A method to qualitatively assess arm use in stroke survivors in the home environment. Med Biol Eng Comput. (2016) 55:141–50. doi: 10.1007/s11517-016-1496-7
42. Nightingale T, Walhin J, Thompson D, Bilzon J. Predicting physical activity energy expenditure in wheelchair users with a multisensor device. BMJ Open Sport Exerc Med. (2015) 1:1–8. doi: 10.1136/bmjsem-2015-000008
43. Tofallis C. Least squares percentage regression. J Modern Appl Statist Methods (2009) 7:18. doi: 10.2139/ssrn.1406472
44. Basheer I, Hajmeer M. Artificial neural networks: fundamentals, computing, design, and application. J Microb Methods (2000) 43:3–31. doi: 10.1016/S0167-7012(00)00201-3
45. Hagan MT, Menhaj MB. Training feedforward networks with the Marquardt algorithm. IEEE Trans Neur Netw. (1994) 5:989–93. doi: 10.1109/72.329697
46. Nguyen D, Widrow B. “Improving the learning speed of 2-layer neural networks by choosing initial values of the adaptive weights,” In: IJCNN International Joint Conference on Neural Networks, 1990. San Diego, CA (1990).
47. Mifflin MD, St Jeor ST, Hill LA, Scott BJ, Daugherty SA, Koh Y. A new predictive equation for resting energy expenditure in healthy individuals. Am J Clin Nutr. (1990) 51:241–7. doi: 10.1093/ajcn/51.2.241
48. Harris JA, Benedict FG. A biometric study of human basal metabolism. Proc Natl Acad SciUSA. (1918) 4:370–3. doi: 10.1073/pnas.4.12.370
49. Roza AM, Shizgal HM. The Harris Benedict equation reevaluated: resting energy requirements and the body cell mass. Am J Clin Nutr. (1984) 40:168–82. doi: 10.1093/ajcn/40.1.168
50. Choi BC, Pak AW, Choi JC. Daily step goal of 10,000 steps: a literature review. Clin Invest Med. (2007) 30:146–51. doi: 10.25011/cim.v30i3.1083
51. Hatano Y. Use of the pedometer for promoting daily walking exercise. Int Council Health Phys Educ Recreat. (1993) 29:4–8.
52. Tudor-Locke C, Bassett DR Jr. How many steps/day are enough? Sports Med. (2004) 34:1–8. doi: 10.2165/00007256-200434010-00001
53. U.S. Department of Health and Human Services. Physical Activity Guidelines for Americans. Washington, DC: U.S. Department of Health and Human Services (2008).
54. Haskell WL, Lee I-M, Pate RR, Powell KE, Blair SN, Franklin BA, et al. Physical activity and public health: updated recommendation for adults from the American College of Sports Medicine and the American Heart Association. Circulation (2007) 116:1081. doi: 10.1249/mss.0b013e3180616b27
55. Blair SN, LaMonte MJ, Nichaman MZ. The evolution of physical activity recommendations: how much is enough? Am J Clin Nutr. (2004) 79:913S−20S. doi: 10.1093/ajcn/79.5.913S
56. Wilson T, Bray GA, Temple NJ, Struble MB. Nutrition Guide for Physicians. New York, NY: Springer (2010).
57. Oyster ML, Karmarkar AM, Patrick M, Read MS, Nicolini L, Boninger ML. Investigation of factors associated with manual wheelchair mobility in persons with spinal cord injury. Arch Phys Med Rehabil. (2011) 92:484–90. doi: 10.1016/j.apmr.2010.09.025
58. Sonenblum SE, Sprigle S, Lopez RA. (2012). Manual wheelchair use: bouts of mobility in everyday life. Rehabil Res Prac. 2012:753165. doi: 10.1155/2012/753165
59. Collins EG, Gater D, Kiratli J, Butler J, Hanson K, Langbein WE. Energy cost of physical activities in persons with spinal cord injury. Med Sci Sport Exerc. (2010) 42:691–700. doi: 10.1249/MSS.0b013e3181bb902f
60. Ainsworth BE, Haskell WL, Herrmann SD, Meckes N, Bassett Jr DR, Tudor-Locke C, et al. 2011 Compendium of Physical Activities: a second update of codes and MET values. Med Sci Sport Exerc. (2011) 43:1575–81. doi: 10.1249/MSS.0b013e31821ece12
61. Pate RR, Pratt M, Blair SN, Haskell WL, Macera CA, Bouchard C, et al. Physical activity and public health: a recommendation from the Centers for Disease Control and Prevention and the American College of Sports Medicine. JAMA (1995) 273:402–7. doi: 10.1001/jama.1995.03520290054029
62. Buchholz AC, Pencharz PB. Energy expenditure in chronic spinal cord injury. Curr Opin Clin Nutr Metabol Care (2004) 7:635–9. doi: 10.1097/00075197-200411000-00008
63. Lee SY, Gallagher D. Assessment methods in human body composition. Curr Opin Clin Nutr Metabol Care (2008) 11:566. doi: 10.1097/MCO.0b013e32830b5f23
64. Hiremath SV, Intille SS, Kelleher A, Cooper RA, Ding D. Detection of physical activities using a physical activity monitor system for wheelchair users. Med Eng Phys. (2015) 37:68–76. doi: 10.1016/j.medengphy.2014.10.009
65. Yamazaki T, Gen-No H, Kamijo Y, Okazaki K, Masuki S, Nose H. A new device to estimate VO2 during incline walking by accelerometry and barometry. Med Sci Sport Exerc. (2009) 41:2213–9. doi: 10.1249/MSS.0b013e31819c452
66. Ainslie PN, Reilly T, Westerterp KR. Estimating human energy expenditure. Sports Med. (2003) 33:683–98. doi: 10.2165/00007256-200333090-00004
67. Brogioli M, Popp WL, Albisser U, Brust AK, Frotzler A, Gassert R, et al. Novel sensor technology to assess independence and limb-use laterality in cervical spinal cord injury. J Neurotrauma (2016) 33:1950–7. doi: 10.1089/neu.2015.4362
68. Brogioli M, Schneider S, Popp WL, Albisser U, Brust AK, Velstra IM, et al. Monitoring Upper limb recovery after cervical spinal cord injury: insights beyond assessment scores. Front Neurol. (2016) 7:142. doi: 10.3389/fneur.2016.00142
Keywords: energy expenditure, spinal cord injury, inertial measurement unit, long-term activity monitoring, wheelchair, estimation model
Citation: Popp WL, Richner L, Brogioli M, Wilms B, Spengler CM, Curt AEP, Starkey ML and Gassert R (2018) Estimation of Energy Expenditure in Wheelchair-Bound Spinal Cord Injured Individuals Using Inertial Measurement Units. Front. Neurol. 9:478. doi: 10.3389/fneur.2018.00478
Received: 08 February 2018; Accepted: 01 June 2018;
Published: 03 July 2018.
Edited by:
Mattias K. Sköld, Uppsala University, SwedenReviewed by:
Rosa Margarita Gomez, Independent Researcher, ColombiaHari S. Sharma, Uppsala University, Sweden
Mariella Pazzaglia, Sapienza Università di Roma, Italy
Copyright © 2018 Popp, Richner, Brogioli, Wilms, Spengler, Curt, Starkey and Gassert. This is an open-access article distributed under the terms of the Creative Commons Attribution License (CC BY). The use, distribution or reproduction in other forums is permitted, provided the original author(s) and the copyright owner(s) are credited and that the original publication in this journal is cited, in accordance with accepted academic practice. No use, distribution or reproduction is permitted which does not comply with these terms.
*Correspondence: Werner L. Popp, werner.popp@hest.ethz.ch