 Canlin Liao
 Haixiong Xu
 Mingfa Liu
- Department of Neurosurgery, Shantou Central Hospital, Shantou, Guangdong, China
Background: Insulin resistance (IR) is involved in the pathogenesis of atherosclerosis. As a new indicator, the triglyceride-glucose (TyG) index has greater operability for the evaluation of insulin resistance. Previous studies have shown inconsistent results in evaluating the association between the TyG index and stroke incidence in people without stroke at baseline. Therefore, this study aimed to systematically assess this association through a meta-analysis.
Methods: Cohort studies with the multivariate-adjusted hazard ratio (HR) association between the TyG index and stroke were obtained by searching the PubMed, Cochrane Library, and EMBASE databases before 16 December 2021. We pooled the adjusted HR along with 95% CI using a random-effects model. The primary outcome was stroke including ischemic and hemorrhagic stroke. We conducted subgroup analyses stratified by study design, ethnicity, characteristics of participants, weight of studies, and length of follow-up duration. Review Manager 5.3 and Stata 17 were used to perform the meta-analysis.
Results: Eight cohort studies with 5,804,215 participants were included. The results showed that participants with the highest TyG index category at baseline compared to those with the lowest TyG index category were independently associated with a higher risk of stroke (HR: 1.26, 95% CI: 1.24–1.29, I2 = 0%, P < 0.001). This finding was consistent with the results of the meta-analysis with the TyG index analyzed as a continuous variable (HR per each-unit increment of the TyG index: 1.13, 95% CI 1.09–1.18, I2 = 0%, P < 0.001). Subgroup analysis had no significant effects (for subgroup analysis, all P > 0.05). No significant heterogeneity was observed among the included cohort studies.
Conclusion: A higher TyG index may be independently associated with a higher risk of stroke in individuals without stroke at baseline. The aforementioned findings need to be verified by a large-scale prospective cohort study to further clarify the underlying pathophysiological mechanism between the TyG index and stroke.
1. Introduction
Stroke is one of the most devastating diseases in the world. Globally, it is the second leading cause of the increase in years of life lost (1). In addition, the increasingly youthful trend of stroke deserves our great attention (2). Ischemic stroke is the result of blood circulation disorders in the cerebral blood vessels caused by occlusion of the large cerebral arteries, which occurs more commonly in the middle cerebral artery (3) or cerebral small vessel disease (4). Previous studies have demonstrated that insulin resistance plays an important role in the pathogenesis of ischemic stroke (5).
The hyperinsulinemic–euglycemic clamp test (HIEC) is the gold standard for assessing insulin resistance. Due to the complexity of the test process, the extensive time required, and the high cost, its clinical application is very limited (6). The homeostasis model assessment of insulin resistance (HOMA-IR) index is not very convenient and economical in clinical application, although it is the most accessible indicator for evaluating insulin resistance in clinical practice (7).
As a novel surrogate indicator of insulin resistance, the triglyceride-glucose (TyG) index, derived from the fasting triglyceride and glucose levels, is convenient and quick to obtain, economical, and reliable (8). The TyG index can be calculated as follows: ln [triglyceride level (mg/dL) ×fasting blood glucose level (mg/dL)/2] (9, 10). Studies have confirmed that the TyG index is significantly correlated with both HIEC and HOMA-IR (11). Therefore, the TyG index can be used as an easily accessible and operational index of insulin resistance.
Observational studies have revealed a relationship between a high TyG index and stroke in their populations. However, most of them were cross-sectional studies (12, 13). Recently, as an increasing number of cohort studies on stroke and the TyG index have been published, we have found inconsistent results (14–17). Therefore, our study aimed to summarize the association between the baseline TyG index and stroke incidence in patients without stroke at baseline.
2. Methods
This meta-analysis was based on the Preferred Reporting Items for Systematic Reviews and Meta-Analysis (18) (http://www.prisma-statement.org/) and Cochrane Handbook (19, 20). Electronic databases including PubMed, the Cochrane Library (CENTRAL), and EMBASE were searched for relevant studies and literature.
2.1. Study selection
Studies adhering to all the following criteria were included: (1) Participants were adults with no stroke at baseline; (2) cohort studies were published as full-length articles in English; (3) the TyG index was measured at baseline; (4) the outcome included the occurrence of a stroke or ischemic stroke; (5) risk factors adjusted for potential confounders were reported; and (6) hazard ratios (HRs) were reported. In contrast, studies were excluded from the meta-analysis if they met at least one of the following criteria: (1) participants were <18 years of age; (2) the studies were not cohort studies; (3) there was no reporting of stroke; (4) there was no measurement of the TyG index; (5) reported data were based on univariate analysis rather than multivariate analysis; and (6) HRs were not reported.
Two researchers (CL and KX) used the PICOS principles to search for related literature and independently evaluated the literature. Disputes were resolved after a discussion with a third researcher (LZ).
2.2. Data extraction
Two researchers (CL and KX) independently extracted data from the articles. The extracted content included the names of the authors, publication year, study design, country, participant characteristics, average age, proportion of male participants, proportion of patients with diabetes, TyG index analysis, follow-up duration, and result validation. After data extraction, the two researchers exchanged data for verification.
2.3. Literature search
The PubMed, Cochrane Library (CENTRAL), and EMBASE databases were searched using a combination of the following terms: (1) “triglyceride and glucose index” OR “triglyceride-glucose index *” OR “TyG index” OR “triglyceride glucose index” OR “triacylglycerol glucose index”; (2) “stroke” OR “Cerebrovascular Accident” OR “Cerebrovascular Accidents” OR “CVA” OR CVAs; OR “Apoplexy” OR “Brain Vascular Accident” OR “Brain Vascular Accidents” (Supplementary Table S1). Reference lists of original and review articles that are related were manually searched for potentially eligible studies. The final literature search was conducted on 16 December 2021.
2.3. Literature screening
The search results obtained from the PubMed, Cochrane Library (CENTRAL), and EMBASE databases were exported to Endnote X9, whose function of “duplicate finder” was used to identify and remove repetitive literature. Literature screening was divided into two stages. First, we conducted a preliminary screening based on the titles and abstracts of the literature to obtain possibly eligible, eligibility-unknown, and clearly eligible literature. For literature that might be eligible and those whose eligibility was unknown, their full-length texts were obtained and further selected according to the inclusion and exclusion criteria, thus obtaining eligible studies. Titles, abstracts, and full-length texts were selected by two researchers (ZX and LZ), strictly and independently, based on the inclusion and exclusion criteria. When the screening results were inconsistent, the two researchers discussed and negotiated with each other to reach a consensus. If the negotiation failed, we consulted a third researcher (TJ) and adopted his opinion.
2.3.1. Quality evaluation
The Newcastle–Ottawa Scale (20) was used to evaluate the quality of each study according to the selection of the study groups, comparability of the groups, and ascertainment of the outcome of interest. The scale ranges from 1 to 9, and studies with test results of more than six are classified as high quality. The assessment was performed independently by two researchers (LZ and ZX). Any disagreement between researchers was resolved by consensus. If the negotiation failed, we consulted a third researcher (TJ) and adopted his opinion.
2.3.2. Data analyses
Hazard ratios and their corresponding 95% confidence intervals (CIs) were used as a general measure of the association between the TyG index and stroke in people who had no stroke at the baseline examination. For the study that analyzed the TyG index as a categorical variable, the HRs of the incidence of stroke in participants with the highest TyG index level compared to those with the lowest TyG index level were extracted. For studies where the TyG index was analyzed as a continuous variable, the HRs of stroke incidence were extracted for each-unit increment of the TyG index. The Cochran Q-test and I2 estimation were used to assess the heterogeneity of the included cohort studies (21). If I2 was <50%, it was considered that there was no significant heterogeneity. In addition, a random-effect model was used to synthesize HRs data, as this model was considered a more general method that could incorporate potential heterogeneity into the study (19). Furthermore, sensitivity analyses, excluding one individual study at a time, were conducted to test the stability of the results (22). Predefined subgroup analyses were also performed to evaluate the impact of study characteristics, including study design, participant characteristics, participant ethnicity, weight of studies, and follow-up duration on the association between the TyG index and stroke incidence. All studies included adjusted variables. The baseline TyG index was analyzed as categorical variables The median, quartile, or quintile was used to divide the research participants into a higher TyG index group and a lower TyG index group. After adjusting for variables, the HRs and 95% CIs of stroke or ischemic stroke were calculated in the higher TyG index group during the follow-up period, with the lowest TyG index group as a reference. Potential publication bias was assessed by visual inspection of the funnel plot symmetry. Review Manager (version 5.3; Cochrane Collaboration, Oxford, UK) and Stata 17 (Stata Corp., College Station, Texas, USA) were used to perform the statistical analyses.
3. Results
3.1. Process and results of the literature screening
The search strategy retrieved 129 articles through PubMed, Cochrane Library (CENTRAL), and EMBASE databases (Figure 1). A total of 114 articles were obtained after excluding 15 duplications. Eight studies comprising 5,804,215 participants were included in the meta-analysis after further evaluation of the abstract and full-length text twice, according to the inclusion criteria.
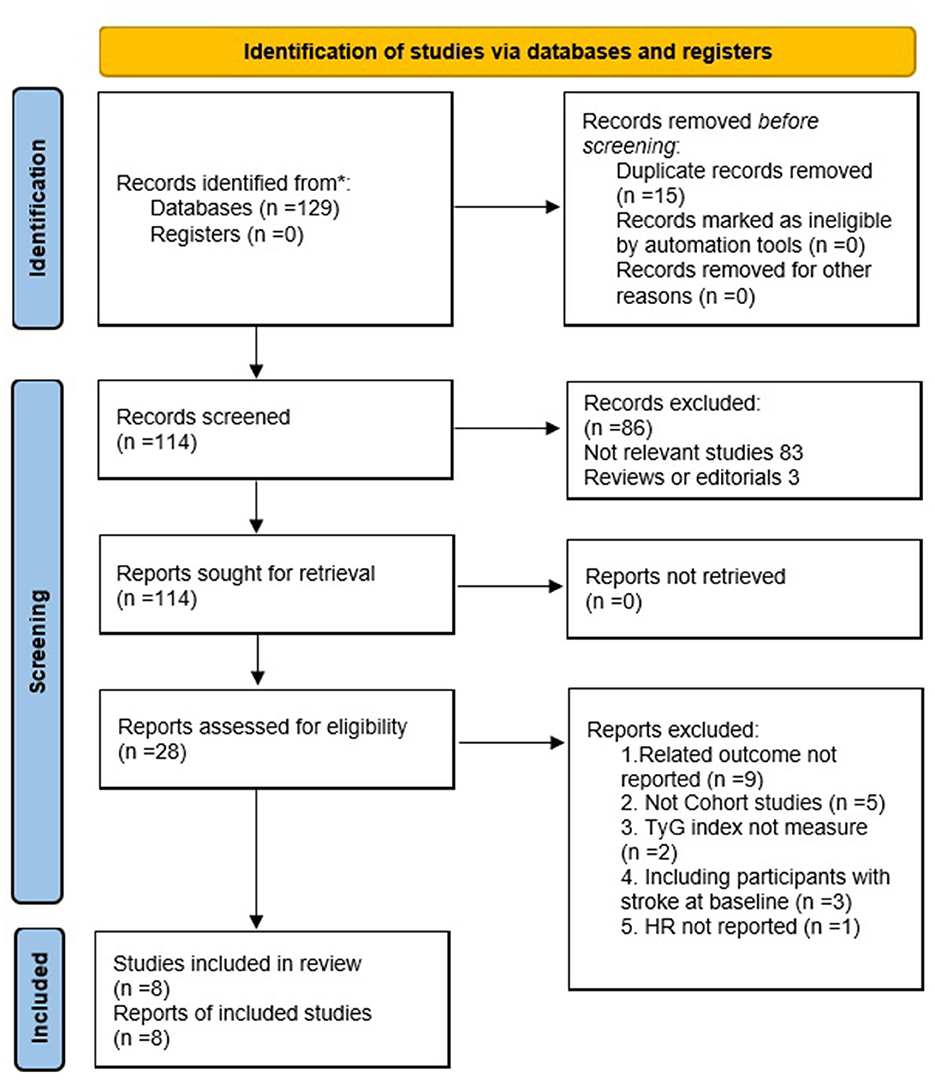
Figure 1. Flowchart of the databases search and study identification.
3.2. Study characteristics and quality evaluation
3.2.1. Study characteristics
The characteristics of the eight cohort studies (14–17), included the name of the author(s), publication year, study design, country, participant characteristics, number of participants, average age of participant, proportion of men, proportion of patients with diabetes, TyG index analysis, follow-up duration, result verification, outcome reported, and adjusted variables (Table 1). Overall, eight cohort studies with 5,804,215 participants were included. Four out of the eight were prospective cohort studies (16, 17, 25, 26), and the remaining four were retrospective cohort studies (14, 15, 23, 26). The research participants of four studies were participants without stroke in the community (14, 16, 23, 24), while those of the other studies were outpatients or inpatients in hospitals (15, 17, 25, 26). The studies were performed in China (14–16, 24–26), South Korea (23), and Spain (17). These studies were published from 2016 to 2021, where patients at baseline were followed up for time ranging from post-intervention to 11.02 years. Five studies (14, 16, 17, 23, 24) were followed for more than 5 years and three studies (15, 25, 26) for less than 5 years. The two articles produced by the Kailuan study provided different variables, with one for categorical (16) and the other for continuous (24).
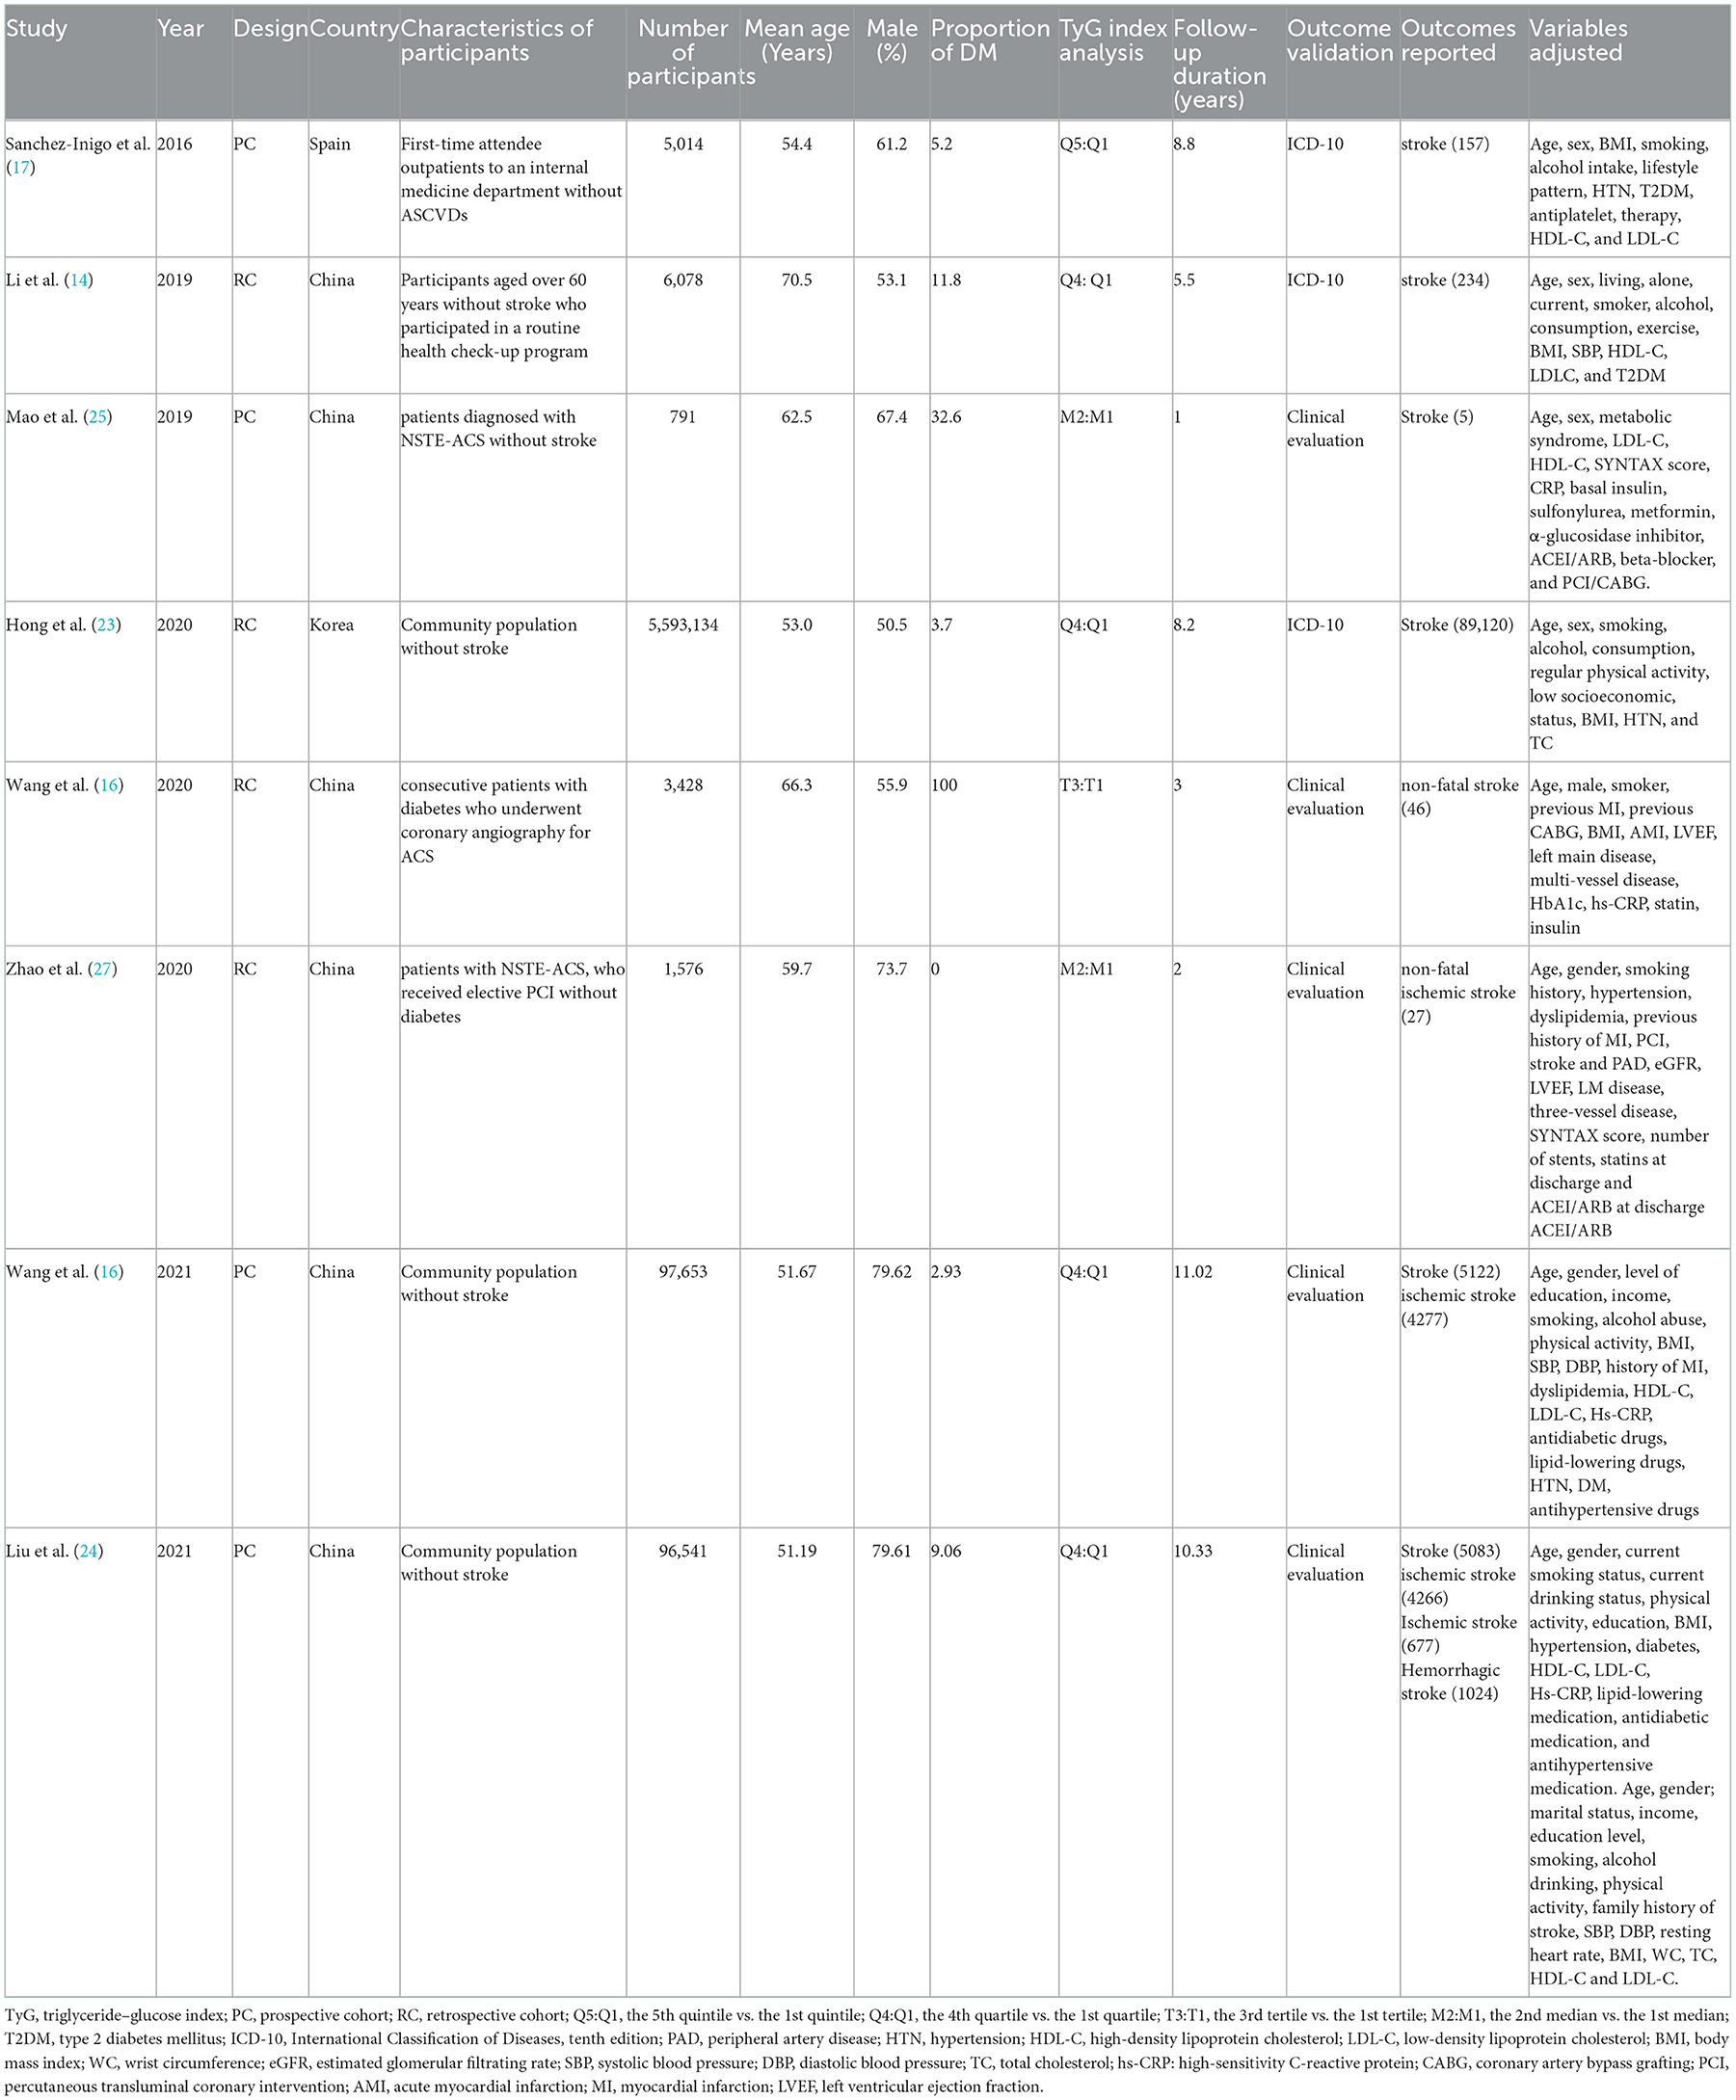
Table 1. Characteristics of the included cohort studies.
3.2.2. Quality evaluation
Eight studies included in this meta-analysis were cohort studies. The Newcastle–Ottawa Scale (20) was used to evaluate their quality, and the results showed that three studies scored seven points and the other five studies scored nine points. All included cohort studies were judged high quality (Table 2).
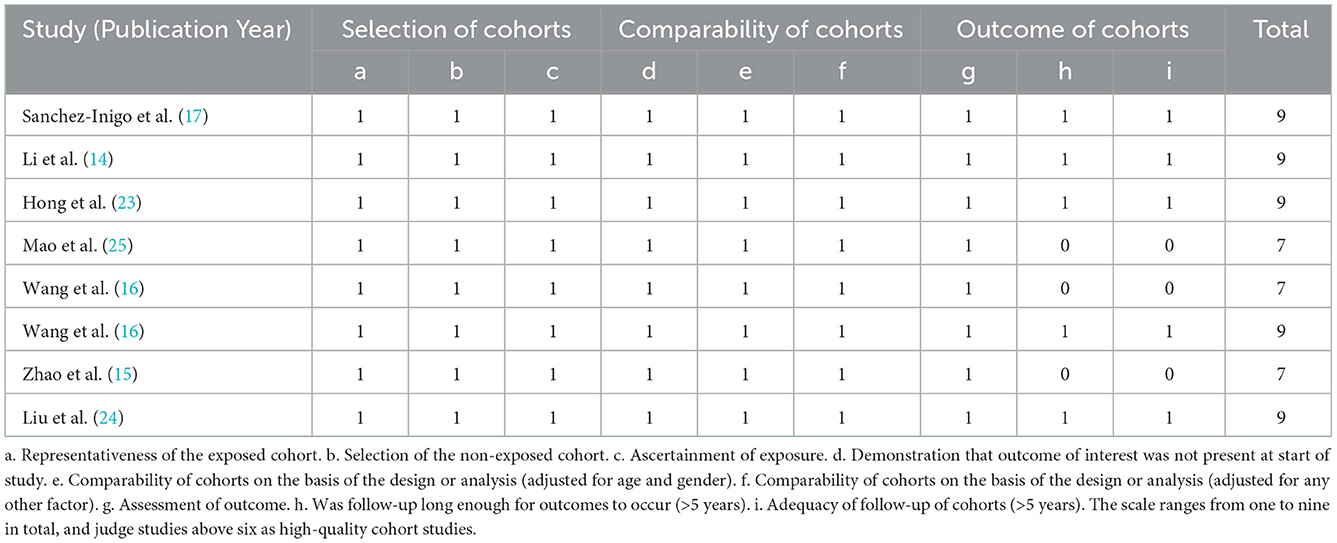
Table 2. Details of quality evaluation via the Newcastle–Ottawa Scale.
3.2.3. Results of the meta-analysis of the cohort studies
Using a random-effects model, the pooled results of seven cohort studies (14–17, 23, 25–27) showed that compared to participants with the lowest TyG index category at baseline, those with the highest TyG index category had a significantly increased incidence of stroke during the follow-up (HR: 1.26, 95% CI: 1.24–1.29, I2 = 0%, P < 0.001; Figure 2A). This finding was consistent with the TyG index analyzed as a continuous variable (four studies, HR per each-unit increment of the TyG index: 1.13, 95% CI 1.09–1.18, I2 = 0%, P < 0.001; Figure 2B). Subgroup analyses showed a consistent association between the prospective studies (HR: 1.33, 95% CI: 1.22–1.45, I2 = 0%, P < 0.001; Figure 3A) and retrospective studies (HR: 1.26, 95% CI: 1.23–1.29, I2 = 0%, P < 0.001; Figure 3A); the community population (HR: 1.26, 95% CI: 1.24–1.29, I2 = 0%, P < 0.001; Figure 3B) and outpatient or inpatient populations (HR: 1.76, 95% CI: 1.19–2.60, I2 = 0%, P = 0.005; Figure 3B); Chinese (HR: 1.33, 95% CI: 1.22–1.44, I2 = 0%, P < 0.001; Figure 3C), non-Chinese participants (HR: 1.26, 95% CI: 1.23–1.29, I2 = 0%, P < 0.001; Figure 3C); higher weight (HR: 1.26, 95% CI: 1.23–1.29, I2 = 4%, P < 0.001; Figure 3D) and lower weight (HR: 1.43, 95% CI: 1.10–1.86, I2 = 0%, P = 0.008; Figure 3D); follow-up duration more than 5 years (HR: 1.26, 95% CI: 1.24–1.29, I2 = 0%, P < 0.001; Figure 3E) and less than 5 years (HR: 1.86, 95% CI: 1.09–3.19, I2 = 0%, P = 0.02; Figure 3E). The leave-one-out analysis showed similar results (Supplementary Figure S1).
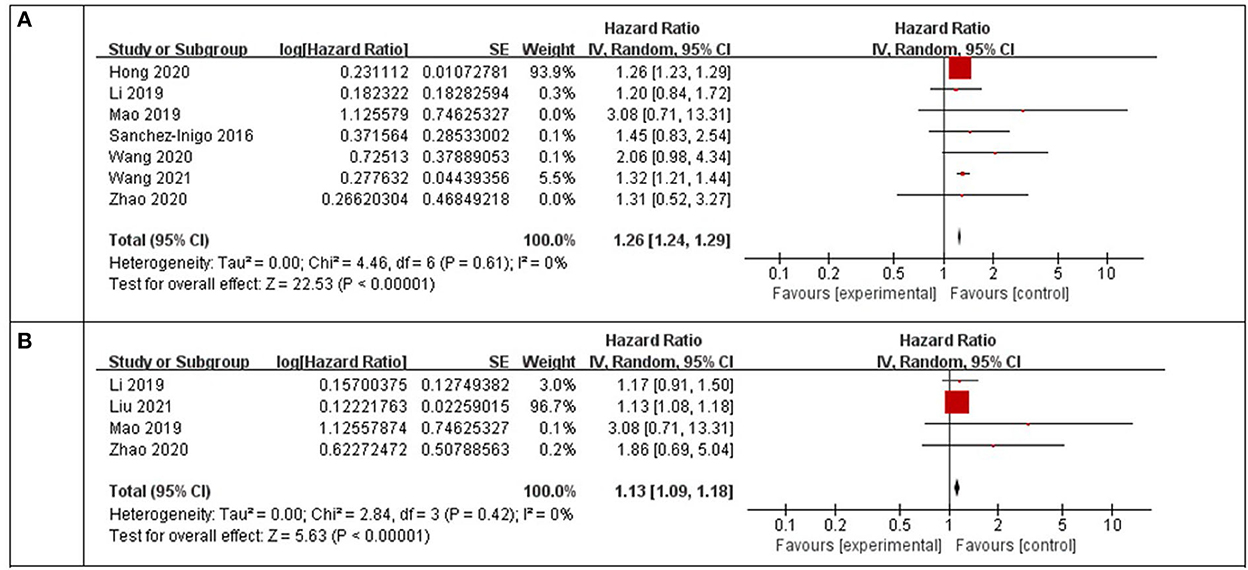
Figure 2. Forest plots for the meta-analysis of the association between the TyG index and the risk of stroke. (A) Meta-analysis with the TyG index analyzed as a categorical variable. (B) Meta-analysis with the TyG index analyzed as a continuous variable.
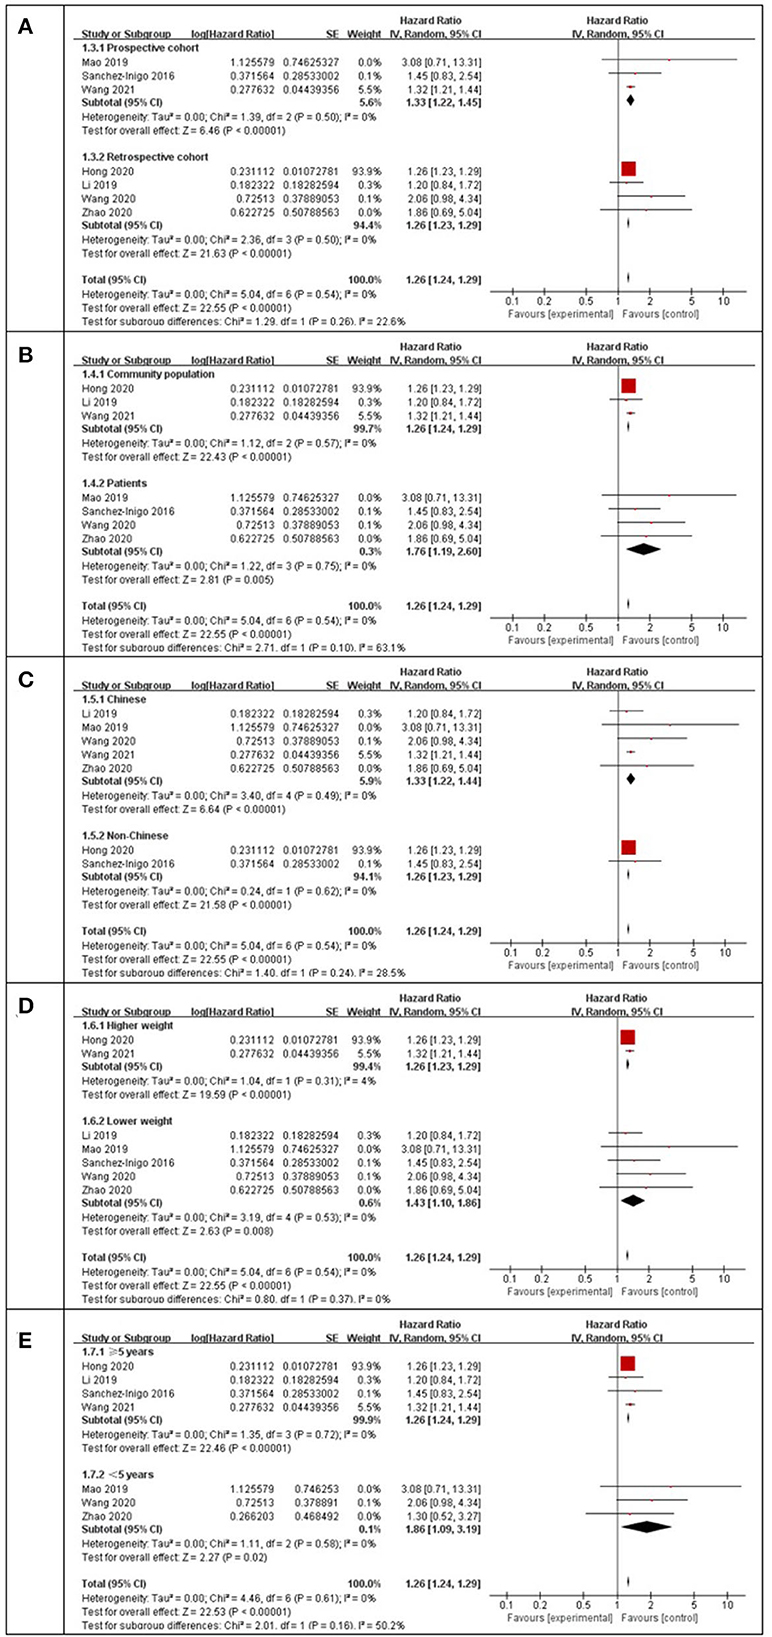
Figure 3. Subgroup analysis for the Meta-analysis of association between the TyG index and the risk of stroke. (A) Subgroup analysis according to study design. (B) Subgroup analysis according to characteristics of participants. (C) Subgroup analysis according to the ethnicity of the population. (D) Subgroup analysis according to the weight of studies. (E) Subgroup analysis according to the length of follow-up duration.
3.2.4. Publication bias
Funnel plots were drawn using stroke as an outcome indicator to observe publication bias in the eight cohort studies. Funnel plots were symmetric on visual inspection, suggesting a low risk of publication bias (Figure 4). As only eight studies (14–17, 23–26) were included, < 10 studies were required, and the Egger regression test could not be performed in this study (28).
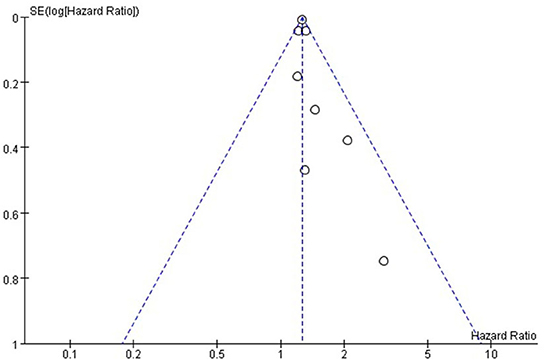
Figure 4. Funnel plot for the publication bias underlying the metaanalysis of the associtation between TyG index and stroke.
4. Discussion
This meta-analysis of cohort studies showed that a higher TyG index at baseline was independently associated with an increased incidence of stroke regardless of whether the TyG index was analyzed as a categorical or continuous variable. Moreover, consistent results were obtained in subgroup analysis according to the study design, ethnicity, characteristics of participants, weight of studies, and length of follow-up duration. These results suggest that a higher TyG index may be an independent predictor of increased stroke incidence in the general adult population without stroke at baseline.
Our meta-analysis has some advantages and is included below. First, only cohort studies were included; thus, potential recall bias associated with the cross-sectional design was avoided. In addition, in order to have a more accurate statistical description and significance for cohort studies, we included only studies with multivariate-adjusted HR, which not only avoids potential confounding biases but also provides an independent association between the TyG index and stroke. Moreover, all the included studies are high-quality cohort studies with large numbers of participants. Otherwise, sensitivity and subgroup analyses were performed for all included studies to ensure the robustness of the results. Finally, all the I2 in the meta-analysis were lower than in previous studies, and no significant heterogeneity was observed among the included cohort studies. Our meta-analysis demonstrated the association between the TyG index and the increased incidence of stroke which indicates underlying pathophysiological mechanisms between insulin resistance and stroke exists. Insulin resistance not only enhances the adhesion, activation, and aggregation of platelets, but it also causes hemodynamic disturbances, all of which are conducive to the occurrence of ischemic stroke (5). In addition, it can cause an imbalance in glucose metabolism, leading to chronic hyperglycemia. This, in turn, triggers oxidative stress and inflammation, leading to cell damage and atherosclerotic plaque formation (29).
The TyG index, as a result of triglycerides and fasting blood glucose, has been recognized as a simple and reliable surrogate indicator of insulin resistance (30). In clinical applications, it is economical to measure blood triglycerides and fasting blood glucose, and the TyG index can be obtained through simple calculations. A previous study proved that the TyG index has high sensitivity and specificity in detecting insulin resistance (10), and it is superior to HOMA-IR (31). Moreover, compared with HOMA-IR, the TyG index, which does not require measurement of insulin levels, can be conveniently and economically used for all patients and healthy people and is also suitable for large-scale screening of insulin resistance. However, further studies are needed to conduct whether the TyG index could be added to stroke prediction tools such as the Framingham Stroke Risk Profile (32) and measure the critical value of the TyG index in the general adult population.
When the results of the meta-analysis are interpreted, some limitations should be observed. First, in the subgroup analysis, only the study design, participant characteristics, participant ethnicity, weight of studies, and follow-up duration were analyzed. More research is needed to determine whether other research characteristics will affect the results, such as sex, diabetes status, and concurrent medications used. Third, among the studies we eventually included, there were six Chinese studies and only two non-Chinese studies, one from Asia and the other from Europe. Data from other countries such as the United States, Australia, and Africa are still scarce, thus, a more detailed ethnic subgroup analysis should be conducted. Fourth, owing to the limitations of the research data, hemorrhagic stroke cannot be evaluated in a systematic manner. Fifth, although the cohort studies included were all adjusted for in the multivariate analysis, the influence of unadjusted participating factors in the cohort studies could not be ruled out based on the HR of the study and the association between the TyG index and the incidence of stroke. Similarly, we do not know whether the data before the multivariate adjustment had an impact on the study. Finally, even though we conducted a subgroup analysis, we found a significant effect after excluding two larger studies (16, 23), which had a combined weight of 99.4% and had a major influence on the meta-analysis.
5. Conclusion
A higher TyG index may be independently associated with a higher risk of stroke in individuals without stroke at baseline. The aforementioned findings need to be verified by a large-scale prospective cohort study to further clarify the underlying pathophysiological mechanism between the TyG index and stroke.
Data availability statement
The raw data supporting the conclusions of this article will be made available by the authors, without undue reservation.
Author contributions
CL, KX, and LZ conceived, designed the research, performed the literature search, and data extraction. ZX, LZ, and TJ performed the literature screening and quality evaluation. CL and KX analyze data and wrote the initial manuscript. HX and ML revised the manuscript. ML had primary responsibility for the final content. All authors reviewed, revised, and approved the final manuscript for submission.
Acknowledgments
We would like to thank Editage (www.editage.cn) for English language editing.
Conflict of interest
The authors declare that the research was conducted in the absence of any commercial or financial relationships that could be construed as a potential conflict of interest.
Publisher's note
All claims expressed in this article are solely those of the authors and do not necessarily represent those of their affiliated organizations, or those of the publisher, the editors and the reviewers. Any product that may be evaluated in this article, or claim that may be made by its manufacturer, is not guaranteed or endorsed by the publisher.
Supplementary material
The Supplementary Material for this article can be found online at: https://www.frontiersin.org/articles/10.3389/fneur.2022.1033385/full#supplementary-material
References
1. Collaborators GBDCoD. Global, regional, and national age-sex specific mortality for 264 causes of death, 1980-2016: a systematic analysis for the Global Burden of Disease Study 2016. Lancet. (2017) 390:1151–210. doi: 10.1016/S0140-6736(17)32152-9
2. Ekker MS, Verhoeven JI, Vaartjes I, van Nieuwenhuizen KM, Klijn CJM, de Leeuw FE. Stroke incidence in young adults according to age, subtype, sex, and time trends. Neurology. (2019) 92:e2444–e54. doi: 10.1212/WNL.0000000000007533
3. Feigin VL, Nguyen G, Cercy K, Johnson CO, Alam T, et al. Global, regional, and country-specific lifetime risks of stroke, 1990 and 2016. N Engl J Med. (2018) 379:2429–37. doi: 10.1056/NEJMoa1804492
4. Gorelick PB, Counts SE, Nyenhuis D. Vascular cognitive impairment and dementia. Biochim Biophys Acta. (2016) 1862:860–8. doi: 10.1016/j.bbadis.2015.12.015
5. Deng XL, Liu Z, Wang C, Li Y, Cai Z. Insulin resistance in ischemic stroke. Metab Brain Dis. (2017) 32:1323–34. doi: 10.1007/s11011-017-0050-0
6. Cersosimo E, Solis-Herrera C, Trautmann ME, Malloy J, Triplitt CL. Assessment of pancreatic beta-cell function: review of methods and clinical applications. Curr Diabetes Rev. (2014) 10:2–42. doi: 10.2174/1573399810666140214093600
7. Matthews DR, Hosker JP, Rudenski AS, Naylor BA, Treacher DF, Turner RC. Homeostasis model assessment: insulin resistance and beta-cell function from fasting plasma glucose and insulin concentrations in man. Diabetologia. (1985) 28:412–9. doi: 10.1007/BF00280883
8. Unger G, Benozzi SF, Perruzza F, Pennacchiotti GL. Triglycerides and glucose index: a useful indicator of insulin resistance. Endocrinol Nutr. (2014) 61:533–40. doi: 10.1016/j.endoen.2014.11.006
9. Simental-Mendia LE, Rodriguez-Moran M, Guerrero-Romero F. The product of fasting glucose and triglycerides as surrogate for identifying insulin resistance in apparently healthy subjects. Metab Syndr Relat Disord. (2008) 6:299–304. doi: 10.1089/met.2008.0034
10. Guerrero-Romero F, Simental-Mendia LE, Gonzalez-Ortiz M, Martinez-Abundis E, Ramos-Zavala MG, Hernandez-Gonzalez SO, et al. The product of triglycerides and glucose, a simple measure of insulin sensitivity. Comparison with the euglycemic-hyperinsulinemic clamp. J Clin Endocrinol Metab. (2010) 95:3347–51. doi: 10.1210/jc.2010-0288
11. Khan SH, Sobia F, Niazi NK, Manzoor SM, Fazal N, Ahmad F. Metabolic clustering of risk factors: evaluation of Triglyceride-glucose index (TyG index) for evaluation of insulin resistance. Diabetol Metab Syndr. (2018) 10:74. doi: 10.1186/s13098-018-0376-8
12. Zhou Y, Pan Y, Yan H, Wang Y, Li Z, Zhao X, et al. Triglyceride glucose index and prognosis of patients with ischemic stroke. Front Neurol. (2020) 11:456. doi: 10.3389/fneur.2020.00456
13. Shi W, Xing L, Jing L, Tian Y, Yan H, Sun Q, et al. Value of triglyceride-glucose index for the estimation of ischemic stroke risk: Insights from a general population. NMCD. (2020) 30:245–53. doi: 10.1016/j.numecd.2019.09.015
14. Li S, Guo B, Chen H, Shi Z, Li Y, Tian Q, et al. The role of the triglyceride (triacylglycerol) glucose index in the development of cardiovascular events: a retrospective cohort analysis. Sci Rep. (2019) 9:7320. doi: 10.1038/s41598-019-43776-5
15. Zhang TY, Cheng YJ., Ma Y, Xu YK, Yang JQ, et al. Triglyceride-glucose index as a surrogate marker of insulin resistance for predicting cardiovascular outcomes in nondiabetic patients with non-st-segment elevation acute coronary syndrome undergoing percutaneous coronary. Int. J. Atheroscler. Thrombo. (2020) 28:1175–94. doi: 10.5551/jat.59840
16. Wang A, Wang G, Liu Q, Zuo Y, Chen S, Tao B, et al. Triglyceride-glucose index and the risk of stroke and its subtypes in the general population: an 11-year follow-up. Cardiovas. Diabetol. (2021) 20:1–9. doi: 10.1186/s12933-021-01238-1
17. Sanchez-Inigo L, Navarro-Gonzalez D, Fernandez-Montero A, Pastrana-Delgado J, Martinez JA. The TyG index may predict the development of cardiovascular events. Eur J Clin Invest. (2016) 46:189–97. doi: 10.1111/eci.12583
18. Stroup DF, Berlin JA, Morton SC, Olkin I, Williamson GD, Rennie D, et al. Meta-analysis of observational studies in epidemiology: a proposal for reporting. MOOSE. (2000) 283:2008–12. doi: 10.1001/jama.283.15.2008
19. Higgins JGS. Cochrane Handbook for Systematic Reviews of Interventions Version 5.1.0. The Cochrane Collaboration. (2011) Available online at: www.cochranehandbook.org (accessed December 25, 2021).
20. Wells GA, Shea B, O'connell D, Peterson J, Welch V, Losos M. The Newcastle-Ottawa Scale. (NOS) for Assessing the Quality of Non-Randomised Studies in Meta-Analyses. (2010). Available online at: http://www.ohri.ca/programs/clinical_epidemiology/oxford.asp
21. Higgins JP, Thompson SG. Quantifying heterogeneity in a meta-analysis. Stat Med. (2002) 21:1539–58. doi: 10.1002/sim.1186
22. Patsopoulos NA, Evangelou E, Ioannidis JP. Sensitivity of between-study heterogeneity in meta-analysis: proposed metrics and empirical evaluation. Int J Epidemiol. (2008) 37:1148–57. doi: 10.1093/ije/dyn065
23. Hong S, Han K, Park C-Y. The triglyceride glucose index is a simple and low-cost marker associated with atherosclerotic cardiovascular disease: a population-based study. BMC Med. (2020) 18:2. doi: 10.1186/s12916-020-01824-2
24. Liu Q, Cui H, Ma Y, Han X, Cao Z, Wu Y. Triglyceride-glucose index associated with the risk of cardiovascular disease: the Kailuan study. Endocrine. (2022) 75:392–9. doi: 10.1007/s12020-021-02862-3
25. Mao Q, Zhou D, Li Y, Wang Y, Xu SC, Zhao XH. The triglyceride-glucose index predicts coronary artery disease severity and cardiovascular outcomes in patients with non-ST-segment elevation acute coronary syndrome. Dis Markers. (2019) 2019:6891537. doi: 10.1155/2019/6891537
26. Cong HL, Zhang JX., Hu YC, Wei A, Zhang YY, et al. Triglyceride-glucose index predicts adverse cardiovascular events in patients with diabetes and acute coronary syndrome. Cardiovas. Diabetol. (2020) 19:1–11. doi: 10.1186/s12933-020-01054-z
27. Zhao Y, Sun H, Zhang W, Xi Y, Shi X, Yang Y, et al. Elevated triglyceride–glucose index predicts risk of incident ischaemic stroke: the Rural Chinese cohort study. Diab. Metab. (2021) 47:101246. doi: 10.1016/j.diabet.2021.101246
28. Egger M, Davey Smith G, Schneider M, Minder C. Bias in meta-analysis detected by a simple, graphical test. BMJ. (1997) 315:629–34. doi: 10.1136/bmj.315.7109.629
29. Ormazabal V, Nair S, Elfeky O, Aguayo C, Salomon C, Zuniga FA. Association between insulin resistance and the development of cardiovascular disease. Cardiovasc Diabetol. (2018) 17:122. doi: 10.1186/s12933-018-0762-4
30. Du T, Yuan G, Zhang M, Zhou X, Sun X, Yu X. Clinical usefulness of lipid ratios, visceral adiposity indicators, and the triglycerides and glucose index as risk markers of insulin resistance. Cardiovasc Diabetol. (2014) 13:146. doi: 10.1186/s12933-014-0146-3
31. Vasques AC, Novaes FS, de Oliveira Mda S, Souza JR, Yamanaka A, Pareja JC, et al. TyG index performs better than HOMA in a Brazilian population: a hyperglycemic clamp validated study. Diabetes Res Clin Pract. (2011) 93:e98–100. doi: 10.1016/j.diabres.2011.05.030
Keywords: triglyceride-glucose index, insulin resistance, stroke, meta-analysis triglyceride-glucose index, meta-analysis
Citation: Liao C, Xu H, Jin T, Xu K, Xu Z, Zhu L and Liu M (2023) Triglyceride-glucose index and the incidence of stroke: A meta-analysis of cohort studies. Front. Neurol. 13:1033385. doi: 10.3389/fneur.2022.1033385
Received: 31 August 2022; Accepted: 05 December 2022;
Published: 04 January 2023.
Edited by:
Hari Kishan Reddy Indupuru, University of Texas Health Science Center at Houston, United StatesReviewed by:
Xuesong Bai, Xuanwu Hospital, Capital Medical University, ChinaCong Hongliang, Tianjin Medical University, China
Copyright © 2023 Liao, Xu, Jin, Xu, Xu, Zhu and Liu. This is an open-access article distributed under the terms of the Creative Commons Attribution License (CC BY). The use, distribution or reproduction in other forums is permitted, provided the original author(s) and the copyright owner(s) are credited and that the original publication in this journal is cited, in accordance with accepted academic practice. No use, distribution or reproduction is permitted which does not comply with these terms.
*Correspondence: Mingfa Liu,  stlmf1163@sina.com